how to create an exposure chart an exposure chart notes.pdf · how to create an exposure chart...
TRANSCRIPT

1
How to create an exposure chart
Julie Sales DCR
University of Cambridge
The Queen’s Veterinary School Hospital
CONSTRUCTING AN EXPOSURE CHART
• Good radiographs are essential for making accurate diagnoses
• Many factors affect the quality of the radiograph
• X-ray machine specifications and settings
• Darkroom environment and processing
• Choice of film, screen and cassettes
• Use and properties of grids
CONSTRUCTING AN EXPOSURE CHART
• In compiling an exposure chart, these variables need to be standardized in order to provide dependable guidelines for selecting appropriate exposure settings (kV and mAs) for a radiographic study
SYSTEMATIC EVALUATION
• Image blackening
• Peripheral blackening
• Visibility of gross image detail and contrast
• These will allow us to develop an exposure chart as well as determining the source of a problem and the necessary exposure setting changes required for radiographs that are sub-optimal
STANDARDIZED TECHNIQUE IS VITAL
• Exposure chart failure might be due to controllable factors which have not been standardized and may influence radiographic quality
• These include:
• Dark room technique
• X-ray unit malfunction
• Incorrect measurement of an anatomic part
• Not compensating mAs when changing film-screen combinations
• Inserting or removing a grid
• Altering the focal-film distance
STANDARDIZED TECHNIQUE IS VITAL
• Once these have been standardized, any poor quality radiograph is due to an exposure error with excess or inadequate kV and/or mAs
• Quality or penetrating power is determined by kV (p.d. between the cathode and anode)
• The thicker the body tissues or the greater physical density and atomic number, the higher the kV that has to be used
• The quantity or number of x-rays produced during an exposure is controlled primarily by the mAs

2
IMAGE BLACKENING
• Film blackening results from x-ray photons and light from the intensifying screens sensitizing the silver bromide crystals in the film emulsion to form a latent image
• During development, the latent image is converted to metallic silver resulting in film blackness
• Areas of the radiograph that are very light with minimal silver deposits are underexposed (provided there is no underdevelopment)
IMAGE BLACKENING
• The more x-ray or light photons that reach the film, the blacker the radiograph
• If the radiograph is too dark, it is overexposed (providing no overdevelopment)
• Increasing the number of x-rays results in increasing blackness
• Thus film blackness is primarily controlled by mAs
• 30 – 40% increase or decrease in mAs is required to result in a visible change in film blackness
FILM BLACKENING
• Film blackening may be divided into peripheral blackening and image blackening
• Image blackening results from radiation passing through the subject
• Peripheral blackening results from primary rays not interacting with the patient and scatter radiation
• This will be the original number of photons produced for the exposure and image blackening will always be less than peripheral blackening
IMAGE BLACKENING
Overexposure
Underexposure
IMAGE BLACKENING
• Evaluation of the peripheral blackening and image blackening and the presence of contrast in the radiographic image form the basis of determining radiographic quality
• Contrast is the difference between 2 adjacent opacities on a radiograph
REQUIREMENTS FOR CREATING AN EXPOSURE CHART
• Automatic processor or freshly mixed darkroom chemicals at correct temperature for manual processing
• X-ray cassettes
• Intensifying screens/film with spectral emission and sensitivities correctly matched
• Measuring device
• Grid (which ever you use as standard)
• Sedated dog measuring 14-15 cm at the level of 12th rib in lateral recumbency

3
MEASURING THE PATIENT
Measuring calipers
TECHNIQUE FOR CREATING AN EXPOSURE CHART
• Take three test exposures of the abdomen of a medium sized dog
• Measure dog at the level of 12th rib, round up to the next whole number
• Use mAs in the region of 10-20 mAs, because a grid is going to be used
• If setting mA, select a high value and adjust time to meet the mAs value
SANTE’S RULE TO DETERMINE kV
• Measured thickness in cm x 2 + 40 = initial kV
• If dog is 14cm at the 12th rib, initial kV
• 14 x 2 + 40 = 68 (1st exposure)
• Two additional exposures
• One using 50% more mAs
• One using 50% less mAs
• Process all three images simultaneously
EVALUATION
• Examine films to determine which is the optimal image of the abdomen
• If none of the films is optimal, you will need to decide whether the films are overexposed (too dark) or underexposed (too light)
EVALUATION
Underexposure Overexposure
UNDEREXPOSURE
• To correct for underexposure, add 10kV to the original kV setting or double the mAs
• Use these new values to make the first of another 3 test exposures
• Evaluate again in the way described

4
OVEREXPOSURE
• If first films are overexposed, reduce kV by 10kV or halve mAs
• Use these new values to create another 3 test exposures
• One with 50% more mAs
• One with 50% less mAs
ASSESSMENT
• You may have to repeat the process to obtain an optimal exposure, but persevere until you produce one good image of the abdomen
• Record thickness at 12th rib and record mAs and kV in a table
EXPOSURE CHART
Thickness (cm) Thorax Abdomen Spine kV mAs kV mAs kV mAs
14 cm 70 16
MODIFY FOR THE SPINE
• Lower kV than for the abdomen
• Select 10 kV less than the one for the optimal abdominal radiograph
• To compensate , double mAs used for abdominal radiograph
• Use this as the fist of 3 trial exposures for the vertebral column
• Take 2 more , one +50% mAs and one -50% mAs
MODIFY FOR THORAX
• High kV technique best
• Set 10 kV more than successful abdomen
• To compensate for over exposure set an mAs value half of the optimal original (i.e. 8 mAs in this example)
• Take 2 additional exposures, one +50% mAs and one -50%
• Record successful exposures in chart
EXPOSURE CHART
Thickness (cm) Thorax Abdomen Spine kV mAs kV mAs kV mAs
14 cm 80 4 70 16 60 32
5
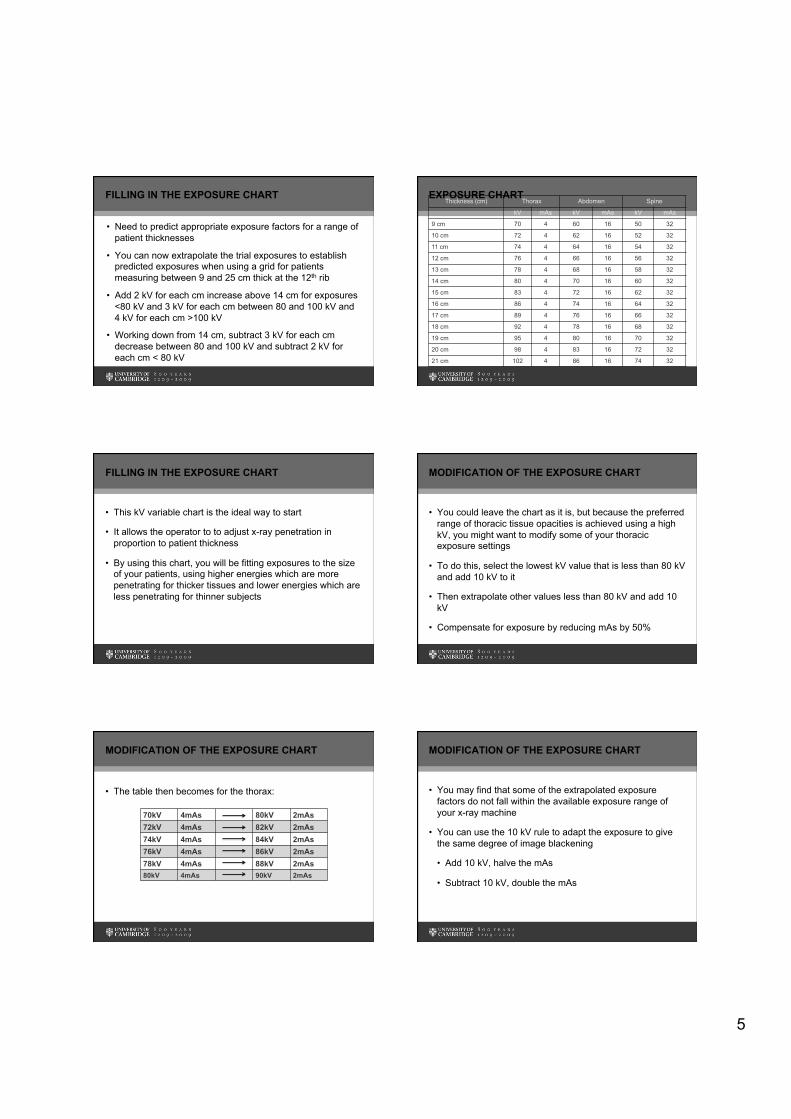
FILLING IN THE EXPOSURE CHART
• Need to predict appropriate exposure factors for a range of patient thicknesses
• You can now extrapolate the trial exposures to establish predicted exposures when using a grid for patients measuring between 9 and 25 cm thick at the 12th rib
• Add 2 kV for each cm increase above 14 cm for exposures <80 kV and 3 kV for each cm between 80 and 100 kV and 4 kV for each cm >100 kV
• Working down from 14 cm, subtract 3 kV for each cm decrease between 80 and 100 kV and subtract 2 kV for each cm < 80 kV
EXPOSURE CHART Thickness (cm) Thorax Abdomen Spine
kV mAs kV mAs kV mAs
9 cm 70 4 60 16 50 32
10 cm 72 4 62 16 52 32
11 cm 74 4 64 16 54 32
12 cm 76 4 66 16 56 32
13 cm 78 4 68 16 58 32
14 cm 80 4 70 16 60 32
15 cm 83 4 72 16 62 32
16 cm 86 4 74 16 64 32
17 cm 89 4 76 16 66 32
18 cm 92 4 78 16 68 32
19 cm 95 4 80 16 70 32
20 cm 98 4 83 16 72 32
21 cm 102 4 86 16 74 32
FILLING IN THE EXPOSURE CHART
• This kV variable chart is the ideal way to start
• It allows the operator to to adjust x-ray penetration in proportion to patient thickness
• By using this chart, you will be fitting exposures to the size of your patients, using higher energies which are more penetrating for thicker tissues and lower energies which are less penetrating for thinner subjects
MODIFICATION OF THE EXPOSURE CHART
• You could leave the chart as it is, but because the preferred range of thoracic tissue opacities is achieved using a high kV, you might want to modify some of your thoracic exposure settings
• To do this, select the lowest kV value that is less than 80 kV and add 10 kV to it
• Then extrapolate other values less than 80 kV and add 10 kV
• Compensate for exposure by reducing mAs by 50%
MODIFICATION OF THE EXPOSURE CHART
• The table then becomes for the thorax:
70kV 4mAs 80kV 2mAs 72kV 4mAs 82kV 2mAs 74kV 4mAs 84kV 2mAs 76kV 4mAs 86kV 2mAs 78kV 4mAs 88kV 2mAs 80kV 4mAs 90kV 2mAs
MODIFICATION OF THE EXPOSURE CHART
• You may find that some of the extrapolated exposure factors do not fall within the available exposure range of your x-ray machine
• You can use the 10 kV rule to adapt the exposure to give the same degree of image blackening
• Add 10 kV, halve the mAs
• Subtract 10 kV, double the mAs

6
MODIFICATION OF THE EXPOSURE CHART
• If some exposure times are very long and you are already using the highest mA setting, you could shorten the exposure times by using a faster film-screen combination, using a lower grid ratio or by reducing the focal-film distance
• But remember these will adversely affect the quality of your radiographs
• The best way to avoid long exposure times is to purchase a machine with higher mA output
MODIFICATION OF THE EXPOSURE CHART
• Detail radiographs can be made using almost any x-ray machine regardless of its output
• This technique relies on the image receptor being able to produce images with increased detail
• Intensifying screens for detail radiography are generally slow systems
• This type of radiography does not use a grid because of the small thickness involved (little scattered radiation) but a higher mAs needs to be used because of the slower speed
MODIFICATION OF THE EXPOSURE CHART
• To make an kV exposure chart for detail radiography, select a cat or dog extremity or cat thorax.
• Then find an animal on which the depth of the structure measures 5cm and follow the instructions for the spine, leaving out the grid. Calculate exposure factors between 2 cm and 9 cm, select 5 – 10 mAs and 48 – 55 kV as the initial settings for the first exposure
MODIFICATION OF THE EXPOSURE CHART
• Increasing or reducing kV in certain situations
Very thin / poor body condition Reduce kV by 10% Grid removed Reduce kV by 10% Barium study Increase kV by 10% Pleural effusion Increase kV by 10% Ascites Increase kV by 10% Obesity Increase kV by 10% Plaster casts Increase kV by 10%
MONITORING THE EXPOSURE CHART
• Always check quality of processed films
• Document under / over exposure
• Modify chart if consistent exposure problems occur
• Acts as a quality assurance programme
• If chart proves unreliable, it is most likely that all the factors involved in the imaging process have not been standardized
REASONS FOR FAILURE
Processing Chart Equipment Human error Other
Old chemistry Failure to extrapolate
Mis-matching of film-screen combination
Inconsistent measuring method
Film fogging
Incorrect processing temp
Inappropriate selection of test exposures
Failing exposure timer
Faulty safelight / light intrusion
Altered processing time
Variation in mains voltage
Poor storage of film
Darkroom fogging
Tube reaching end of its life