how the petrodollar quietly died, and nobody...
TRANSCRIPT
How The Petrodollar Quietly Died, And Nobody NoticedSubmitted byTyler Durden on 11/03/2014 23:42 -0500
BATS Bond Borrowing
Costs Brazil Budget
Deficit Capital
Markets Central
Banks China Crude Goldman
Sachs goldman
sachs Iran Iraq Kazakhstan Kuwait LatAm Mexico Middle
East Monetary
Policy NASDAQ None OPEC ratings Renminbi Reserve
Currency Reuters Saudi
Arabia Sigma X Sigma X
Two years ago, in hushed tones at first, then ever louder, the financial world began discussing thatwhich shall never be discussed in polite company - the end of the system that according to manyhas framed and facilitated the US Dollar's reserve currency status: the Petrodollar, or the world inwhich oil export countries would recycle the dollars they received in exchange for their oil exports,by purchasing more USD-denominated assets, boosting the financial strength of the reservecurrency, leading to even higher asset prices and even more USD-denominated purchases, and soforth, in a virtuous (especially if one held US-denominated assets and printed US currency) loop.
The main thrust for this shift away from the USD, if primarily in the non-mainstream media, wasthat with Russia and China, as well as the rest of the BRIC nations, increasingly seeking to distancethemselves from the US-led, "developed world" status quo spearheaded by the IMF, global tradewould increasingly take place through bilateral arrangements which bypass the (Petro)dollarentirely. And sure enough, this has certainly been taking place, as first Russia and China, togetherwith Iran, and ever more developing nations, have transacted among each other, bypassing theUSD entirely, instead engaging in bilateral trade arrangements, leading to, among other thing, suchdiscussions as, in today's FT, why China's Renminbi offshore market has gone from nothing tobillions in a short space of time.
And yet, few would have believed that the Petrodollar did indeed quietly die, although ironically,without much input from either Russia or China, and paradoxically, mostly as a result of the actionsof none other than the Fed itself, with its strong dollar policy, and to a lesser extent Saudi Arabiatoo, which by glutting the world with crude, first intended to crush Putin, and subsequently, to takeout the US crude cost-curve, may have Plaxico'ed both itself, and its closest Petrodollar tradingpartner, the US of A.
As Reuters reports, for the first time in almost two decades, energy-exporting countries areset to pull their "petrodollars" out of world markets this year, citing a study by BNP Paribas(more details below). Basically, the Petrodollar, long serving as the US leverage to encourage andfacilitate USD recycling, and a steady reinvestment in US-denominated assets by the Oil exportingnations, and thus a means to steadily increase the nominal price of all USD-priced assets, justdrove itself into irrelevance.
A consequence of this year's dramatic drop in oil prices, the shift is likely to cause global marketliquidity to fall, the study showed.
Share 74
This decline follows years of windfalls for oil exporters such as Russia, Angola, Saudi Arabia andNigeria.Much of that money found its way into financial markets, helping to boost asset pricesand keep the cost of borrowing down, through so-called petrodollar recycling.
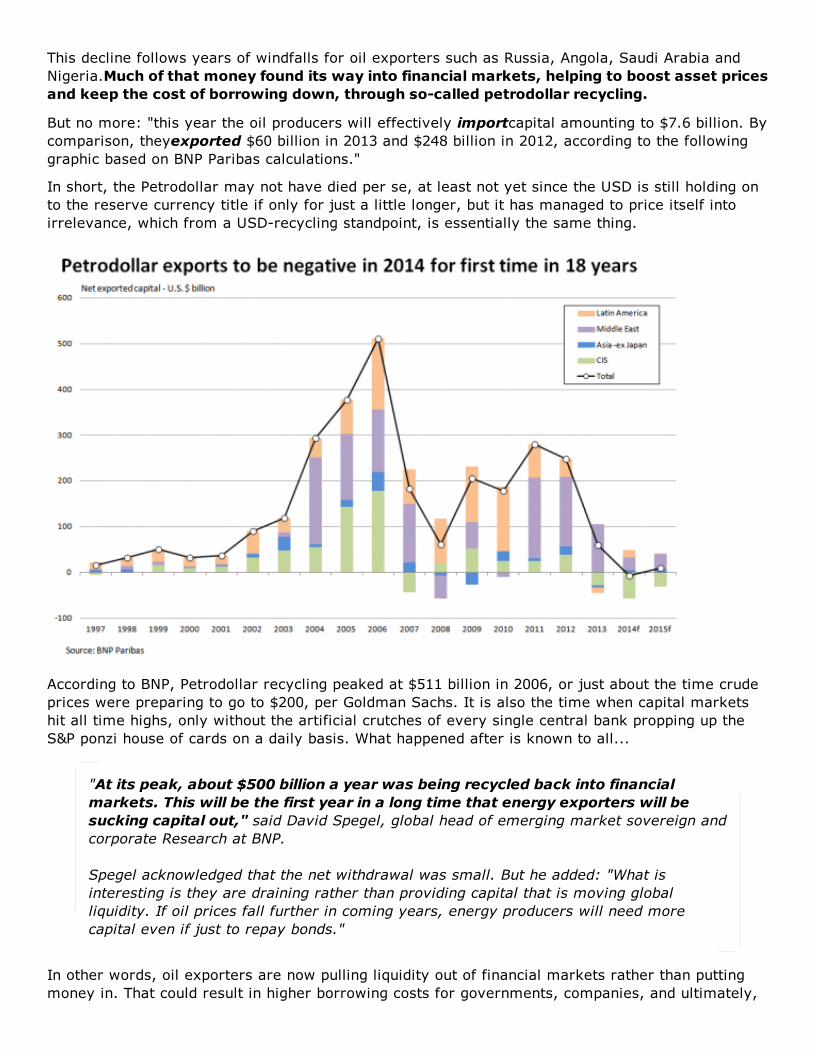
But no more: "this year the oil producers will effectively importcapital amounting to $7.6 billion. Bycomparison, theyexported $60 billion in 2013 and $248 billion in 2012, according to the followinggraphic based on BNP Paribas calculations."
In short, the Petrodollar may not have died per se, at least not yet since the USD is still holding onto the reserve currency title if only for just a little longer, but it has managed to price itself intoirrelevance, which from a USD-recycling standpoint, is essentially the same thing.
According to BNP, Petrodollar recycling peaked at $511 billion in 2006, or just about the time crudeprices were preparing to go to $200, per Goldman Sachs. It is also the time when capital marketshit all time highs, only without the artificial crutches of every single central bank propping up theS&P ponzi house of cards on a daily basis. What happened after is known to all...
In other words, oil exporters are now pulling liquidity out of financial markets rather than puttingmoney in. That could result in higher borrowing costs for governments, companies, and ultimately,
"At its peak, about $500 billion a year was being recycled back into financialmarkets. This will be the first year in a long time that energy exporters will besucking capital out," said David Spegel, global head of emerging market sovereign andcorporate Research at BNP. Spegel acknowledged that the net withdrawal was small. But he added: "What isinteresting is they are draining rather than providing capital that is moving globalliquidity. If oil prices fall further in coming years, energy producers will need morecapital even if just to repay bonds."

consumers as money becomes scarcer.
Which is hardly great news: because in a world in which central banks are actively soaking up high-quality collateral, at a pace that is unprecedented in history, and led to the world's allegedly mostliquid bond market to suffer a 10-sigma move on October 15, the last thing the market needs iseven less liquidity, and even sharper moves on ever less volume, until finally the next big sell ordercrushes the entire market or at least force the [NYSE|Nasdaq|BATS|Sigma X] to shut downindefinitely until further notice.
So what happens next, now that the primary USD-recycling mechanism of the past 2 decades is nolonger applicable? Well, nothing good.
Here are the highlights of David Spegel's noteEnergy price shock scenarios: Impact on EM ratings,funding gaps, debt, inflation and fiscal risks.
Whatever the reason, whether a function of supply, demand or political risks, oil prices plummetedin Q3 2014 and remain volatile. Theories related to the price plunge vary widely: some argue it isan additional means for Western allies in the Middle East to punish Russia. Others state it is theresult of a price war between Opec and new shale oil producers. In the end, it may just reflect thetraditional inverted relationship between the international value of the dollar and the price of hard-currency-based commodities (Figure 6). In any event, the impact of the energy price drop will bewide-ranging (if sustained) and will have implications for debt service costs, inflation, fiscalaccounts and GDP growth.
Have you noticed a reduction of financial markets liquidity?
Outside from the domestic economic impact within EMs due to the downward oil price shock,we believe that the implications for financial market liquidity via the reduced recycling ofpetrodollars should not be underestimated.Because energy exporters do not fully invest theirexport receipts and effectively ‘save’ a considerable portion of their income, these surplus fundsfind their way back into bank deposits (fuelling the loan market) as well as into financial marketsand other assets. This capital has helped fund debt among importers, helping to boost overallgrowth as well as other financial markets liquidity conditions.
Last year, capital flows from energy exporting countries (see list in Figure 12) amounted toUSD812bn (Figure 3), with USD109bn taking the form of financial portfolio capital and USD177bn inthe form of direct equity investment and USD527bn of other capital over half of which weestimate made its way into bank deposits (ie and therefore mostly into loan markets).
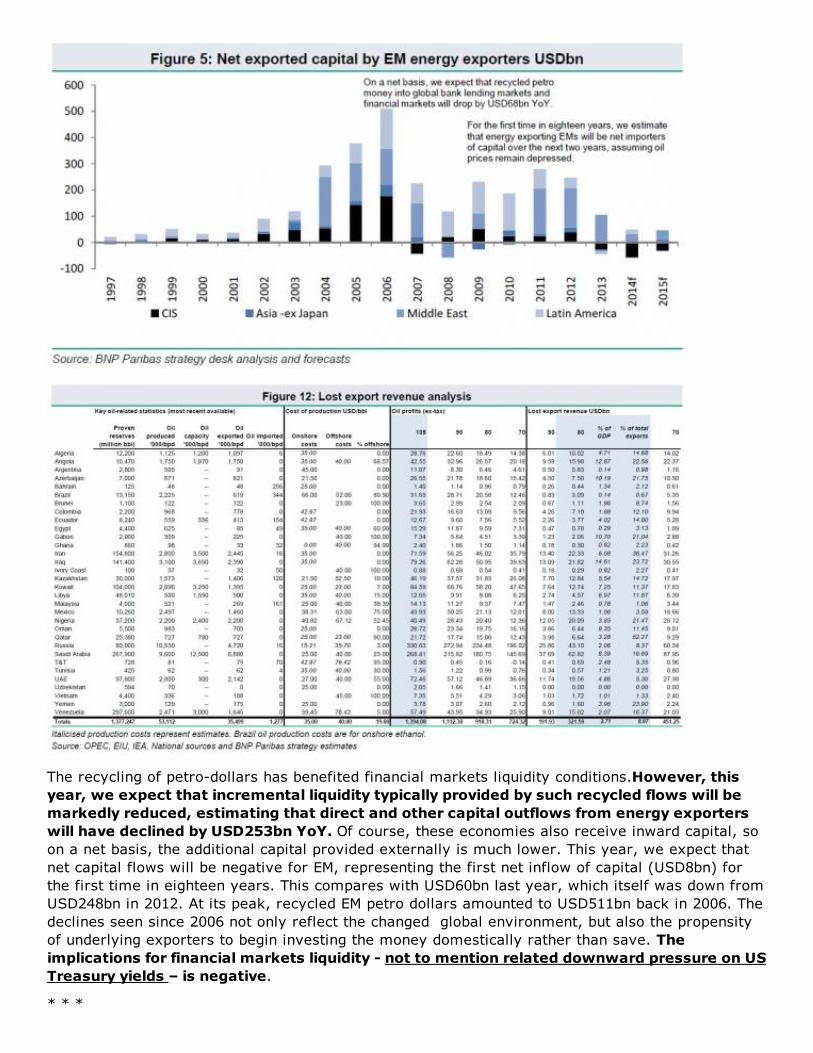
The recycling of petro-dollars has benefited financial markets liquidity conditions.However, thisyear, we expect that incremental liquidity typically provided by such recycled flows will bemarkedly reduced, estimating that direct and other capital outflows from energy exporterswill have declined by USD253bn YoY. Of course, these economies also receive inward capital, soon a net basis, the additional capital provided externally is much lower. This year, we expect thatnet capital flows will be negative for EM, representing the first net inflow of capital (USD8bn) forthe first time in eighteen years. This compares with USD60bn last year, which itself was down fromUSD248bn in 2012. At its peak, recycled EM petro dollars amounted to USD511bn back in 2006. Thedeclines seen since 2006 not only reflect the changed global environment, but also the propensityof underlying exporters to begin investing the money domestically rather than save. Theimplications for financial markets liquidity - not to mention related downward pressure on USTreasury yields – is negative.
* * *

Even scarcer liquidity in US Capital markets aside, this is how BNP sees the inflation and growth forenergy exporters:
Household consumption benefits: While we recognise that the relationship is not entirely linear,we use inflation basket weights for ‘transportation’ and ‘household & utilities’ (shown in the‘Economic components’ section of Figure 27) as a means to address the differing demand elasticitiesprevalent across countries. These act as our proxy for consumption the consumption basket in orderto determine the economic benefit that would result as lower energy prices improve householddisposable income. This is weighted by the level of domestic consumption relative to the economy,which we also show in the ‘Economic components’ section of Figure 27.
Reduced industrial production costs:Outside the energy industry, manufacturers will benefit fromfalling operating costs. Agriculture will not benefit as much and services will benefit even less.
Trade gains and losses: Lost trade as a result of lower demand from oil-producing trade partnerswill impact both growth and the current account balance. On the other hand, better consumptionfrom many energy-importing trade partners will provide some offset. The percentage of eachcountry’s exports to energy producing partners represents relative to its total exports is used todetermine potential lost growth and CAR due to lower demand from trade partners.
Domestic FX moves are beyond the scope of our analysis. These will be tied to the level ofopenness of the economy and the impact of changed demand conditions among trade partners aswell as dollar effects. Neither do we address non-oil related political risks (eg sanctions) or anyfiscal or monetary policy responses to oil shocks.
GDP growth
The least impacted oil producing country, from a GDP perspective, is Brazil followed by Mexico,Argentina, Tunisia and Trinidad & Tobago. The impact on fiscal accounts also appears lower forthese than most other EMs.
Remarkably, the impact of lower oil for Russia’s economic growth is not as severe as might beexpected. Sustained oil at USD80/bbl would see growth slow by 1.8pp to 0.6%. This compares withthe worst hit economies of Angola (where growth is nearly 8pp lower at -2%), Iraq (GDP slows to-1.6% from 4.5% growth), Kazakhstan and Azerbaijan (growth falls to -0.9% from 5.8%).
For a drop to USD 80/bbl, it can be seen (in Figure 27) that, in some cases, such as the UAE, Qatarand Kuwait, the negative impact on GDP can be comfortably offset by fiscal stimulus. Theseeconomies will probably benefit from such a policy in which case our ‘model-based’ GDP growthestimate would represent the low end of the likely outcome (unless a fiscal policy response is notforthcoming).
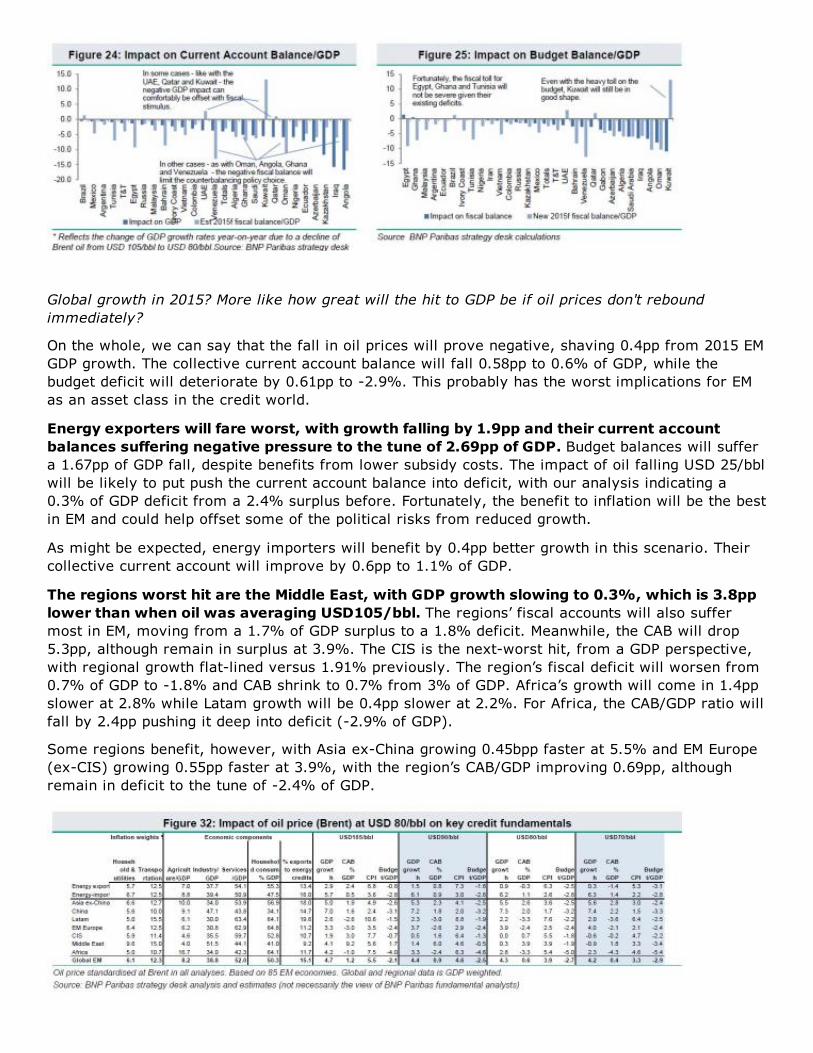
Global growth in 2015? More like how great will the hit to GDP be if oil prices don't reboundimmediately?
On the whole, we can say that the fall in oil prices will prove negative, shaving 0.4pp from 2015 EMGDP growth. The collective current account balance will fall 0.58pp to 0.6% of GDP, while thebudget deficit will deteriorate by 0.61pp to -2.9%. This probably has the worst implications for EMas an asset class in the credit world.
Energy exporters will fare worst, with growth falling by 1.9pp and their current accountbalances suffering negative pressure to the tune of 2.69pp of GDP. Budget balances will suffera 1.67pp of GDP fall, despite benefits from lower subsidy costs. The impact of oil falling USD 25/bblwill be likely to put push the current account balance into deficit, with our analysis indicating a0.3% of GDP deficit from a 2.4% surplus before. Fortunately, the benefit to inflation will be the bestin EM and could help offset some of the political risks from reduced growth.
As might be expected, energy importers will benefit by 0.4pp better growth in this scenario. Theircollective current account will improve by 0.6pp to 1.1% of GDP.
The regions worst hit are the Middle East, with GDP growth slowing to 0.3%, which is 3.8pplower than when oil was averaging USD105/bbl. The regions’ fiscal accounts will also suffermost in EM, moving from a 1.7% of GDP surplus to a 1.8% deficit. Meanwhile, the CAB will drop5.3pp, although remain in surplus at 3.9%. The CIS is the next-worst hit, from a GDP perspective,with regional growth flat-lined versus 1.91% previously. The region’s fiscal deficit will worsen from0.7% of GDP to -1.8% and CAB shrink to 0.7% from 3% of GDP. Africa’s growth will come in 1.4ppslower at 2.8% while Latam growth will be 0.4pp slower at 2.2%. For Africa, the CAB/GDP ratio willfall by 2.4pp pushing it deep into deficit (-2.9% of GDP).
Some regions benefit, however, with Asia ex-China growing 0.45bpp faster at 5.5% and EM Europe(ex-CIS) growing 0.55pp faster at 3.9%, with the region’s CAB/GDP improving 0.69pp, althoughremain in deficit to the tune of -2.4% of GDP.
* * *
And so on, but to summarize, here are the key points once more:
The stronger US dollar is having an inverse impact on dollar-denominated commodity prices,including oil. This will affect emerging market (EM) credit quality in various ways.The implications of reduced recycled petrodollars has significant ramifications forfinancial markets, loan markets and Treasury yields. In fact, EM energy exporters willpost their first net drain on global capital (USD8bn) in eighteen years.Oil and gas exporting EMs account for 26% of total EM GDP and 21% of externalbonds. For these economies, the impact will be on lost fiscal revenue, lost GDP growth andthe contribution to reserves of oil and gas-related export receipts.Together, these will havea significant effect on sustainability and liquidity ratios and as a consequence arenegative for dollar debt-servicing risks and credit ratings.
Average:Your rating: NoneAverage: 4.7 (42 votes)