currencywars: thelackofaglobalmonetarysystem. · currencywars: thelackofaglobalmonetarysystem. by...
TRANSCRIPT

Currency Wars: The Lack of a Global Monetary System.By
Guillermo Valencia Arana
A Thesis Submitted
in Partial Fulfillment of the
Requirements for the Degree of
Master in Management, Technology, and Economics
Supervisor:Prof. Dr. Didier SornetteTutors:Dr. Peter Cauwels
Zürich, November 2014

AbstractThe meaning of a currency war and its consequences is a topic of hot speculation at
every trading desk around the world. This master thesis studies the different currencywars in the twentieth century to propose, infer and test a game theoretical framework,to forecast potential scenarios in the current currency war. The philosophy of thisstudy is not to predict who will be the winners of a currency war, but to understandthe rules of the “game”.

Acknowledgments
I would like to thank Professor Dr. Didier Sornette and Dr. Peter Cauwelsfrom the Chair of Entrepreneurial Risks and the Financial Crisis Observatory at theSwiss Federal Institute of Technology in Zürich (ETH), who kindly supervised methroughout the development of this thesis and my personal quest to try to understandthe business cycle. Throughout this research, I received the help and support ofmany people: Louis Vincent Gave and the GaveKal research team in Hong Kong fortheir feedback and their generous support to do part of my research about currencywars in Hong Kong. I also want to thank Professor Dr Joseph Yam ex-head ofthe Hong Kong Central Monetary Authority for his interest in the project and hisviews about the future of the role of the Chinese Renmimbi in the global monetarysystem. To Felipe Gómez Bridge Managing Director at Black River Investments forhis constant feedback and emerging markets focus. Dr. George Cooper, writer ofthe best seller Money, Blood and Revolutions and porfolio manager in Blue Crestfor his very valuable advices and inspiration. Claire Dissaux Managing Director atMillennium Investments in London for her pragmatic focus. Professor Dr. RyanMurphy at the Chair of Behavioral Game Theory in ETH for the many valuableconversations about different game theory frameworks. James Rickards writer of thebest seller Currency Wars and fund manager. Lars Tevde writer and angel investor forthe ideas connecting the business cycle and the currency wars. Finally, to my friendsDiego Ardila, Cédric Fulleman, Dr.Mario Rojas, Dr.María Alejandra Pimentel, JuanPablo Marín, Schmuel Stokvis, Soh Wee Chean for their very valuable revisions.

Contents
List of Figures iii
List of Tables iv
1 Theoretical review 81.1 Game theory . . . . . . . . . . . . . . . . . . . . . . . . . . . . . . . . . . . . . . 8
1.1.1 Game-changing strategies . . . . . . . . . . . . . . . . . . . . . . . . . . . 91.1.2 The class of 2X2 games . . . . . . . . . . . . . . . . . . . . . . . . . . . . 111.1.3 The inducement correspondence . . . . . . . . . . . . . . . . . . . . . . . 111.1.4 Indexing the games: patterns and layers. . . . . . . . . . . . . . . . . . . . 131.1.5 Topology of the 2X2 games . . . . . . . . . . . . . . . . . . . . . . . . . . 141.1.6 Adjoint payoff neighbors: . . . . . . . . . . . . . . . . . . . . . . . . . . . 151.1.7 Bruns periodic table . . . . . . . . . . . . . . . . . . . . . . . . . . . . . . 171.1.8 Navigating 2X2 games. . . . . . . . . . . . . . . . . . . . . . . . . . . . . 21
1.2 Macroeconomics of a currency war . . . . . . . . . . . . . . . . . . . . . . . . . . 231.3 “Beggar-thy- neighbor” . . . . . . . . . . . . . . . . . . . . . . . . . . . . . . . . 241.4 “Enrich-thy-neighbor” . . . . . . . . . . . . . . . . . . . . . . . . . . . . . . . . . 25
2 The framework 262.1 Currency war game theory framework . . . . . . . . . . . . . . . . . . . . . . . . 26
3 Currency War I: From the Gold Standard to the Bretton Woods. (1907-1945) 313.1 Games’ sequences Currency War I part I . . . . . . . . . . . . . . . . . . . . . . 353.2 Game sequence CW I part II . . . . . . . . . . . . . . . . . . . . . . . . . . . . . 41
3.2.1 Payoffs’ sequence Currency War I part II . . . . . . . . . . . . . . . . . . 45
4 Currency war II: From the Bretton Woods to the Petrodollar (1971-1992) 474.1 Historical review . . . . . . . . . . . . . . . . . . . . . . . . . . . . . . . . . . . . 474.2 Games’ sequences Currency War II . . . . . . . . . . . . . . . . . . . . . . . . . . 53
5 Currency War III : From the petro-dollars to a multipolar international sys-tem 625.1 Historical Overview . . . . . . . . . . . . . . . . . . . . . . . . . . . . . . . . . . . 625.2 Games’ sequences: two foreseeable scenarios. . . . . . . . . . . . . . . . . . . . . 65
i

6 Conclusions and future work 766.1 Summary and limitations. . . . . . . . . . . . . . . . . . . . . . . . . . . . . . . . 766.2 Future work . . . . . . . . . . . . . . . . . . . . . . . . . . . . . . . . . . . . . . . 78
6.2.1 Currency war and switching regimens models . . . . . . . . . . . . . . . . 786.2.2 Institutional transformation and the business cycle . . . . . . . . . . . . . 80
ii

List of Figures
1.1 Golden’s ball show and game-chaging strategies. . . . . . . . . . . . . . . . . . . 101.2 Bimatrix and order graph representation for the Prisoner’s Dilemma . . . . . . . 111.3 Juxtaposition between the strategy space and payoff space. . . . . . . . . . . . . 121.4 Payoff patterns and Indexing 2X2 games. Source: Robison & Goforth . . . . . . 141.5 Tiles torus, layers. Source: Robison & Goforth . . . . . . . . . . . . . . . . . . . 151.6 Layers 2X2 games . . . . . . . . . . . . . . . . . . . . . . . . . . . . . . . . . . . 161.7 Adjacent Neighbors. . . . . . . . . . . . . . . . . . . . . . . . . . . . . . . . . . . 171.8 Game’s periodic table . . . . . . . . . . . . . . . . . . . . . . . . . . . . . . . . . 201.9 Game families. . . . . . . . . . . . . . . . . . . . . . . . . . . . . . . . . . . . . . 211.10 The most important 2X2 games by family . . . . . . . . . . . . . . . . . . . . . . 211.12 Main neighborhoods in a currency war . . . . . . . . . . . . . . . . . . . . . . . . 221.11 Transformation to the Chicken game into the called bluff game . . . . . . . . . . 221.13 Transforming the Prisoner’s dilemma into the critical or win-win family. . . . . . 231.14 Core games in a Currency War . . . . . . . . . . . . . . . . . . . . . . . . . . . . 24
2.1 Game-changing strategies in a currency war. . . . . . . . . . . . . . . . . . . . . 262.2 Currency wars block diagram and chess. . . . . . . . . . . . . . . . . . . . . . . . 29
3.1 Geopolitical powers currency war I. . . . . . . . . . . . . . . . . . . . . . . . . . . 323.2 Some macro indicators in CW I . . . . . . . . . . . . . . . . . . . . . . . . . . . . 333.3 CW I part I. . . . . . . . . . . . . . . . . . . . . . . . . . . . . . . . . . . . . . . 373.4 CW I part I. . . . . . . . . . . . . . . . . . . . . . . . . . . . . . . . . . . . . . . 383.5 CW I part I games’ sequence payoff. . . . . . . . . . . . . . . . . . . . . . . . . . 403.6 Total payoffs CW I part I by geopolitical power. . . . . . . . . . . . . . . . . . . 403.7 CW I Part II . . . . . . . . . . . . . . . . . . . . . . . . . . . . . . . . . . . . . . 423.8 CW II Part II . . . . . . . . . . . . . . . . . . . . . . . . . . . . . . . . . . . . . 443.9 CW I Part II payoffs. . . . . . . . . . . . . . . . . . . . . . . . . . . . . . . . . . 453.10 Total payoffs CW I part II by geopolitical powe . . . . . . . . . . . . . . . . . . . 45
4.1 Geopolitical powers currency war II . . . . . . . . . . . . . . . . . . . . . . . . . 484.2 Inflation in the developed countries during currency war II. Source: ECB . . . . 504.3 Currency War II games’ sequence . . . . . . . . . . . . . . . . . . . . . . . . . . . 574.4 Currency War II games’sequence . . . . . . . . . . . . . . . . . . . . . . . . . . . 584.5 Currency War II Japan, China, USSR. . . . . . . . . . . . . . . . . . . . . . . . . 594.6 Currency War II game sequence payoffs. . . . . . . . . . . . . . . . . . . . . . . . 604.7 CW II total payoffs by geopolitical power. . . . . . . . . . . . . . . . . . . . . . . 61
5.1 Main geopolitical actors currency war III . . . . . . . . . . . . . . . . . . . . . . 635.2 Currency War III . . . . . . . . . . . . . . . . . . . . . . . . . . . . . . . . . . . . 63
iii

5.3 Incentives geopolitical power in CW III . . . . . . . . . . . . . . . . . . . . . . . 655.4 What every country trades in CW III . . . . . . . . . . . . . . . . . . . . . . . . 665.5 CW III games’ sequence. . . . . . . . . . . . . . . . . . . . . . . . . . . . . . . . . 685.6 Currency War III games’ sequence. . . . . . . . . . . . . . . . . . . . . . . . . . . 695.7 CW III games’ sequence . . . . . . . . . . . . . . . . . . . . . . . . . . . . . . . . 705.8 CW III games’ sequence. . . . . . . . . . . . . . . . . . . . . . . . . . . . . . . . . 715.9 CW III games’ sequence payoffs. . . . . . . . . . . . . . . . . . . . . . . . . . . . 725.10 CW III Games’ sequences payoffs. . . . . . . . . . . . . . . . . . . . . . . . . . . 735.11 Currency War III total payoffs by geopolitical power. . . . . . . . . . . . . . . . . 74
6.1 Phases of a currency war and US equity and commodities regimens. . . . . . . . 786.2 Currency Wars and Banking Crisis around the globe . . . . . . . . . . . . . . . . 796.3 Currency wars and regimnes in S&P, Coal, Oil, Gold, Silver and S&P Volatility. 816.4 The governance plane. . . . . . . . . . . . . . . . . . . . . . . . . . . . . . . . . . 826.5 Governance plane: currency war III . . . . . . . . . . . . . . . . . . . . . . . . . . 83
iv

List of Tables
1.1 Golden balls games . . . . . . . . . . . . . . . . . . . . . . . . . . . . . . . . . . . 101.2 Game Indexing . . . . . . . . . . . . . . . . . . . . . . . . . . . . . . . . . . . . . 13
2.1 The mapping permutations into game-changing strategies. Analogical comparisonto chess. . . . . . . . . . . . . . . . . . . . . . . . . . . . . . . . . . . . . . . . . . 30
3.1 CW I main historical attributes . . . . . . . . . . . . . . . . . . . . . . . . . . . 35
4.1 Summary Currency War II . . . . . . . . . . . . . . . . . . . . . . . . . . . . . . 53
5.1 Summary Currency War III. . . . . . . . . . . . . . . . . . . . . . . . . . . . . . . 65
1

Introduction
What if you begin your day paying twice the amount for fuel as you usually pay? What if onthe same day you notice that your pension savings are gone? What if in a different scenarioyour investment portfolio in equity is skyrocketing, while the prices of natural resources arecollapsing? In both cases, you learn about revolutions or wars in the world. How can thesescenarios be related?
Even if a currency war seems to be only a matter of -exporters, central banks, asset managersor hedge funds-, it is also relevant for every single citizen in the world. It can affect the Americanfamily when the price of fuel is high. It hurts the security of the people in the Middle East,Ukraine or Venezuela when energy prices go down. It affects the confidence of Europeans in theirown currency when their economic asymmetries are more important than Russian geopoliticalescalations. It is troublesome for the Japanese taxpayer, when a triple digit debt over grossdomestic product, along with fossil energy dependency1,could trigger doubts about the JapaneseYen reserve status.
Furthermore, a global currency war also undermines the Chinese people’s savings becausetheir trade surplus is in a reserve currency backed by countries with high indebtedness andunemployment rates; US, Eurozone and Japan2.
The conflict of economic interests in a currency war also affects geopolitics, therefore thepeace and security of everybody in the world. This is the case when geopolitical powers preferwar and military escalations as a way to gain a competitive advantage, rather than coordinatedstructural reforms able to foster technological spillovers.
There are two contradictory theoretical approaches explaining a currency war. The firstfocuses on competitive currency devaluations with the aim of boosting exports. This view iscentered on the competition for global trade dominance in a zero sum game. The second is aboutcentral banks’ monetary coordination spillovers. That means, every developed country is betteroff by adding liquidity into the system simultaneously after a global economic crisis. Stimulus inconsumption and investments are necessary until the emergence of a new technological revolutionable to sustain coordinated global growth.
These two strategic situations resemble two dilemmas widely studied in game theory. They areknown as the prisoner’s dilemma (loss-loss situation) and the Rousseau Stag Hunt dilemma (win-win coordination problem). I assume these views are the beginning and the end of a currencywar. In fact, I define the beginning of a currency war with the collapse of an internationalmonetary standard caused by a global economic crisis (loss-loss scenario). I define the ending
1Since the Fukushima tragedy in 2011 Japan is running a trade deficit. The shutdown of nuclear plants haveincreased the fossil energy imports.
2When a national currency also serves as a world reserve currency there is a conflict of economic intereststhat arises between short-term domestic and long-term international objectives. This is known as the Triffindilemma. For example, it is rational for policy makers in these countries to prefer monetary easing policies suchas: negative real interest rates or quantitative easing over policies focused on the stability of the internationalmonetary system.
2

by the establishment of a new international monetary standard that reflects a new hierarchy ofgeopolitical power. Indeed, I forecast that this new hierarchy of geopolitical powers is backed bya technological revolution able to sustain coordinated global growth.
There have been three currency wars in the twentieth century. The first currency war beganwith the panic of 1907 along with the collapse of the gold standard in 1913. It ended withthe Bretton Woods standard in 1945 along with a new hierarchy of geopolitical power. Thisnew hierarchy was backed by a technological revolution in the automobile, petrochemical andelectricity industries. The second currency war began with the collapse of the Bretton WoodsStandard in 1971 along with the oil crisis in 1973. It ended with the failure of the EuropeanExchange Mechanism and the collapse of the Soviet Union. This new hierarchy of geopoliticalpower was backed by a technological revolution in microprocessors, telecommunications andpharmaceutical industry. The third currency war began in 1997 with the Asian, Russian anddot-com crisis along with the emergence of the Euro as a challenger to the US dollar hegemony.I claim that this currency war will end with a new international monetary standard along witha new hierarchy of geopolitical power. Indeed, a new technological revolution would back thisnew hierarchy of power.
The added value of this master thesis is to study the intermediate strategic situations through-out the dynamics of a currency war. The potential moves governments / central banks can makeafter an economic crisis hits and how these moves influence the outcome of the currency war.
“The linguist Noam Chomsky once suggested that our ignorance can be divided in problemsand mysteries. When we face a problem, we may not know its solution, but we have insight,increasing knowledge, and an inkling of what we are looking for. When we face a mystery,however, we can only stare in wonder and bewilderment, not knowing what an explanation wouldeven look like [1]”
If a currency war is a well defined problem, no serious statistical analysis could be basedonly on three samples. However, a currency war is an ill defined problem. The two theoriestrying to explain them, competitive currencies devaluation and monetary coordination spillovers,are contradictory. In fact, they are more a mystery than a problem. Therefore, the focus ofthis thesis is not on predicting with statistical precision the length of the phases of a currencywar. Neither, to determine the spectral features of their cycles. My focus is on identifying avalid set of assumptions to understand the rules of the game. That means, how game-changinggeopolitical and economic events transforms the strategic confrontation between geopoliticalpowers. Moreover, to gain an insight about how geopolitical and economic strategies can createregime-shifts in the stocks and commodities markets prices during a currency war. The goalis to upgrade this mystery to the level of a problem where a more scientific approach could bedeveloped in the future.
I compared the study of currency wars with the study of the world chess championships.Imagine you have access to a database with the length of matches, the duration of the opening,middle and the end game and you have to predict who will win the game between two top masters.It is possible to run a study about the mean duration and the different statistical moments inevery championship. Moreover, you can build some hypothetical payoff function based on thevalue of the pieces and some positional utility function and then to find the spectral features ofthe cycles and perhaps some nice econometrical regressions. However, your ability to understandthe game will not improve with this analysis. Furthermore, if you bet for who will be the nextworld champion based on this analysis, you probably lost the point of what chess is about. Inchess, first you have to figure out what are the rules of the game and then go deep into the mastermatches to get an understanding about the opening, the middle and end game. Moreover, if youalready understand the rules, you have enough computer power to analyze and store patternsalong with a team of clever computer programmers fully committed to chase Kasparov, it is
3

possible to program a world chess champion3.Similarly to the study of the matches of chess-masters like Capablanca, Alekhine or Fisher,
this master thesis uses history and game theory as a framework to understand the differentphases of a currency war.
In fact, I have identified three phases. The first (opening) occurs when governments andcentral banks are focused on alleviating unemployment after a deep global economic crisis. Theyuse monetary policy and protectionism strategies. In the second phase (middle game) policymakers are focused on geopolitical coalitions and (proxy) war strategies in order to get access tostrategic natural resources. The third phase (end game) is characterized by structural reforms,revolutions and the dissolution of geopolitical coalitions in order to ensure global competitiveness.
The change between the phases reflects a transition between the strategic situations insidea currency war. Sometimes, this new strategic configuration could be critical and highly am-biguous. Therefore, they are very difficult to price by financial markets. In fact, It causes highvolatility in the returns of equity and commodities prices.
This thesis is structured as follows. Chapter 1 presents a brief introduction to game theoryand to the payoff permutation framework to build the rules of the currency war model. Chapter 2defines the rules of the game and develops the game-theoretical framework. The goal is to showthe mapping between geopolitical and economic strategies into game’s payoffs permutations.Chapter 3 uses CW I in order to infer the framework and the payoff function . In Chapter 4 Itest the framework developed in Chapter 3 by applying it to Currency War II. Chapter 5 usesthe framework to forecast potential scenarios in the current Currency War III. Finally, Chapter6 shows the conclusions and the limitations of the framework. It also shows two future researchdirections.
3On may 11, 1997 the chess grandmaster Garry Kasparov resigns after 19 moves in a game against Deep Blue,a chess-playing computer developed by scientists at IBM. This was the sixth and final game of their match, whichKasparov lost two games to one, with three draws.
4

Abbreviations and Glossary
Abbreviations and acronyms:• ASEAN: Association of Southeast Asian Nations.
• BoJ: Bank of Japan
• CW I: Currency War I.
• CW II: Currency War II.
• CW III: Currency War II.
• Dow Jones: Dow Jones Industrial Index.
• ECB: European Central Bank.
• ERM: European Exchange Rate Mechanism.
• FED: United States Federal Reserve Bank.
• Germ. & France: Germany and France. Bloc in currency war II.
• IMF: International Monetary Fund.
• MNC: Multinational Company
• NATO: North Atlantic Treaty Organization.
• OPEC: Organization of the Petroleum Exporting Countries.
• P/E: Price Earnings Ratio.
• PD: Prisoner’s dilemma.
• PBoC: People Bank of China.
• UK: The United Kingdom.
• UK&France: Coalition in Currency War I.
• UN: The United Nations.
• US: The United States.
• USD: The United States Dollar.
5

• USSR: Union Soviet Socialist Republics.
• US&UK: The United States and the United Kingdom. Coalition in Currency War II.
• RSH: Rousseau Stag-Hunt dilemma.
• R&D: Research & Development
• S&P 500: Standard & Poor’s 500 Index.
• SOE: State Owned Enterprise.
• WWI: World War I.
• WWII: World War II.
Definitions:• Autocracy: refers to a system of government in which a supreme power is concentrated
in the hands of one person, whose decisions are subject to neither external legal restraintsnor regularized mechanisms of popular control.
• Bretton Woods Standard: it refers monetary management established the rules forcommercial and financial relations among the world’s major industrial states in the mid-20th century. The Bretton Woods system was the first example of a fully negotiatedmonetary order intended to govern monetary relations among independent nation-states.
• Business Cycle: it refers to fluctuations in aggregate production, trade and activity overseveral months or years in a market economy
• Cold War: It was a state of political and military tension after World War II betweenpowers in the Western Bloc (the United States, its NATO allies and others) and powers inthe Eastern Bloc (the Soviet Union and its allies in the Warsaw Pact).
• Currency War: The lack of an international monetary system. The most used definitionis competitive currency devaluations. This definition is misleading because in a currencyit possible to have other strategic configurations such as monetary coordination spillovers.Moreover, devaluations or monetary policy is just one sort of strategies a geopolitical powercould use in a currency war.
• Deflation: It is a decrease in the general price level of goods and services. Deflation occurswhen the inflation rate falls below 0% (a negative inflation rate).
• Gold Standard: it is a monetary system in which the standard economic unit of accountis based on a fixed quantity of gold.
• Governance mechanisms: it is the explicit or implicit contractual framework includingstates, markets, firms, and mixed modes within which a transaction is located.
• Inflation: it is a sustained increase in the general price level of goods and services in aneconomy over a period of time.
• Stagflation: it describes a situation where the inflation rate is high, the economic growthrate slows down, and unemployment remains steadily high.
6

• Hyperinflation: it occurs when a country experiences very high and usually acceleratingrates of inflation, rapidly eroding the real value of the local currency, and causing thepopulation to minimize their holdings of the local money.
• Monetary easing: It is a course of action undertaken to reduce interest rates and boostmoney supply as a means to stimulate economic activity.
• Monetary tightening: It is a course of action undertaken by a central bank to constrictspending in an economy that is seen to be growing too quickly, or to curb inflation whenit is rising too fast.
• Nash barganing solution: It is solution concept in cooperative game theory when 1)thereis a conflict of interest about agreements 2)Individuals have the possibility of concluding amutually beneficial agreement 3) No agreement may be imposed on any individual withouthis approval.
• Potential Output: refers to the highest level of real Gross Domestic Product output thatcan be sustained over the long term.
• Petrodollar: it refers to United States dollars earned through the sale by a country of itspetroleum (oil) to another country.
• Quantitative easing: it is an unconventional monetary policy used by central banks tostimulate the economy when standard monetary policy has become ineffective. A centralbank implements quantitative easing by buying specified amounts of financial assets fromcommercial banks and other private institutions, thus raising the prices of those financialassets and lowering their yield, while simultaneously increasing the monetary base.
• Structural reforms: It means changes to the economic-governmental structure. Exam-ples: The Roosevelt new deal , Reagan-Tatcher reforms.
• Technological revolutions: It is an era of an accelerated technological progress charac-terized not only by new innovations but also their application and diffusion.
• Transaction costs: it is the cost incurred in making an economic exchange e.g: contrac-tual costs, trading costs
7

Chapter 1
Theoretical review
This chapter introduces the theoretical elements of game theory employed in this thesis.Section 1.1 describes the basic concepts of game theory. Section 1.2 presents the two mainmacroeconomic approaches to understand currency wars, and shows the equivalence of thesemacro views with the prisoner’s dilemma and the Rousseau stag-hunt dilemma.
1.1 Game theoryGame theory models strategic confrontations where each player tries to get the maximum
payoff, knowing that the other player will also try to do the same. Typically, a game is definedby four elements:
1. Players. They are the decision makers. They can be people, governments, companies.In the case of the currency wars the most important decision makers are governments andcentral banks. In general players are defined as a finite and countable set of the form{1, 2, ..i}.
2. Actions. They are the possible set of decisions a player could make. In general actions aredefined by a finite countable set of strategies of the form {a1, a2,...ai...an}. In the contextof a currency war they can be whether to devaluate or not their currency.
3. Payoffs. It is what motivates the players. Do they care about economic growth? Dothey care about inflation? Do they care about other players? The general way to quantifywhat motivates players is by means of a utility function. Utilities’ values are derived fromplaying a particular set of strategies. For example the utility for player one playing strategyai given that player two is playing aj is u1(ai, aj).
4. Beliefs. They are the raking of preferences for every player. For example, player 1 prefersthe strategies with the lowest subindex b1 = {a1 � a2 � ai..... � an} while player two thestrategies with the highest subindex b2 = {an � an−1 � ai..... � a1}
The power of game theory lays on the existence of different solution concepts and methodolo-gies. For competitive game theory, namely settings in which cooperation is not modeled, it isknown that there is always at least one solution for strategic situations, which comprises possiblyrandomize strategies. This solution is known as the Nash equilibrium.
“A Nash equilibrium is a solution concept of non-cooperative games involving two or moreplayers, in which each player is assumed to know the equilibrium strategies of the other players,
8

and no player has anything to gain by changing only their own strategy unilaterally” [2].1
1.1.1 Game-changing strategiesIn addition to the previous concepts, I will use the notion of Game-changing strategies.Game-changing strategies are actions able to change the players’ beliefs in the game. They canbe signals, communication mechanisms, options outside the initial setting of the game or insti-tutional transformations. These strategies can be represented by a permutation in the rankingof preferences. For example, by using communication mechanisms a player could convince otherto change the order of his preferences. In the context of a currency war these game changingstrategies can be monetary policy, trade barriers, wars, structural reforms, coalitions or revolu-tions.
The use game-changing strategies is illustrated by an episode of the famous English showGolden Balls2, in which two players face prisoner’s dilemma situation. This makes reference toa situation where two members of a criminal gang are arrested and imprisoned. Each prisoneris in solitary confinement with no means of speaking to or exchanging messages with the other.The police admit they don’t have enough evidence to convict the pair on the principal charge.They plan to sentence both to a year in prison on a lesser charge. Simultaneously, the policeoffer each prisoner a Faustian bargain. Each prisoner is given the opportunity either to betraythe other, by testifying that the other committed the crime, or to cooperate with the other byremaining silent. Here’s how it goes: If A and B both betray the other, each of them serves 2years in prison. If A betrays B but B remains silent, A will be set free and B will serve 3 yearsin prison (and vice versa). If A and B both remain silent, both of them will only serve 1 year inprison (on the lesser charge3. In the TV show both players have together 13.600 pounds. Theyhave two options; either they split the price in equal parts (Sp) or they steal the total prize(St).However, if both steal the prize they will finish the game with nothing.
Table 1.1a shows the golden’s ball episode initial setting. The left player’s preferences are{StSp � SpSp � StSt � SpSt}. The right player’s are {SpSt � SpSp � StSt � StSp}.There are two solutions for this dilemma: the Pareto optimal4 -every player split the price
and they go home with half of the prize-. Or, the Nash Equilibrium -they follow a self interestedlogic. They do not trust each other going home with nothing-
1Formally stated, let Ai be the set of all possible strategies for player i, and the set of all strategies playedall players excluding player i. The strategy ai ∈ Ai is a best response to the strategies a−i ∈ A−i played by theother players in the game if the utility ui(ai, a−i) ≥ ui(a′i, a−i) for all a′i ∈ Ai. Let be Bi(a−i) ∈ Ai the set ofplayer’s i’s best response action against a−i. a∗ = (a∗1...a∗n) A is a Nash Equilibrium if a∗i ∈ Bi(a∗−i) for everyi ∈ N .
2http://www.youtube.com/watch?v=S0qjK3TWZE83http://en.wikipedia.org/wiki/Prisoner’s_dilemma4Pareto optimality, is a state of allocation of resources in which it is impossible to make any one individual
better off without making at least one individual worse off.
9
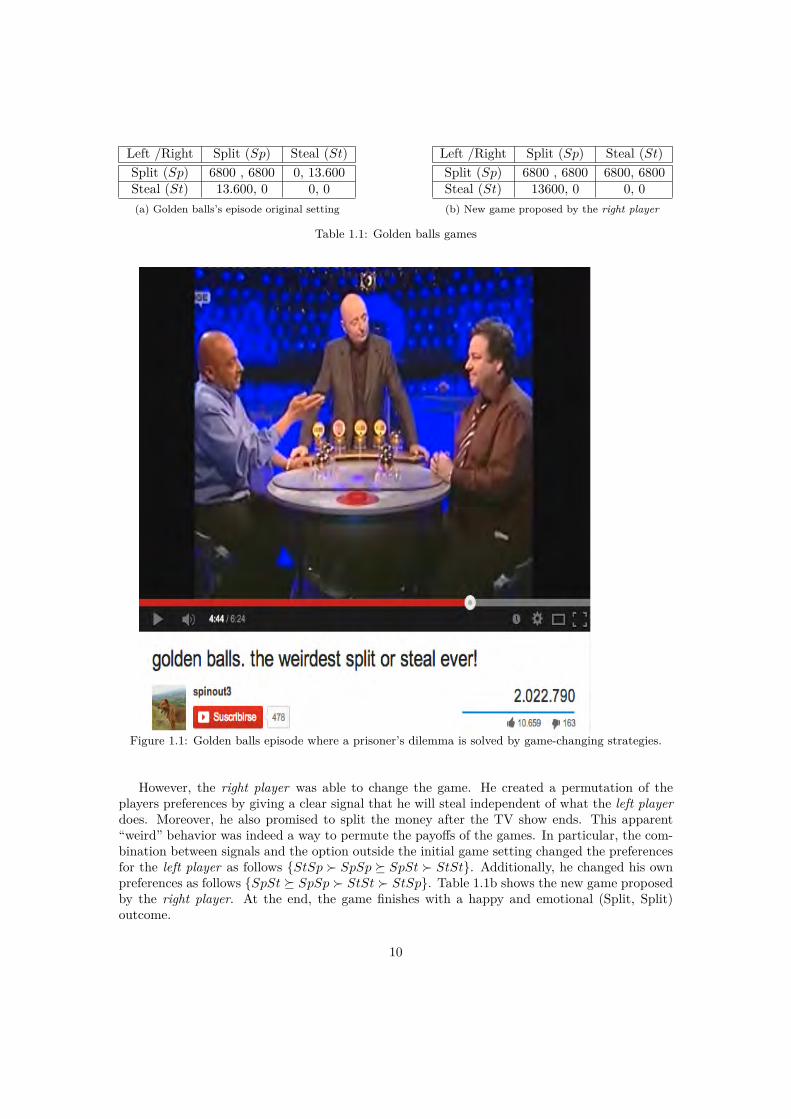
Left /Right Split (Sp) Steal (St)Split (Sp) 6800 , 6800 0, 13.600Steal (St) 13.600, 0 0, 0(a) Golden balls’s episode original setting
Left /Right Split (Sp) Steal (St)Split (Sp) 6800 , 6800 6800, 6800Steal (St) 13600, 0 0, 0(b) New game proposed by the right player
Table 1.1: Golden balls games
Figure 1.1: Golden balls episode where a prisoner’s dilemma is solved by game-changing strategies.
However, the right player was able to change the game. He created a permutation of theplayers preferences by giving a clear signal that he will steal independent of what the left playerdoes. Moreover, he also promised to split the money after the TV show ends. This apparent“weird” behavior was indeed a way to permute the payoffs of the games. In particular, the com-bination between signals and the option outside the initial game setting changed the preferencesfor the left player as follows {StSp � SpSp � SpSt � StSt}. Additionally, he changed his ownpreferences as follows {SpSt � SpSp � StSt � StSp}. Table 1.1b shows the new game proposedby the right player. At the end, the game finishes with a happy and emotional (Split, Split)outcome.
10

1.1.2 The class of 2X2 gamesA 2X2 game is the minimal representation of a strategic confrontation. The strategic situation
involves only two players– Row’s and Column’s– each with only two alternatives– cooperate (C)or defeat (D)–. There are only four possible outcomes and each outcome is described by a singlepayoff for each player, thus, a game is fully described by 8 numbers.
The most common representation of an ordinal game is in the strategy space by means of abimatrix. The bimatrix is filled by a payoff function that assigns a number from the payoff set{1, 2, 3, 4} to every strategy played by the Row’s and Column’s players.
[3] introduces the payoff space as a more convenient representation of the 2X2 game because itprovides information about players best responses in the form of inducements. In fact, the ordergraphs representation allows to understand the topological richness of the 2X2 game class [4].Figure 1.2 illustrates the Prisoner’s dilemma in the strategy and payoff spaces. On the left-handit shows the bimatrix representation in the strategy space. On the right-hand illustrates thepayoff space representation. The X-axis corresponds to the Row’s players payoffs. The Y-axis tothe Column player’s.
Figure 1.2: Bimatrix and order graph representation for the Prisoner’s Dilemma
The class of simultaneous 2X2 pure strategy games have received considerable attention,including complete classification schemes. For example, [5, 3] developed a complete classificationsystem based on the topological characteristics of these games.1.1.3 The inducement correspondenceAn inducement correspondence is a general term for a set of positions that one player can bringabout or “induce”. The “Row’s inducement correspondence” means the set of outcomes inducedby the Column’s player for the Row’s player to choose from. Figure 1.2 on the right handillustrates the inducements for every player in the Prisoner’s dilemma in the form of red arrowsfor the Row’s player and blue dotted arrows for the Column’s player.
For instance, given that Rows’ player is playing cooperate (C), the Column’s player is betteroff by choosing defeat (D). In this sense by Row’s player using strategy C, induces Column’splayer playing D. On the other hand, if Row’s player is playing D, it induces Column’s player toplay D. The blue dotted arrows represents the inducements for the Column’s player. Following
11

the same reasoning, if Column’s player plays defeat (D), it induces Row’s player to choose D. Inthe case of Row’s player if Column’s player choose C, it induces in the Row’s player to chose D. Ifthe Column’s player choose D, the Row’s player is induced to play D. The red arrows representsRow’s player inducements.
Summarizing, Column’s player will always prefer the uppermost payoff while the Row’s playerprefers the right most payoff. This is in accordance with the general convention in economicsthat more is better, thus, upper and right payoff are more desirable[6].
The Inducement correspondence provides an easy way to examine the Nash equilibrium.Given that the payoffs are strictly ordered, there will always be a single best response in a giveninducement correspondence. A Nash equilibrium is easy to recognize in the payoff space. Anypayoff pair that is the terminus of two arrows is a Nash equilibrium. In Figure 1.2, Figure 1.3the Nash equilibrium is identified by the red dot.
Figure 1.3 shows the juxtaposition of strategy and payoff spaces. The 4X4 matrix is equiv-alent to the bimatrix. It is used in this format because this representation makes possible thejuxtaposition between the strategy and payoff space. In 4X4 matrix only eight cells are used.In particular the second and fourth column yield the payoffs for the Column’s player (blue) byplaying D and C respectively . The second and fourth row yields the payoffs for the Rows’ player(red) by playing C and D respectively.
On the oder hand, in the payoff space the only valid point in the cartesian plane are the pairscoming from the cartesian product {1, 2, 3, 4} × {1, 2, 3, 4} .The order graph is composed of fournodes and 4 inducement arrows. Any 2X2 ordinal game is fully represented by an order graph.
Figure 1.3: Juxtaposition between the strategy space and payoff space.
Furthermore, order graphs are connected by the adjoint payoff permutations (curve arrows)had a very rich and complex topological structure. They can by represented by a torus of 4layers, every layer with 6 Row’s X 6 Column’s patterns. This topological structure is organizedin a periodic table by [3]5 and [7] reorganized it for making easier to navigate the topology of2X2 games.
5Prof. Goforth developed a software that is useful to understand the topology of the class of 2X2 gameshttp://www.cs.laurentian.ca/dgoforth/periodictable.html
12
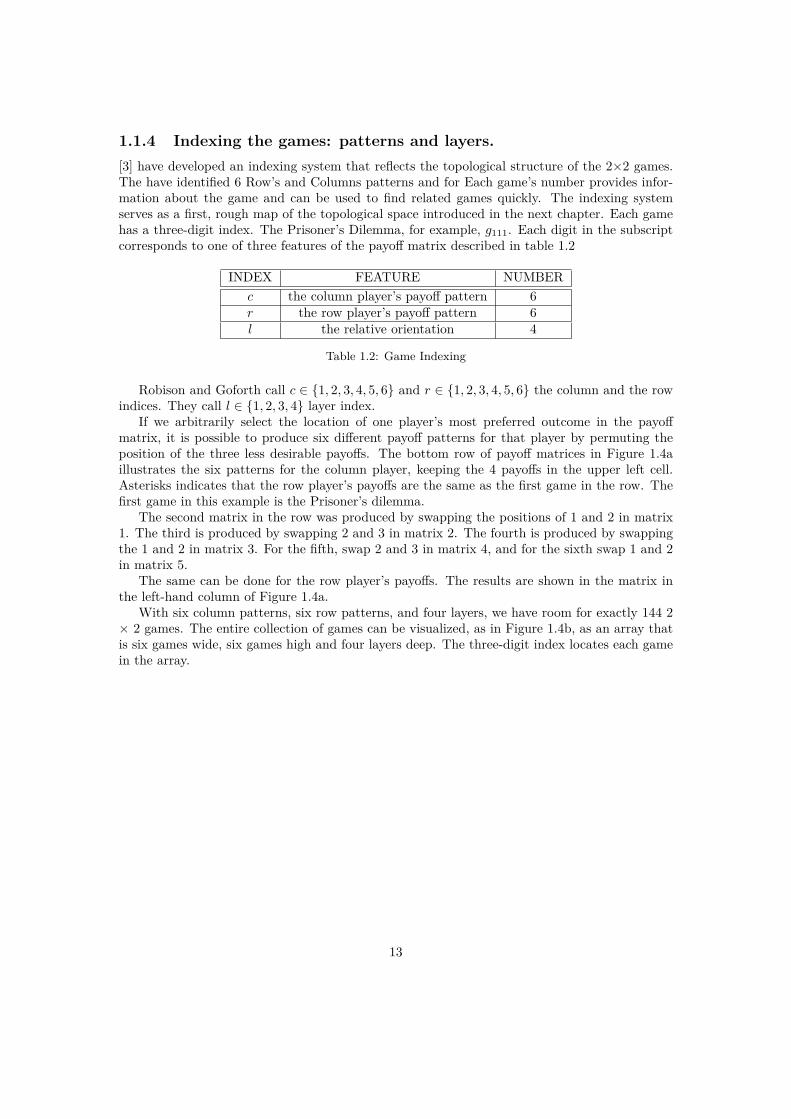
1.1.4 Indexing the games: patterns and layers.[3] have developed an indexing system that reflects the topological structure of the 2×2 games.The have identified 6 Row’s and Columns patterns and for Each game’s number provides infor-mation about the game and can be used to find related games quickly. The indexing systemserves as a first, rough map of the topological space introduced in the next chapter. Each gamehas a three-digit index. The Prisoner’s Dilemma, for example, g111. Each digit in the subscriptcorresponds to one of three features of the payoff matrix described in table 1.2
INDEX FEATURE NUMBERc the column player’s payoff pattern 6r the row player’s payoff pattern 6l the relative orientation 4
Table 1.2: Game Indexing
Robison and Goforth call c ∈ {1, 2, 3, 4, 5, 6} and r ∈ {1, 2, 3, 4, 5, 6} the column and the rowindices. They call l ∈ {1, 2, 3, 4} layer index.
If we arbitrarily select the location of one player’s most preferred outcome in the payoffmatrix, it is possible to produce six different payoff patterns for that player by permuting theposition of the three less desirable payoffs. The bottom row of payoff matrices in Figure 1.4aillustrates the six patterns for the column player, keeping the 4 payoffs in the upper left cell.Asterisks indicates that the row player’s payoffs are the same as the first game in the row. Thefirst game in this example is the Prisoner’s dilemma.
The second matrix in the row was produced by swapping the positions of 1 and 2 in matrix1. The third is produced by swapping 2 and 3 in matrix 2. The fourth is produced by swappingthe 1 and 2 in matrix 3. For the fifth, swap 2 and 3 in matrix 4, and for the sixth swap 1 and 2in matrix 5.
The same can be done for the row player’s payoffs. The results are shown in the matrix inthe left-hand column of Figure 1.4a.
With six column patterns, six row patterns, and four layers, we have room for exactly 144 2× 2 games. The entire collection of games can be visualized, as in Figure 1.4b, as an array thatis six games wide, six games high and four layers deep. The three-digit index locates each gamein the array.
13

(a) Payoff patterns 2X2 games. Adapted from Robison & Goforth, Bruns
(b) Arrangement of the 2x2 games yindices, glrc
Figure 1.4: Payoff patterns and Indexing 2X2 games. Source: Robison & Goforth
1.1.5 Topology of the 2X2 gamesThe topology can be constructed by starting with the Prisoner’s dilemma and swapping Row’spayoffs of 1 and 2 to create a new game. Similarly, swapping Columns 1 and 2 payoffs creates athird game. Finally, by swapping both it creates a new game. These four games are a tile.
14

Starting from those four games, swapping column’s 2 and 3 payoffs create four more games.Swapping column’s 1 and 2 payoffs in these new games then complete two more tiles in eitherside of the original tile. Swapping row’s 2 and 3 payoffs then creates more games above andbelow, and swapping row’s 1 and 2 payoffs in these games completes six more tiles, above andbelow. These swaps of 1 and 2 and 2 and 3 form a layer composed of nine tiles and thirty-sixgames, containing all the possible changes from swapping 1 and 2 and 3. Topologically this is atorus, since further 1->2 and 2->3 swaps return to games already in the layer. Figure 1.5 showsthe torus construction. Swapping row’s payoffs of 3 and 4 creates a different game, after whichthe same steps can be used to create another layer. Similarly, Column’s 3 and 4 payoffs can beswapped, and then swaps for both, to form two more layers. Figure 1.6a , 1.6b, 1.6c , 1.6d showsthe layers.
Figure 1.5: Tiles torus, layers. Source: Robison & Goforth
1.1.6 Adjoint payoff neighbors:To define meaningful neighborhoods, Robison and Goforth characterized the smallest significantchange in the payoff function. Obviously a change affecting the payoffs of one player is smallerthan a change affecting two players. The closest neighboring games are therefore those gamesthat differ only by a small change in the ordering of the outcomes for one player. That is bychanging one adjoint Row’s or Column’s adjoint payoff. Figure 1.7 illustrates the six neighbors ofthe Prisoner’s dilemma (g111). If there is a Row’s permutation 1–>2 , the game is transformedinto g112. If Row’s player makes permutation 2–>3 the game is transformed into g116. It isimportant to notice that both permutations transform the original game into games of the samelayer (L1). If the Row’s player makes permutation 3–>4, it transforms the game into g211 inthe second layer. On the other hand if Column’s player makes permutation 3–>4 it transformsthe prisoner dilemma into g411 in the fourth layer. If Column’s player uses permutation 2–>3and 1–>2 it transforms the prisoner’s dilemma into g161 and g121 in L1.
15

(a) Layer 2. In general column does well (b) Layer 4 the best outcome is feasible for both play-ers
(c) Layer 1: With PD, Chicken and BoS (d) Layer 2: Row generally does well
Figure 1.6: Layers 2X2 games. The order graphs shows 3 types of solutions the Nash equilib-ria in red. Nash bargain the black cross. Miller machine solution the green X. The only so-lution concept used in this thesis is the Nash Equilibrium. For the other solutions please seehttp://www.cs.laurentian.ca/dgoforth/periodictable.pdf and the software in NetLogo. Source: Robison& Goforth.
16
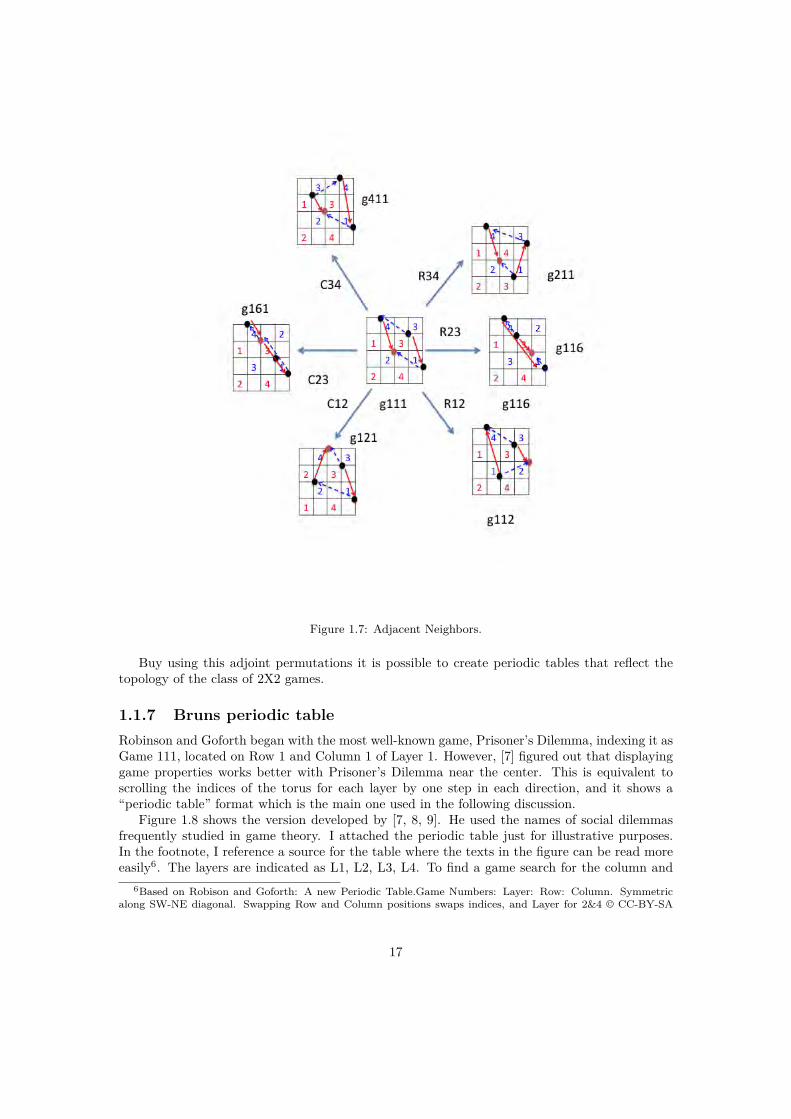
Figure 1.7: Adjacent Neighbors.
Buy using this adjoint permutations it is possible to create periodic tables that reflect thetopology of the class of 2X2 games.
1.1.7 Bruns periodic tableRobinson and Goforth began with the most well-known game, Prisoner’s Dilemma, indexing it asGame 111, located on Row 1 and Column 1 of Layer 1. However, [7] figured out that displayinggame properties works better with Prisoner’s Dilemma near the center. This is equivalent toscrolling the indices of the torus for each layer by one step in each direction, and it shows a“periodic table” format which is the main one used in the following discussion.
Figure 1.8 shows the version developed by [7, 8, 9]. He used the names of social dilemmasfrequently studied in game theory. I attached the periodic table just for illustrative purposes.In the footnote, I reference a source for the table where the texts in the figure can be read moreeasily6. The layers are indicated as L1, L2, L3, L4. To find a game search for the column and
6Based on Robison and Goforth: A new Periodic Table.Game Numbers: Layer: Row: Column. Symmetricalong SW-NE diagonal. Swapping Row and Column positions swaps indices, and Layer for 2&4 © CC-BY-SA
17

row patterns in the border of the periodic table. The main change of Bruns periodic table isthat Row’s and Column’s patterns order changed from [1 2 3 4 5 6] to [1 6 5 4 3 2 1]. It alsoredefines the concept of neighborhood of games connected by permutation 1–>2.
In the Bruns periodic table 61% of the games are socially favorable; every player is close toa win-win situation. 13% of the social dilemmas are unfair, that means, there is a winner-loserNash equilibrium. 13% of the social dilemmas are social inefficient. That is, the Nash equilibriumis a loss-loss situation. 10% are cyclic or critical; there is no Nash equilibrium in pure strategies7but it is possible to find max-min solutions.
The family of 144 games can be divided into 7 subfamilies according to the intensity of conflictbetween the two players. Figure 1.8 shows the characteristics of the different families; numberof Nash equilibria, Pareto optimal equilibrium and symmetry.
Every game family has a prominent social dilemma that has been widely studied. Figure 1.9shows the most famous dilemmas by family. They represent the strategic situations between twoplayers; both with two strategies. In general the strategies are: cooperate (C) or defeat (D). Thered boxes indicate the Nash equilibria.
The level of conflict and social harm is what defines the classification of the game’s subfamilies.Colors indicate the game subfamily.
The prisoner’s dilemma is the most famous of the loss-loss family. The temptation for defeat(lack of trust) makes this strategic situation to end in a loss-loss outcome.
The Rousseau stag-hunt is part of the win-win family. This game has two Nash equilibria;the risk-on equilibrium (CC) when coordination is expected, and the risk off equilibrium (DD)when coordination is not expected.
The battle of sexes is the most representative of the biased family. This is a not intense socialconflict where the other player’s best is the second best for the first player. This game has twoNash equilibria.
For example, the battle of sexes could be used to model the conflict inside the Eurozoneafter the Euro periphery sovereign debt financial crisis in 2009. Countries in the Euro peripherywere better off by accepting a bailout from the Euro core than by having a sovereign default.Moreover, Euro core countries get a second best outcome by restoring the financial stability inthe Eurozone despite of the bailout costs.
The chicken game is the most representative of the unfair family ”The phrase game of chickenis used as a metaphor for a situation where two parties engage in a showdown where they havenothing to gain, and only pride stops them from backing down” [10]. This game has two Nashequilibria in pure strategies.
Bertrand Russell used the Chicken game as an analogy to exemplify the nuclear race betweenthe US and the USSR in the cold war. The only incentive for the US or the USSR for notlaunching a nuclear attack was the existence of submarines somewhere with nukes ready for asecond move. In the case of the cold war the solution for the Chicken game was either the USor the USSR wins. Russell modeled the cold war as a repeated Chicken game. Every repetitionimplied an accumulated cost for each player. This iterative setting is known as a war of attrition.It lasts until one of the parties is not able to face the accumulated cost of a military race. Thatwas the case of the collapse of the USSR in 1992. The strategic confrontation between the USand the USSR will be analyzed in more detail in chapter 4.
ß 2011.06.21 To find a game: Make ordinal 4>3>2>1. Put column with Row’s 4 right, row with Column’s 4up. Find layer by alignment of 4s; then intersection of Row&Column payoffs. see Robinson & Goforth 2005 TheTopology of the 2x2 Games: A New Periodic Table www.cs.laurentian.ca/dgoforth/home.www.BryanBruns.com/2x2chart.html
7There is not Nash equilibrium because is not possible to randomize strategies. In other words, it is a one shotgame where a mix strategy such as: cooperate X% and defeat the (100-X)% make no sense.
18

The missile crisis is a game from the critical family. These games represent puzzles thathave not Nash Equilibrium in pure strategies and require immediate action. The only way forresolving them is by mean of game-changing strategies.
In the Cold War, the USSR in a secret operation was able to hide nuclear missiles in Cuba. InOctober 1962, US discovered the deployment of Soviet Union nuclear missiles in Cuba triggeringthe missile crisis between the governments of John F Kennedy and Nikita Khrushchev.
The options for the US were to do nothing or to make a preventive nuclear attack. If US donothing, USSR get a huge geopolitical advantage very costly to defend. If US makes a preventivenuclear attack, the USSR will retaliate with other nuclear attack.
The only option for solving this crisis is by changing the structure of the game. The US didthat by responding with a blockade and a declaring to the soviets an ultimatum for the missileswithdrawal. In the words of Khrushchev:
“You, Mr. President, are not declaring a quarantine, but rather are setting forth an ultimatumand threatening that if we do not give in to your demands you will use force. Consider what youare saying! And you want to persuade me to agree to this!. . . You are no longer appealing toreason, but wish to intimidate us.”8
8http://www2.gwu.edu/~nsarchiv/nsa/cuba_mis_cri/docs.htm
19

Figure 1.8: Changing Games: from conflict to cooperation. Games periodic table.
20

Figure 1.9: Family of 2X2 games and characteristics such as: Nash and Pareto solution and symmetry.
Figure 1.10: The most important 2X2 social-economic dilemmas by family. Blue numbers indicate thepayoffs for the first player. Red numbers indicate the payoffs of the second player. Red boxes representsthe Nash equilibria.
1.1.8 Navigating 2X2 games.Permutations within the payoff matrix give rise to the concept of neighborhood. Let us an-
alyze for instance how the permutation 1->2 creates a neighborhood in the Chicken game. Theorange box in Figure 1.11 shows two players (blue and red), which together can take four differentactions {CC, CD, DC, DD}. The preferences for the blue player are {CD(4) � CC(3) � DC(2) � DD(1)}.The preferences for the red player are {DC(4) � CC(3) � CD(2) � DD(1)}. The red player isable to transform the game from the Chicken to the Called Bluff game by using permutation1->2;{CD(4) � CC(3) � DC(2) � DD(1)}→ {CD(4) � CC(3) � DD(2) � DC(1)}.The Called Bluff game has one Nash Equilibrium where the red player gets 4 and the blue 2.
21

(a) Prisoner’s dilemma neighborhood (b) Rousseau Stag-Hunt Neighborhood
Figure 1.12: Main neighborhoods in a currency war
Figure 1.11: Transformation to the Chicken game into the called bluff game
A neighborhood is defined as the set of games linked by permutation 1->2 [3]. In the case ofthe PD, swapping the columns payoffs for the blue player and the row payoffs for the red playercreates a 4 games neighborhood. Figure 1.12a shows the games inside the PD’s neighborhood:Called Bluff (red wins), Chicken, Called bluff (blue wins) and the PD (loss-loss). Permutation1->2 is the less costly permutation. Therefore, the games that are inside the neighborhood arethe most probable to occur.
Figure 1.12b shows the games inside RSH’s neighborhood: Privileged Hunt (win-win) , NoConflict (win-win) and the RSH (win-win, loss-loss). In the RSH neighborhood three games havea win-win Nash equilibrium and only the RSH have two equilibria.
There are other permutations that are also game changing strategies. For instance thecheapest is to create a tile 1->2 and a layer 2->3. 1->3 implies a move to a different tilebut in the same layer. Following this logic, changes in layers are more expensive. The eas-iest way for changing the layer is by using permutation 3->4, it implies just one swap inthe adjoint payoff. Permutation 2->4 implies two swaps in the payoff matrix while permu-
22
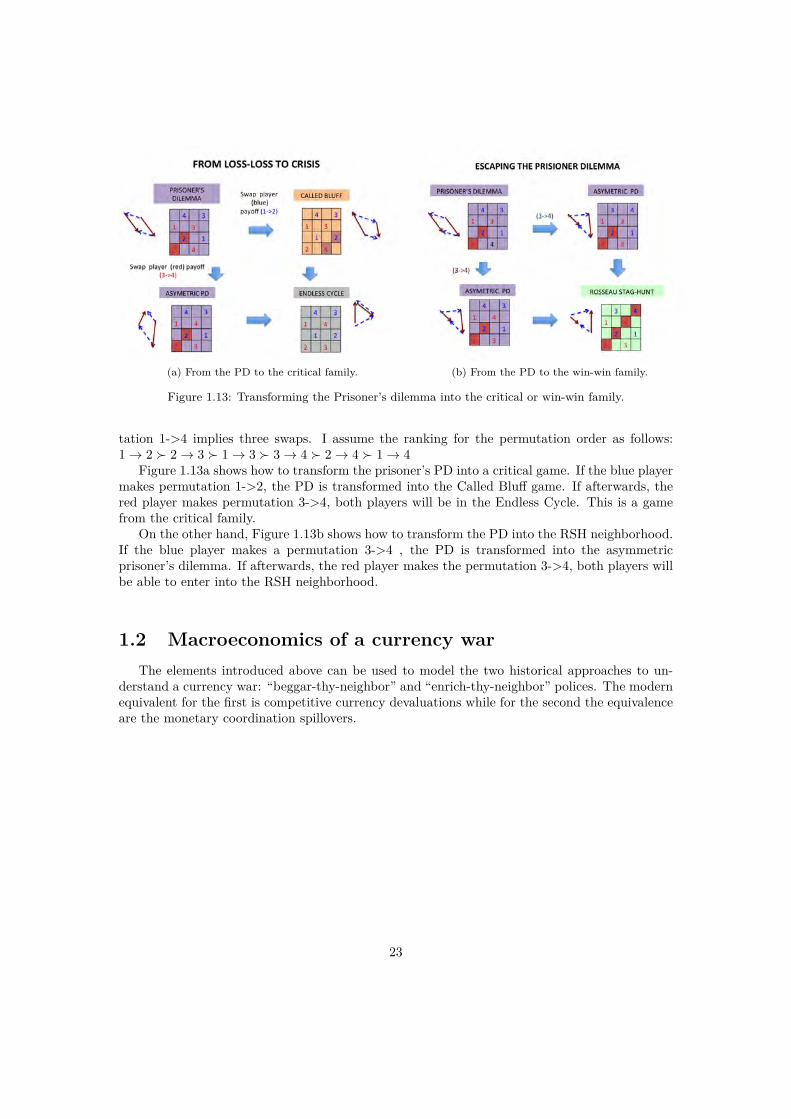
(a) From the PD to the critical family. (b) From the PD to the win-win family.
Figure 1.13: Transforming the Prisoner’s dilemma into the critical or win-win family.
tation 1->4 implies three swaps. I assume the ranking for the permutation order as follows:1→ 2 � 2→ 3 � 1→ 3 � 3→ 4 � 2→ 4 � 1→ 4
Figure 1.13a shows how to transform the prisoner’s PD into a critical game. If the blue playermakes permutation 1->2, the PD is transformed into the Called Bluff game. If afterwards, thered player makes permutation 3->4, both players will be in the Endless Cycle. This is a gamefrom the critical family.
On the other hand, Figure 1.13b shows how to transform the PD into the RSH neighborhood.If the blue player makes a permutation 3->4 , the PD is transformed into the asymmetricprisoner’s dilemma. If afterwards, the red player makes the permutation 3->4, both players willbe able to enter into the RSH neighborhood.
1.2 Macroeconomics of a currency warThe elements introduced above can be used to model the two historical approaches to un-
derstand a currency war: “beggar-thy-neighbor” and “enrich-thy-neighbor” polices. The modernequivalent for the first is competitive currency devaluations while for the second the equivalenceare the monetary coordination spillovers.
23

(a) PD between central banks with a reserve cur-rency (blue) and satellite central banks (red) afterthe 2008 great financial crisis. The red box repre-sents the Nash Equilibrium. The arrows the induce-ment correspondence.
(b) Countries with reserve currencies playing aRousseau stag-hunt (RSH) coordination dilemma.Red boxes represents the Nash Equilibria. The ar-rows the inducement correspondence.
Figure 1.14: Currency War core games: prisoner’s dilemma and Rousseau stag-hunt.
1.3 “Beggar-thy- neighbor”Adam Smith described “beggar-thy-neighbor” policies as a common practice for mercantilistempires. They attempted to remedy their economic problems by means that tend to worsen theeconomic problems of other empires [11]. In a competitive currency devaluation the first moverhas an initial advantage by boosting the exports. Subsequently, the other country retaliates withan equivalent competitive devaluation. The end of the story is a loss-loss situation because rawmaterials and inputs become more expensive for every country.
Competitive currency devaluations resemble a socioeconomic situation known as the pris-oner’s dilemma (PD). Figure 1.1a shows a 2X2 matrix representation for the PD now in thecontext of a currency war. Two players Korea and Japan has each two strategies: devaluationor no devaluation. Japanese payoffs are in red and Korean payoffs are in blue. These payoffscould be understood as the ordinal raking of the preferences for every player. For example, VeryBad =1, Bad= 2, Good=3, Very good=4. For instance Japan ideal situation is devaluating theYen while Korea does not devaluates the Won. This representation introduces two additionalnotions: the “position” and the “inducement correspondence”. The “position” describes the cur-rent state as well as the set of feasible outcomes. Nevertheless, the alternatives of player arenot confined only to choices among the outcomes for their current position; they may be able“to induce” an altogether different position. This information is provided by the “inducementcorrespondence”[12]. The inducement correspondence is based on two assumptions: both playersare rational 9 and they both have common knowledge10. In the matrix the inducement corre-spondence is represented by the blue and red arrows. The Nash equilibrium is the set of inducedpositions where no player could be better off without worsen the position of the other player.The arrows show the inducements for each player. The convergence of the inducements arrows
9In its mildest form, rationality implies that every player is motivated by maximizing his own payoff. In astricter sense, it implies that every player always maximizes his utility, thus being able to perfectly calculate theprobabilistic result of every action http://www.gametheory.net/dictionary/Rationality.html.
10Common knowledge is a special kind of knowledge for a group of agents. There is common knowledge of p ina group of agents G when all the agents in G know p, they all know that they know p, they all know that theyall know that they know p, and so on ad infinitum http://en.wikipedia.org/wiki/Common_knowledge_(logic).
24

indicate the Nash Equilibrium. In the PD the Nash equilibrium is (2,2). The purple color of thewhole matrix indicates that the PD belongs to the loss-loss family. The boxes without payoffsinside have no meaning.
1.4 “Enrich-thy-neighbor”“Enrich-thy-neighbor” claims for the need for a coordinated increase in global liquidity in order toface a deflationary crisis. Both countries end in a win-win situation because coordinated monetarypolicy fosters global investments and consumption thanks to the coordination spillovers [13, 14].
Monetary coordination spillovers in turn resemble a socioeconomic situation known as theRousseau stag-hunt dilemma (RSH). The RSH dilemma describes a situation in which two indi-viduals go out on a hunt. Each can individually choose to hunt a stag or hunt a hare. Each playermust choose an action without knowing the choice of the other. If an individual hunts a stag,he must have the cooperation of his partner in order to succeed. An individual can get a hareby himself, but a hare is worth less than a stag [15]11. Figure 1.8b shows the RSH coordinationdilemma in the matrix format. The players in this case are the Central Bank of Japan and theUS Federal Reserve. Each player has two strategies by using easy or tight monetary policy. Theinducement arrows indicates the existence of two Nash equilibria. One, if both central banksexpect monetary coordination, they will reach a mutual benefit by reaching a win-win equilib-rium (4,4). But, if one of them acts without coordination then they will both reach the loss-lossequilibrium (2,2). The two Nash equilibria in this strategic confrontation are shown in red. Thegreen matrix color indicates that the Rousseau stag-hunt game belongs to the win-win family.
In both situations and as any model, the use of game theory to understand a currency warrequires a set of plausible assumptions. The three main assumptions that I will maintain duringthis thesis are: 1) Countries involved in a currency war have their own agenda; 2) decision makersin the main geopolitical powers only care about their national or economic block interests; and3) they are able to think strategically, try to predict the behavior of the other competitors, andhave in mind that every player in the currency war is thinking strategically. I will not spendtime justifying these assumptions, as I will argue that they are not only plausible, but also theminimum required to conduct any structured analysis.
11http://en.wikipedia.org/wiki/Stag_hunt
25

Chapter 2
The framework
2.1 Currency war game theory frameworkThe framework developed in this thesis stems from a combination of elements from history,
game theory and chess. I developed a systematic way to understand how monetary policy, pro-tectionism, wars, structural reforms, coalitions and revolutions affect the outcome of a currencywar. The departure point of this framework is the assumption that both scholar views aboutcurrency wars are true. In fact, either a loss-loss or a win-win situation could be a valid partialoutcome of a currency war. What I propose is a framework to understand their dynamics. Thatis, analyzing the intermediate strategic configurations along them. Thus, how a loss-loss initialstrategic configuration could be transformed into conflict, unfair, critical or win-win strategicconfigurations.
(a) The prisoner’s dilemma is the initial strategic settingin a currency war.
(b) Game-changing strategies (permutations) over the pris-oner’s dilemma
Figure 2.1: Game-changing strategies in a currency war.
The framework consists of several different components. First, I start with the analysis of a setof 12 attributes for every currency war in the twentieth and twenty first century. These attributesare listed as follows: 1) The geopolitical powers involved in a currency war 2) The new emerging
26

economies 3) Economic crises 4) The international monetary standard in decadence 5) The setof protectionism or trade barriers 6) Wars and new domains of warfare 7) Structural reformsand reformers 8) Reforms procrastinators and highly autocratical geopolitical powers 9) Politicalrevolutions 10) Technological revolutions 11) Geopolitical coalitions or military escalations, and12) The new emerging international monetary standard.
Second, I model a currency war as a 2X2 games tournament between different geopoliticalpowers. The tournament is described as follows:
• Every geopolitical power has six strategies with an associated fixed cost.
• They are: monetary policy, trade barriers, wars, structural reforms, coalitions and revolu-tions.
• The ranking of preferences for the politician in charge are represented by the follow order:Mon Policy � Trade Barriers �Wars � Reforms � Coalitions � Revolutions
• The rationale to determine the cost for every strategy is to think about them in terms ofthe decision makers. What is less costly for the political leader in charge. For example,printing money is costless. Import quotas and trade tariffs are laws easy to implement.Intuitively, war seems a very expensive strategy. However, if a politician has to decidebetween an aggressive foreign policy agenda that fosters his political capital, or an internalstructural reform that will undermine his political power, it is rational to choose war.Indeed, wars trigger national pride and they increase the tolerance for autocratic leaderships[16]. Coalitions or escalations are very expensive strategies in terms of resource allocation.Actually, they imply splitting of power on terms of foreign policy. Furthermore, it alsocould cause a tradeoff between internal political independence and honoring internationalagreements. Finally, a revolution is the worst strategy for a politician in charge. At theend of the day, it will probably imply his physical or political funeral.
• I assume the cost of every strategy as the square of the ranking of preferences, that is, mone-tary policy=1,trade barriers=4, wars=9, structural reforms=16, coalitions=25, Revolutions36. An cost function of the form −x2 is a valid because it is a monotonic transformationof a convex ranking of preferences1.
• Every geopolitical power begins with an initial score equivalent to the sum of the cost allstrategies, that is 12 + 22 + 32 + 42 + 52 + 62= 91. The idea behind is that every player canplay every strategy at least once.
• Every match (sub-currency war) begins with the PD. I assumed that, because a currencywar begins with loss-loss situation (global economic crisis).
• Every player uses the strategies sequentially.
• I map every strategy into row or column payoffs permutations. Based on the Burns’ periodictable introduced in Chapter 1, these permutations are 1->2, 2->3, 1->3, 3->4, 2->4, 1->4.
• Figure 1.13a and 1.13b show an example of how the permutations operate over the prisoner’sdilemma payoffs. For instance, in the prisoner’s dilemma the preferences of the blue playerare represented as {CD � CC � DD � DC}. In order to understand how a permutation
1A utility function assigns numerical values to all bundles so that if x y, we have u(x) ≥ u(y). All that mattersis the ordinal ranking, not the cardinal ranking. The numerical values we get for utility functions only matter inthat we can say one utility level is higher than another, but the actual values don’t mean much. For example, ifu(x) = 100 and u(y) = 200, we can’t say that y is twice as good as x (that’s a cardinal statement), only that yis preferred to x. http://njsanders.people.wm.edu/100A/Prefs_and_Utility_Examples.pdf
27

changes the payoff structure, let us say the blue player implements a structural reform.That means, the blue player will use permutation 3->4 transforming his preferences from{CD � CC � DD � DC} into {CC � CD � DD � DC} creating a new game known asthe asymmetric prisoner’s dilemma. Chapter 1 showed that if the red player decides to usepermutation 1->2 the game will be transformed into a game of the critical family. On theother hand, if the red player decides for permutation 3->4 the game will be transformedinto the RSH.
• The payoffs in every game are the square of the Nash equilibrium value. Therefore thescore in every match is defined by (NashEquilibria)2 − Strategy Cost. In the case ofmultiple equilibria, it is calculated as (NashEquilibria1+NashEquilibria2)2
2 − Strategy Cost
• For the games from the critical family, the lack of a Nash equilibrium in pure strategies,implies an extra cost for both parties. It is equivalent to the cost of a structural reform.In fact, these are games that require immediate actions and consume resources for bothparties. Kasparov, the mythical chess grandmaster, identifies this situations as only moveto avoid a catastrophe. “While strategy is abstract and based on long-term goals, tacticsare concrete and based on finding the best move right now. Tactics are conditional andopportunistic, all about threat and defense. If you don’t immediately exploit a tacticalopportunity the game will almost certainly turn against you. Here we can also introducethe concept of the ’only move’, where everything else loses. We even have a special symbolin chess literature to mark a move that was absolutely essential. Not good or bad, or difficultor easy, but simply required to avoid disaster”(author?) [17].
• The game is repeated until either all players reach a win-win outcome or there is a hege-monic situation where the accumulated earnings of a group of players is far superior thanother groups.
28

Figure 2.2: Analogical comparison between the general model for a currency war and chess. Currencywar general model. Chess game analogy to a currency war. Chess Board from the World Championshipin 1972 between Spassky and Fisher. The two routes illustrates the interplay between geopolitical andeconomic strategies in a currency war.
Although every currency war is different, this game theoretical framework is useful to under-stand the common underlying mechanisms, i.e. their phases. As in chess, nobody can determinewho will win the game between two grandmasters. However, if we understand the rules, aftersome training it is easy to recognize three phases: the opening, the middle game and the endgame.
Figure 2.2 shows a block diagram with the key phases of a currency war compared analogicallywith the phases in chess. The Chess board corresponds to the match between Boris Spassky andRobert Fisher for the World Championship in 1972.
Table 2.1 shows the mapping between permutations and the game-changing strategies in acurrency war. It also shows the cost function associated to every strategy. The last column showsan analogical equivalence between game-changing strategies and pieces in chess. For instance,monetary policy is equivalent to the pawns. Protectionism to the knights. Wars to the bishops.Structural reforms to the rooks castling. Coalition or escalation to the Queen. Finally, revolutionor surrender to the check mate.
29

Permutation Game-changing strategy in a currency war Cost Chess Equivalent1->2 Monetary Signals 1 Pawns2->3 Trade Barriers 4 Knights1->3 War 9 Bishops3->4 Structural Reforms 16 Rook, (Castling)2->4 Coalitions 25 Queen1->4 Revolutions or Surrender 36 King
Table 2.1: The mapping permutations into game-changing strategies. Analogical comparison to chess.
In the opening, there is a global crisis and high unemployment rates. Geopolitical powers usesmonetary policy and trade barriers in order to alleviate unemployment. In chess that means acombination of moves with the pawns and knights. In the middle game, some geopolitical powersuses wars and military coalitions in order to get a geopolitical advantage, others prefer structuralreforms. In chess that is analogous to players that prefer an aggressive attack by using the bishopsand the queen. And other players which are more defensive and they prefer a castling and aslow improvement in the positional game. In the end game, the countries with earlier reformsare able to reach a win-win situation, they use military coalitions and war, while the other eitherhave to dissolve the former coalitions, make structural reforms or being susceptible to a politicalrevolution. In chess, the positional player is able to uses bishops and the queen taking advantageof the former positional game. On the other hand, the most aggressive player either reform itsgame to improve the positional game and threats with checkmate the other player. Or, it facesan important loss (in the worst case the queen). Moreover, this could have a check mate threatcoming from the other player.
As complex as the combination of moves in chess, are the combination of strategies in acurrency war. Therefore, to try to forecast the moves in detail makes no sense. However, we canunderstand the phases of a currency war as a special regimens where the use of certain strategiesis more probable.
30

Chapter 3
Currency War I: From the GoldStandard to the Bretton Woods.(1907-1945)
“A democracy which makes or even effectively prepares for modern, scientific war mustnecessarily cease to be democratic. No country can be really well prepared for modern war
unless it is governed by a tyrant, at the head of a highly trained and perfectly obedientbureaucracy”. Aldous Huxley
In order to analyze CW I this chapter is divided into three sections. Section 3.1 beginswith a historical review of the main geopolitical and economic events during CW I. Section3.2 shows the representation of CWI part I into the game theoretical framework. CW I part Ibegan with the panic of 1907 and lasted until the Great Depression in 1929. Section 3.3 showsthe representation of CW I part II into the game theoretical framework. CWI part II beganwith the Great Depression and lasted until the setting of the Bretton Woods standard and theinternational monetary fund in 1945.
At the end of the nineteenth century the world was dominated by the empires. The Britishempire was the capitalistic empire with maritime trade dominance. Consequently, it had theleading position in terms of international trade and financial development. Moreover, the inter-national monetary system, the gold standard, gravitated around the British hegemony. The cityof London was the epicenter of global finance.
31

Figure 3.1: The Empires at the beginning of the twentieth century. Source: Wikipedia
Figure 3.1 shows that the British empire was not alone. It shared geopolitical control inEurope with the Austro-Hungarian, Prussian, French and Russian empires. In Asia with theOttoman, Russian and Japanese Empires. In Africa, with the French, Prussian and Belgianempires. In North America with the United States; the emergent economy by then.
Furthermore, a structural transformation was undergoing in the global economy. Two new keyinputs for the production and allocation of goods had emerged; electricity and oil. Additionally,a new way of producing and allocating goods was developed in the US. In particular, a new labororganization mechanism- the assembly line- enabled the development of a dominant design formassive production and consumption: the automobile Ford T-Model.
However, the boom in the US productivity was translated into a deflationary crisis for thedominant empires. As a consequence, unemployment rates rose in the developed world. Figure3.2a shows that the unemployment rates of the developed countries -UK, Germany, - were higherthan 12% between 1910 and 1939. For the US, it fluctuated reaching a maximum of 25% in theGreat Depression of 1929.
CW I began with a major global financial crisis; the panic of 1907 caused by the fall of theKnickerbocker Trust Company. In order to restore the US financial system, J.P Morgan alongwith several bankers made a coordinated action to inject liquidity into the American financialsystem. The compelling need of a lender of last resort with the power to restore financial stabilitycaused the creation of the US Federal Reserve (FED) in 1913.
One of the biggest advantages of the US to manage an economic crisis was being out of thegold standard. The US had the flexibility to increase the monetary supply without the need ofan equivalent amount in gold. Therefore, monetary policy was key to alleviate unemployment.In contrast, empires inside the gold standard adopted protectionist policies and wars in order togain a competitive advantage in a zero sum game for global domination.
Imperial protectionist policies were unsuccessful. Indeed, some researchers argue they pro-longed the deflationary crisis for decades [14]. The mercantilist gold standard was in decadence.It was not compatible anymore with the need of capital and liquidity for the new global econ-omy. Structural reforms in order to improve the global governance mechanisms in politics andeconomics were needed. However, these reforms also implied a decrease of power in the dominantautocracies. The empires were trapped in a loss-loss situation where economic crisis, war andrevolutions were very recurrent events.
In fact, Japan was the military challenger of the Tsar Russian empire in Asia. Prussia themilitary challenger of the British empire in Europe. In 1913 the British Empire was out the GoldStandard in order to print money to finance the military race. WW I broke out in 1914. TheUK, Russia and France formed an alliance in order to face the threat coming from the centralpowers: Prussia, the Austro-Hungarian and Ottoman Empire.
In the aftermath of the WW I the international distribution of geopolitical power changed.The Ottoman, Prussia, Austro-Hungarian and Tsar Russian empires disappeared. In fact, in1917, the Russian revolution ended with autocratical Tsar Russia. It was replaced by the USSRin 1924.
Although, Britain was one of the winners of WW I, the massive military spending plungedthe British empire into a severe deflationary crisis. Britain incurred debts equivalent to 136%of its gross national product. Its major creditor was the US. Staple wartime industries suchas: coal, ship-building and steel, contracted. Working women were forced to cede their jobs toreturning soldiers. Figure 3.4c shows how the UK consumer price index changed abruptly from25% inflation rate in the war time into a deflation rate of -15%.
32

(a) Unemployment rates in the devel-oped nations. Source:Unemployment:risks and reactions / Nikolai Genov,http://library.fes.de/fulltext/bueros/sofia/00621toc.htm
(b) Value of one Gold Mark in paperMarks. Source: Wikipedia, basedon numbers in Table IV (page 441)of The Economics of Inflation byCostantino Bresciani-Turroni, pub-lished 1937.
(c) UK 3 months bills interest and consumer price index rate. Source: Bank of England
Figure 3.2: Some macro indicators in CW I
33

Germany had the worst outcome after WW I . The Versailles treaty trapped Germany in aharsh and unsustainable economic situation. Belgium and France occupied strategic raw mate-rials regions in order to ensure war reparation payments. German mines were on strike. TheGerman central bank financed in silence the worker’s resistance by printing money. The use ofmonetary policy with political aims beyond the economic needs ended in a massive hyperinflationin the Weimar Republic. Figure 3.4b shows the equivalence of one Gold Mark into paper Marks.In 1924 one gold mark was equivalent to 1 trillion paper marks.
In general , unemployment and social unrest was a major problem in the aftermath of WWI. Figure 3.4a also shows the high unemployment rates in Europe after WW I . As a consequence,“the reconstruction of the international order after World War I put great emphasis on social re-forms through the International Labor Organization (ILO). Three types of arguments were usedto promote social reform. The first asserted that international economic competition meant thatsocial reform had to be coordinated internationally in order to maintain the relative competitive-ness of countries. The second proposed that social reform was necessary to preserve the stabilityof states, and hence the stability of the international system. The third appealed for internationalaction on the basis of common notions of human dignity. The idea that common concern abouthuman dignity demanded international action became an assertion of human rights.”[18]
On the contrary, the unemployment level in the United States was low. The US was focusedon free market structural reforms1 able to foster the massive production and consumption ofgoods. Indeed, the US proved that a capitalistic democracy is more efficient than trade empiresfocused on geopolitical dominance.
After WW I the US emerged as the new economic leader. When the war began, the US was anet debtor in international capital markets. But following the war, the US began investing largeamounts internationally. Particularly, to Latin America, thus taking on the role traditionallyplayed by Britain and other European capital exporters. With Britain weakened after the war,New York emerged “as London’s equal if not her superior in the contest to be the world’s leadingfinancial center.”[19]
However, the US president Wilson’s market de-regularization structural reforms along withgreat innovations in productive techniques, before and after the war, raised the output of industrybeyond the purchasing capacity of US farmers and wage earners. Natural monopolies emergedin the oil, banking and infrastructure industries. The savings of the wealthy and middle class,increased far beyond the possibilities of sound investment. The frenetic speculation in stocksand real estate triggered the global stock exchange crash. In 1929, the world entered in a globaldepression.
The salience for reforms was drastic around the world. President Roosevelt in the UnitedStates promoted a set of policies in order to recover the US economy. These policies weredivided in the trilogy of -relief, recovery and reforms- known as the New Deal. In contrast,the new democracies in Europe adopted again protectionism policies with the aim of defendinglocal employment. Nationalism movements emerged in Germany, Japan and Italy. Fascism andmilitarism emerged as an autocratic movement promising geopolitical leadership and economicgrowth. Moreover, in the USSR, Stalin transformed the USSR into an autocratical regime. Thelack of reforms and high unemployment levels in Europe, triggered military coalitions and warsas the only way to get a competitive advantage in a zero sum game for global domination.
WW II began in 1939 and it ended in 1945 with the US use of the nuclear bomb in Hiroshima1The Wilson reforms can be resumed in three acts the UNDERWOOD-SIMMONS ACT into law in 1913,
which reduced tariff rates. The FEDERAL RESERVE ACT, which made the nation’s currency more flexible.The gold standard still made currency too tight, and loans were too expensive for the average American. Wilsonsigned the FEDERAL RESERVE ACT, which made the nation’s currency more flexible. Finally, the CLAYTONANTITRUST ACT OF 1914 clarified the Sherman Act by specifically naming certain business tactics illegal.
34

and Nagasaki. The aftermath of WW II was a new technological and geopolitical era. Therewas a global technological revolution in the automobile, petrochemicals, airplanes and electricalindustries. The world was divided into two blocs under the leadership of the US and the SovietUnion. Japan’s defeat consolidated the Communist revolutionary party in China. The inter-national monetary system was updated to the new reconfiguration of geopolitical power. TheBretton Woods standard together with the International Monetary Fund were created.
Table 3.1 summarizes the most important historical attributes of CW I.Attribute Currency War I
Players Part ICapitalistic Empires The United Kingdom, FranceMercantilist Empires Tsar Russia, Prussia, Austro Hungarian, OttomanCapitalistic States The United StatesPlayers Part II
Parliamentarian Democracies The United Kingdom , FranceNationalistic States Nazi Germany, Japan , ItalyCommunist States Soviet UnionCapitalistic States The United States
Major Economic Crisis Panic 1907, Great Depression 1929-1939Monetary Policy Floating currencies out of the gold standard
International monetary standard in decadence Gold standard.Protectionism Trade barriers to cottom, trade taxes
Wars and new domains of warfare WWI & WWIIStructural Reforms and Reformers Wilson pro-market and Roosevelt new dealProcastinators and Autocracies Tsar Russia, Otoman and Austro Hungarian.
Political revolutions and surrender treaties Russian Revolution, Versailles, Yalta, Postdam.Technological Revolutions Oil, Automobile, Airplanes, Chemistry, Electricity.Geopolitical Coalitions Allies- Central Powes. Allies- Axis.
New emerging international monetary standard Bretton Woods and the international monetary fund (IMF).
Table 3.1: CW I main historical attributes
3.1 Games’ sequences Currency War I part IIn order to make easier the analysis of CW I part I with the game theory framework, I di-
vided the “tournament” in six groups. They are classified according to the differences betweenthe governance mechanisms in politics and economics. For instance, Figure 3.3a shows capi-talist empires (UK and France) versus central mercantilist empires (Prussia, Austro-Hungarian,Ottoman empires). Figure 3.3b shows allied mercantilist empires (Tsar Russia) versus centralmercantilist empires. Figure 3.3c shows capitalist empires (UK and France) versus allied mer-cantilist empires (Russia). Figure 3.4a shows capitalistic empires (UK and France) versus thecapitalistic state (US). Figure 3.4b shows allied mercantilist empire (Russia) versus the capital-ist state (US). Figure 3.4c shows mercantilistic empires (Prussia, Austro-Hungarian, Ottomanempire) versus the capitalist state (US).
Moreover, the sequence of games is divided in 9 games. They are compared analogically withthe phases in chess: Opening, Middle Game, End Game. In general, I will show that the opening
35

is about protectionism and monetary policy. The middle game about coalitions and wars. Theend game is about structural reforms, failures in the coalitions and revolutions.
The most used strategies in CW I part I by the mercantilist empires were: protectionism,trade barriers, wars and coalitions. They avoided reforms that undermined their political power.Capitalistic empires also used protectionism and geopolitical strategies. However, the coalitionwith the United States allowed them to benefit from the US reforms and technological innova-tions.
Figure 3.3a shows that currency war between capitalistic and mercantilist empires began withglobal crisis represented by the PD. Capitalistic and mercantilist empires used trade barriers inorder to protect local employment. This strategy is equivalent to permutation 2->3. Thistransformed the PD into the conflict and loss-loss game families . The British empire was outof the gold standard and printed money to finance the arms race. However, the combinationbetween trade barriers and monetary policy transformed these games into the unfair family.Prussia, the Austro-Hungarian and Ottoman empires made a military coalition known as theCentral Powers. The UK, France and Russia retaliated with a military coalition known as theAllies. These strategies transformed the games from the unfair family into the crisis family.Central Powers began WWI . Allies retaliated also with war. Both players were trapped insidethe unfair and critical game families. Figure 3.3a shows the payoff of this confrontation. In theopening both players had positive payoffs. However, in the middle and end game they had heavylosses.
Although Russia was also an allied empire, Russia’s governance mechanisms were less modernthan capitalistic empires. For instance, Tsar monarchy were more autocratic than the imperialparliamentarian republics such as Prussia, Austro-Hungary, UK or France. In fact, the lack ofreforms and the infra human conditions of the Russian citizens triggered a political revolution.
Figure 3.3b shows that the currency war between Russia versus the Central Powers resemblesthat between UK & France and the Central Powers until the seventh game in the sequence. Whatmakes a difference is the Russian revolution. In this framework a revolution is represented bypermutation 1->4. It changed the game from the critical into the win-win family. Indeed, BothSoviets and Central Powers benefited from having the Imperial Russia out of the war. Figure3.5b shows the game’s sequence payoff for this strategic confrontation. It shows that after therevolution (game 7) the Central Powers stopped losses. Russia needed one step more (after game8) because of the costs associated to a revolution in our framework.
Figure 3.3c shows that the currency war between the capitalistic and mercantilist empiresonly had economic characteristics. Moreover, it shows that both geopolitic blocs competed byusing trade barriers and printed money by being out of the gold standard. Easing monetarypolicy transformed the prisoner’s dilemma into the Chicken game. Then by forming a coalitionbetween them (allied empires), they transformed the Chicken game into the Aligned game fromthe win-win family. Subsequently, the Russian revolution transformed the Aligned game into acritical situation represented by the Missile Crisis game. The figure also shows that by usingmonetary policy, the game was transformed from the critical family into the unfair family. Inthis strategic setting the Soviet Union was better off than the capitalistic empires. Figure 3.5cshows the game’s sequence payoffs for this particular strategic situation. In the opening bothgeopolitical blocs had a positive payoff. In the middle game they had heavy losses. In the endgame they had a strong recovery.
36

(a) UK & France versus Central Powers games’ sequence
(b) Russia Vs Central Powers games’ sequence
(c) UK& France versus Russia games’ sequence
Figure 3.3: The strategic confrontation between Empires.CW I part I. Game sequence empires and theUnited States. Flags indicates geopolitical powers in conflict. The boxes’ color indicates the game family.Purple: Loss-Loss. Pink: Conflict. Orange: Unfair. Yellow: Second Best. Gray: Critical. Blue-Marine:biased. Green: Win-Win. Red boxes represent the Nash equilibria in pure strategies.
The strategic confrontation between the UK & France and the US was the less intense.It ended in a win-win situation. Figure 3.4a shows that while capitalistic empires used tradebarriers in order to protect local employment, the US used monetary easing policy in order toinject liquidity to the economy. Indeed, this transformed the initial PD into the Hegemony gamefrom the unfair family. The Nash equilibrium of this game is the US win (4) and UK & Franceloss (2). Subsequently, the geopolitical coalition between UK, France and the US, transformedthe Hegemony game into the Benevolent game from the biased family. In the Benevolent gamethe UK & France get the best outcome while the US the second best. Finally, the US Wilsonstructural reforms transformed the Benevolent game into the win-win family. Figure 3.5d shows
37
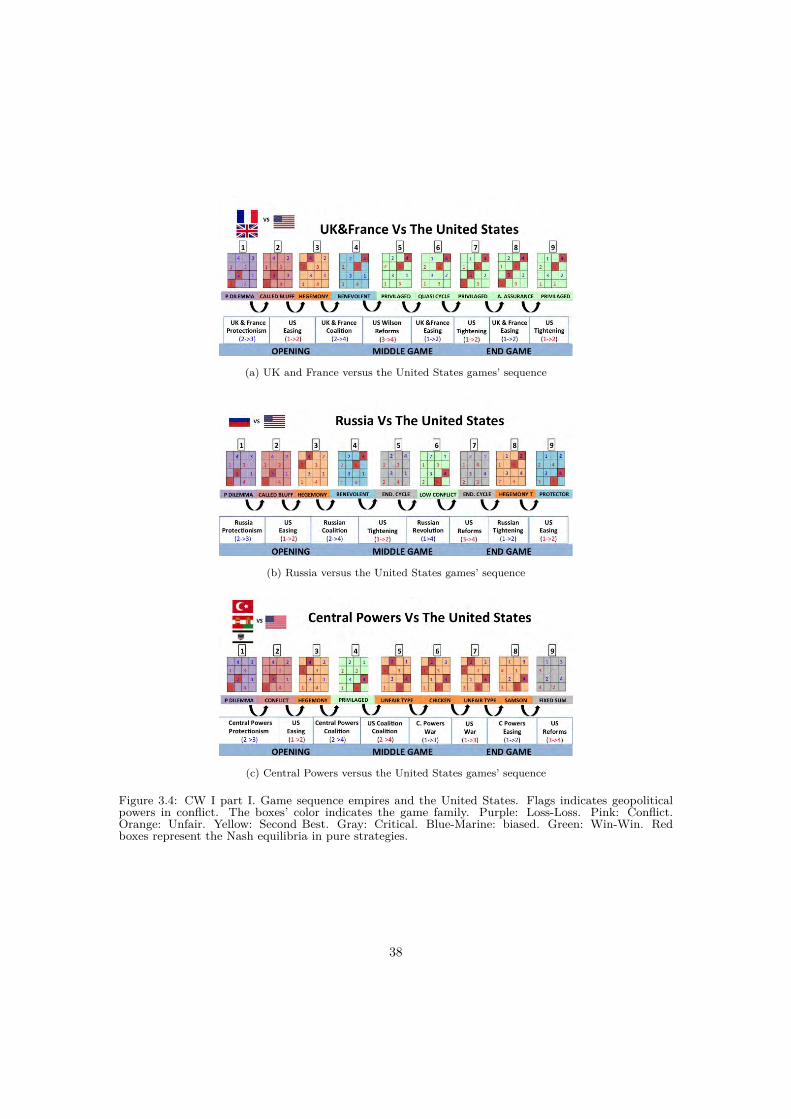
(a) UK and France versus the United States games’ sequence
(b) Russia versus the United States games’ sequence
(c) Central Powers versus the United States games’ sequence
Figure 3.4: CW I part I. Game sequence empires and the United States. Flags indicates geopoliticalpowers in conflict. The boxes’ color indicates the game family. Purple: Loss-Loss. Pink: Conflict.Orange: Unfair. Yellow: Second Best. Gray: Critical. Blue-Marine: biased. Green: Win-Win. Redboxes represent the Nash equilibria in pure strategies.
38

the game’s sequence payoffs. In the opening both geopolitical blocs had positive payoffs. Inthe middle game losses. In the end game after the US reforms (game 6) both geopolitical blocsbenefited from the mutual coordination spillovers.
The currency war between the Russia and the US was almost the same as that between UK& France versus the US. However, the Russian revolution transformed the game from the win-win family into a neighborhood with games from the critical, unfair and biased family. Figure3.5e shows the games’ sequence payoffs. It shows Russia was better off than the US in the first5 games, however, after the Revolution the US was better off than Russia. Both geopoliticalpowers ended with a favorable outcome.
Finally, the currency war between the US and the Central Powers was represented by games’from the unfair family. In particular, the US and the Central Powers were playing a Chickengame where wars did not change the structure of the game. However, at the end of the sequencethe US structural reforms transformed the games from the unfair family into the critical family.Figure 3.5f shows the game sequence payoff. In the opening by avoiding confrontation bothgeopolitical blocs had a positive payoff. In the middle game, war benefited more Central Powersthan the US. In the end game the implementation of US structural reforms created a criticalsituation for both geopolitical powers.
The US general strategies were to use monetary policy, to avoid initial confrontations andfinally to implement structural reforms. On the other hand, capitalist and mercantilist empiresused trade barriers, wars and coalitions. They avoided or procrastinated reforms. Figure 3.6shows the total payoffs by geopolitical power. It shows that the losers of CW I were the mercan-tilist empires. They are Prussia, Austro-Hungarian, Ottoman and Russian empires. Russia wasan allied country, however his inefficient governance mechanisms in politics and economics andthe intensity of the war triggered the Russian revolution. The coalition between UK, France andthe US allowed the creation of a win-win situation that benefited from the innovation comingfrom the US.
Although WW I ended, the currency wars had not ended. The governance mechanisms inpolitics and economics had deep transformations. After the war, the strategic confrontation isbetween, Capitalistic Empires (UK & France), Capitalistic State (US) the Nationalistic States(Nazi Germany, Italy, Japan) and the Communist State ( The Soviet Union).
39

(a) UK&France versus CentralPowers
(b) Russia versus Central Pow-ers
(c) UK & France versus Russia
(d) UK & France versus theUnited States
(e) Russia versus the UnitedStates
(f) Central Powers versus theUnited States
Figure 3.5: CW I part I games’ sequence payoff.
Figure 3.6: The total payoff is computed as a sum of the payoffs of each player’s games.
40

3.2 Game sequence CW I part IIAgain the “tournament” is classified in six groups based on the governance mechanisms in politicsand economics. In this case the confrontation is between capitalistic empires (UK and France),the only capitalistic state (US), the nationalist states (Axis: Nazi Germany, Italy and Japan) andthe Communist state (USSR). Figure 3.7a shows the currency war between the UK-France versusthe Axis. Figure 3.7b shows the currency war between UK-France versus the USSR. Figure 3.7cshows the currency war between the Axis and the USSR. Figure 3.8a shows the currency warbetween the UK & France versus the United States. Figure 3.8b shows the currency war betweenthe US versus the USSR. Figure 3.8c shows the Axis versus the United States.
The strategies in the confrontation between capitalist empires (UK & France) and national-istic states(Axis) were focused on protectionism, monetary policy, military coalitions and wars.Both blocs avoided reforms. Figure 3.7a shows that both geopolitical blocs were trapped insidethe loss-loss, unfair and critical families. In particular the opening of the currency war was de-fined by the combination of protectionism and monetary policy. The middle game was definedby coalitions or conflict escalations. The end game was defined by the combination of wars andmonetary policy. Figure 3.9a shows the games’ sequence payoffs. In fact, it shows that in theopening both blocs had positive payoffs. In the middle and end game both blocs had heavylosses.
In the currency war between the Germany and the Soviet Union both geopolitical powerswere trapped in protectionism and political chaos. The emergence of Nationalism in Germanyand the Stalin’s autocratic Communism in the USSR focused the attention of their citizens onforeign policy rather than on structural reforms. Moreover, the USSR did not have a definedposition about the Nazi Germany. Inspite of the fact that one of the natural enemies of the Naziswere the Communists, both geopolitical blocs have an initial peace agreement at the beginning ofthe WW II. Indeed, they split Poland among them. However, the Nazi Germany did not honorthis agreement for a long time. In June 1941, the Axis attacked the USSR in the operationBarbarrosa. The USSR was in war against Germany. Subsequently, it was forced to form acoalition with the allies in order to join forces to face the Axis.
Figure 3.7b shows the currency war between UK & France versus the Soviet Union. Beforethe war, the strategic situation was defined by trade barriers and the lack of an internationalmonetary system. The initial agreement between the Soviets and Nazis transformed the gamesfrom the loss-loss and unfair family into the critical family. In this configuration both blocs hadheavy losses. However, with the attack of the Nazi Germany and the setting of the new coalitionbetween UK & France and the Soviet Union transformed the game from the critical family intothe win-win family. Figure 3.9b shows the game sequence payoffs. In the opening both countriesget a mutual benefit. In the middle game both blocs have heavy losses. In the end games bothblocs have an strong recovery, however the USSR recovery came one step later.
Figure 3.7c shows the currency war between the USSR and the Axis countries. In particular,it shows that before the war they were trapped in loss-loss and unfair family. By means of thepeace agreement they managed to transform the game into a second best situation. However,the Axis attack to the USSR transformed the second best game into a game from the criticalfamily. The Soviet war retaliation created a situation from the loss-loss family were the Sovietshad the worse outcome. By forming a new coalition with the allies, they managed to transformthe game from the loss-loss family into the battle of sexes type game. Figure 3.9c shows thegame’s sequence payoff. In the opening the Soviets get a tiny advantage over the Axis. In themiddle game the Soviets had heavy losses while the Axis payoff had an slight increment. In theend game both countries had a recovery.
41

(a) UK & France versus Axis
(b) UK&France versus the Soviet Central Powers
(c) UK&France versus the Soviet Union
Figure 3.7: CW I Part II. Flags indicates geopolitical powers in conflict. The boxes’ color indicates thegame family.Purple: Loss-Loss. Pink: Conflict. Orange: Unfair. Yellow: Second Best. Gray: Critical.Blue-Marine: biased. Green: Win-Win. Red boxes the Nash equilibria in pure strategies.
The general strategy for the US was to use monetary policy, be active in reforms (New deal)2 and postpone the war until the last moment. Figure 3.8a shows the currency war between theUK & France and the US. In the opening of the currency war the strategic conflict was trappedin the loss-loss, conflict family. In the middle game, the strategic situation was transformed intothe unfair family. UK & France coalition with the US along with the Roosevelt transformed thegame from the unfair family into the win-win and biased families. Figure 3.9d shows the games’sequence payoffs. In the opening both geopolitical blocs had positive payoffs. In the middle game
2In the Roosevelt new deal the key acts were: EMERGENCY BANKING ACT. In 1933 the GLASS-STEAGALL BANKING REFORM ACT. Source: http://www.ushistory.org/us/43g.asp This work by The In-dependence Hall Association is licensed under a Creative Commons Attribution 4.0 International License.
42

the UK & France payoff remained stable while the US payoffs were positive. In the end gameboth geopolitical blocs were able to benefit from the mutual coordination spillovers. However,the US had a stronger recovery than UK & France.
Figure 3.8b shows the strategic confrontation between the US and the USSR. The openinggame was characterized by the use of monetary policy and trade barriers. The initial PD wastransformed into conflict and unfair games’ families. In the middle game, the Soviet coalitionwith the axis transformed the game into the Missile Crisis game. The US structural reformstransformed the game into the biased family. The Axis attack over the Soviet Union along withthe new coalition between the Soviets and the Allies, transformed the game from the biasedfamily into the endless crisis game. Figure 3.9f shows that the soviets had heavy losses inthis confrontation. For the US this confrontation only provided a tiny competitive economicadvantage.
Figure 3.8c shows the strategic confrontation between the Axis and the United States. In theopening both blocs were trapped in the loss-loss and conflict family. The middle game began withthe Axis military coalition that transformed the PD into the critical family. The US strategywas to postpone its entrance to the war. Meanwhile, they used monetary policy and structuralreforms as a way to gain a competitive economic advantage. In the end game the reforms andwar transformed the game into the conflict and the biased games’ family. Figure 3.9g shows thegame’s payoff sequence. In the opening both blocs had a positive payoffs. In the middle gamethey had heavy losses while in the end game both had a strong recovery.
43

(a) UK& France versus the United States
(b) The Soviet Union versus the United States
(c) The Axis versus the United States
Figure 3.8: CW II Part II game’s sequence. Flags indicates geopolitical powers in conflict. The boxes’color indicates the game family.Purple: Loss-Loss. Pink: Conflict. Orange: Unfair. Yellow: SecondBest. Gray: Critical. Blue-Marine: biased. Green: Win-Win. Red boxes represent the Nash equilibriain pure strategies.
44

3.2.1 Payoffs’ sequence Currency War I part II
(a) UK&France versus Axis. (b) UK&France versus The So-viet Union.
(c) Axis versus USSR.
(d) UK&France versus TheUnited States.
(e) US versus USSR . (f) Axis versus US .
Figure 3.9: CW I Part II payoffs.
Figure 3.10: Total payoffs CW I part II by geopolitical power. The total payoff is computed as a sum ofthe payoffs of each player’s games.
45

The winner of the CW I was the US. The rest of geopolitical powers had heavy losses. The USpostponed the military confrontation until the end of WW II. The US was focused on monetarypolicy, coalition and structural reforms. The UK & France benefited from the coordinationspillovers after the coalition with the US. The Soviet Union coalition ambiguous strategy, first ina no aggression pact with the Axis and after in a coalition against the axis was very costly. Figure3.10 shows that the geopolitical power with more losses were the Axis and the Soviet Union. UKand France had also heavy losses, however thanks to the US reforms and their coalition with theUS they managed to recover a lot of their losses.
Both sub currency wars showed common patterns. The opening is characterized by protec-tionism and monetary easing policy. In general every player involved in a currency war had apositive payoff in the opening. The middle game is characterized by coalitions and wars. Coun-tries had heavy losses. The end game is characterized by reforms and wars. There is a strongrecovery in the countries with reforms and their allies.
In the aftermath of CW I the autocratic regimes as the Empires and National States dis-appeared. The world is divided in two governance mechanism in politics and economics: theWelfare and Communist states. Humankind experiment a surreal transformation from the belleépoque into blood, panic and self destruction. The international monetary system was the fingerprint of this transformation. The gold standard based on no trust among geopolitical powers,was replaced by the bretton woods standard. It was based on US dollar-gold parity. A globaltechnological revolution in the automobile, petrochemicals, airplanes and electrical industriesallowed countries to remain coordinated in a win-win situation.
46

Chapter 4
Currency war II: From theBretton Woods to the Petrodollar(1971-1992)
The dollar is our currency, but your problem. John Connally Secretary of Treasury 1971
4.1 Historical reviewIn the middle of the twentieth century the world was divided into two geopolitical blocs. Thewestern capitalistic coalition led by the US and the Communist bloc lead by the USSR. Moreover,Japan and the Federal Republic of Germany emerged as new economic powers.
In the backbone of the Cold War, there was a mutual annihilation scenario. For instance,submarines with nukes ready for retaliation in case of a nuclear attack, persuaded these twogeopolitical powers from avoiding a direct military confrontation. However, the Cold War trig-gered global political instability in the form of proxy wars and guerrillas [20].
For example, military confrontations and guerrillas wars were common in Latin America andAfrica. In Asia, Vietnam was the most important proxy war. Furthermore, the Korean peninsula,Cambodia, Laos and the Middle East were heavily affected by the struggle of power between theUS and the Soviet Union.
In the heart of Europe, Germany was divided into two blocs: West and Eastern Germany.West Germany was part of the US Marshall plan while Eastern Germany was controlled by theSoviet regime. The Berlin wall was the physical materialization of the iron curtain in the ColdWar. Figure 4.1 shows a map with the geopolitical influence of the US and USSR.
47

Figure 4.1: .Cold War geopolitical distribution among the US and USSR allies. Source: University ofNotre Dame. http://ocw.nd.edu/physics/nuclear-warfare/images-1/Cold-War-Map.jpg/
The UK and France succeeded in re-building their economies after the US Marshall plan.Their geopolitical power was reestablished. Both of them had a permanent chair in the securitycouncil of the United Nations (UN) and the North Atlantic Treaty Organization (NATO). How-ever, French president De Gaulle protested the United States’ strong role in the NATO and whathe perceived as a special relationship between it and the United Kingdom[21]. In fact, Francewithdrew from the NATO in 1958 [22]. France inconformity was not only about a secondaryrole in the geopolitical sphere but also in the international monetary system. In 1960, ValéryGiscard d’Estaing, French minister of Finance, coined the term “exorbitant privilege” referringto the fact that the United States had a reserve currency they could print [14].
The race for global domination between the United States and the Soviet Union reached thespace. The Soviets were the first to orbit the earth in 1964, while the American reached the moon1969. However, the contest for being a hegemonic power was not for free. Every geopoliticalpower racked up huge costs. This was reflected in the international monetary system, where thecore of the Bretton Woods standard -the parity between dollar and gold- was under question.
The Vietnam War was going to cost the USD 500 Billion. The stark reality was the US simplycould not print enough money to cover its war costs, it’s gold reserve had only USD 30 billion,most of its reserve was already backing existing USD dollars [23]. The government refused toraise taxes, therefore the only option remaining for the Nixon government was to make the dollarfloat freely.
Currency War II began with the collapse of the Bretton Woods standard in 1971 with the Ex-ecutive Order 11615, pursuant to the Economic Stabilization Act of 1970. This act was divided inthree orders. 1) the gold window must be closed. Foreign governments could no longer exchangetheir dollars for gold. 2) A 90-day freeze on wages and prices was to be implemented in orderto counter inflation 3) An import tariff was set at 10 percent to ensure that American productswould not be at a disadvantage because of the expected fluctuation in exchange rates[24].
But how to make the US dollar a sounding currency when the US was explicitly targeting acurrency devaluation? The answer was by using its hegemonic military power. Nixon signed adeal with Saudi Arabia exchanging petrodollars for military protection in the region, ensuring anew international demand for US dollar assets independent of the US internal economic growth.
48

“In a nutshell, any country that wants to purchase oil from an oil producing country has to doso in U.S. dollars. This is a long standing agreement within all oil exporting nations, aka OPEC,the Organization of Petroleum Exporting Countries. The UK for example, cannot simply buy oilfrom Saudi Arabia by exchanging British pounds. Instead, the UK must exchange its pounds forU.S. dollars. . .
This means that every country in the world that imports oil—which is the vast majority of theworld’s nations—has to have immense quantities of dollars in reserve. These dollars of courseare not hidden under the proverbial national mattress. They are invested. And because they areU.S. dollars, they are invested in U.S. Treasury bills and other interest bearing securities thatcan be easily converted to purchase dollar-priced commodities like oil. This is what has allowedthe U.S. to run up trillions of dollars of debt: the rest of the world simply buys up that debt inthe form of U.S. interest bearing securities.” [25]
The international monetary system was no longer gravitating around the Bretton Woodsgold-dollar but around the new oil-dollar hybrid. The “petrodollar” agreement made the dollarstability more susceptible to geopolitics and the relationship between Islamic countries and Israel.The soviets were able to exploit this vulnerability. In 1973 they backed Syria and Egypt in theYom Kippur war [26]. On October 19, President Nixon authorized a major allocation of armssupplies and USD 2.2 billion in appropriations for Israel. In response, Saudi Arabia declared anembargo against the United States, later joined by other oil exporters and extended against theNetherlands and Japan, causing the 1973 energy crisis [27]. As the dollar was floating freely, theoil barrel raised from USD 3 to nearly USD 12. Every major economy in the world was under aninflationary shock. Figure 4.2 shows the inflation of major economies - US, Average Euro Area,Japan, UK, Canada and Australia- during currency war II.
Japan was an early victim of the currency warfare. First the tariff imposed by the NixonGovernment 1971 and then the oil embargo of 1973 put the Japanese economy under pressure.The Japanese economy was particularly vulnerable to the fluctuation of the yen/dollar exchangerate for several reasons. 1) Japan’s trade and virtually all of its financial transactions wereconducted in dollars. 2) Japan, as the largest creditor country by that time, had accumulated ahuge amount of unhedged dollar assets which were concentrated in US government bills andbonds, and whose values would depreciate whenever the dollar fell. 3) Japanese industriesexhibited relatively low exchange pass-through (the degree of domestic price response to exchangefluctuations) and their products contained relatively high domestic added value. If the yen isappreciated, their yen-denominated costs would also rise almost proportionately, leading to theloss of competitiveness. As a result, Japanese output and investment was stagnating, prices andwages were suppressed, and financial strain was created[28].
Some economists argue that the Japanese economy had structural advantages to deal withoil shocks in the long-run. For example, the Japanese cars were more fuel efficient than theirAmerican competitors. Moreover, the Japanese economy shifted its emphasis away from pri-mary and secondary activities (notably agriculture, manufacturing, and mining) to processors,telecommunications and computers [29].
Nevertheless, from the perspective of the Americans, Japan was using unfair competitivestrategies such as dumping. Indeed, US politicians accused Japan of deliberating currency de-valuation with respect to the US dollar in order to boost Japanese exports. The result was anAmerican “Japan bashing”, with threats of tariff and quotas on imports of goods from Japan,unless the yen appreciated[24].
Japan was not the only country affected by the Nixon policies. The European Communitycountries (ECC) developed a monetary coordination mechanism known as the “Snake in theTunnel ” in order to ensure European currencies’ stability with respect to the US dollar. TheSnake set bands of ±2.25% for currencies to move relative to their central rate against the US
49

dollar. This provided a tunnel in which European currencies traded. However, it implied muchlarger bands in which they could move against each other: for example if currency A started atthe bottom of its band it could appreciate by 4.5% against the dollar, while if currency B startedat the top of its band it could depreciate by 4.5% against the dollar [30].
Figure 4.2: Inflation in the developed countries during currency war II. Source: ECB
Despite of the geopolitical success of the Soviets in the Middle East, the Communist bloc wasnot stable. Communism in China and the USSR was very divergent. In 1964, China tested itsfirst nuclear bomb. Differences were evident in borders conflicts between China and the USSR.In 1966, the Chinese had revived the matter of the Russo-Chinese border that was demarcatedin the 19th-century. In 1971 the Republic of China was out of the UN security council, and thePeople’s Republic of China took their place, despite of the US opposition.
China was facing three enemies at the same time, USSR, US and the risk of a politicalrevolution. A reestablishment of relationship with the US was key for the survival of the Maomovement [31]. In 1972 US president Nixon made a historically important visit to the People’sRepublic of China. The three objectives for the Nixon trip were: 1) to embrace People’s Republicof China for peaceful settlement of Taiwan. 2) to settle peacefully the Vietnam War and 3) todeter Soviet Union’s sphere of Communist influence after the Sino-Soviet Split[32]. China beganits road to modernization and reforms.
In 1979, the Iranian revolution1 led to a sudden jump in oil prices. Stagflation (high inflationand low growth) was a threat for the global economy. Reforms and a change in foreign policywere needed around the world. That was exactly what the leadership of Reagan in US andTatcher in the UK was about - doing structural pro-market reforms-. In fact, the pillars of the
1Iran was a not aligned country in the Cold War
50

Reagan economic agenda were: 1) reducing government spending, 2)reducing the federal incometax and capital gains tax, 3) reducing government regulation, and 4) tightening the money supplyin order to reduce inflation.
Consequently with these policies, Paul Volker, the US Federal Reserve Chairman raised thefederal funds rate, which had averaged 11.2% in 1979, to a peak of 20% in June 1981 in order tocontrol inflation expectations. Although these anti-inflationary measures triggered a recessionin the US in the short term, they also enabled the path for a new economic boom in US in themid-term.
In the UK, Thatcher’s political philosophy and economic policies emphasized deregulation(particularly of the financial sector), flexible labor markets, the privatization of state-ownedcompanies, and the reduction of power and influence of trade unions. In foreign policy Reaganand Thatcher were natural allies facing the soviet threat. The "Reagan Doctrine" controversiallygranted aid to paramilitary forces seeking to overthrow communist or leftist governments, partic-ularly in Latin America and Afghanistan[33]. Whereas, Thatcher’s cold war policy was focusedon reestablishing the diplomatic channel with USSR. She was able to read from the beginningthat Gorbachev was a very different Soviet leader.
“I am cautiously optimistic. I like Mr. Gorbachev. We can do business together. We bothbelieve in our own political systems. He firmly believes in his; I firmly believe in mine. We arenever going to change one another. So that is not in doubt, but we have two great interestsin common: that we should both do everything we can to see that war never starts again, andtherefore we go into the disarmament talks determined to make them succeed. And secondly, Ithink we both believe that they are the more likely to succeed if we can build up confidence inone another and trust in one another about each other’s approach, and therefore, we believe incooperating on trade matters, on cultural matters, on quite a lot of contacts between politiciansfrom the two sides of the divide”. Margaret Thatcher BBC Interview May 1984 2
In Asia, the Japanese prime minister Nakasone embraced the privatization initiative, whichled to the breakup of Japan National Railways into the modern Japan Railways Group. Never-theless, Japan procrastinated the reforms needed after the catch-up period. Japan was reluctantto US free markets changes because they wanted to keep the characteristics of their own eco-nomic model[28]. In foreign policy Japan normalized international relationships with China andRussia, however geopolitically Japan remained military allied of the US.
The most radical reforms in Asia were not in Japan but in China. Led by Deng Xiaoping in1978, China began a program of reforms summarized in -change, reform and “open up”-. Thereforms, also known as Socialism with Chinese characteristics, were divided in two stages. Thefirst stage, in the late 1970s and early 1980s, involved the decollectivization of agriculture, theopening up of the country to foreign investment, and permission for entrepreneurs to start-upbusinesses. However, most industries remained state-owned. The second stage of reform, inthe late 1980s and 1990s, involved the privatization and contracting out of much state-ownedindustry and the lifting of price controls, protectionist policies, and regulations, although statemonopolies in sectors such as banking and petroleum remained. [34]
In Continental Europe, Kohl, the German chancellor was focused on strategies to ensureGerman unification. In France, president Mitterrand was focused on the industrial modernizationand the creation of the European Union. Moreover, the exchange rate mechanism (ERM) wasintroduced in 1979. Its main objective was to reduce exchange rate volatility and to achievemonetary stability in Europe, in preparation for Economic and Monetary Union.
The ERM was based on the concept of fixed currency exchange rate margins, but with ex-change rates variable within those margins. Exchange rates were based on the European CurrencyUnit (ECU), the European unit of account, whose value was determined as a weighted average
2http://www.margaretthatcher.org/document/105592
51

of the participating currencies. The core of the ERM was the german D-Mark, the strongestEuropean currency by that time. A grid (known as the Parity Grid) of bilateral rates was cal-culated on the basis of these central rates expressed in ECUs, and currency fluctuations had tobe contained within a margin of 2.25% on either side of the bilateral rates (with the exceptionof the Italian lira, the Spanish peseta, the Portuguese escudo and the pound sterling, whichwere allowed to fluctuate by ±6%) Determined intervention and loan arrangements protectedthe participating currencies from greater exchange rate fluctuations.3
The latecomer to the reforms was the USSR when Gorbachev took power as the GeneralSecretary of the Communist party of the Soviet Union. As de facto ruler of the USSR, hetried to reform the stagnating Party and the state economy in February of 1986 by introducingglasnost ("openness"), perestroika ("restructuring"), demokratizatsiya ("democratization"), anduskoreniye ("acceleration" of economic development).
In Geopolitics Gorbachev foreign policy agenda improved relations and trade with the Westby reducing Cold War tensions. He established close relationships with several Western leaders,such as West German Chancellor Helmut Kohl, U.S. President Ronald Reagan, and British PrimeMinister Margaret Thatcher. On 11 October 1986, Gorbachev and Reagan met in Reykjavík,Iceland, to discuss reducing mid-range nuclear weapons in Europe. In 1988 the Soviet Unionwithdrew its troops from Afghanistan.
A turning point in the nuclear race between US and USSR was the Chernobyl nuclear tragedyon the 26 April 1986. This nuclear tragedy was very different from former ones in the cold war.This time information about Chernobyl was not secret, it was open to the public and media. TheGlasnost policy introduced some months before by Gorbachev was proven right at his remedyfor widespread censorship and government secrecy. The explosion and attendant tumult, was asignal, that in the words of Gorbachev, “made absolutely clear how important it was to continuethe policy of glasnost.” Chernobyl gave Gorbachev the political capital to achieve reforms aimingto have a more transparent government and a less autocratic state. In 1989 a series of radicalpolitical changes occurred in the Eastern bloc. They were associated with the liberalization ofthe Eastern Bloc’s authoritarian systems and the erosion of political power in the pro-Sovietgovernments in nearby Poland and Hungary. The Berlin wall fell down in November of 1989 andwith that the cold war iron curtain. Fear and uncertainty was in the mind of European policymakers, as the future of Europe was difficult to predict.
"We do not want a united Germany. This would lead to a change to postwar borders andwe cannot allow that because such a development would undermine the stability of the wholeinternational situation and could endanger our security", Thatcher told Gorbachev”.4
The 8th of December of 1991 the USSR was dissolved when the presidents of the new Russia,Ukraine and Belarus (formerly Byelorussia), signed the Belavezha Accords, which declared theUSSR dissolved and established the Commonwealth of Independent States (CIS) in its place.The cold war finished and with that a new rebalance of economic power. The new internationalmonetary system was based on the USD dollar.
The European Monetary Union emerged as integration project to ensure peace and politicalstability in the region, containing the fears of a unified Germany. The European Monetary Unionhad two stages: first, the abolishment of capital movement restrictions. Second, the creation of acommon currency: the Euro. The UK joined the ERM in 1990 boosting the political support forthe Euro project. The German unification had a deep impact in the European Rate Mechanism.A reunified Germany implied more fiscal spending and a divergence between the policies neededby Germany and the rest of the ERM countries. Germany financed the reunification by borrowing
3This is based on the European Commission reports about the evolution of the European Monetary Systemhttp://ec.europa.eu/economy_finance/euro/emu/road/ems_en.htm
4http://www.margaretthatcher.org/document/112006
52

money. It went from a budget surplus country the year before the unification to a deficit of 153billion German D-Marks.
Germany had a structural need of a stronger German D-Mark reflecting the import of foreigncapital to fund the unification. France was reluctant to a Franc devaluation respect to theGerman D-Mark, because it would imply an abandonment of the “Franc Fort”, the center pieceof its internal economic policy. The only adjustment mechanism for this trade imbalance wasinflation. Germany extraordinary fiscal spending and the lack of a flexible foreign exchangesystem caused an increase in inflation expectations. The Bundesbank had to rise interest rateto contain inflation in a moment where many ERM economies were close to a recession[30]. Inparticular, Italy and the UK. In 1992 , George Soros took advantage of the vulnerability in theERM system. He designed a massive short trade over the British pound against the GermanD-Mark based in the rationale that the UK macroeconomic policy was contradictory with theERM pegged system. In fact, he was in the “hall of fame” of finance with the equivalent of 1billion USD in profits.
Table 4.1 summarizes the most relevant events in geopolitics and economics necessary to usethe game theory framework.
Attributes Currency War II
Geopolitical Powers US, UK , FRANCE
Geopolitical Challengers Soviet Union (USSR)
Emergent Economy Japan and Germany
Wars Proxy Wars: Yom Kippur, Vietnam, South America and Africa guerrillas
Reforms US (Reagan) , UK (Thatcher), China (Deng Xiaoping)
Reform Procrastinators USSR, JAPAN
Revolutions Iran
Hyperinflationary Episodes Latin America (80s)
Technology Revolutions Microprocessor, electronics, telecommunications
Important Coalitions Economic: ERM, NATO , German Unification
Monetary standard in decadence Bretton Woods
Emergent monetary standard US dollar, petro-dollar
Table 4.1: Summary Currency War II
4.2 Games’ sequences Currency War IIThe most important geopolitical powers in Currency War II were: US, UK, France, Germany,
USSR, Japan and China. For convenience, I will reduce this set of seven countries into 5 geopo-litical blocs based on the similarities and differences in the governance mechanisms in politicsand economics.
For instance, the most important governance mechanisms were the capitalist states and Com-munists states. The US was the reference model from the first and the USSR for the second.However, there were different versions. For example in the case of capitalistic states the US andthe UK capitalism was focused on the geopolitical agenda. Welfare States (Germany and France)
53

were focused in the protection and promotion of the well-being of their citizens. Collective cap-italism was focused on long-term relationships, resulting in an economy based on “relationalmarkets”. On the other hand in the case of Communist States there were two variants. Aless autocratic Communist along with a planned economy (USSR) and a highly autocraticalCommunism along with a market economy (China).
I divided Currency war II in ten games’ sequences. They correspond to a 2X2 tournamentbetween US & UK, Germany & France, USSR, Japan and China. There were two blocs in militaryconfrontation the US & UK and USSR. The Germany & France bloc had common geopoliticalincentives with US & UK to face the USSR. However, their economics interest diverged. Japanwas aligned with the NATO countries, however it was not involved in any proxy war. In thetimes of Mao and Stalin, the USSR and China had common geopolitical interests. However,since the Sino-Soviet split there were strong economic divergences.
Moreover, as in CW I, the sequence of games is divided in 9 games. They are comparedanalogically with the phases in chess: Opening, Middle Game, End Game. In general, I willshow that the opening is about protectionism and monetary policy. The middle game aboutcoalitions and wars. The end game is about structural reforms, failures in the coalitions andrevolutions.
Figure 4.3a shows the currency war between the US & UK and the USSR. It shows that in theopening both blocs used trade barriers and monetary policy strategies. The games in this phasewere from the loss-loss, conflict families. In the middle game geopolitical powers used coalitionsand proxy wars. The games in this phase were from the critical family. The end game wasdefined by proxy wars and the dissolution of the soviet coalition. The games in this phase werefrom the critical, unfair and win-win families. Figure 4.6a shows the payoffs for the US&UK andUSSR currency war. It shows that in the opening both geopolitical blocs had positive payoffs.In the middle game both blocs had heavy losses. In the end game, the US&UK had a recoverywhile the USSR high costs associated with the USSR collapse.
Figure 4.3b shows the currency war between US & UK and Germany & France. It showsthat in the opening both blocs used trade barriers and monetary policy strategies. In the middlegame, both blocs had a geopolitical coalition among them. However, they used different monetarypolicy strategies to get a tactical advantage. Games in this phase were from unfair and loss-lossfamilies. In the end game, the coalition transformed the games into the biased family where bothblocs had a favorable outcome. Figure 4.6b shows the payoff for the US & UK versus Germany& France currency war. In the opening both blocs had positive payoffs. However, Germany&France had a higher advantage. In the middle game this advantage continued due the cost ofthe US & UK structural reforms. In the end game both blocs had positive payoff. However, thistime the advantage is for the US & UK.
Figure 4.3c shows the currency war between US & UK and Japan. It shows that in theopening both blocs used trade barriers and monetary policy. The games from this phase werefrom the loss-loss, conflict and unfair family. In the middle game both geopolitical blocs usedmonetary policy as the main strategy. The end game happened after the US structural reforms.It transformed the games into the critical family. Figure 4.6c shows the payoffs for the US & UKand Japan currency war. In the opening both blocs had positive payoffs. In the middle gameboth had positive payoffs. However, Japan had a higher advantage than the US & UK bloc. Inthe end game both blocs had heavy losses.
Figure 4.3d shows the currency war between US & UK and China. It illustrates that in theopening both geopolitical blocs used trade barriers and monetary policy. The games of this phasewere from the loss-loss, conflict and unfair family. In the middle game both blocs used monetarypolicy and the US structural reforms. The games of this phases were from the unfair and loss-lossfamilies. In the end game China also did structural reforms which transformed the games into
54

the win-win family. Figure 4.6d shows the payoffs for the US & UK and China currency war. Inthe opening both blocs had positive payoff. In the middle game China had an advantage overUS & UK. In the end game both blocs had a win-win situation.
Figure 4.4a shows the currency war between Germany & France and USSR. It shows thatin the opening both blocs used trade barriers and monetary easy policies. In this phase thegames were from the loss-loss and conflict family. In the middle game both blocs had militarycoalitions with opposite geopolitical interests. Moreover, they used proxy wars between them.In this phase the games were from the critical family. In the end game both countries avoidedproxy wars and just competed with monetary policy strategies. Transforming the game fromthe critical family into the second best family. Moreover, the dissolution of the Soviet coalitiontransformed the game into the original PD. Figure 4.6a shows the payoffs for the Germany &France and USSR currency war. It shows that in the opening both blocs had a positive payoffs.In the middle game both blocs had heavy losses. In the end game Germany & France had aweak recovery while the USSR had the cost associated to the collapse of the soviet coalition.
Figure 4.4b shows the currency war between Germany& France and Japan. It shows that inthe opening both blocs used trade barriers and monetary policy. The games of this phases arefrom the loss-loss and the conflict family. Both blocs had aligned geopolitical interest thereforethe confrontation among both focused on monetary policy in the middle and end game. Thegames from this phases were from the unfair and loss-loss family (PD Neighborhood). Figure4.6b shows the payoffs of Germany & France and Japan currency war. It shows that in everyphase both blocs had positive payoffs. However in the opening Japan had a higher advantage.In the middle game Germany & France had the advantage. In the end game Japan had theadvantage again.
Figure 4.4c shows the currency war between Germany & France and China. In the openingboth blocs used trade barriers and monetary policy strategies. The games were from the loss-lossfamily and the conflict family. In the middle game both blocs avoided military confrontationsand the strategies were based on monetary policy. The games of this phase were from the unfairfamily. In the end game Chinese structural reforms transformed the games into the critical andbiased families. Figure 4.6c shows the payoffs of Germany & France and China currency war. Inthe opening and the middle game both blocs had positive payoffs. In the end game both blocshad losses.
Figure 4.5a shows the currency war between Japan Vs China. The game sequence is equal tothe the currency war between Germany & France where the Chinese structural reforms trans-formed the games from the unfair family into the critical and biased family. Figure 4.6d showsthe the payoffs of Japan and China currency war.
Figure 4.5b shows the currency war between Japan and the USSR. In the opening bothblocs used trade barriers and monetary policy strategies. In this phase the games were fromthe conflict and unfair family. In the middle game both blocs avoided geopolitical confrontationbetween them, competing only by means of monetary policy strategies. The games in this phasewere from the unfair family. In the end game the dissolution of the USSR transformed the gamesinto the critical family. Figure 4.6e shows the payoffs of the Japan & USSR currency war. Bothblocs had positive payoffs in every phase until the dissolution of the USSR where they had losses.
Finally, figure 4.5c shows the currency war between the USSR and China. It shows that in theopening both blocs used trade barriers and monetary policy strategies. The games of this phasewere from the loss-loss and conflict families. In the middle game both blocs avoided geopoliticalconfrontations between them. They competed with monetary policy strategies. In the end game,the Chinese structural reforms and subsequently the USSR dissolution, transformed the gamesinto the critical and biased families. Figure 4.6f shows the payoffs from the USSR and Chinacurrency war. It shows that in the opening and the middle game they had positive payoffs. In
55

the end game they began with heavy losses but ended with a recovery. Chinese recovery wasstronger than the USSR.
Figure 4.7 shows the total payoff of CW II. It shows that in the opening the USSR, US &UK and Germany & France had the best payoffs. In the middle game Japan and China had thebest payoffs while the other blocs had losses. The USSR had the worst outcome in this phase.In the end game Japan and China had losses while Germany & France and the US & UK had astrong recovery. The USSR was the loser of CW II.
The patterns observed in CW I persist. The opening is characterized by protectionism andmonetary easing policy. In general every player involved in a currency war had a positive payoffin the opening. The middle game is characterized by coalitions and wars. Countries had heavylosses. On the other hand countries which avoided geopolitical strategies had favorable outcomes.The end game is characterized by reforms, wars and coalition dissolutions. There is a strongrecovery in the countries with reforms. The avoidance of reforms transformed the games into thecritical family.
In the aftermath of CW I the USSR disappeared. The US was the new hegemonic geopoliticalpower. The world is divided in three governance mechanism in politics and economics: the Wel-fare and Capitalist States along with communist autocracies with capital markets. Humankindexperiment transformation from mutual annihilation fear to a period of tremendous optimismand technological development. In fact, the global technological revolution in microprocessors,electronics and telecommunications enabled geopolitical powers to remain coordinated in a win-win situation.The international monetary system was the fingerprint of this transformation. TheBretton Woods standard, which in turn, was replaced for a pure fiat dollar monetary system.
56

(a) US&UK Vs USSR
(b) US&UK Vs Germany&France
(c) US&UK Vs Japan
(d) US&UK Vs China
Figure 4.3: .Currency War II games’ sequence Flags indicates geopolitical powers in conflict. The boxes’color indicates the game family. Purple: Loss-Loss. Pink: Conflict. Orange: Unfair. Yellow: SecondBest. Gray: Critical. Blue-Marine: biased. Green: Win-Win. Red boxes the Nash equilibria in purestrategies.
57
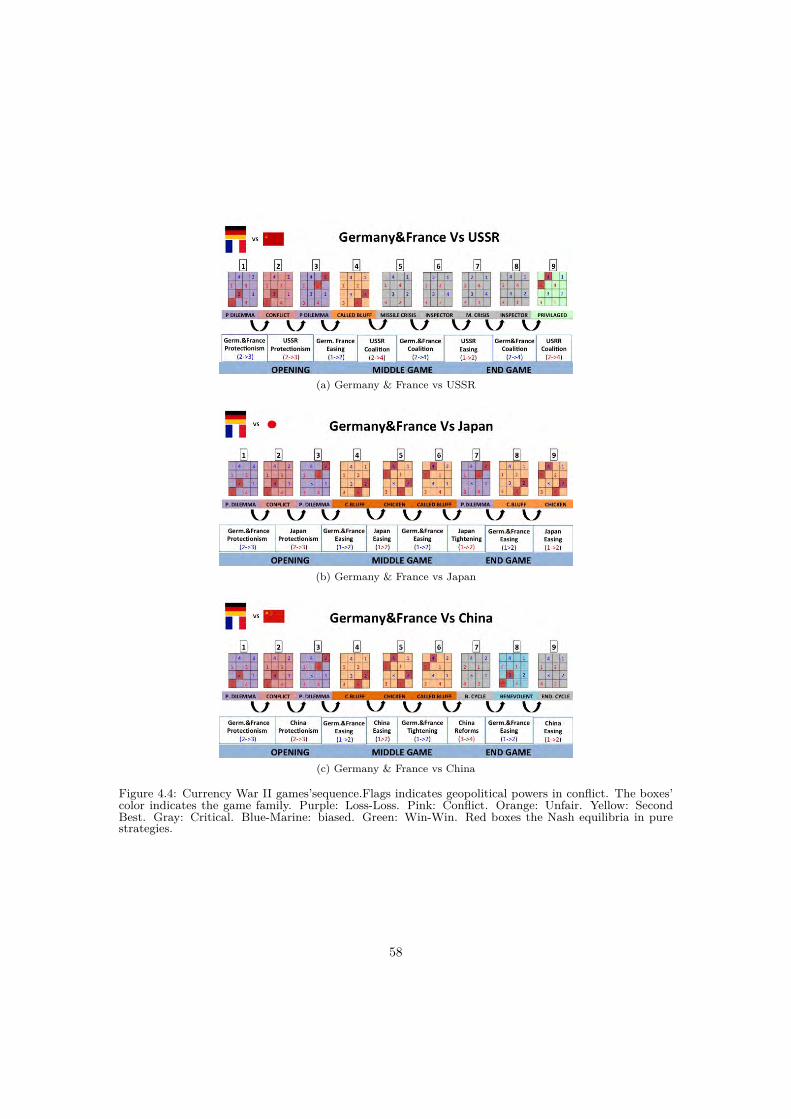
(a) Germany & France vs USSR
(b) Germany & France vs Japan
(c) Germany & France vs China
Figure 4.4: Currency War II games’sequence.Flags indicates geopolitical powers in conflict. The boxes’color indicates the game family. Purple: Loss-Loss. Pink: Conflict. Orange: Unfair. Yellow: SecondBest. Gray: Critical. Blue-Marine: biased. Green: Win-Win. Red boxes the Nash equilibria in purestrategies.
58

(a) Japan vs China
(b) Japan Vs USSR
(c) USSR Vs China
Figure 4.5: Currency War II Japan, China, USSR.
59

(a) Currency War II US&UKversus USSR payoffs.
(b) US&UK versus Ger-many&France
(c) US&UK versus Japan
(d) US&UK versus China (e) Germany&France versusUSSR
(f) Germany & France versusJapan
(g) Germany & France versusChina
(h) Japan versus China (i) Japan versus USRR
(j) USSR versus China
Figure 4.6: Currency War II game sequence payoffs.
60

Figure 4.7: CW II total payoffs by geopolitical power. The total payoff is computed as a sum of thepayoffs of each player’s games.
61

Chapter 5
Currency War III : From thepetro-dollars to a multipolarinternational system
The current international monetary system is product of the past , Hu Jintao General Secretaryof the Communist Party of China 2011.
5.1 Historical OverviewBy the end of the XX century, the world’s economy has been divided between- the UnitedStates, UK, Germany, France, Italy, Russia, China, India and Brazil-. In particular Global tradewas backed by the military hegemonic power of the United States. Figure 5.1 shows the mostimportant countries in currency war III.
At that time the most important change in the global economy was the emergence of China asthe cheapest factory in the world. China’s biggest competitive advantage was its low labor costand a potential internal market of 1.3 billions consumers. The rise of China redefined the globalsupply chain. Multinational corporations converged to a model where the production was basedon China, the R&D facilities in the US or Europe and the financial consolidation in countries orspecial districts with low taxes (Switzerland, Netherlands, Hong Kong, Singapore).
The emergence of China as a new competitor caused a decline in exports for the ASEANcountries (Indonesia, South Korea,Thailand, Hong Kong, Malaysia, Laos and the Philippines).With the aim of counteracting low exports, ASEAN governments boosted economic growth byusing monetary easing policy and fiscal stimulus. Subsequently, international capital inflowsalong with the excess of credit, inflated the real estate and equity prices. In 1997, the ASEANequity bubble collapsed. The high dependence of ASEAN countries on international capitalcaused a currency crisis. Moreover, the shut-down of the ASEAN production engine also implieda decrease in world demand for oil and non-ferrous metals, the most important capital inflows forRussia. Russian fragile economy was no resilient to the global emerging markets capital outflows,resulting in the 1998 Russian crisis. International flows moved into the US. In particular, intotechnology stocks. High interest rates in the USD holdings along with dot-com boom attractedthe international flows. The motto of creating a “network effect” able to monopolize the marketat the expense of the net income created a huge overvaluation in the Nasdaq Index prices. Thedot-com bubble crashed in 1999 and with that the US entered in a recession.
62

Figure 5.1: Main geopolitical actors currency war III
(a) Unemployment rates of developedcountries and China
(b) Major central banks balance sheet afterthe 2008 great financial crisis.
Figure 5.2: Currency War IIINatural monopolies emerged around common pool resources. Industries such as banking,
technological infrastructures and energy were highly concentrated. Moreover, the labor advan-tages in China were not for free. Labor conditions were very poor [35] and in some cases resemblesthe US labor conditions at the beginning of the century.
Currency war III began in 1999, after the Asian, Russian, and dot-com crisis along with theemergence of the Euro as global reserve currency. Because of the crisis, unemployment soaredin the US and Europe. Figure 5.2a illustrates that Germany’s unemployment rate reached the11% level, France’s 9.5%, US and UK’s approximately 6%.
Major economies used monetary easing policy to alleviate unemployment by stimulatinginvestments and consumption. The Euro monetary system was also of great advantage in timesof the crisis. For instance, it enabled the peripheral countries (Portugal, Italy, Greece andSpain) to get access to international credit at German’s bond rates. For the core countries(Germany, France, Netherlands, Austria) the Euro gave a weaker currency for boosting theirexports. However, low interest rates in the Eurozone periphery also means that their members
63

can finance their fiscal spending via the international bonds market at very low rates withouttransforming their internal economic institutions.
Many researchers and financial professionals argue that the world wide monetary easing policyalong with home loans programs backed by the state prompted the real estate bubble in US, UKand Europe[36, 37]. This rationale is based on the belief that easy monetary policies accentuatedthe debt financed booms-bust cycles[38, 39, 40, 41, 42].
The US, UK and Eurozone real estate bubble crashed in the 2008 Great Financial Crisis. Thecredit boom in the Euro periphery was over. Many members of the Eurozone experimented asovereign debt crisis by 2009. As a consequence, the most important world’s central banks useda massive coordinated monetary expansion to reestablish the international financial stability.Figure 5.2b illustrates the ratio of monetary assets versus GDP. It shows a coordinated jump incentral banks’ assets since the 2008 financial crisis.
Geopolitical strategies have been very intense in the currency war III. Terrorism and cyberwars had emerged as a new format of geopolitical confrontation. Proxy wars for the control ofthe oil- rich middle east had triggered a lot of instability in the region. In fact, since 2011 thereis a wave of revolutions spread across North Africa and the Middle East.
Russia was also very active in geopolitical strategies. It was in war against Chechenia, Georgiaand recently involved in two geopolitical crisis in Syria and Ukraine. There are two strategicregions where the major geopolitical powers have an intense foreign policy agenda: Iran andthe Korean Peninsula (the Communist North Korea and the Capitalist South Korea). The US,Russia and China have conflict of interests in Iran. Russia, US, China and Japan have a conflictof interests in the Korean Peninsula.
Governments has been active in structural reforms. In US Obama’s reforms are focused onmore regulation in the financial system, restructuring the health care system and decreasing oilconsumption in a 30% by 2030. In the Eurozone, the focus is on financial regulation and narrow-ing the competitiveness divergence between its members. In the UK the focus is on restructuringthe welfare state and support sustainable employment. In Japan reforms are focused on thelabor markets, agricultural and electricity sectors along with a general deregulation in markets.In China reforms are focused on restructuring the State Owned Companies, pro-markets reforms,while fostering the power of the State. In, Russia reforms are focused on the consolidation ofPutin’s leadership. India’s reforms are focused on a more efficient government. India’s reformsare emphasized in increasing investment, completing infrastructure projects in a time-boundmanner, and efficiently utilizing natural resources. In Brazil the reforms agenda is still unclear.Table 5.1 summarizes the most important attributes of currency war III.
Attributes Currency War IIIGeopolitical Powers US, Germany, UK, France, Japan
Geopolitical Challengers Russia, Iran , North KoreaEmergent Economies China, India, Brazil
Wars Afghanistan, Iraq, Syria Crisis, Terrorism , CyberwarsReforms US , UK China , Japan
Reform Procrastinators GIIPS, Russia, Brazil?, India?Revolutions “Arab Spring”, Ukraine, Venezuela
Hyperinflationary Episodes ?Technology Revolutions Robotics , Biotech , Big Data , New energies?Important Coalitions Economic: European Union. Geopolitics: NATO
Monetary standard in decadence USD, Pretro-dollarNew monetary standard Polycentric (multi-polar) international monetary system?
64

Table 5.1: Summary Currency War III. Question marks means that currently is uncertain.
5.2 Games’ sequences: two foreseeable scenarios.As we illustrated in the historical review the most important geopolitical powers in Currency
War III were: US, UK, France, the Eurozone, Russia, Japan, China. Two emerging nationsrich in natural resources are also relevant in this currency war: India and Brazil. Figure 5.3shows the geopolitical powers grouped by the level of debt over GDP. Gray circles are highlyindebted nations. Light blue creditor nations and commodities exporters. For instance, theupper triangle shows the US, UK and Japan are highly indebted countries . Moreover, they alsohave aligned geopolitical interest. Below at the left is located China and the countries rich innatural resources (Russia, India and Brazil). In the middle the Eurozone. An economic andgeopolitical bloc with two important groups: the core (dark blue) and the periphery (light blue).The core (Germany, France, Netherlands, Austria) are the most global competitive economies.The periphery (Greece, Ireland, Italy, Portugal, Spain) are highly indebted countries with a lagin institutional development.
Figure 5.3: Incentives geopolitical power in CW III
Figure 5.4 shows what every major geopolitical power exports by product category. Forinstance, US, Germany and China exports more than 1 trillion USD each one. Moreover, themajor exports are in high-tech sectors (Machinery, Computer and Chemicals). Japan, Franceand UK also have a similiar exports product composition. Together exports add up to 1.5 trillion.Russia, India and Brazil export add up to 800 billions. Russia exports are concentrated specialyin Oil and Gas. While India and Brazil have a more diversified portfolio of natural resources.
To analyze currency war III , I will consider 5 geopolitical blocs based on the different gover-nance mechanism in politics and economics. The US & UK (democratic capitalism), Eurozone(welfare states), Japan (collective capitalism), China (state capitalism), India & Brazil (stateCapitalism) and Russia (autocratic capitalism).
65

(a) US exports of 1.1 trillionUSD.
(b) UK exports of 388 USD bil-lion USD.
(c) Germany exports of 1.19trillon USD.
(d) France exports of 508 bil-lion USD.
(e) China exports of 1.77 tril-lions USD.
(f) Japan exports of 766 bil-lions USD.
(g) Russia exports of 378 bil-lions USD.
(h) India exports of 238 billionsUSD.
(i) Brazil exports 205 billionsUSD.
Figure 5.4: What every country trades. Blue: machinery, electrical and transportation. Pink: Chemical,allied industries and plastic/rubbers. Green: Textiles. Brown: Natural resources. Source: The Atlas ofeconomic complexity. http://www.atlas.cid.harvard.edu/
66

In the current currency war major part of the countries are in the opening phase. Theyare focused on protectionism (capital controls, trade barriers) and monetary policy (easing andcurrency pegging) strategies. However every bloc also has a geopolitical and reforms agenda.The combination of reforms, proxy wars and coalitions can build many different scenarios. Inparticular in this section, I will analyze two scenarios. Scenario A is an ideal situation where ma-jor geopolitical powers are successful by doing reforms. The exception are the natural resourcesexporters countries. I assume reforms in these countries are not successful because oligarchicstructures controlling the exports of natural resources have strong political influence. Moreover,in this scenario every geopolitical power avoids geopolitical strategies (wars, coalitions, revolu-tions). Scenario B is a situation where US&UK have a coalition with the Eurozone and Japanin order to face Russian threats. In this scenarios proxy wars in the middle east, Ukraine andKorea are highly probable. China and Russia have a coalition against US. However, China avoidsproxy wars against US and also avoids the use of geopolitical strategies against the Eurozone. Inthis scenario there are proxy wars between China and Japan. India and Brazil avoid geopoliticalconfrontation and reforms. In both scenarios I assumed that the US is the first in implementingstructural reforms.
Figures 5.6, 5.7 and 5.8 show the game’s transitions in every pair of strategic confrontations.In general coordinated reforms and coalitions transform the games’ sequence from the loss-lossand unfair family into games of the biased and win-win family. The use of proxy wars andcoalitions transform the games’ sequence into the conflict and crisis families. Figures 5.9 and5.10 show the payoff for every pair of strategic confrontations. The thick line corresponds to thescenario A and the dotted line to scenario B. Figure 5.11a illustrates the total payoffs of scenarioA. It shows that in this scenario all the countries with implemented reforms win. In the gamesequence from 5-6 every country outperforms the US. In the game sequence in 6-7-8 US havestrong recovery while the Eurozone and Japan have losses. After the 8th game in the sequenceevery geopolitical power losses and the US remain flat. Figure 5.11b illustrates the total payoffsof scenario B. It shows that the loser of the currency war is Russia. The winners are India& Brazil and China. However, with Russia out of the game along with the procrastination ofreforms, the games’ sequence will be transformed into games from the unfair the critical family.That means heavy losses. On the other hand, countries active in reforms will benefit from thestructural reforms coordination in the win-win family. The less reform activity, the longer thecurrency wars. Indeed, structural reforms improves the governance of common pool resourcessuch as technological infrastructures.
The US, UK, Japan and the Eurozone (in particular the Eurozone periphery) face two majorchallenges: the fossil energy dependency and the excessive level of public debt. The US and UKhave used geopolitical strategies in order to ensure the oil and gas supply in the short term. Inaddition national programs supporting fossil energy independence have boosted investments inalternatives energies in every developed country. Moreover, in the US shale gas has emerged asan alternative to oil.
67

(a) US&UK Vs Russia
(b) US&UK Vs Eurozone
(c) US&UK Vs Japan
(d) US&UK Vs China
Figure 5.5: CW III games’ sequence. Flags indicates geopolitical powers in conflict. The boxes’ colorindicates the game family. Purple: Loss-Loss. Pink: Conflict. Orange: Unfair. Yellow: Second Best.Gray: Critical. Green: Win-Win. Red boxes the Nash equilibria in pure strategies.
68

(a) Eurozone vs Russia
(b) Eurozone vs Japan
(c) Eurozone vs China
(d) Eurozone Vs China
Figure 5.6: Currency War III games’ sequence. Flags indicates geopolitical powers in conflict. The boxes’color indicates the game family. Purple: Loss-Loss. Pink: Conflict. Orange: Unfair. Yellow: SecondBest. Gray: Critical. Green: Win-Win. Red boxes represent the Nash equilibria in pure strategies.
69

(a) Japan vs Russia
(b) Japan versus China
(c) Russia versus China
(d) Japan versus India&Brazil
Figure 5.7: CW III games’ sequence. Flags indicates geopolitical powers in conflict. The boxes’ colorindicates the game family. Purple: Loss-Loss. Pink: Conflict. Orange: Unfair. Yellow: Second Best.Gray: Critical. Blue-Marine: biased. Green: Win-Win. Red boxes represents the Nash equilibria inpure strategies.
70

(a) Russia versus China
(b) Russia Vs India&Brazil
(c) China Vs India&Brazil
Figure 5.8: CW III games’ sequence. Flags indicates geopolitical powers in conflict. The boxes’ colorindicates the game family. Purple: Loss-Loss. Pink: Conflict. Orange: Unfair. Yellow: Second Best.Gray: Critical. Blue-Marine: biased. Green: Win-Win. Red boxes the Nash equilibria in pure strategies.
71

(a) US&UK versus Russia pay-offs.
(b) US&UK versus Eurozone (c) US&UK versus Japan
(d) US&UK versus China (e) US&UKversus In-dia&Brazil
(f) Eurozone versus Russia
(g) Eurozone versus Japan (h) Eurozone versus China (i) Eurozone versus In-dia&Brazil
Figure 5.9: CW III games’ sequence payoffs.
72

(a) Japan versus Russia (b) Japan versus China (c) Eurozone versus China
(d) Japan versus Russia (e) Japan versus China (f) Russia versus China
Figure 5.10: CW III Games’ sequences payoffs.
In terms of public debt reforms are critical in many sectors. In particular the health caresystem in the US, the welfare state in the UK and the labor markets in Japan. The saliencefor reforms in Japan is higher because of the Fukushima tragedy and the negative demographictrends. Japan needs technologies able to do the job old people can not. If necessity is themother of innovation that is exactly the atmosphere in Japan. Urgency along with the knowhow and installed capacity in Robotics could be the major drivers for a technological revolutionin Robotics [43].
The Eurozone in some way is facing similar challenges to Japan. Fossil energy dependency,Negative demographics, and high public debt levels. Both scenarios A and B show that thesuccess of the Eurozone depends on three things:
• The success of structural reforms. The eurozone needs institutional convergence betweenthe core and periphery. For instance the global competitiveness index rank for Germany is4/148 while for Greece is 91/148 (author?) [44].
• Avoiding a geopolitical confrontation with China in order to develop economic coordinationmechanism with China and Japan.
• Facing geopolitical threats coming from Russia.
Both scenarios A and B are favorable for China. Nevertheless, there are far more scenarios. Forinstance, some analyst are very pessimistic about the success of the Xinjiping reforms in China.Indeed some claim that a political revolution in China is possible.
This game theory framework shows that a revolution scenario is possible if 3 things happensimultaneously.
73

(a) Scenario A
(b) Scenario B
Figure 5.11: Currency War III total payoffs by geopolitical power.The total payoff is computed as a sumof the payoffs of each player’s games.
74
• China is active in the proxy wars and military coalitions against US and Europe.
• Xinjiping reforms are not successful.
• Japan is part of a technological revolution able to make robotic labor cheaper than Chineselabor.
However, if China is focused on reforms and the foreign policy agenda is only against Japan, itcould take great benefit from the rivalry between the US, UK and Eurozone against Russia.
India and Brazil have favorable outcomes in both scenarios. They benefit form the rivalrybetween the major geopolitical powers. However, if they procrastinate reforms this initial ad-vantage could be transformed into heavy losses in the strategic confrontation with the countriesactive in reforms.
In both scenarios A and B, Russia have a unfavorable outcome. Russia needs deep reformsthat are very difficult to reach under the current autocratical regime. However, if Russia avoidsproxy wars and develops a strong coalitions with China, India and Brazil, it could benefit fromits geopolitical influence.
In fact, a coalition between these countries would be equivalent to 2.6 trillion in exports. Amajor exporting bloc compared to the approximately 2 trillions of the Eurozone, the 1.1 trillionof the US, the 800 billion USD from Japan. A new trade configuration also implies a redefinitionof the international monetary systems around three poles: The US dollar, the Euro and theChinese Renmimbi.
75
Chapter 6
Conclusions and future work
This chapter summarizes the findings and limitations of my research about currency wars byusing a game theoretical model. Moreover, it shows two possible directions for future work:1) Studying how the phases of a currency war are connected with switching regime modelsfor global asset allocation 2) Studying how institutional transformation lead by wars, structuralreforms and revolutions create important changes in the global governance mechanisms in politicsand economics. In particular, how the upgrade of the global institutional setting creates largefluctuations in the business cycle.
6.1 Summary and limitations.Throughout this study I have shown that a currency war is far beyond competitive currencydevaluations or monetary coordination spillovers. In fact, the lack of an international monetarystandard is a better definition.
A currency war happens because there is a new global configuration of economic and geopolit-ical power. Global powers are in a global struggle for controlling the factors of production– labor,energy and technology–. It begins with a loss-loss situation (global economic crisis) along withthe collapse of the international monetary system. It ends in a win-win situation (technologicalrevolution) that makes possible the settlement of a new international monetary standard.
In CW I the emergent power was the US, the monetary system in decadence was GoldStandard. The key energy resource was coal. In CW II the emerging economic power was Japanand the monetary system in decadence the Bretton Woods. The key resources were oil andnuclear energy. In CW III the emerging economy has been China and the monetary system indecadence the pure fiat US dollar. The key energy resources are oil and gas. After the Fukushimatragedy in Japan, the use of nuclear energy has been reviewed in many developed countries.
The emergence of a new economic challenger affects the dominant economies’ labor marketsand exports, thus boosting their unemployment rates and trade deficits. A decrease in theaggregated demand along with a slow down in exports, increases commercial and consumptioncredit defaults. This economic setting triggers banking crises and recessions in the developedeconomies.
Global economic crisis could be either deflationary or inflationary. A deflationary crisishappens because common pool resources (money-credit, technological infrastructure and energy)are governed by oligopolies, while in an inflationary crisis they are governed by the State. Inboth crises the poor governance of technological infrastructures inhibits the creation of economic
76

spillovers, then causing poor economic growth. Moreover, in both crises there is a struggle forcontrolling the access to energy (e.g. fossil fuels), thus, causing geopolitical instability.
The difference between both crises lies in the governance of money and credit. In a deflation-ary crisis there is a lack of regulation in the financial industry. Moreover, the credit supply isconcentrated in the companies with the largest assets and consumers with collateral (real state,commodities). The lack of credit in the rest of the economy reduces the money multiplier of thewhole economy, causing a reduction of consumer’s prices1. On the other hand, when money andcredit are controlled by the State, there is an excess of regulation in the financial system. Creditis allocated in State backed companies. Money printing is used to finance wars, for controllingthe energy supply and to alleviate unemployment in the short run. The increase in the monetarybase and credit supply beyond the potential output boost consumer’s prices.
I have identified three phases in a currency war: opening, middle and end. In the first, afterthe global crisis, geopolitical powers use monetary easing policy and protectionism in order toalleviate unemployment. In the middle they use geopolitical strategies such as wars and militarycoalitions in order to have access to energy resources. In the end, some geopolitical powersadopt structural reforms allowing a better governance of common pool resources. They benefitfrom common coordination spillovers while structural reforms procrastinators are susceptible torevolutions, political turmoil or the dissolution of military coalitions.
Game theory was used as a tool to identify the most important strategic situations in thedynamics of a currency war. Moreover, this framework helps to understand how the six geopolit-ical and economic strategies- monetary policy, protectionism, (proxy) wars, structural reforms,geopolitical coalitions and revolutions- transforms the strategic configurations in a currency war.
Strategic situations are grouped by families of games. Loss-loss (Prisoner’s Dilemma), Con-flict (Conflict), unfair (Chicken), critical (Missile Crisis) , Biased (Battle of Sexes), Win-Win(Rousseau Stag-Hunt ).
The loss-loss and critical game family have nasty costs for every geopolitical power facingthis strategic setting. While in the win-win family countries are able to be coordinated, theytake advantage from the mutual economic spillovers.
Every phase has a more frequent set of game families. For example, in the opening the mostrecurrent families are the loss-loss, conflict and unfair families. In the middle: the unfair, biasedand critical families. In the end: the critical, biased and win-win families.
In a currency war geopolitical powers tend to procrastinate reforms because they imply areconfiguration of the internal distribution of power. In particular, politicians prefer foreignpolicy to foster political popularity rather than to give up the domestic power by means ofreforms. This situation is extreme in countries governed by autocracies. Revolutions happenwhen the loss-loss or critical situation is unsustainable. In CW I the most important revolutionwas in Russia. In CW II in Iran. In CW III there has been a wave of revolutions in the arab worldknown as the “arab spring”, there was a revolution in Ukraine and social unrest in Venezuelaand Hong Kong. Furthermore, there are two highly autocratic regimes: North Korea and Iranthat could be affected strongly after the reconfiguration of geopolitical power in the aftermathof the current currency war.
It is important to mention that this framework has many limitations. For instance, it isbased on the assumption that all possible strategies in a currency war can be reduced to a setof six strategies. Furthermore, the mapping between strategies and row-column permutations issubjective. In fact, the sequential application of the strategies requires the input of an analystable to estimate the strategies’ success probability. For example: the success probability of astructural reform. Finally, there could be random events that modify the structure of the games
1The fisher equation MV =PQ ,where M is the monetary base V the money multiplier P, the level of pricesand Q the quantity of goods, relates velocity and prices.
77

in a currency war. For example: the discovery of a new planet plenty of natural resources, anuclear tragedy.
6.2 Future work
(a) Mapping of games into market regimens
(b) Switching regimens in Equity and Commodi-ties
Figure 6.1: Phases of a currency war and US equity and commodities regimens.
6.2.1 Currency war and switching regimens modelsMany economic and financial time series exhibit dramatic breaks in their behavior associatedwith events such as financial crisis [45, 46]or abrupt changes in governmental policy[47, 48].
In a currency war the intensity of this changes is high. Therefore, the switching betweendifferent regimens in financial asset classes is probable. In fact, our game theoretical frameworkexplains how governmental and central bank’s strategies modifies the structure of the game andsometimes the Nash equilibrium. The purpose of this section is to suggest a connection betweenthe game theoretical framework and more general switching regimen models as a future directionof research.
In particular, I am interested in the mapping of the phases of a currency war into threeregimens in financial asset prices: bull-market, bear-market, boom-bust. A bull market makes
78

Figure 6.2: Currency Wars and Banking Crisis around the globe. Green: time interval of internationalmonetary standard. Black line: time interval of a currency war. Adapted from Reinhart and Rogohf:“An Equal opportunity Menace” and the Economist
reference to long term positive momentum in the long term asset prices. A bear market refersto negative momentum in long term asset prices. The boom-bust regimen refers to an state ofhigh increase in financial asset prices accompanied with subsequent bust.
Figure 6.1a shows the mapping of different phases of currency war into the bear-market andboom-bust regimen.Figure 6.1b shows a diagram with the transition probability between thethree regimens. The arrows indicates the transition probability between regimens. In particular,when there is an international monetary standard the more probable regime is a bull-market inthe equity market. That is caused by the coordinated reforms. In the switching regime model,that means, the transition probabilities P11 → 1,P21 → 1 and P31 → 1.
In an international monetary standard there is a global consensus about the hierarchy ofgeopolitical power. The global economy is in win-win situation with stable governance mechanismin politics and economics. Geopolitical powers are not competing anymore for the control of thefactor of production. In the win-win situation countries benefit from the coordination spilloversof a new technological era. Corporation boost their earnings by the global decrease in transactioncosts along with the new complementarities and growth opportunities. There is an structuralbull market in the developed countries equity markets.
The US has been active in structural reforms in the three currency wars. Because of that,I use the S&P Index and the P/E ratios as proxies for the equity performance in developedcountries. Figures 6.3a shows that in the time interval of an international monetary standardthere was a bull market in the S&P index. Moreover, Figure 6.3b shows the upward trend of theS&P price earnings ratio in this time interval. The price earnings ratio is a proxy of the futureearnings expectations.
For energy and monetary commodities the most probable regime is a bear market. Thatmeans, that the transition probabilities become P33 → 1,P13 → 1 and P13 → 1. New tech-nologies improve global productivity decreasing the demand for energy commodities. Moreover,
79

geopolitical stability increases the energy supply. In the case of monetary metals trust in the newinternational monetary system along with tight monetary policy lead to a bear market. Figure6.3c shows a bear-market in the prices of coal and oil in times of an international monetarystandard (green line). Figure 6.3d shows a bear-market in the prices of gold and silver in thesame time interval.
Inside a currency war the dynamic is more complex. There is a global banking crisis. Geopo-litical powers are competing for the control of the factors of production. Deep transformationin the global institutional setting makes the potential output of many economies unstable. Theglobal economy transits inside many strategic situations. Figure 6.2 shows the percentage ofbanking crisis as a macroeconomic indicator useful to identify the currency wars.
The most predictable dynamics in a currency war is in the opening phase. In this phase thebear-market regimen is the most relevant for developed markets equity. The use of monetaryeasing policy, protectionist and war strategies; trap the countries inside the loss-loss, conflictand the unfair families. The lack of technological spillovers plus the geopolitical instability makedifficult for corporations to find growth opportunities. Margins are based on economies of scaleby means of mergers and acquisitions. The survival of the largest creates an structural bearmarket in equity. Figure 6.3b shows a downward trend in the price earnings ratio of the S&P intimes of a currency war.
On the other hand for energy and monetary commodities the most probable regimens isbull-market Monetary easing and political instability are upside drivers for commodities prices.Figure 6.3c shows an upward trend in the prices of coal and oil in the first half of a CWI, CWIIand CWIII. Figure 6.3d shows the same pattern for gold and silver.
The middle and end phase are more difficult to predict depending on which combinationsof strategies are in use. The many possible Nash equilibria, together with the existence ofcritical games make possible to create boom-bust cycles in both equity and commodities markets.Transition probabilities changes according to the use of the different strategies in a currency war.For example, coordinated structural reforms makes the transition probabilities P21 ≥ P22 andP11 ≥ P12. On the contrary, for commodities prices the use of wars and geopolitical coalitionsalong with the avoidance of reforms make P22 ≥ P23 and P32 ≥ P33.
Furthermore, changes of Nash equilibria can trigger jumps in the prices of many financial assetclasses. Figure 6.3e shows the volatility of the S&P returns back to 1900. In particular it showsthe largest volatility peaks are in time of a currency war. Figure 6.3f shows the probabilitydistribution of the absolute value of the S&P returns in the three currency wars contrastedagainst the probability distribution in times of the Bretton Woods standard. These probabilitydistribution follow a power law. In particular, the probability distribution in time of a BrettonWoods standard has less extreme events that in times of a currency war.
6.2.2 Institutional transformation and the business cycleIn order to track how changes in the institutional setting of the global economy create fluctuationsin the business cycle I have designed the governance plane2
This tool helps to understand how the change in the governance mechanisms in politicsand economics create a boom-bust regimen. In Figure 6.4 the red axis shows deflation versusmonetary policy. The Y positive axis represents deflation, the negative axis inflation. The X-axisrepresent the monetary policy in the respective geopolitical power (e.g. real interest rates). Thepositive side indicates tight monetary policy. The negative side easing monetary policy.
The blue quadrant represents the governance mechanisms in politics and economics. Thevertical axis indicates the governance mechanisms in economics. For instance, the plane iden-
2This tool is inspired in a similar tool developed by Gavekal Research.
80

(a) Patterns in the US S&P Index (b) S&P’s price earnings ratio patterns
(c) Energy commodities patterns. Coal (Anthracite)and Oil.
(d) Monetary metals patterns. Gold and Silver
(e) Volatility S&P Index (f) Probability distribution in a currency war regimenvs International monetary regimen
Figure 6.3: Patterns in US equity, energy and monetary commodities in times of a currency war andinternational monetary standard. The green lines represent the time interval with an internationalmonetary standard. The black line represent the time interval with a currency war.
81

tifies five governance mechanisms. 1) State control: a total planned economy where the statecontrols the whole economical activity 2) State capitalism: the economy concentrated in a fewState Owned Enterprises 3) Polycentric institutions: refers to an economy governed by severalrelational institutions between markets and the state. 4) Free markets: an economy withoutany state intervention. 5) Oligopolies: refers to an economy concentrated in a few big privateenterprises. The horizontal axis indicates the governance mechanisms in politics. The axis alsoidentifies five governance mechanisms. 1) Anarchy: refers to a society without a publicly enforcedgovernment 2) Plutocracy: defines a society dominated by the small minority of the wealthiestcitizens 3) Democracy: refers a form of government in which all eligible citizens are meant toparticipate equally 4) Oligarchy: refers to a form of power structure in which power rests withina small number of people. These people could be distinguished by royalty, wealth, family ties, ed-ucation, corporate, religious or military control. 5) Autocracy: refers to governance mechanismsin which a supreme power is concentrated in the hands of one person.
Figure 6.4: The governance plane. A tool to track the basic governance mechanisms in politics andeconomics in a currency war. Source: Adapted from GaveKal
The figure also explains the different phases of business cycles in every quadrant of thegovernance plane. For instance, quadrant I represents a deflationary bust. This is a situationin the business cycle when a country has deflation and tight monetary policy. Quadrant IIrepresents a deflationary boom. It refers to a situation with deflation and easy monetary policy.Quadrant III represents an inflationary boom. It refers to a situation with high inflation andeasing monetary policy. Finally, Quadrant IV represents an inflationary boost. It refers to asituation with tight monetary policy and high inflation levels. The dot-lined circles indicatethe location in the governance plane where geopolitical powers are more susceptible to politicalturmoil, wars and a new technological era.
Figure 6.5 how to use the governance plane for CW III. It shows the location of the differentcountries in terms of the governance mechanisms in politics and economics. For example NorthKorea and Iran are highly autocratical regimens with a economy dependent on natural resourcescontrolled by the state. China and Russia are governed by oligarchies in politics while in the
82
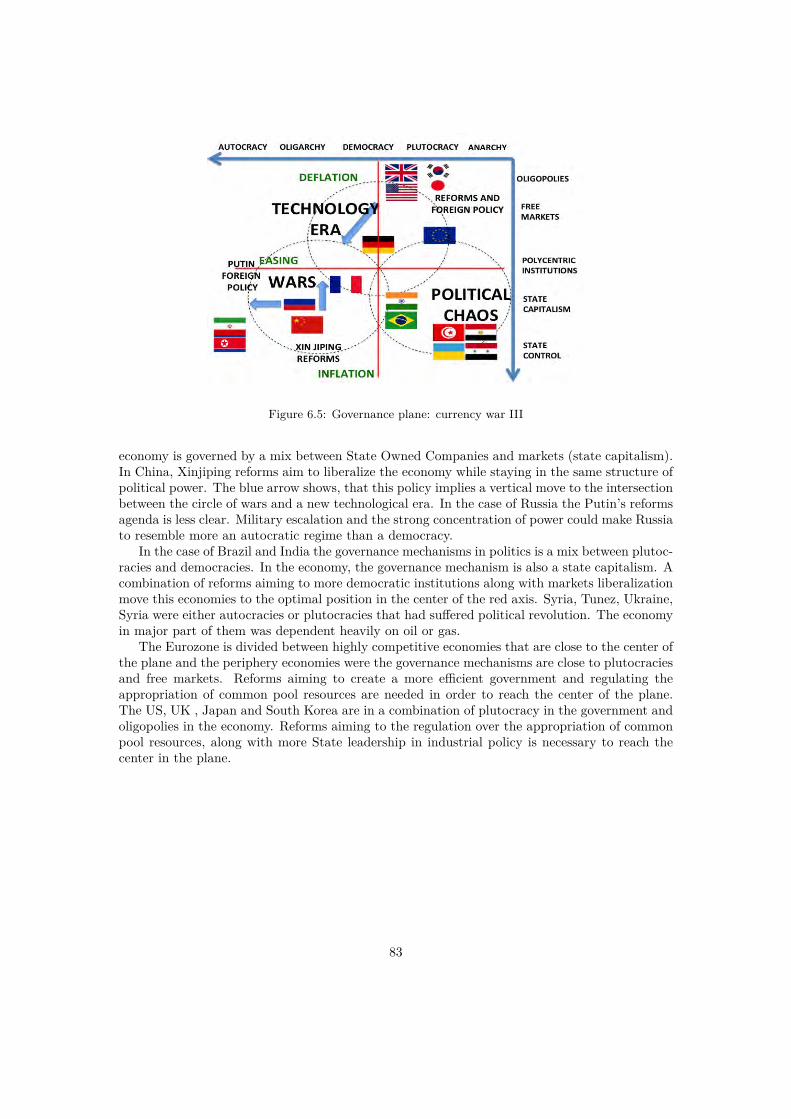
Figure 6.5: Governance plane: currency war III
economy is governed by a mix between State Owned Companies and markets (state capitalism).In China, Xinjiping reforms aim to liberalize the economy while staying in the same structure ofpolitical power. The blue arrow shows, that this policy implies a vertical move to the intersectionbetween the circle of wars and a new technological era. In the case of Russia the Putin’s reformsagenda is less clear. Military escalation and the strong concentration of power could make Russiato resemble more an autocratic regime than a democracy.
In the case of Brazil and India the governance mechanisms in politics is a mix between plutoc-racies and democracies. In the economy, the governance mechanism is also a state capitalism. Acombination of reforms aiming to more democratic institutions along with markets liberalizationmove this economies to the optimal position in the center of the red axis. Syria, Tunez, Ukraine,Syria were either autocracies or plutocracies that had suffered political revolution. The economyin major part of them was dependent heavily on oil or gas.
The Eurozone is divided between highly competitive economies that are close to the center ofthe plane and the periphery economies were the governance mechanisms are close to plutocraciesand free markets. Reforms aiming to create a more efficient government and regulating theappropriation of common pool resources are needed in order to reach the center of the plane.The US, UK , Japan and South Korea are in a combination of plutocracy in the government andoligopolies in the economy. Reforms aiming to the regulation over the appropriation of commonpool resources, along with more State leadership in industrial policy is necessary to reach thecenter in the plane.
83

Bibliography
[1] S. Pinker, How the Mind Works. New York: W. W. Norton & Company, 1997.
[2] M. Osborne and A. Rubinstein, A course in game theory. MIT press, 1994.
[3] D. Robinson and D. Goforth, The Topology of 2X2 Games A New Periodic Table. RoutledgeTaylor& Francis Group, 2005.
[4] D. Robinson and D. Goforth, “Conflict, no conflict, common interests, and mixed interestsin 2x2 games,” Deparament of Mathematics and Computer Science, 2005.
[5] A. Rapoport and M. Guyer, “The taxonomy of 2x2 games,” General Systems, Vol XXIII,pp. 125–136, 1978.
[6] D. Robinson and D. Goforth, “Teaching economics by teaching 2x2 game theory,” WorkingPaper, 2011.
[7] B. Bruns, “Visualizing the topology of 2x2 games from prisioner’s dilemma to win -win,”Working Paper Indiana University, 2010.
[8] B. Bruns, “Escaping prisoner’s dilemmas: From discord to harmony in the landscape of 2x2games,” Working Paper Indiana University, 2012.
[9] B. Bruns, “Navigating the topology of 2x2 games: An introductory note on the payofffamiles, normalization and natural order,” Working paper Indiana University, 2010.
[10] B. Russell, Common Sense and Nuclear Warfare. George Allen and Unwin, London., 1959.
[11] C. R. Geisst, Beggar Thy Neighbor: The History of Usury and Debt. University of Pennsyl-vania Press, 2013.
[12] J. Greenberg, The Theory of social situations: an alternative game theoretical approach. Ca,1990.
[13] B. Bernanke, “Monetary policy and the global economy,” 2013.
[14] B. Eichengreen, Exorbitant Privilage. Oxford University Press, 2011.
[15] B. Skyrms, The Stag Hunt and the Evolution of Social Structure. Cambridge UniversityPress, 2004.
[16] K. Popper, The open society and Its enemies Vol 1: The spell of plato. Pricenton UniversityPress, New Jersey, 1971.
84

[17] G. Kasparov, How life imitates chess. Making the Right Moves-from the board to the Board-room. Bloomsbury, 2007.
[18] D. Galbi, “International aspects of social reforms in the interwar period,” Working PaperCommon Security Forum Center for Population and Developement Studies, 1993.
[19] H. Rockoff, “Until it’s over, over there: The us economy in world war i,” NBER WorkingPaper, vol. 10580, 2004.
[20] B. Porter and E. Karsh, The USSR in Third World Conflicts: Soviet Arms and Diplomacyin Local Wars. Cambridge University Press, 1984.
[21] A. Wegner and C. Nuenlist, Transforming NATO in the Cold War: Challenges beyonddeterrence in 1960ss, vol. 9. Taylors and Francis, 2007.
[22] W. Park, Defending the West: a history of NATO. Westview, 1986.
[23] M. Bordo and B. Eichengreen, “" bretton woods and the great inflation ",” NBER WorkingPaper, vol. 12532, 2008.
[24] J. Rickards, CURRENCY WARS: The making of the next global financial crisis. PenguinBooks, 2011.
[25] C. Doran, Make the world safe for capitalism. Pluto Press, 2012.
[26] C. Herzog, The War of Atonement: The inside Story of the Yom Kippur War. GreenhillBooks, 1975.
[27] O. o. t. H. U.S. Department of State, “Opec oil embargo 1973-1974.”http://history.state.gov/milestones/1969-1976/oil-embargo, 2013.
[28] K. Ohno, The Economic development of Japan: the path traveled by Japan as a developingcountry. GRIPS Development Forum, 2006.
[29] J. Veatal, Planning for Change: Industrial Policy and Japanese Economic Development.Oxford:Clarendon Press, 1993.
[30] D. Marsh, The EURO: The Battle for the New Global Currency. YALE UNIVERSITYPRESS NEW HAVEN AND LONDON, 2009.
[31] G. Evelyn, Constructing the US Rapprochement with China, 1961-1974: From "Red Menace"to "Tacit Ally". Cambridge University Press, 2005.
[32] M. MacMillan, Nixon & Mao: The Week that Changed the World. Random House , NewYork, 2007.
[33] T. Carpenter, “Us aid to anticomunist : The ’reagan doctrine’ and its pitfalls",” CatoInstitute, 1986.
[34] R. Evans, Deng Xiaoping and the Making of Modern China. Penguin, 1995.
[35] P. Ngai, “Global production, company codes of conduct and labor conditions in china. acase of study of two factories.,” China Journal, vol. 54, pp. 101–113, 2005.
[36] G. Soros, The New Paradigm for Financial Markets. Public Affairs, 2008.
85

[37] N. Roubini and M. Stephen, Crisis Economics: A crash course in the future of finance.Penguin, 2010.
[38] H. Minsky, Sabalizing an Unstable Economy. Mc Graw Hill Companies, 1986.
[39] H. Minsky and M. Vaughan, “Debt and the business cycle,” Bard Digital Commons, vol. 25(3), pp. 23–29, 1990.
[40] S. Keen, DEBUKING ECONOMICS : The Naked Emperor Dethroned? Zed Books, 2011.
[41] R. Werner, The New Paradigm in Macroeconomics: Solving the Riddle of Japanese Macroe-conomic Performance. No. 8, PALGRAVE MACMILLAN, 2005.
[42] D. Sornette and P. Cauwels, “1980-2008: The ilussion of the perpetual moneymachine and what it bodes to the future,” Risk 2, vol. doi:10.3390/risks2020103(http://arxiv.org/abs/1212.2833 and http://ssrn.com/abstract=2191509), pp. 103–131,2014.
[43] L. V. Gave, Too different for Comfort. GavekalBooks, 2013.
[44] K. Schwab, “The global competiveness report 2013-2014,” The World Economic Forum,2014.
[45] J. Hamilton, “Regime-switching models,” Palgrave Directory of Economics, 2005.
[46] J. Hamilton, “Dating business cycle turning points,” Non-Linear Analysis of the businesscycle. Elsevier, 2005.
[47] J. Hamilton, “A new approach to the economic analysis of non-stationary time series andthe business cycle,” Econometrica, vol. 57, pp. 357–384, 1989.
[48] C. Sim and T. Zha, “Where the switches in us monetary policy?,” Working paper PrincetonUniversity, 2004.
86