how should we continuously update risk/benefit information .../media/files/activity...
TRANSCRIPT

How should we continuously update risk/benefit information with post-
marketing data?
J. Marc Overhage, MD, PhDSenior Scientist, Regenstrief Institute
Professor of Medicine, Indiana University School of MedicinePresident and CEO, Indiana Health Information Exchange

2

3
Goal
• Convince you that existing, routinely collected clinical data can be aggregated and used to identify signals that represent adverse events (and some beneits) which can be used to continuously refine estimates of risk

4
Updating Risk
• Spontaneous reports• Case series• Case-control studies – undefined source
populations• Nested case-control studies – well defined
source populations • Cohort studies – retrospective • Cohort studies – prospective

5
Spontaneous Reporting?
• Not either / or• Spontaneous reports
– small number of cases– suggestive time relationship– plausible mechanism
• Active surveillance– relative risk calculations– more patients - better precision– comparisons within drug or between drugs

Bates JAMIA 1994
AE Identification And Prevention
“Most hospitals rely on spontaneous voluntary reportingto identify adverse events, but this method overlooksmore than 90% of adverse events detected by othermethods...............Retrospective chart review improvesthe rate of adverse event detection but is expensive anddoes not facilitate prevention.”

Inpatient AE Surveillance
9 21
731
101
600
300
100
200
300
400
500
600
700
800
Traditional Enhanced Automated
TotalSevereModerateMild
Classen JAMA 1991

Inpatient AE Surveillance
23 9
61
398
109
23
275
70
20
50
100
150
200
250
300
350
400
Spontaneous Chart Review Automated
TotalPreventablePotential
Jha JAMIA 1998

9
Inpatient AE Surveillance
• Only 67 (12%) detected by both chart review and the computer monitor
• Only 3 detected by voluntary report and computer monitor
• Among 281 severe ADEs, 139 (49%) detected by computer monitor and 169 (60%) detected by chart review
Jha JAMIA 1998
10
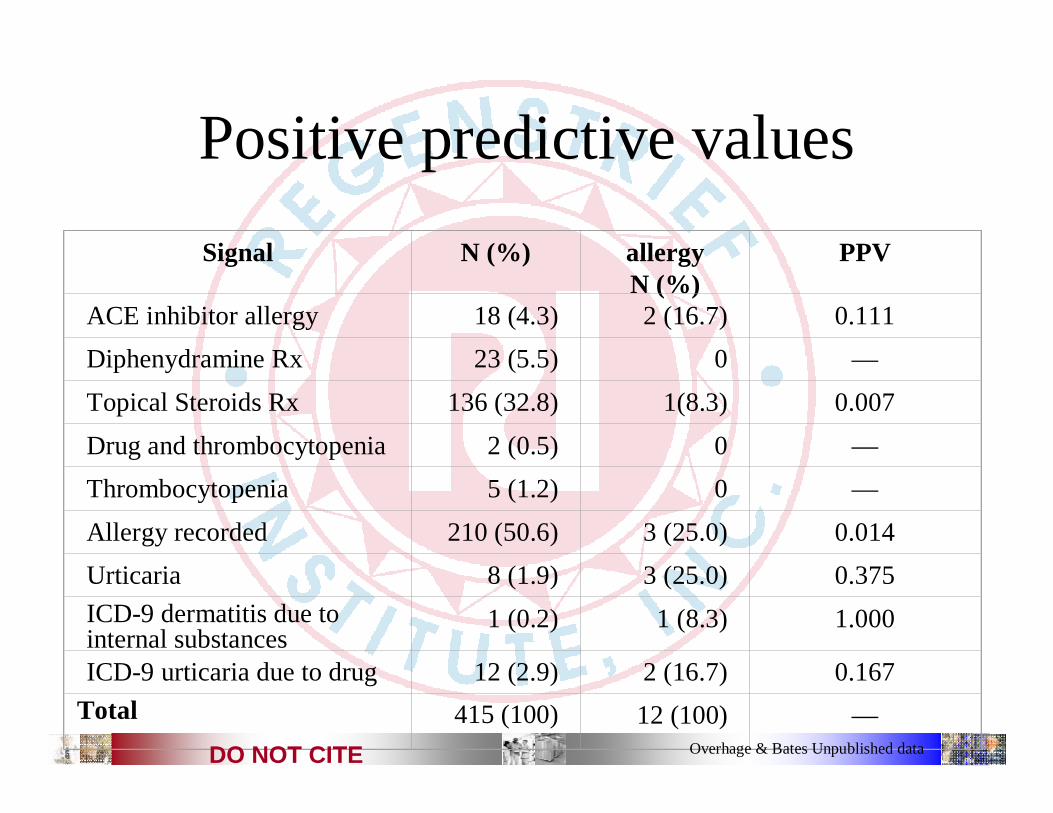
Positive predictive valuesSignal N (%) allergy
N (%)PPV
ACE inhibitor allergy 18 (4.3) 2 (16.7) 0.111Diphenydramine Rx 23 (5.5) 0 —Topical Steroids Rx 136 (32.8) 1(8.3) 0.007Drug and thrombocytopenia 2 (0.5) 0 —Thrombocytopenia 5 (1.2) 0 —Allergy recorded 210 (50.6) 3 (25.0) 0.014Urticaria 8 (1.9) 3 (25.0) 0.375ICD-9 dermatitis due to internal substances
1 (0.2) 1 (8.3) 1.000
ICD-9 urticaria due to drug 12 (2.9) 2 (16.7) 0.167Total 415 (100) 12 (100) —
Overhage & Bates Unpublished dataDO NOT CITE
11
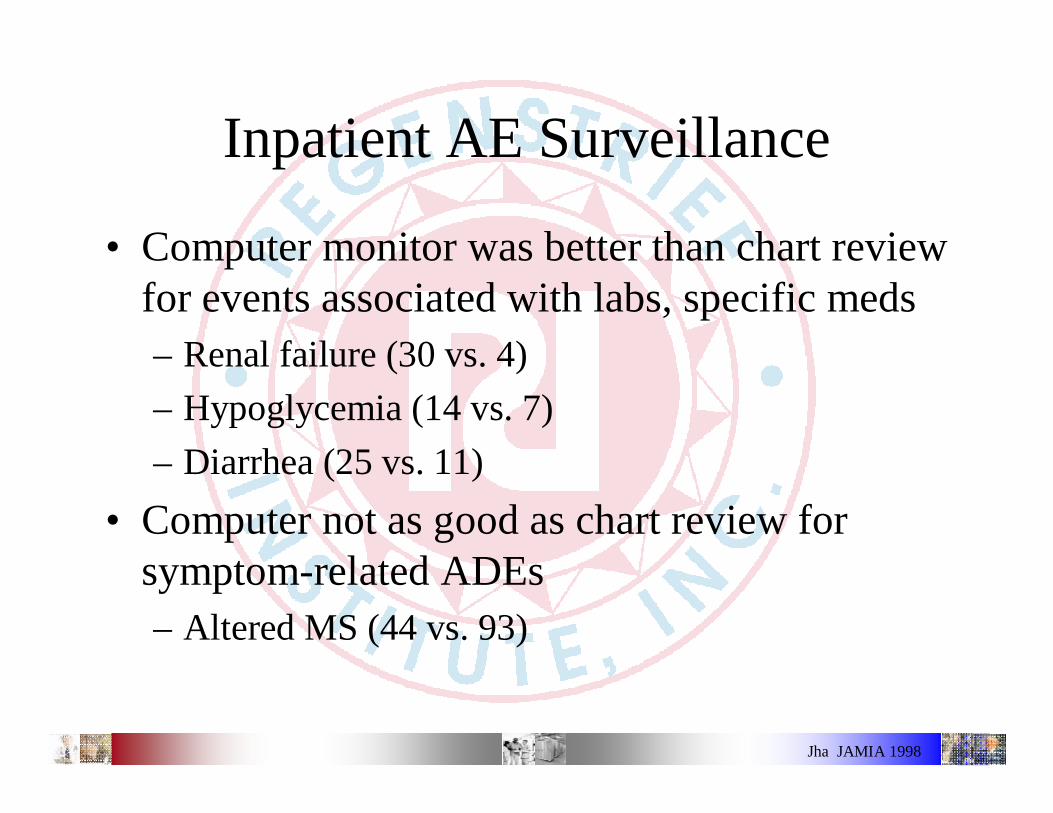
Inpatient AE Surveillance
• Computer monitor was better than chart review for events associated with labs, specific meds– Renal failure (30 vs. 4)– Hypoglycemia (14 vs. 7)– Diarrhea (25 vs. 11)
• Computer not as good as chart review for symptom-related ADEs– Altered MS (44 vs. 93)
Jha JAMIA 1998

12
Outpatient AE Surveillance
Allergy ICD-9
Text Searches Drug-Lab
Allergy ICD-9
Text Searches Drug-Lab
Percentage of signals Generated
Percentage of AEsidentified
HonigmanHonigman, JAMIA, 2001, JAMIA, 2001
13
First Take-away
• Automated surveillance can reliably, consistently identify “signals” some of which are adverse events

14
Data Reuse• Take the electronic data that exists across a
community– Capture everything– Standardize the existing codes– Employ for multiple purposes– Collect supplemental data for targeted secondary uses

Indiana Network for Indiana Network for Patient CarePatient Care
An operational, sustainable community wide health information exchange
16
Morgan County
Hospital
ImmunizationsNewborn screeningED encounters

17
INPC Data sources•• 24 hospitals including the 5 major hospital systems (99% 24 hospitals including the 5 major hospital systems (99%
of nonof non--office care) and community hospitalsoffice care) and community hospitals•• National and regional laboratoriesNational and regional laboratories•• National and regional imaging centersNational and regional imaging centers•• National and regional National and regional PBMsPBMs•• National and regional pharmaciesNational and regional pharmacies•• National and regional National and regional payorspayors (claims data)(claims data)•• All four homeless care systemsAll four homeless care systems•• Public health departments (county and state)Public health departments (county and state)•• Approximately 1/3 of ambulatory physiciansApproximately 1/3 of ambulatory physicians

18
INPC Data
•• 7 million registration 7 million registration ““eventsevents””•• 60 million orders60 million orders•• 900 million coded results900 million coded results•• 20 million dictated reports20 million dictated reports•• 8.8 million radiology reports8.8 million radiology reports•• Hundreds of millions prescriptionsHundreds of millions prescriptions•• 750,000 EKG tracings750,000 EKG tracings•• 45 million radiology images45 million radiology images

19
OtherOtherDataData
SourcesSources
Public HealthPublic Health
St. FrancisSt. Francis
St. VincentSt. Vincent Clarian Health Clarian Health PartnersPartners
Wishard Health Wishard Health ServicesServices
CommunityCommunity
Global Patient Global Patient IndexIndex
Concept Concept DictionaryDictionary
IUMG PCIUMG PC
IUMG SCIUMG SC
VAVA
MMGMMG
Global Provider Global Provider IndexIndex
Real time
HL7
Laboratory
Pharmacy
Radiology
ADT
Patient: John DoeMRN: 123-0Diagnosis: 410.0WBC: 14,000/cm3
Patient: John DoeMRN: 123-0Diagnosis: 410.0WBC: 14,000/cm3
Patient: John DoeMRN: 123-0Diagnosis: 410.0WBC: 14,000/cm3
Patient: John DoeMRN: 123-0Diagnosis: 410.0WBC: 14,000/cm3
Transcription
Other
20
INPC Characteristics
• Population Based• Clinical data augmented by claims –
“completeness”• Real time to monthly updates• May not be big enough yet for relatively rare
events

21
Second Take-away
• Automated surveillance can reliably, consistently identify “signals” some of which are adverse events
• It is possible to capture and curate population based data that can be used to identify adverse events

22
Signal Definition
• Circumstance that meets a set of specific preset criteria that are flagged
• Signals only indicate that an AE may haveoccurred

23
Signal Categories• Generic Outcome Screens – Instruments that focused
on adverse outcomes likely to be associated with drug use. For example: Readmission, death, transfer
• Surrogate Outcome Screens – Instruments that specifically screened for critical laboratory values or antidotes commonly used to treat ADEs. For example: Serum Creatinine > 1.5 mg/dL
• Combo screens – Instruments that used Boolean logic to combine drug exposure with subsequent adverse outcome or surrogate outcome. For example: Receiving “nephrotoxic drug” AND blood creatininehas risen more than 0.5 mg/dL in last 1 day

24
ADE processor
RepositoryRepositoryRepository SignalsSignals ADEADE ADEDatabase
ADEDatabase
Tiered, computer assisted human review
Compare to signal tables
Signal Counts
Time or eventtriggered processing

25
Signal ReviewTiered Chart Review Method
- Multiple levels of review- Non-clinical reviewers- Decrease clinicians time and overall expense- Electronic charts

26
Electronic Record Review

27
Investigating a Signal
• Observational (non-randomized) studies that may be used to characterize safety signals. – Have protocols– Test pre-specified hypotheses– Have control groups– Estimate the relative risk of an outcome

28
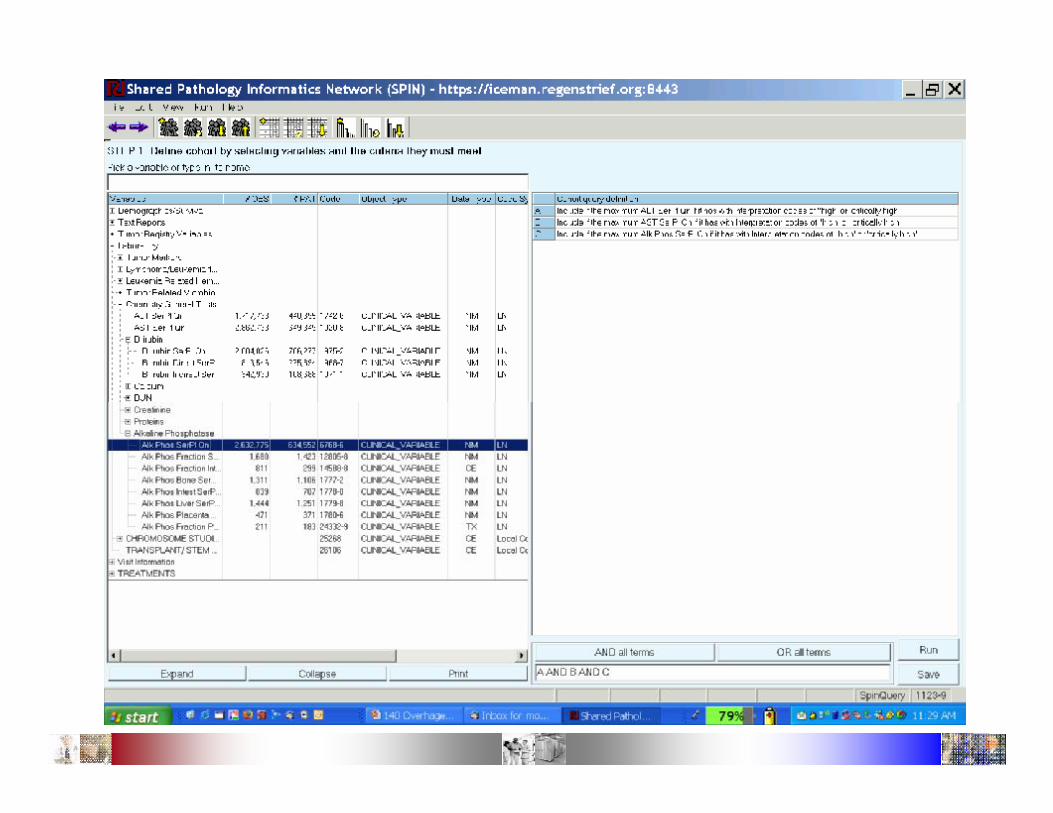
Specify Cohort

29
Specify statistical breakdowns

30
One way to show output as breakdowns

31
Weight Gain and Diabetes with Atypical Antipsychotics
Farwell JGIM 2004

32
Elevated LFTs and Statin Risk
Chalasani Gastroenterology 2004

33
Third Take-away
• Automated surveillance can reliably, consistently identify “signals” some of which are adverse events
• It is possible to capture and curate population based data that can be used to identify adverse events
• With population based data and automated surveillance methods we should be able to update risk information on an ongoing basis

34
Chicken Soup
• Computer systems can be the chicken soup for much that ails the health care system
• However, we should understand the real value and real costs if we are to do it right
McDonald JAMIA 2004McDonald JAMIA 2004

35

36
• There are additional data we need to betteranswer these questions
37

38

39