how realistic are the prospects for ‘closing the gaps’ in
TRANSCRIPT

ANU COLLEGE OF ARTS & SOCIAL SCIENCES
CENTRE FOR AbORIGINAL ECONOmIC POLICy RESEARCh
how Realistic are the Prospects for ‘Closing the Gaps’ in Socioeconomic Outcomes for Indigenous Australians?
J.C. Altman, N. Biddle and B.H. Hunter
CAEPR DISCUSSION PAPER No. 287/2008
Series NoteThe Centre for Aboriginal Economic Policy Research (CAEPR) was established at The Australian National
University (ANU) in April 1990. From 1990 to 2003 the Centre’s main research partner was the Aboriginal
and Torres Strait Islander Commission. Since 1 January 1999, CAEPR has operated as a University Centre
and is currently funded from a variety of sources including the ANU, Australian Research Council,
industry partners, and the Department of Families, Housing, Community Services and Indigenous Affairs.
CAEPR’s principal objective is to undertake high-quality, independent research that will assist in furthering
the social and economic development and empowerment of Aboriginal and Torres Strait Islander people
throughout Australia. Its aim is to be a world-class centre undertaking research on Indigenous economic
development issues that combines academic excellence with policy relevance and realism.
CAEPR is currently Australia’s major dedicated research centre focusing on Indigenous economic and
social policy from a national perspective. The Centre’s publications, which include the CAEPR Discussion
Paper series first established in 1991, aim to report on Indigenous circumstance, inform public debate,
examine government policy, and influence policy formulation.
CAEPR Discussion Papers are intended as one forum for the dissemination of peer-reviewed research by
Centre staff. These papers are produced both electronically and in hard copy.
Other CAEPR outputs include Research Monographs, Working Papers and Topical Issues. Copies of
Discussion Papers, Working Papers and Topical Issues are available for free electronic download from
CAEPR’s website <www.anu.edu.au/caepr/>, while Research Monographs can be accessed via the
ANU E Press website <www.epress.anu.edu.au>.
Printed copies of publications can be purchased through the website or from:
The Centre for Aboriginal Economic Policy Research
Hanna Neumann Building #21
College of Arts & Social Sciences
The Australian National University
Canberra ACT 0200
Telephone 02–6125 8211
Facsimile 02–6125 9730
As with all CAEPR publications, the views expressed in this Discussion Paper are
those of the author(s) and do not reflect any official CAEPR position.
Professor Jon Altman Director, CAEPR
The Australian National University
October 2008
Cover page images courtesy of the Australian Institute of Aboriginal and Torres Strait Islander Studies
and CAEPR staff members.
The Australian National University – CRICOS Provider #00120C

How realistic are tHe prospects for ‘closing tHe gaps’ in socioeconomic outcomes for indigenous australians?
J.c. altman, n. Biddle and B.H. Hunter
Jon Altman is ARC Australian Professorial Fellow and Director, Nicholas Biddle is a Research Fellow, and
Boyd Hunter is a Senior Fellow at the Centre for Aboriginal Economic Policy Research, College of Arts and
Social Sciences, The Australian National University.
No. 287/2008
issn 1036 1774
isBn 0 7315 5662 3


centre for aBoriginal economic policY researcH
discussion paper n0. 287 iii
contents
Abbreviations and acronyms......................................................................................................................................................iv
Abstract .............................................................................................................................................................................................v
Acknowledgments ..........................................................................................................................................................................v
Introduction .................................................................................................................................................................................... 1
Methodological considerations ................................................................................................................................................. 3
Long-run analysis of trends in Indigenous socioeconomic status since 1971 ........................................................... 5
Labour force status ................................................................................................................................................................. 5
Income status ............................................................................................................................................................................ 7
Household size, income and home ownership................................................................................................................ 7
Education.................................................................................................................................................................................... 8
Health .......................................................................................................................................................................................... 9
Summarising long- and short-run trends ........................................................................................................................ 9
Table 1. Absolute and relative change in Indigenous socioeconomic outcomes, long and short series .....11
Convergence and the prospects for closing the gaps ......................................................................................................12
Table 2. Number of years till convergence of Indigenous and non-Indigenous outcomes ..........................13
Conclusion .....................................................................................................................................................................................16
Notes ...............................................................................................................................................................................................19
Appendix A: Socioeconomic Outcomes Tables ...................................................................................................................23
Table A1. Socioeconomic outcomes for Indigenous Australians, 1971–2006 ...................................................23
Table A2. Socioeconomic outcomes for other Australians, 1971–2006 ..............................................................24
Table A3. Ratio of Indigenous to non-Indigenous socioeconomic outcomes, 1971–2006 ............................24
References......................................................................................................................................................................................26
iv altman, Biddle & Hunter
centre for aBoriginal economic policY researcH
aBBreviations and acronYms
ABS Australian Bureau of Statistics
AGPS Australian Government Publishing Service
ANTAR Australians for Native Title and Reconciliation
ANU The Australian National University
ATSIC Aboriginal and Torres Strait islander Commission
CAEPR Centre for Aboriginal Economic Policy Research
CASS College of Arts and Social Sciences (ANU)
CDEP Community Development Employment Program
DEWR Department of Employment and Workplace Relations

centre for aBoriginal economic policY researcH
discussion paper n0. 287 v
aBstract
‘Practical reconciliation’ and more recently ‘closing the gaps’ have been put forward as frameworks on
which to base and then evaluate policies to address Indigenous disadvantage. This paper uses census-based
analysis at the national level to examine trends in Indigenous wellbeing since 1971. There has been steady
improvement in most socioeconomic outcomes as measured by standard social indicators in the last 35
years. This finding is at dramatic odds with the currently dominant discourse of failure in Indigenous affairs.
However, evidence of convergence between Indigenous and non-Indigenous outcomes is not consistent.
There have now been eight censuses since 1971, and this paper seeks to use information of best-case
scenario trends to make some crude estimates of when the gaps might be closed in order to assess the
realism of this emerging overarching goal of policy.
Keywords: historical evidence of disadvantage, prospects for ‘closing the gaps’, Indigenous statistics.
acKnowledgments
An earlier version of a part of this paper was presented to the 2007 Australian Institute of Aboriginal and Torres Strait Islander Studies conference themed Forty Years On: Political Transformation and Sustainability since the Referendum and into the Future in a session titled ‘40 years on: What do official statistics tell us about Indigenous well being’. Another preliminary version of the paper was presented at a seminar given at the University of Wollongong on 12 June 2008. Useful comments were generously given by Mike Dillon, Bill Fogarty, Melinda Hinkson, Melissa Johns, Will Sanders and John Taylor. We are especially grateful for the editorial assistance provided by John Hughes and Hilary Bek. In the lead up to the Australia 2020 Summit, some preliminary results and discussion from this paper were placed on the CAEPR website to inform that
very public debate.


centre for aBoriginal economic policY researcH
discussion paper n0. 287 1
introduction
The notion of ‘closing the gaps’ has attracted considerable attention in Australia during the early days
of the new Rudd government elected in November 2007. This is partly because while in Opposition the
current Prime Minister had already supported a ‘Closing the Gap’ campaign—championed by Oxfam, Get Up,
Australian for Native Title and Reconciliation (ANTAR) and other Australian non-government organisations—
that focused on the 17 year life expectancy gap between Indigenous and non-Indigenous Australians.1 As
part of the national apology to the Stolen Generations made on 13 February 2008, specific reference was
also made to closing the gaps in Indigenous child mortality within set time frames. More recently, on 20
March 2008, the new Prime Minister signed a declaration of intent to eliminate the life expectancy gap
between Indigenous and other Australians within a generation.2 On 5 April 2008, while overseas, Kevin Rudd
made a commitment to have annual progress reports on meeting this target tabled in parliament. While the
term initially focused on life expectancy gap, the concept has gradually morphed to encompass other forms
of disadvantage—this is an acknowledgement that the social determinants are likely to be crucial factors
driving the disparities between Indigenous and non-Indigenous health (Bronfenbrenner 1979).
The origins of the term ‘closing the gaps’ can probably be traced to the special programs of governments
in New Zealand in the 1990s that sought to target Maori and Pacific Islander disadvantaged groups with
assistance (Te Puni Kòkiri 2000). In Australia, a similar policy of targeted assistance to Aboriginal and Torres
Strait Islanders had come to prominence in the late 1980s, with the Aboriginal Employment Development
Policy of the Hawke government committing to statistical equality in employment, income and educational
status between Aboriginal and other Australians by the year 2000 (Altman 1991; Australian Government
1987). There appears to be no substantive difference between ‘closing the gaps’ and ‘statistical equality’: both
concepts seek to eliminate socioeconomic disparities. This too was the intent of the Howard government’s
notion of ‘practical reconciliation’ that came to prominence after John Howard’s election victory speech
in October 1998. As a policy framework, practical reconciliation sought to reduce Indigenous material
disadvantage in the areas of health, housing, education and employment (Altman 2004: 39). This goal was
closely aligned with a growing emphasis during the decade from 1998 on mainstreaming or normalisation,
but successive Howard governments were careful not to stipulate precise timeframes for achieving such
goals.3 A strong case can be made that the goal of practical reconciliation, without any clearly specified
timeframes for achievement of such goals, was itself highly symbolic. It was good political rhetoric but did
not provide a basis for a comprehensive policy framework.
2 altman, Biddle & Hunter
centre for aBoriginal economic policY researcH
It was only in the aftermath of the Northern Territory National Emergency Intervention that the Howard
government committed, in its last days, to concrete targets with its pledge to ‘stabilise, normalise and exit’
73 prescribed communities in five years (Altman & Hinkson 2007). Arguably, this pledge could be interpreted
as a commitment to close the gaps within that time frame. In response to the federal intervention, the
language of ‘closing the gap’ was adopted by the Northern Territory government in August 2007 with its
Closing the Gap of Indigenous Disadvantage: A Generational Plan of Action (Northern Territory Government
2007).
This paper sets out to do two things, each with some precedents in the recent research literature.
First, in 2004, the authors of this present paper collaborated in an article that provided a historical account
of Indigenous socioeconomic change between 1971 and 2001 (Altman, Biddle & Hunter 2005). Examining
differences between Indigenous and non-Indigenous socioeconomic outcomes has been a policy research
issue for one of us since 1971 Census data first became available (Altman & Nieuwenhuysen 1979). Tracking
such change over time has been a core objective of the Centre for Aboriginal Economic Policy Research
(CAEPR) since its establishment in 1990 (Altman & Rowse 2005; Rowse 2002). Such analysis has focused on
both absolute and relative change according to standard social indicators over time. The initial aim of this
paper is to update this time series with 2006 Census data that became available late in 2007.
Second, and most innovatively, we use the emerging trends from data collected in the last eight censuses
to make some predictions about when the existing statistical gaps between Indigenous and non-Indigenous
outcomes might close and where there is convergence in longer term trends. We are not aware of such
extrapolation being attempted across a similar number of variables. Previously projections tended to focus
on short run to medium term demographic change and population growth, with most forecasts being used
to predict the associated impacts on employment in reports with titles like The Job Ahead and The Job
Still Ahead (see Hunter, Kinfu & Taylor 2003; see Taylor & Altman 1997; Taylor & Hunter 1998). Earlier
still, a number of publications had predicted that the Hawke government’s goal of statistical equality for
Indigenous Australians by 2000 was destined to fail for a number of reasons including historical legacy,
cultural difference, diversity of circumstances, geographic distribution and unanticipated rapid population
growth (see Altman & Sanders 1991; Gray & Tesfaghiorghis 1991; Sanders 1991).4
The likely success of the ‘closing the gaps’ policy depends on what happens in non-Indigenous Australia.
Obviously ‘the gap’ is directly affected if the non-Indigenous benchmark changes; however the ability of
Indigenous outcomes to reach such benchmarks will also change with variations in social and economic
conditions. An important consideration in this regard is macroeconomic growth, which varies across the
business cycle. Low-skilled workers with little experience—a group that includes most Indigenous people—
tend to be the last workers hired in a period of macroeconomic growth and the first workers shed in an
economic downturn (i.e., Last In First Out or LIFO accounting). Businesses often rationalise this behaviour
on the grounds that they want to minimise turnover of their most experienced (and usually most highly
value-added) staff. The crucial point is that the ability to close the gap cannot be sustained indefinitely

centre for aBoriginal economic policY researcH
discussion paper n0. 287 3
as it depends on macroeconomic growth, which by definition goes up and down with the business cycle.
Therefore relative Indigenous outcomes are likely to improve during sustained periods of economic growth,
but all else being equal, relative outcomes tend to stagnate or worsen in recessionary periods of the cycle.
After discussing relevant methodological issues, this paper provides data on currently observed trends in
Indigenous and non-Indigenous outcomes since 1971. Obviously it is not possible to assume that there is
always going to be convergence in outcomes, so the following census-based analysis merely provides two
scenarios for estimating some temporal bounds on when the gaps might be closed. It is important to emphasise
that improving the socioeconomic circumstances of a sub-population relative to the rest of the population is
a complex policy task. We focus on relatively optimistic scenarios where there is convergence, as these provide
evidence of what might happen in the future if all the ‘macro’ factors were working in the right direction to
close the gaps. The concluding section reflects on some of the issues arising from this analysis.
metHodological considerations
It is important to be explicit about the methodological challenges that arise when using official statistics
from the census. While we have learnt from the recent experience of describing economic history (Altman,
Biddle & Hunter 2005), there are several issues that arise for any researcher undertaking systematic analysis
of the national population of Indigenous Australians.
These caveats can be categorised into three groups: practical problems, methodological issues and conceptual
difficulties. One practical issue is that, over the last 35 or so years, the size of the Indigenous population has
increased dramatically. One reason for this is that Indigenous people have become increasingly confident
about self-identifying as Indigenous since 1971. This means that one cannot be entirely sure that observed
trends are due to real changes in outcomes rather than to changes in composition of the population. Hunter
(1998) argues that one could ignore this issue, at least for some of the period we examine, because it does
not have a significant impact on socioeconomic outcomes of Indigenous cohorts relative to similar cohorts
for the rest of the Australian population. Another practical problem is that changes in census questions
and coding make it difficult to get precise comparisons over time. The important thing here is that analysts
should be transparent about any assumptions they make in constructing trends. Most of the assumptions
used in this paper were outlined in Altman, Biddle and Hunter (2005), but there are a few related issues for
the 2006 Census and these will be outlined below where relevant.
One methodological issue is that the Australian Bureau of Statistics (ABS) did not initially have a great deal
of experience in collecting comprehensive statistics about Indigenous Australians before the 1971 Census.
While the ABS has learnt from its experiences over time, the improved data coverage (and hence quality)
may itself alter observed trends.
Conceptually two main issues need to be emphasised. First, a person’s Indigenous or non-Indigenous status
is primarily based on self-identification derived from a census form completed by individuals. Even here

4 altman, Biddle & Hunter
centre for aBoriginal economic policY researcH
there is some variation—in very remote regions a special enumeration strategy is used that allows ABS
staff to target Indigenous people and assist them in completing specially designed Indigenous personal
and household census forms (Altman & Gray 2000). What is important to note is that the Indigenous sub-
population used here (and generally) for comparative purposes is a statistical aggregation of individuals
who identify, or are identified, as Indigenous rather than a well-defined sociological category. Second, the
social indicators that are drawn from census questions reflect the social norms of the dominant mainstream
society. Arguably, a number of social indicators that we use mean different things to Indigenous and non-
Indigenous Australians.
Following Altman, Biddle and Hunter (2005), this paper focuses only on national trends. The main shortcoming
of this approach is that a national analysis loses the diversity in geographic outcomes, such as the local
labour market conditions that are likely to be particularly important in influencing changes in socioeconomic
status. However, the benefit of a national analysis is that the problem of selective migration between regions
will not undermine the robustness of the analysis. Another advantage of a national analysis is that it dilutes
any possible impacts of changed Indigenous population composition alluded to above. It is impossible to
undertake rigorous sub-national analysis of trends over such a long time period because of the large regional
variations in the unexplained component of Indigenous population growth—that is, the population growth
related to increased self-identification and inter-marriage between Indigenous and non-Indigenous people.
Settled parts of Australia are likely to have particularly large increases in the number of people who now
identify as Indigenous but did not do so in previous censuses (Ross 1999).
We have selected robust variables based on both the availability of historically comparable data and our
previous experience in constructing such trends (Altman, Biddle & Hunter 2005). There have been eight
censuses between 1971 and 2006, but not all provide reliable information about Indigenous Australians. The
1976 Census only analysed information on 50 per cent of the population (as a cost cutting measure) and is
therefore difficult to compare with the other censuses. If nothing else 1976 data will be less reliable and any
trend calculated using that data are likely to be problematic. The other consideration is that some data were
not collected in all censuses. For example, income data was not collected in 1971 (Altman & Nieuwenhuysen
1979).
A problem for comparative inter-censal analysis is that questions asked and coding of responses changed
significantly between censuses. Fortunately, the last three censuses have broadly comparable questions, and
to a lesser extent comparable coding, and hence it could be argued provide the most reliable estimates of
short-term trends.5 The down-side of the use of these short run trends between 1996 and 2006 is that this
period falls entirely within the growth phase of the current economic cycle. The extrapolation of trends
usually requires more than a few observations, so in this paper we also use the long run trends based on
information collected as far back as 1971 whenever possible. When no comparable data are available for
earlier censuses before 1996, the earliest available valid data are used as the base from which to calculate
trends.

centre for aBoriginal economic policY researcH
discussion paper n0. 287 5
Even where data were collected, they are not always available in a usable form. For censuses before 1996 we
often had to rely on published data, which were often not sufficiently flexible to allow the calculation of
comparable statistics. The 1986 Census is particularly problematic in this regard and was consequently not
used here to estimate long-term trends in socioeconomic outcomes for Indigenous and other Australians.
long run analYsis of trends in indigenous socioeconomic
status since 1971
The 2006 Census allows us to update the analysis in Altman, Biddle and Hunter (2005) so that we can
track changes in socioeconomic outcomes since 2001. This paper augments the tables in the 2005 paper
by including comparable data from the 1996 and 2006 censuses in order to provide detailed information
on trends in socioeconomic outcomes for both Indigenous and non-Indigenous Australians.6 The following
sections provide a broad summary of this information, which is documented in the tables at Appendix A.
Tables A1, A2 and A3 respectively document socioeconomic outcomes for Indigenous Australians, non-
Indigenous Australians, and the ratio between the two.
laBour force status
The early 1970s were characterised by some of the lowest unemployment rates in Australia’s recorded
history. In contrast, the stagflation of the mid 1970s and the international recession of the early 1990s
saw large increases in unemployment which were particularly pronounced for the Indigenous population.
Since that time unemployment has fallen for Indigenous and non-Indigenous groups in one of the longest
unbroken periods of economic expansion ever seen in Australia. Indigenous unemployment rates have very
similar trends to non-Indigenous rates—the main differences arise from the Indigenous labour force being
disproportionately affected by the recessions of the early 1980s and 1990s.
A complicating factor for interpreting Indigenous labour force status is the rapid expansion of the
Indigenous-specific Community Development Employment Program (CDEP). CDEP was devised by the
Fraser government in 1977 when unemployment benefits were first being introduced to remote Indigenous
communities (Sanders 1997).7 In the early 1980s, some ‘teething’ problems with CDEP were addressed and
the scheme began expanding. Notwithstanding its historical connection and early notional fiscal nexus
with unemployment benefits, CDEP is regarded as employment for official statistical purposes, although
the census does not have a separate category for CDEP scheme participants in the mainstream forms used
predominantly in non-remote regions.
The incidence of CDEP increased only gradually and so was a relatively minor influence on Indigenous
employment until 1991. The scheme then expanded rapidly as a key element of the Aboriginal Employment
Development Policy. It reached the height of its significance in the period analysed in the 2001 Census,
when it incorporated just over one-tenth (10.9%) of the Indigenous adult population aged 15 and over. It

6 altman, Biddle & Hunter
centre for aBoriginal economic policY researcH
has declined quite markedly since that peak, and at the time of the 2006 Census employed just under 7.7
per cent of Indigenous adults.8
After 1991, the substantial growth in CDEP participation means that the difference between Indigenous
and non-Indigenous unemployment rates will appear less over time, as more Indigenous unemployed get
classified as employed once they take up a place in a CDEP scheme—however, the estimated trends in
Indigenous unemployment are unlikely to be effected before 1991. The existence (and growth) of the CDEP
scheme means that our scenarios of when the unemployment gap might be closed are relatively optimistic.
Another way to assess the labour market outcomes for Indigenous Australians is the percentage of the
population aged 15 years and over who are employed. It was only in 2006 that this ratio for the Indigenous
population rose above that measured at the 1971 Census. This is not surprising, since previous research has
shown that the low-skilled Indigenous labour force suffered severely from the collapse in the demand for
labour in the period of economic re-structuring that occurred after the stagflation of the mid 1970s (Fisk
1985; Gray & Hunter 2002; Hunter & Gray 1998). However, the emphasis on the role of CDEP in causing poor
Indigenous employment outcomes in recent public debates seems to be challenged by the statistics presented
here. The decline in the Indigenous employment to population ratio occurred almost entirely before 1986,
before CDEP participation became a significant aspect of Indigenous labour market experience.
If one chose to consider CDEP participation as a form of welfare rather than employment, then Indigenous
employment outcomes are substantially worse today than they were in the early 1970s (see Hunter 2007a).9
In contrast, non-Indigenous employment improved, largely in the last three censuses. Again, the role of the
CDEP scheme in improving Indigenous employment tends to provide an optimistic estimate of convergence
in this indicator.
Given that the CDEP complicates our estimates of trends in Indigenous employment, it is instructive to
exclude this form of employment and focus solely on private sector employment. Indigenous private sector
employment was particularly affected by the structural adjustment in the Australian economy during the
1970s, especially the decline in the manufacturing and agricultural industries (Altman & Nieuwenhuysen
1979). However, private sector employment has expanded considerably since 1981, with the increase greater
for Indigenous Australians than other Australians, especially in the last inter-censal period 2001–06. While
trends in private sector employment will not be influenced by the rise (and recent decline between 2001
and 2006) in CDEP employment, it will be affected by the increased incidence of privatisation that became
popular with Federal and State/Territory governments since the microeconomic reforms that began in the
1980s (Quiggin 1996). Unless privatisation disproportionately increases the number of low-skilled jobs
that many Indigenous people are employed in, it is unlikely to substantially affect our estimated date for
convergence of Indigenous and non-Indigenous outcomes, for the closing of the employment gap.
Labour force participation rates measure the percentage of the population who either work or look for
work and are a key indicator of economic engagement. Participation rates increased to 1991 for both
centre for aBoriginal economic policY researcH
discussion paper n0. 287 7
Indigenous and other Australians, largely as a result of increased participation of females. While there was
some improvement in relative participation of Indigenous population vis-à-vis other Australians between
1971 and 1991, outcomes have tended to decline since that time as Indigenous participation has fallen at a
time when overall labour force participation is static.
income status
One of the main benefits of employment is a higher income or improved access to economic resources.
Appendix A records the trends in median personal income since 1981, the earliest year that robust income
data were available. Median personal income has gradually increased for the Indigenous population since
1981, but the trend is not as consistent as it is for the non-Indigenous population which saw a combination of
stagnation and decline to 1996, but large increase since that time. Consequently the relative income measure
improved for Indigenous people until 1996, but declined since that time. Notwithstanding the increases in
private sector employment for Indigenous people, the financial benefits of recent macroeconomic growth
over the last 10 years seem to be accruing disproportionately to the non-Indigenous population. This is
consistent with Australian inequality literature that has shown larger increases at the top end of the income
distribution, historically high asset prices and sustained, substantial profits for companies (Hunter 2003;
Leigh 2005). Assets and profits are sources of income that Indigenous Australians generally do not enjoy.
HouseHold size, income and Home ownersHip
The average Australian household has been getting smaller over the period being covered here. While Indigenous
households remain substantially larger than other Australian households, their absolute size has declined
substantially towards the non-Indigenous average, especially since 1991. The relative decline in Indigenous
household size compared to non-Indigenous households was limited by the ongoing demographic change
that has reduced the size of many, or even most, Australian households.10 One potential positive implication
of this is that the Indigenous housing stock will have less pressure on it than it has had historically, unless
this historic decline is offset by population growth that outstrips formation of new housing stock.
One reason why the decline in Indigenous household size is important is that household income is one of the
major determinants of poverty since the more people in a household, the greater the opportunity to pool
their resources for living expenses. Poverty studies routinely control for household size and composition to
determine changes in standard of living and welfare (using an ‘equivalence scale’ adjustment).11 At a purely
mechanical level, average household income will decline with a fall in average household size—to the extent
that this fall represents a decline in the number of adults with a potential to earn income. Alternatively, the
recent decline in Indigenous fertility may entirely explain the fall in household size (Kinfu & Taylor 2002). If
this is the case, then the living standards of Indigenous households will increase because of the decline in
the number of dependents using household resources.12 While it is beyond the scope of this paper to resolve
such issues, they should be borne in mind when analysing changes in household income.
8 altman, Biddle & Hunter
centre for aBoriginal economic policY researcH
Raw household income fell for both Indigenous and non-Indigenous populations to 1991, and then
increased substantially thereafter. Given that average personal income increased substantially for Indigenous
Australians in the 10 years to 1991 (while non-Indigenous personal income did not change that much), the
decline in household income is likely to be due to the declining household size. Another factor may be the
relatively depressed labour market during the recession of the early 1990s, which seems to have particularly
affected Indigenous employment. That is, some households would be disproportionately affected by the
relatively large number of low income people without well-paid employment. This observation is even more
germane if one takes into account the fact that 6.8 per cent of Indigenous adults were employed in the CDEP
in 1991. The increases in household income in the last two censuses are likely to be influenced by buoyant
labour market conditions and historically high real wages, but it may also be associated with new generous
government transfers to all families.13
The rate of home ownership among the non-Indigenous population has been stable for many years at
just over 70 per cent. If anything the incidence of home ownership has declined slightly in recent years
with the widespread fall in affordability associated with the rising house prices, especially in metropolitan
areas (Harding, Yap & Lloyd 2004). The proportion of the Indigenous population living in a home owned by
residents declined substantially in the 20 years after 1971, but there has been steady increase since 1991.
Indeed, the incidence of Indigenous home ownership has been equivalent to or exceeded the 1971 level since
the 1996 Census.
education
Overall, Australians are also more likely to gain educational qualification than ever before. Indigenous
Australians have matched this trend quite closely and have even experienced a very small relative improvement
in the incidence of post-school qualifications. However, the outcomes from post-school qualifications
depend heavily on the type of qualification obtained, with degrees from universities having the largest
overall economic benefits in terms of income and employment (Biddle 2007). Unfortunately, proportionally
far fewer Indigenous people secure degrees than other Australians, so the trend in qualifications is not
as positive as first appearances suggest. This notwithstanding, there has been reasonably steady gains in
Indigenous education participation and completion over the 35 years studied.
The complexity of interpreting the change in educational outcomes is illustrated in the recent National
Report to Parliament on Indigenous Education and Training. Even though this Report focuses on short-term
trends, the number of Indigenous students studying at higher education actually declined in 2005 and was
at its lowest level since the year 2000 (Commonwealth of Australia 2007: 217). That report also speculates
that some potential students postponed higher education studies to take advantage of the strong labour
market, and that many students are viewing vocational training as a means of taking advantage of job
opportunities in the buoyant industries (Commonwealth of Australia 2007: xxxi).

centre for aBoriginal economic policY researcH
discussion paper n0. 287 9
HealtH
One of the best measures of health status is life expectancy. Unfortunately, it is not possible to present
updated trends because the official method for estimating Indigenous life expectancy has recently changed
(see Bhat method in ABS 2004). The new method controls for changing rates of Indigenous self-identification
between censuses, but it is difficult to estimate long run trends because Indigenous life expectancy has to
be re-estimated for each inter-censal period. Notwithstanding the strengths and weaknesses of the official
method for estimating Indigenous life expectancy, Altman, Biddle and Hunter (2005) collated the extant
comparable historical data to make some assessment of long run trends in life expectancy before 2001 (see
also Ross & Taylor 2002).
Indigenous male life expectancy generally did not improve at the same rate as that for the non-Indigenous
males, especially after 1991. Life expectancy for Indigenous females was more variable. After the substantial
improvement between 1971 and 1981, the relative life expectancies for Indigenous females declined gradually
after 1981 as the life expectancy for non-Indigenous females increased steadily.14
Health status can also be estimated by a rough proxy that can be measured consistently for all of the
relevant censuses: the proportion of the population aged over 55 years (Altman, Biddle & Hunter 2005). The
proportion of the population who can be characterised as ‘elderly’ is an imperfect measure of health because
it is also affected by the fertility rate, which determines the total population numbers in the denominator.
Notwithstanding, an increase in the proportion of the population who are elderly can be construed as
enhancing welfare if it represents either a decline in fertility or a reduction in adult mortality. If fertility is the
driving factor, then Indigenous households will benefit from a long-term reduction in age-related dependency
rates, which ultimately reduce the demands on household financial and infrastructural resources.
In terms of the percentage of the population who were elderly, the relative situations for Indigenous people
worsened between 1971 and 1991. After 1991, Indigenous outcomes did not change relative to the non-
Indigenous outcomes until the latest census. It should be noted that while the Indigenous demographic
profile is not substantially different to that in 1971, the non-Indigenous profile has changed to reflect the
aging of the population in the last three and a half decades.
summarising long- and sHort run trends
Given that there are well-founded concerns about the reliability of historical data for Indigenous people
we present two sets of trends which we will use to estimate the period till various ‘gaps’ might be closed.
The first set of estimates is based on long run trends that use as much information as is available and that
we judge to be reliable and comparable. This dates back to 1971. The second set of projections estimate
trends based on three observations from the post-1996 period. These short run trends are provided because
we can be reasonably confident that such data are reliable and relate to an Indigenous population which is
enumerated more or less comprehensively.15
10 altman, Biddle & Hunter
centre for aBoriginal economic policY researcH
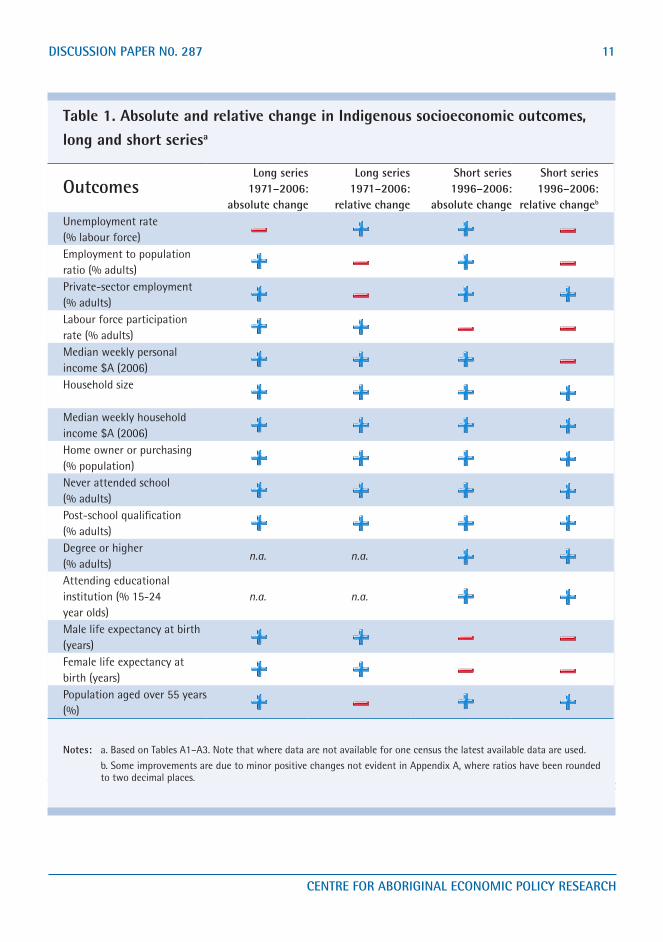
In addition to the above narrative, Appendix A is also summarised in absolute and relative terms in Table 1.
This summary is provided according to changes observed for a long series1971–2006 and for a short series
1996–2006. Absolute differences are based on Table A1 data, and relative differences from Table A3, which
provides Indigenous to non-Indigenous ratios.
Rather than distract the reader with excessive detail, the outcomes from these statistics are presented in
Table 1 with a plus (+) to indicate improvement and with a minus (-) to indicate decline in socioeconomic
outcome. Our findings can be briefly summarised as follows. For the longer series there are improvements in
12 of 13 variables in absolute terms and 10 of 13 variables in relative terms. For the shorter, more statistically
reliable series, there are improvements in absolute terms for 12 of 15 comparable variables and in relative
terms for nine of 15 variables.
In overall terms, both series suggest that in absolute and relative terms Indigenous socioeconomic outcomes
have improved at the national level for most variables.16
These findings are very much at odds with the dominant discourse of Indigenous affairs policy failure in the
past 35 years. For example, there has been an unambiguous improvement (in both absolute & relative terms)
for both the long run and short run series in the areas of household size and income, home ownership and all
the education outcomes. Table 1 indicates that improvements were not always consistent for the short run
and long run series for two crucial areas: labour force status and health. As indicated above, the labour force
trends are affected by the growth of the CDEP scheme, and also by the large-scale structural adjustment
in the Australian economy, which became increasing open to international competition following gradual
reductions in tariffs and other trade barriers since 1974. Indigenous workers were and are disproportionately
employed in the manufacturing sector, which was severely effected by such structural adjustment (Hunter
2004). It is also probable that there was some residual structural adjustment from the equal pay cases in the
pastoral awards during the mid-1960s (Kerr 1986; Rowse 1998).
There was also a certain lack of concordance between the absolute and relative changes in the short run and
long run for certain health indicators. In that case the first thing to note is that the changes to the method
of calculating life expectancy means that the short run series is based on a brief five year period between
1996 and 2001. Given that part of the reason for changing the methodology was dissatisfaction with the
assumptions that underpin the calculations, it is advisable to be particularly cautious about these estimates.
However, even if one focuses solely on the health proxy of the incidence of elderly population there is
some inconsistency in the short run and long run series. While there were absolute improvements in both
series, the long run trends in relative outcomes are actually negative. The demographic bulge of the non-
Indigenous baby boomers is working its way through Australian society over this period, and in this context
the relative improvement in the number of older Indigenous people is particularly noteworthy.
Table 1 provides a summary of the broad trends since 1971 (and 1996) to assist the reader distinguish
between absolute and relative changes or trends. There was obviously an even greater variation in trends
for the various inter-censal periods, but it is beyond the scope of this paper to elaborate on all noteworthy
centre for aBoriginal economic policY researcH
discussion paper n0. 287 11
The employment to population ratios are diverging for both trend estimates. Convergence in employment
Table 1. Absolute and relative change in Indigenous socioeconomic outcomes, long and short seriesa
outcomeslong series
1971–2006: absolute change
long series 1971–2006:
relative change
short series 1996–2006:
absolute change
short series 1996–2006:
relative changeb
Unemployment rate (% labour force)Employment to population ratio (% adults)Private-sector employment (% adults)Labour force participation rate (% adults)Median weekly personal income $A (2006)Household size
Median weekly household income $A (2006)Home owner or purchasing (% population)Never attended school (% adults)Post-school qualification (% adults)Degree or higher (% adults)
n.a. n.a.
Attending educational institution (% 15-24 year olds)
n.a. n.a.
Male life expectancy at birth (years)Female life expectancy at birth (years)Population aged over 55 years (%)
notes: a. Based on Tables A1–A3. Note that where data are not available for one census the latest available data are used.
b. Some improvements are due to minor positive changes not evident in Appendix A, where ratios have been rounded to two decimal places.
12 altman, Biddle & Hunter
centre for aBoriginal economic policY researcH
variations in trends. Interested readers are referred to Altman and Hunter (2003) and invited to draw their
own inferences from the data provided in the Appendix.17
convergence and tHe prospects for closing tHe gaps
As indicated above, some of the data in Appendix A were not collected in 1971 (e.g. income), while other
data were either unavailable publicly or were not available in a consistent form for all censuses (e.g. private
sector employment or home ownership data). Notwithstanding such difficulties it is possible to estimate
trends for many of the data sets reported in Altman, Biddle and Hunter (2005). In order to estimate the
prospect for closing the gaps we have estimated the number of years before a gap could be closed using
trends identified in Appendix A over two time periods, 1971–2006 and 1996–2006.18 That is, using a simple
(linear) projection of observed changes in relative outcomes, we estimate when Indigenous indicators will be
the same as those for other Australians.
Where the time series is not complete we use the trends based on the longest available period. Convergence
is estimated as the number of years required to eliminate the gap between Indigenous and non-Indigenous
Australians (where the gap is measured in relative terms) following current trends. In order to account
for the fact that there is some variation in the longest period for which consistent data are available, the
trend estimates are calculated as the improvement in relative outcomes per year. This trend (or gradient) is
projected out to identify the time when the ‘gap’ between Indigenous and non-Indigenous indicators will
be removed.
From an analytical perspective it is always risky to make excessively precise claims about long-range
forecasts. While our analysis here does not present a formal time series analysis, readers should bear in
mind that forecast errors always increase as the lead time becomes longer (Armstrong 2001). Most forecasts
become unreliable quite quickly and are rarely reliable after a decade has lapsed. The unreliability of our
estimates of convergence is underscored by the fact that there is a divergence between Indigenous and non-
Indigenous outcomes for several of the variables examined. Accordingly, our estimates must be interpreted
as an optimistic or best-case scenario for the possibility of closing the gaps, if current trends continue. Our
estimates are not a prediction of what will happen, but rather a description of what may happen if current
trends continue.
Note that not all trends in Indigenous and non-Indigenous outcomes converge. Indeed, divergence in
outcomes can even occur if Indigenous outcomes are improving in absolute terms, but such increases are
not as large as those evident for other Australians. The main divergence in outcomes occurs in labour market
data, where Indigenous outcomes are not improving over the long term at the rate of other Australians.
However, this is an area which is complicated by the effect of CDEP and the disproportionate location of
Indigenous people in regional and remote areas where labour market conditions are relatively depressed
(nodes of high mining activity aside).

centre for aBoriginal economic policY researcH
discussion paper n0. 287 13
For those outcomes that are converging, Table 2 reports when the expected number of years till convergence
might occur if policy settings do not change significantly. If the number of years to convergence is greater
than 100 years, then the table entry is shown as 100+. This was done in acknowledgment of the fact that any
forecast over this time frame is highly uncertain and hence unreliable. Having regard to the commitment to
close the gaps within one generation, the truncation of the estimated convergence estimates at 100 years
viewed as indicating whether the gaps might be closed in just over three generations.19
The long run trends in unemployment rates indicate that Indigenous and non-Indigenous outcomes will
converge in 28 years around the year 2035. This is a potentially excessively optimistic scenario because it
may be associated with the rise of the CDEP scheme. Indeed, the more recent inter-censal trends show that
Indigenous and non-Indigenous unemployment rates are diverging—an observation that might be associated
with the relatively stagnant number of CDEP participants (at least in net terms between 1996 and 2006).
Table 2. Number of years till convergence of Indigenous and non-Indigenous outcomes
convergence based on long run trends since 1971
convergence based on post-1996 trends
Unemployment rate (% labour force) 28 **
Employment to population ratio (% adults) ** **
Private-sector employment (% adults) ** 23
Labour force participation rate (% adults) 100+ **
Median weekly personal income $A (2006) 100+ **
Household size 100+ 100+
Median weekly household income $A (2006) 94 100+
Home owner or purchasing (% population) 100+ 100+
Never attended school (% adults) 2 14
Post-school qualification (% adults) 44 25
Degree or higher (% adults) NA 100+Attending educational institution (% 15-24 year olds) NA 63
Male life expectancy at birth (years) 100+ **
Female life expectancy at birth (years) 47 **
Population aged over 55 years (%) ** 100+
note: If Indigenous and non-Indigenous outcomes are diverging then the entry is a double asterisk. The trends are based on the maximum period for which comparable data was available. For example, the long run convergence for income calculated from 1981 as there were no available estimates for 1971. If the number of years to convergence is greater than 100 years, then the table entry is shown as 100+.
14 altman, Biddle & Hunter
centre for aBoriginal economic policY researcH
The employment to population ratios are diverging for both trend estimates. Convergence in employment
and unemployment are obviously dependent on where Indigenous live, the structure of incentives facing
individuals and organisations (who are making decisions on where to locate), as well as the state of national
and regional economies. With respect to the latter, there is some indication that the long national economic
boom may be coming to end. If this happens, then low qualified and short-term workers are often the first
to be shed by firms whose profit margins are being squeezed.
As noted above, Indigenous private sector employment has been particularly depressed until the late 1980s.
However, private sector employment increased substantially for Indigenous people since 1996. This may reflect
the tendency to privatise low-skilled jobs in the public sector, but it has been achieved despite the relatively
depressed labour market conditions in regional Australia. While this recent improvement of Indigenous
participation in the private sector is noteworthy, the estimated year of convergence in 23 years may be
excessively optimistic, as it assumes sustained economic growth at recent historically high levels.
Relative labour force participation rates improved for Indigenous Australians since 1971, but recent trends
show that Indigenous people have been rather less successful in this crucial dimension of economic
engagement since 1996. The most optimistic scenario for the rate of long run improvement in relative
outcomes shows that the gap in labour force participations will not be eliminated within the next century.
The convergence of individual income is only evident in the long run trends—even then convergence
tends to be rather slow, with an estimated closing of the gap projected to take at least another 100 years.
The lack of income convergence evident from recent trends may be a reflection of the growing national
income inequality where low income groups are not faring as well as the rest (especially the top 25% of the
distribution, see Leigh 2005).
The decline in Indigenous household sizes vis-à-vis other Australians offers a rather more positive story. On
current trends it will be at least three generations before this gap is closed. However, this is one gap that
we would be reasonably confident that can be closed because the demographic and economic factors will
tend to be mutually reinforcing. High educational outcomes and income tends to be associated with smaller
families. For example, human capital models make a firm prediction of this occurring, largely as a result
of the increasing opportunity cost of female time—hence making work more attractive relative to home
production activities (Becker, Murphy & Tamura 1990).
Median household incomes appear to be converging albeit rather slowly. The long run trends indicate that
the gap will be closed in 94 years. In contrast, recent trends seem to indicate that convergence will not
occur for at least another 100 years. The recent trends illustrate the main problem with a paradigm based
on closing the gaps—namely that the goal posts continually move. Indigenous household income improved,
but not as fast as that of non-Indigenous Australians. Another point that needs to be made is that raw
household income will converge faster than predicted in Table 2 because the size of Indigenous households
fell by more than non-Indigenous households, thus reducing the number of people who could assist to close
the gap in household income.
centre for aBoriginal economic policY researcH
discussion paper n0. 287 15
The predicted convergence in home ownership is estimated to take place in around 100 years time.20 It is
probable that the rate of convergence will be closely linked to the ability to improve Indigenous household
incomes. The other relevant factors are the ability to resolve current transactions and administrative costs
that seem to impede the individuation of leases on Aboriginal-owned land. Unless such tenure issues are
resolved, institutional barriers might result in the home ownership gap being intractable.
The most optimistic prediction is for the education convergence. The gap in never having attended school is
predicted to close between two and 14 years depending upon which trend is used. In recent years, almost all
Indigenous children attend school at some stage—the main residual concerns are now about retention rates
and the quality of schooling and outcomes for those who are attending.
The predicted convergence in post-school qualification is also quite optimistic for both projected trends—
the gaps may be closed within 25 or 44 years depending on the trend estimates used. One reason for
this relatively positive estimate is that such outcomes are amenable to fast policy action. For example,
the mutual obligation regimes—which have become increasingly popular with government as a means of
providing conditional welfare payments—tend to reward recipients who return to their studies. However,
it may become more difficult to improve outcomes as the quality of the initial educational attainment
becomes more central to performance. That is, it may be possible to improve vocational training through
Technical and Further Education Institutes in the short run, but the ability to enhance the participation in
universities and other tertiary institutes may be limited by the quality of initial schooling.
Even though we only have short run trends for attendance of youth (aged 15–24 years) at educational
institutions, convergence in rates of attendance would not occur for another 63 years. If the calculation were
done to exclude secondary students, thereby focusing on people studying at tertiary educational institutions,
convergence would not take place for over 100 years.21 The difficulty in achieving convergence for the more
demanding tertiary qualifications is confirmed by the fact that the gap in the incidence of degrees among
Indigenous and non-Indigenous people is not predicted to close for at least another century.22
As indicated above, the ABS recently changed the method of predicting life expectancy for Indigenous people
to take into account changing Indigenous identification (see Bhat method in ABS 2004; ABS/Australian
Institute of Health and Welfare 2005: 148). Whatever the merits of the new methodology, the estimates are
not strictly comparable with the previous estimates of life expectancy and hence cannot be used to calculate
long run trends. Hence, we will use the older unadjusted series to estimate trends in male and female life
expectancy. On historical trends, and in the absence of significant and successful policy innovations, it is
hard to see the gap in male life expectancy being removed for at least another 100 years. Current trends
are more optimistic in terms of closing the gaps in female life expectancy, with the estimated convergence
in 47 years. However, recent trends seem to indicate that this is exceptionally optimistic, as the relative gap
increased between 1996 and 2001.
Our earlier analysis used the demographic proxy for health of the proportion of population aged 55 and
over (Altman, Biddle & Hunter 2005). This proxy is easy to calculate, even if it is rather more difficult to

16 altman, Biddle & Hunter
centre for aBoriginal economic policY researcH
interpret.23 Notwithstanding, the recent trend in this proxy seems to indicate that the estimated time to
convergence of female life expectancy is too optimistic and that the resources required to close the gap in
life expectancies within one generation will not be trivial.
conclusion
Policies designed to close the gap between Indigenous and non-Indigenous populations are intrinsically
difficult to operationalise since many of the underlying causes are inter-generational in nature. For example,
Marmot and Wilkinson (1999) and many others have identified that life expectancy depends on what happens
in early childhood when crucial decisions are made by previous generations (by definition). Health outcomes
are also likely to be dependent on social, cultural and community contexts (Bronfenbrenner 1979), and
hence policies that address these gaps must have a long-term focus and tackle problems at several levels. It
would be a mistake for policy makers to ‘pick winners’ by focusing solely on outcomes for children, because
human development is realised within a family and community environment in which individuals are firmly
embedded.
While all governments advocate that their policies are preferable to those of previous governments, it would
be naïve to think that prolonged improvements in Indigenous socioeconomic status can be achieved easily.
Even if new policies represent a structural break with the past, the complexities of delivery mean that it is
difficult to sustain any improvements for prolonged periods. It is in the nature of the political cycle, where
Federal elections are held every three years, that structural breaks in approach may not be sustained past
the election of the next government. This, however, does not appear to be the case in the recent transition
from Howard to Rudd Governments where most of the extant policy framework, including the Northern
Territory National Emergency Response Intervention appear to have been retained. This ‘bipartisanship’, or
rather policy acquiescence, may constitute a multi-election strategy—but the point being made here is that
there is substantial pressure for political parties to differentiate their policy positions from those of their
opponents and hence continuity of the policies that ‘work’ can easily be lost.
Another major limitation of our convergence analysis is that it depends on what is happening in the rest of the
community. In addition to the differential and uneven impact of the macroeconomic growth on Indigenous
and other outcomes, it might be that environmental constraints arising from excessive greenhouse gas
emissions and associated global warming place a constraint on economic growth, hindering distributional
goals such as closing the gaps. In a mechanical sense, low growth economies have less government revenue
to invest in infrastructure shortfalls or for the provision of transfer payments to the worst-off Australians.
Perhaps an even more important dynamic is that any future economy where growth is deliberately curtailed
may have relatively high rates of unemployment and poor job prospects for low-skilled workers, including
many Indigenous Australians. Any recession, whatever the source of the downturn, is likely to curtail a
government’s capacity to ‘close the gaps’ between Indigenous and other Australians.

centre for aBoriginal economic policY researcH
discussion paper n0. 287 17
It could be argued that our estimates of convergence are too optimistic. Accordingly, our analysis must
be supplemented with qualitative and behavioural analyses that illustrate the complex developmental
challenges facing Indigenous Australians. However, if one does include some behavioural assumptions,
forecasts can become redundant very quickly. For example, the short run forecasts of Indigenous labour force
status in earlier studies were generally accurate (Hunter & Taylor 2004), but the medium term projections
(10 years out) failed to anticipate the prolonged economic boom. Even if behaviourally informed analyses
were conducted, they may demonstrate that process/rights-based issues and symbolism can motivate and
de-motivate people and hence lead to relatively better or poorer outcomes than we predict. If that is
the case then we need to expand our conception of disadvantage to include both practical and symbolic
considerations rather than view these two elements as constituting some sort of trade-off. In our opinion,
there is no evidence of direct trade-off between practical and symbolic issues and such distinctions probably
represent a false dichotomy.
Clearly, official statistics based on mainstream social norms do not capture the extent of Indigenous
alienation from mainstream Australia. There are many different and inter-related dimensions of deprivation,
social exclusion and poverty facing Indigenous Australians (Daly & Smith 2003; Hunter 1999, 2000). Policies
designed to redress the gaps between Indigenous and non-Indigenous socioeconomic outcomes need to
take into account the inter-dependence between extant disadvantages and be informed by evidence on how
disadvantage evolves over the ‘life-cycles’ of individuals and communities (Hunter 2007b).
A significant issue emerging in the literature is that it is difficult to establish reliable and robust long run
trends. The caveats listed above illustrate why one has to be cautious about making strong predictions about
when the gap between Indigenous and other Australians might be closed. The evidence presented here
indicates that it is probable that the long run trends in Indigenous socioeconomic status are positive, and
hence the recent dominant discourse of policy failure in Indigenous affairs is wrong or over-stated.
Two areas of particular concern for closing the gaps are labour force status and health. While constructing
reliable forecasts is difficult, predicting labour force status is particularly problematic given the obvious
interactions with the macroeconomic growth. Hunter and Taylor (2004) showed that rudimentary estimates
that attempt to control for demographic factors can be reasonably accurate in the short run (some of the
2001 projections were accurate to one significant digit), but there were considerable differences in the ex
post outcomes for medium term forecasts for 2006 (i.e., the actual employment/population ratios were
43.2% in the 2006 Census compared to the predicted ratio of 38.1% in Hunter and Taylor). The substantial
and prolonged economic growth between 2001 and 2006 appears to have created a substantial number of
jobs many of which have been secured by Indigenous Australians.
Demographic transitions and increased identification is the imponderable factor here. The change in official
methodology of calculating life expectancy is an implicit recognition of the importance of such changes.
Even if one is willing to suspend disbelief in the short run, it is more difficult to do this in the long run. The
increased propensity to identify as Indigenous and the substantial rates of intermarriage will mean that

18 altman, Biddle & Hunter
centre for aBoriginal economic policY researcH
people who would historically be characterised as non-Indigenous will now be classified as Indigenous. If
such people have socioeconomic and demographic characteristics that are closer to the non-Indigenous
profile then there is a built in tendency towards convergence.
Obviously there is likely to be substantial variation in regional outcomes between sub-national populations,
but in broad terms there is less difference in the regional trends than one might expect (Hunter 2007a).
While the magnitude of the original ‘gap’ can be rather different for some outcomes in remote and non-
remote areas, especially for the economic indicators, the overall trends are remarkably similar. However, this
may be because the standard remoteness classification hides more variation than it explains. Recent analysis
at a much smaller level of geography shows variation in trends in Indigenous outcomes over the most recent
inter-censal period (Biddle, Taylor & Yap forthcoming). For example, full-time private sector employment
increased substantially for the Indigenous population relative to the non-Indigenous population in Brisbane
and Perth, but declined in Sydney. For some types of analysis, therefore, it is important to concentrate on
the level of geography that labour markets or geographies are bounded by (Taylor & Biddle 2008). Whatever
the trends, the underlying causes of the gap are likely to be different in remote and non-remote Australia,
and hence a regionally differentiated policy response is likely to be warranted.
As we enter a new political cycle in Indigenous affairs policy making it is important that some of the
historical evidence presented here is not overlooked, especially during a period when the new discourse of
policy making emphasises evidence base over either anecdote or ideology. We concur that the socioeconomic
gaps between Indigenous and other Australians remain unacceptably high. While our analysis suggests that
at the national level there has been improvement in the three and a half decades to 2006, we also accept
that the current rate of improvement is too slow. Nevertheless our predictions indicate that it will take
many years, possibly many generations, before the gaps are closed if we use recent economic history as our
measuring rod.
To conclude, we make two observations. First, the long lead times that we have estimated to close the gaps
suggest that some fundamentally new approach might be needed to ensure structural change of such a
degree as to significantly alter the time frame we are predicting. One possibility is to require a fundamental
reallocation of property rights in resources that fully acknowledge the original ownership of the country.24
Another alternative is that a massive increase in investment in Indigenous infrastructure and Indigenous
people may eventually affect the persistent gaps. Second, we propose that a degree of policy realism and
caution is required in new policy commitments. The only way to measure closing the gaps outcomes will
be with the sorts of statistics that we have accessed here, inadequate as they might be from a public
policy or Indigenous perspective. These statistics will form the basis for assessing any commitments to
closing the gaps—this is the statistical evidence base that will constitute political accountability. Under such
circumstances we would counsel that commitments to ‘reducing disparities’ might be a more realistic policy
goal for the Rudd Government than ‘closing the gaps’.

centre for aBoriginal economic policY researcH
discussion paper n0. 287 19
notes
1. This is a widely cited figure is based on the ABS/Australian Institute of Health and Welfare (2008). Another
alternative method is provided in Vos et al. (2007) who estimate that the difference between Indigenous and
non-Indigenous life expectancy is around 13 years.
2. See Oxfam press release, ‘Oxfam welcomes decision by Prime Minister Rudd to sign nine point plan to end
Aboriginal health crisis’, 20 March 2008, available at <http://www.oxfam.org.au/media/article.php?id=446>.
3. Although the Productivity Commission was commissioned to provide biennial reports on progress in addressing
Indigenous disadvantage (Steering Committee for the Review of Government Service Provision 2003, 2005,
2007).
4. Note that these earlier analysis were not based on forecasts, but were rather argued on a priori grounds.
5. One possible exception is the data on private sector employment, which is provided in a slightly different
format in 2001 compared to either 1996 or 2006. However, that qualification does not affect the validity of
the trend estimated between 1996 and 2006.
6. There are some minor differences between the pre-2006 estimates provided in the Appendix and those
reported in Altman, Biddle & Hunter (2005)—these are mostly rounding errors in the latter, but they are
indicated in the text where appropriate.
7. The CDEP scheme began as an innovative program that converted the notional equivalents of the
unemployment benefit entitlements of Aboriginal people in remote areas into grants to Aboriginal
organisations from the Commonwealth Department of Aboriginal Affairs. These grants were then used
by Indigenous organisations to employ potential unemployment benefit recipients in part-time work. The
CDEP scheme was developed as a response to the perceived social threat of ‘sit-down’ money to Indigenous
communities in the 1970s. Ironically, the scheme is now being criticised as being one of the main factors
driving the social effects of prolonged welfare dependence.
8. The 2006 CDEP participant numbers are estimated from the Department of Employment and Workplace
Relations (DEWR) annual report, while the population estimate is derived from 2006 Census Estimated
Residential Population.
9. It is unclear on what basis one would make such a choice, as most CDEP participants work for funding
provided by the Federal Government. Such a classification would be akin to categorising public sector
employment as a form of welfare.
10. While household sizes are substantially larger in remote areas compared to non-remote areas, recent declines
in the size of Indigenous households is largest in absolute terms in remote areas (Hunter 2007a).
20 altman, Biddle & Hunter
centre for aBoriginal economic policY researcH
11. For example, Hunter, Kennedy & Biddle (2004) estimate ‘equivalised’ income by dividing household income by
household size to control of household size. There are more sophisticated measures of household income that
control for the composition of household, but that is beyond the scope of this paper.
12. Where household welfare is measured by adjusted (equivalised) income.
13. The last 10 years have seen a substantial increase in transfers to families, especially families with children (e.g.
Family Tax Benefits). However, given that the census measures pre-tax income, this explanation is only valid if
the transfers occur outside the tax system (not as tax rebates) and hence could be construed by respondents to
the respective censuses as being part of their gross income.
14. Note that most of the life expectancy estimates in Appendix A were rounded in Altman, Biddle & Hunter
(2005). However, the Indigenous estimates for 1971 were taken directly from Smith (1980: 279) and
are reported to one significant digit to illustrate that there was some difference in male and female life
expectancy. This relatively small difference in life expectancy is probably due to the high rates of Indigenous
deaths in child birth at the time.
15. Although we note that there was a substantial divergence in 2006 between the national Census count (around
450,000) and the comparable Estimated Resident Population for Indigenous Australians (around 512,000),
there is an even larger divergence evident when measured at a sub-national level. For example, the ABS Post
Enumeration Survey identified an estimated undercount of 24% in the Kimberley region of Western Australia
and 19% in the Northern Territory.
16. Two possible exceptions to this observation are in the area of labour force status and health. As indicated
above, the estimated trends are complicated by the interactions of labour force indicators with the macro-
economy and measurement error for health proxies.
17. Altman and Hunter (2003) utilised the unprecedented alignment of the electoral and statistical cycles between
1991 and 2001 to explore the statistical success of the practical reconciliation espoused by Prime Minister
John Howard. This exercise could be undertaken because during the inter-censal period 1991–1996 the Hawke
and Keating Governments were in power, while during the period 1996–2001, the first and second Howard
Governments were in control. The outcomes from this research were initially very politically contentious
because they indicated that the earlier Labor Government outperformed the later Coalition Government
in ‘closing the gaps’. This in turn had implications for a broader debate at that time as to whether practical
reconciliation yielded superior outcomes to symbolic reconciliation. A series of subsequent analyses from the
Human Rights and Equal Opportunity Commission, the ABS and the Productivity Commission (summarised in
Altman 2004) confirmed this finding and took some of the political heat out of the issue. While the unusual
alignment between electoral and statistical cycles is now less apparent (i.e. the last Federal election was in
2007 and not 2006), we will briefly reflect on such issues in this endnote.
centre for aBoriginal economic policY researcH
discussion paper n0. 287 21
The period 1991–96 saw some relative and absolute improvements in Indigenous socioeconomic status
as described in Appendix A. The first five years of Howard Governments (1996–2001) saw some absolute
improvements but fewer relative improvements, as described in Altman and Hunter (2003: 13). This was due
primarily to rapid improvement for non-Indigenous Australians—indeed our main concern at the time was that
during such a period of macroeconomic growth, the gaps in relative well-being seemed relatively intractable.
Interestingly, during the second five years of Howard governments from 2001–06, there were more relative and
absolute improvements than in the period 1991–96 or in the period 1996–2001. It is particularly noteworthy
that in the most recent inter-censal period 2001–06, there was absolute improvement in almost all variables.
This suggests that the Indigenous population benefited from the overall expansion of the national economy. In
relative terms, however, there was improvement in seven of 12 comparable variables, suggesting that closing
the gaps was made difficult by the higher relative prosperity of the non-Indigenous population.
What might explain this pattern of inter-censal change in major socioeconomic indicators? It might, on the
one hand, suggest that the ‘new mainstreaming’ in Indigenous policy, introduced by the Howard Government
in 2004 and described fully in Altman (2004), was having positive impacts by the time of the 2006 Census.
This is unlikely because of the short the lead time of only two years, but it is at least a possibility. On the
other hand, there is the possibility that as economic growth has continued during the last term of the Howard
Government, some benefits were eventually trickling through to Indigenous Australians. In any case, in early
November 2007, neither the Howard Government nor the media seemed willing to pick up this finding and
attribute it to a particular approach in Indigenous affairs.
18. The choice of base year obviously impacts on the prospects for and rate of convergence. For example, while
the broad conclusions remain the same if 1981 is used as the base year rather than 1971, doing so results in
convergence rather than divergence in employment, full-time employment and private sector employment.
However, this convergence only occurred after a relatively long time period (71 years, 50 years and 44 years
respectively).
19. A generation has traditionally been defined as ‘the average interval of time between the birth of parents and
the birth of their offspring’. Before the baby boomer ‘generation’, the length of a generation was generally
estimated to be approximately 20 years, but this figure has crept up over time (even in the Indigenous
population) and it is now closer to 30 years.
20. If one focuses on the indicator—the proportion of Indigenous households who own their own home—then the
rate of convergence in home ownership is slightly more optimistic, and Indigenous outcomes will be the same
as non-Indigenous outcomes in a little over 80 years time. This estimate is closer to the short run estimate in
Table 2 because that indicator is only available consistently since 1991.
21. It was only possible to calculate the long run trends for this outcome between 1981 and 2001 because of data
comparability issues.
22 altman, Biddle & Hunter
centre for aBoriginal economic policY researcH
22. This is also confirmed by the fact that, based on post-1996 trends, there will not be a convergence in Year 10
completion for another 17 years—in contrast, the convergence in Year 12 completion will take much longer
and will not occur for another 96 years.
23. Unfortunately, the proportion of elderly (aged 55 and over) is an imperfect measure of health because it is also
affected by the fertility rate, which determines the total population numbers in the denominator. However,
an increase in the proportion of the population who are elderly is positive if it represents either a decline
in fertility or a reduction in adult mortality. If fertility is the driving factor, then Indigenous households will
benefit from a long-term reduction in age-related dependency rates, which ultimately reduce the demands on
household financial and infrastructural resources.
24. A philosophical justification for this proposition can be based on Nozick (1974) who mounts a case against
addressing equity through redistribution—instead he argues that policy makers should establish a clear set of
property rights based on original possession.

centre for aBoriginal economic policY researcH
discussion paper n0. 287 23
appendix a: socioeconomic outcomes taBles
Table A1. Socioeconomic outcomes for Indigenous Australians, 1971–2006
variable 1971 1981 1991 1996 2001 2006
Unemployment rate (% labour force) 9.0 24.6 30.8 22.7 20.0 15.6
Employment to population ratio (% adults) 42.0 35.7 37.1 40.7 41.7 43.2
Private-sector employment (% adults) 29.7 17.2 20.5 21.6 n.a. 32.8
Labour force participation rate (% adults) 46.1 47.3 53.5 52.7 52.1 51.2
Median weekly personal income ($A 2006) n.a. 217.5 244.8 245.6 246.7 267.4
Household size 4.6 4.1 4.0 3.6 3.4 3.4
Median weekly household income ($A 2006) n.a. 784.9 757.7 n.a. 913.2 1,072.7
Home owner or purchasing (% population) 26.1 19.7 19.1 26.1 26.8 30.0
Never attended school (% adults) 22.7 10.7 5.1 3.1 3.2 2.7
Post-school qualification (% adults) 3.2 5.0 9.5 12.8 18.2 23.8
Degree or higher (% adults) n.a. n.a. n.a. 2.2 3.3 4.4
Attending educational institution (% 15-24 year olds) n.a. n.a. n.a. 27.7 33.4 34.4
Male life expectancy at birth (years) 49.6 56.0 57.0 57.0 56.0 n.a.
Female life expectancy at birth (years) 50.0 64.0 64.0 64.0 63.0 n.a.
Population aged over 55 years (%) 7.3 6.4 6.2 6.3 6.7 8.2
note: ‘n.a.’ means that the data was not available in that year.
source: ABS Census of Population and Housing 1971, 1981, 1991, 1996, 2001 and 2006.
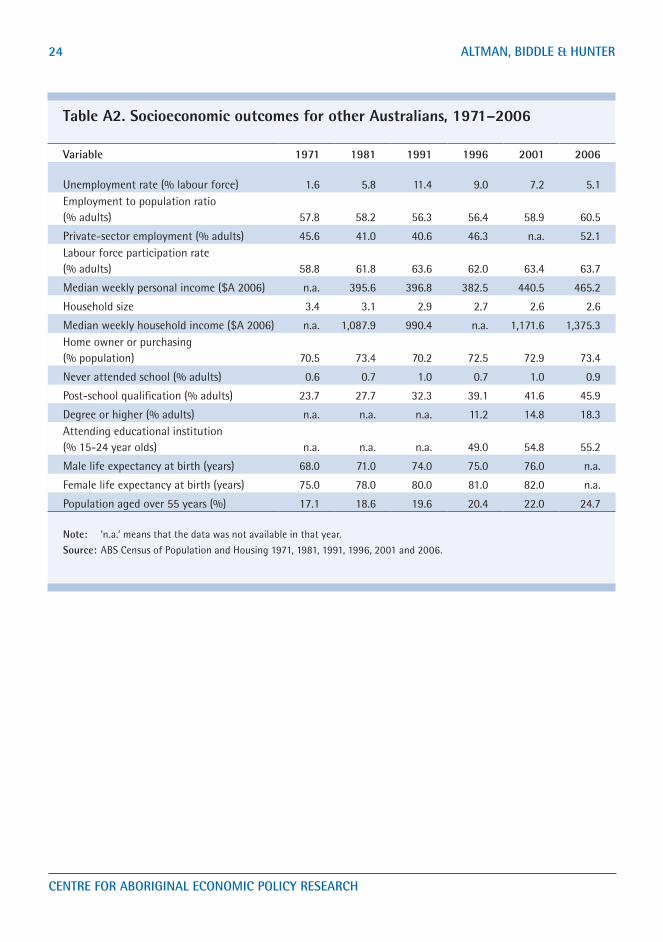
24 altman, Biddle & Hunter
centre for aBoriginal economic policY researcH
Table A2. Socioeconomic outcomes for other Australians, 1971–2006
variable 1971 1981 1991 1996 2001 2006
Unemployment rate (% labour force) 1.6 5.8 11.4 9.0 7.2 5.1Employment to population ratio (% adults) 57.8 58.2 56.3 56.4 58.9 60.5
Private-sector employment (% adults) 45.6 41.0 40.6 46.3 n.a. 52.1Labour force participation rate (% adults) 58.8 61.8 63.6 62.0 63.4 63.7
Median weekly personal income ($A 2006) n.a. 395.6 396.8 382.5 440.5 465.2
Household size 3.4 3.1 2.9 2.7 2.6 2.6
Median weekly household income ($A 2006) n.a. 1,087.9 990.4 n.a. 1,171.6 1,375.3Home owner or purchasing (% population) 70.5 73.4 70.2 72.5 72.9 73.4
Never attended school (% adults) 0.6 0.7 1.0 0.7 1.0 0.9
Post-school qualification (% adults) 23.7 27.7 32.3 39.1 41.6 45.9
Degree or higher (% adults) n.a. n.a. n.a. 11.2 14.8 18.3Attending educational institution (% 15-24 year olds) n.a. n.a. n.a. 49.0 54.8 55.2
Male life expectancy at birth (years) 68.0 71.0 74.0 75.0 76.0 n.a.
Female life expectancy at birth (years) 75.0 78.0 80.0 81.0 82.0 n.a.
Population aged over 55 years (%) 17.1 18.6 19.6 20.4 22.0 24.7
note: ‘n.a.’ means that the data was not available in that year.
source: ABS Census of Population and Housing 1971, 1981, 1991, 1996, 2001 and 2006.

centre for aBoriginal economic policY researcH
discussion paper n0. 287 25
Table A3. Ratio of Indigenous to non-Indigenous socioeconomic outcomes, 1971–2006
variable 1971 1981 1991 1996 2001 2006
Unemployment rate (% labour force) 5.63 4.24 2.70 2.52 2.78 3.06Employment to population ratio (% adults) 0.73 0.61 0.66 0.72 0.71 0.71
Private-sector employment (% adults) 0.65 0.42 0.51 0.47 n.a. 0.63Labour force participation rate (% adults) 0.78 0.77 0.84 0.85 0.82 0.80Median weekly personal income ($A 2006) n.a. 0.55 0.62 0.64 0.56 0.58
Household size 1.35 1.32 1.38 1.33 1.31 1.31Median weekly household income ($A 2006) n.a. 0.72 0.77 n.a. 0.78 0.78Home owner or purchasing (% population) 0.37 0.27 0.27 0.36 0.37 0.41
Never attended school (% adults) 37.83 15.29 5.10 4.43 3.20 3.00
Post-school qualification (% adults) 0.14 0.18 0.29 0.33 0.44 0.52
Degree or higher (% adults) n.a. n.a. n.a. 0.20 0.23 0.24Attending educational institution (% 15-24 year olds) n.a. n.a. n.a. 0.56 0.61 0.62
Male life expectancy at birth (years) 0.73 0.79 0.77 0.76 0.74 n.a.
Female life expectancy at birth (years) 0.67 0.82 0.80 0.79 0.77 n.a.
Population aged over 55 years (%) 0.43 0.34 0.32 0.31 0.31 0.33
note: ‘n.a.’ means that the data was not available in that year. Results have been rounded to two decimal places.
source: ABS Census of Population and Housing 1971, 1981, 1991, 1996, 2001 and 2006.
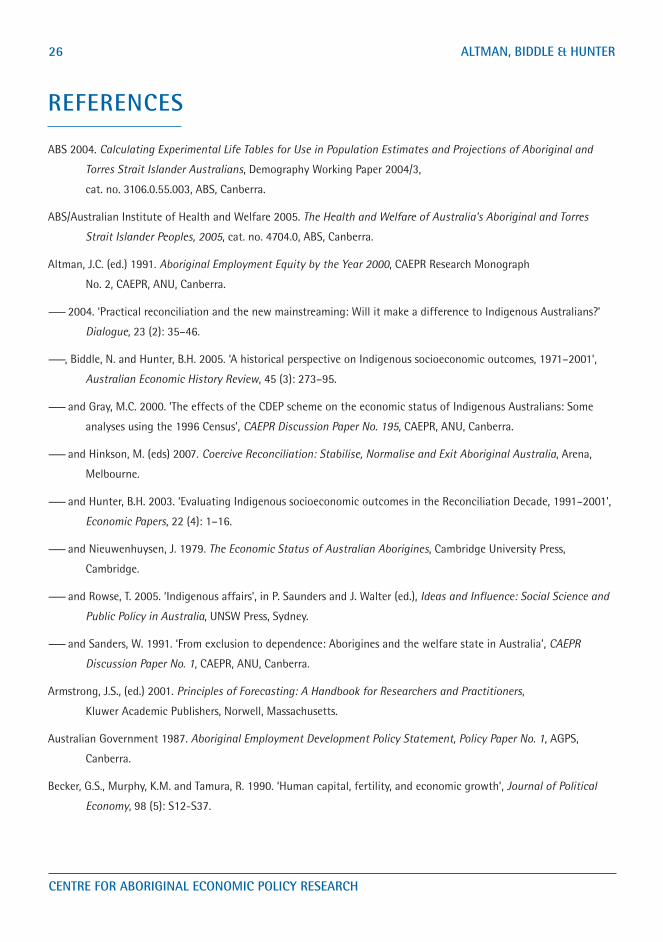
26 altman, Biddle & Hunter
centre for aBoriginal economic policY researcH
references
ABS 2004. Calculating Experimental Life Tables for Use in Population Estimates and Projections of Aboriginal and
Torres Strait Islander Australians, Demography Working Paper 2004/3,
cat. no. 3106.0.55.003, ABS, Canberra.
ABS/Australian Institute of Health and Welfare 2005. The Health and Welfare of Australia’s Aboriginal and Torres
Strait Islander Peoples, 2005, cat. no. 4704.0, ABS, Canberra.
Altman, J.C. (ed.) 1991. Aboriginal Employment Equity by the Year 2000, CAEPR Research Monograph
No. 2, CAEPR, ANU, Canberra.
—— 2004. ‘Practical reconciliation and the new mainstreaming: Will it make a difference to Indigenous Australians?’
Dialogue, 23 (2): 35–46.
——, Biddle, N. and Hunter, B.H. 2005. ‘A historical perspective on Indigenous socioeconomic outcomes, 1971–2001’,
Australian Economic History Review, 45 (3): 273–95.
—— and Gray, M.C. 2000. ‘The effects of the CDEP scheme on the economic status of Indigenous Australians: Some
analyses using the 1996 Census’, CAEPR Discussion Paper No. 195, CAEPR, ANU, Canberra.
—— and Hinkson, M. (eds) 2007. Coercive Reconciliation: Stabilise, Normalise and Exit Aboriginal Australia, Arena,
Melbourne.
—— and Hunter, B.H. 2003. ‘Evaluating Indigenous socioeconomic outcomes in the Reconciliation Decade, 1991–2001’,
Economic Papers, 22 (4): 1–16.
—— and Nieuwenhuysen, J. 1979. The Economic Status of Australian Aborigines, Cambridge University Press,
Cambridge.
—— and Rowse, T. 2005. ‘Indigenous affairs’, in P. Saunders and J. Walter (ed.), Ideas and Influence: Social Science and
Public Policy in Australia, UNSW Press, Sydney.
—— and Sanders, W. 1991. ‘From exclusion to dependence: Aborigines and the welfare state in Australia’, CAEPR
Discussion Paper No. 1, CAEPR, ANU, Canberra.
Armstrong, J.S., (ed.) 2001. Principles of Forecasting: A Handbook for Researchers and Practitioners,
Kluwer Academic Publishers, Norwell, Massachusetts.
Australian Government 1987. Aboriginal Employment Development Policy Statement, Policy Paper No. 1, AGPS,
Canberra.
Becker, G.S., Murphy, K.M. and Tamura, R. 1990. ‘Human capital, fertility, and economic growth’, Journal of Political
Economy, 98 (5): S12-S37.

centre for aBoriginal economic policY researcH
discussion paper n0. 287 27
Biddle, N., 2007. Does It Pay To Go To School? The Benefits of and Participation in Education of Indigenous Australians,
Phd thesis, ANU, Canberra, available online at
<http://thesis.anu.edu.au/public/adt-anu20071008.152249/index.html>.
——, Taylor, J. and Yap, M. 2008 forthcoming. ‘Indigenous participation in regional labour markets, 2001-2006’,
CAEPR, CASS, ANU, Canberra.
Bronfenbrenner, U. 1979. The Ecology of Human Development, Harvard University Press, Cambridge, Massachusetts..
Commonwealth of Australia 2007. National Report to Parliament on Indigenous Education and Training, Department
of Education, Employment and Workplace Relations, Canberra.
Daly, A. and Smith, D. 2003. ‘Reproducing exclusion or inclusion? Implications for the wellbeing of Indigenous
Australian children’, CAEPR Discussion Paper No. 253, CAEPR, ANU, Canberra, available at
<http://www.anu.edu.au/caepr/discussion.php>.
Fisk, E.K. 1985. The Aboriginal Economy in Town and Country, George Allen and Unwin, Sydney.
Gray, A. and Tesfaghiorghis, H. 1991. ‘Social indicators of the Aboriginal population of Australia’,
CAEPR Discussion Paper No. 18, CAEPR, ANU, Canberra.
Gray, M.C. and Hunter, B.H. 2002. ‘A synthetic cohort analysis of labour market outcomes of Indigenous and
non-Indigenous Australians, 1986-96’, Australian Economic Review, 35 (4): 391–404.
Harding, A., Yap, M. and Lloyd, R. 2004. ‘Trends in spatial inequality, 1996 to 2001’, AMP.NATSEM Income and Wealth
Report, Issue 8, September, AMP Financial Services and the National Centre for Social and Economic Modelling
Pty Limited, Sydney, available at <http://www.amp.com.au/ampnatsemreports>.
Hunter, B.H. 1998. ‘Assessing the validity of intercensal comparisons of Indigenous Australians, 1986-96’, Journal of
the Australian Population Association, 15 (1): 51–67.
—— 1999. ‘Three nations, not one: Indigenous and other Australian poverty’, CAEPR Working Paper No. 1, CAEPR, ANU,
Canberra, available at <http://www.anu.edu.au/caepr/working.php>
—— 2000. ‘Social exclusion, social capital and Indigenous Australians: Measuring the social costs of unemployment’,
CAEPR Discussion Paper No. 204, CAEPR, ANU, Canberra, available at
<http://www.anu.edu.au/caepr/discussion.php>.
—— 2003. ‘Trends in neighbourhood inequality of Australian, Canadian and US cities since the 1970s’,
The Australian Economic History Review, 43(1): 22–44.
—— 2004. Indigenous Australians in the Contemporary Labour Market, ABS cat. No. 2052.0, ABS, Canberra.
—— 2007a. ‘Arguing over [the] remote control: Why Indigenous policy needs to be based on evidence and not
hyperbole’, Economic Papers, 26 (1): 44–63.
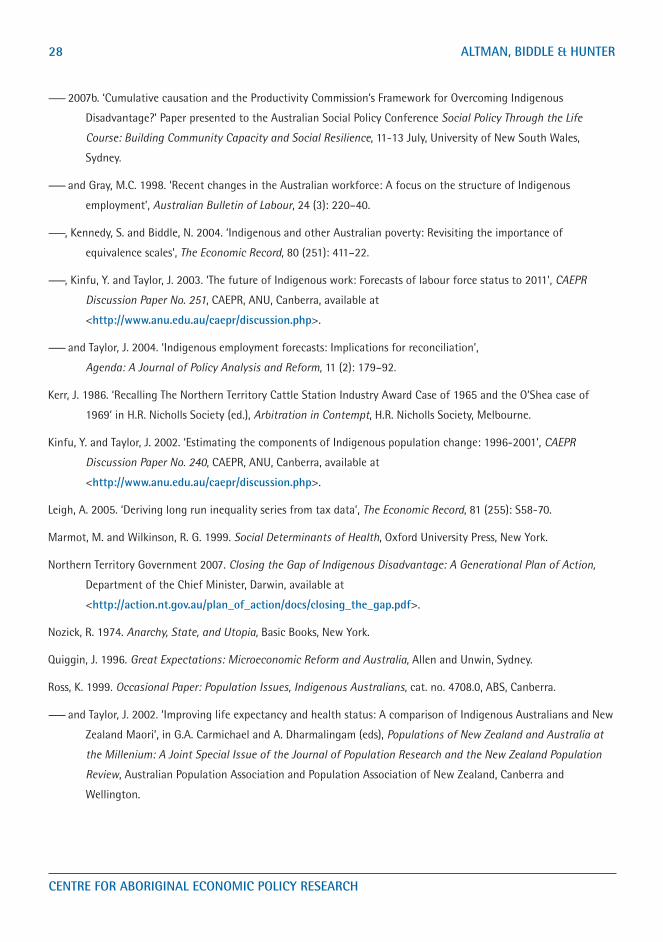
28 altman, Biddle & Hunter
centre for aBoriginal economic policY researcH
—— 2007b. ‘Cumulative causation and the Productivity Commission’s Framework for Overcoming Indigenous
Disadvantage?’ Paper presented to the Australian Social Policy Conference Social Policy Through the Life
Course: Building Community Capacity and Social Resilience, 11-13 July, University of New South Wales,
Sydney.
—— and Gray, M.C. 1998. ‘Recent changes in the Australian workforce: A focus on the structure of Indigenous
employment’, Australian Bulletin of Labour, 24 (3): 220–40.
——, Kennedy, S. and Biddle, N. 2004. ‘Indigenous and other Australian poverty: Revisiting the importance of
equivalence scales’, The Economic Record, 80 (251): 411–22.
——, Kinfu, Y. and Taylor, J. 2003. ‘The future of Indigenous work: Forecasts of labour force status to 2011’, CAEPR
Discussion Paper No. 251, CAEPR, ANU, Canberra, available at
<http://www.anu.edu.au/caepr/discussion.php>.
—— and Taylor, J. 2004. ‘Indigenous employment forecasts: Implications for reconciliation’,
Agenda: A Journal of Policy Analysis and Reform, 11 (2): 179–92.
Kerr, J. 1986. ‘Recalling The Northern Territory Cattle Station Industry Award Case of 1965 and the O’Shea case of
1969’ in H.R. Nicholls Society (ed.), Arbitration in Contempt, H.R. Nicholls Society, Melbourne.
Kinfu, Y. and Taylor, J. 2002. ‘Estimating the components of Indigenous population change: 1996-2001’, CAEPR
Discussion Paper No. 240, CAEPR, ANU, Canberra, available at
<http://www.anu.edu.au/caepr/discussion.php>.
Leigh, A. 2005. ‘Deriving long run inequality series from tax data’, The Economic Record, 81 (255): S58-70.
Marmot, M. and Wilkinson, R. G. 1999. Social Determinants of Health, Oxford University Press, New York.
Northern Territory Government 2007. Closing the Gap of Indigenous Disadvantage: A Generational Plan of Action,
Department of the Chief Minister, Darwin, available at
<http://action.nt.gov.au/plan_of_action/docs/closing_the_gap.pdf>.
Nozick, R. 1974. Anarchy, State, and Utopia, Basic Books, New York.
Quiggin, J. 1996. Great Expectations: Microeconomic Reform and Australia, Allen and Unwin, Sydney.
Ross, K. 1999. Occasional Paper: Population Issues, Indigenous Australians, cat. no. 4708.0, ABS, Canberra.
—— and Taylor, J. 2002. ‘Improving life expectancy and health status: A comparison of Indigenous Australians and New
Zealand Maori’, in G.A. Carmichael and A. Dharmalingam (eds), Populations of New Zealand and Australia at
the Millenium: A Joint Special Issue of the Journal of Population Research and the New Zealand Population
Review, Australian Population Association and Population Association of New Zealand, Canberra and
Wellington.

centre for aBoriginal economic policY researcH
discussion paper n0. 287 29
Rowse, T. 1998. White Flour, White Power: From Rations to Citizenship in Central Australia, Cambridge University
Press, Cambridge.
—— 2002. Indigenous Futures: Choice and Development for Aboriginal and Islander Australia, UNSW Press, Sydney.
Sanders, W. 1991. ‘Destined to fail: The Hawke government’s pursuit of statistical equality in employment and income
status between Aborigines and other Australians by the year 2000 (or a cautionary tale involving the new
managerialism and social justice strategies)’, Australian Aboriginal Studies, 1991 (2): 13–8.
—— 1997. ‘Opportunities and problems astride the welfare/work divide: The CDEP scheme in Australian social policy’,
CAEPR Discussion Paper No. 141, CAEPR, ANU, Canberra, available at
<http://www.anu.edu.au/caepr/discussion.php>.
Smith, L.R. 1980. The Aboriginal Population of Australia, Aborigines in Australian Society 14, ANU Press, Canberra.
Steering Committee for the Review of Government Service Provision 2003. Overcoming Indigenous Disadvantage: Key
Indicators 2003 Report, Productivity Commission, Melbourne.
—— 2005. Overcoming Indigenous Disadvantage: Key Indicators 2005 Report, Productivity Commission, Melbourne.
—— 2007. Overcoming Indigenous Disadvantage: Key Indicators 2007 Report, Productivity Commission, Melbourne.
Taylor, J. and Altman, J.C. 1997. The Job Ahead: Escalating Economic Costs of Indigenous Employment Disparity, Office
of Public Affairs, ATSIC, Canberra.
—— and Biddle, N. 2008. ‘Locations of Indigenous population change: What can we say?’, CAEPR Working Paper No. 43,
CAEPR, CASS, ANU, Canberra, available at <http://www.anu.edu.au/caepr/working.php>.
—— and Hunter, B.H. 1998. The Job Still Ahead: Economic Costs of Continuing Indigenous Employment Disparity, Office
of Public Affairs, ATSIC, Canberra.
Te Puni Kòkiri 2000. Progress Towards Closing Social And Economic Gaps Between Màori And Non-Màori: A Report To
The Minister Of Màori Affairs, Te Puni Kòkiri, Wellington.
Vos, T., Barker, B., Stanley, L., et al. 2007. The Burden of Disease and Injury in Aboriginal and Torres Strait Islander
Peoples 2003, Centre for Burden of Disease and Cost-Effectiveness, School of Population Health The University
of Queensland, Brisbane.