how much does the european union cost...
TRANSCRIPT
How much does the European Union cost Britain?
Tim Congdon
With a foreword by Gerard Batten MEP2013 Edition £6 to non-members

The 2013 edition of How much does the European Union cost Britain?, is the sixth of the UK Independence Party research series
started by Gerard Batten in 2006.

How much does the European Union cost Britain?
Tim Congdon
With a foreword by Gerard Batten MEP
2013 Edition

First Published in Great Britain by Tim Congdon September 2013.Copyright © Tim Congdon 2013. All rights reserved.
Printed and bound by Caxton Press Ltd.
Unit 16, Midas Business Centre, Wantz Road, Dagenham, Essex RM10 8PS.
First edition August 2006, second edition August 2007, third edition November 2008, fourth edition March 2011,
fifth edition September 2012. Sixth edition September 2013.

Key points of the UK Independence Party’s research paper on
How much does the European Union cost Britain?
The UK is roughly 11% of GDP – about £165 billion to £170 billion – worse-off every year because it is a member of the EU. It should instead be an independent sovereign nation, like Norway and Switzerland on our own continent, or Canada and Australia in the wider English-speaking world.
The main reason for the heavy cost of the EU is the damage that misguided EU ‘legislation’ (in the form of the directives and regulations that constitute the acquis communautaire) is doing to British business. Small-and medium-sized businesses have been particularly disadvantaged, as they cannot cope with the paperwork, bureaucracy and restrictions.
Other costs include the direct fiscal cost, the costs of resource misallocation, the cost in lost jobs, the costs of waste, fraud and corruption, and the potential costs from the possible failure of EU institutions and ‘benefits tourism’. Each of these is covered in a chapter in the following publication. The breakdown of the 11% of GDP is shown in the box below.
Nature of cost % of Rationale GDP (In all cases, see relevant chapter for detailed argument). Direct fiscal cost 1¼ Relatively easy to quantify from official publications and balance-of-payments data; concept is of gross payments to EU institutions over which UK government has no further control. Costs of regulation 5½ Reduced employment due to ‘Social Chapter’-type legislation, cost of renewables agenda and financial regulation, businesses closed because of substance and procedure regulations. Costs of resource 3¼ CAP long recognised to cause large resource misallocation. misallocation This may now be only ½% of GDP, but other EU protectionism estimated by Minford et al 2005 to cost further 3% of GDP. Cost of lost jobs Open UK labour market from 2004 allowed in 700,000 Eastern Europeans, taking away jobs of over 100,000 UK-born people; labour market soon to open to Bulgaria and Romania. Costs of waste, CFP involves fish discard and effective ‘gift’ to other nations of fraud and corruption fishing rights in UK territorial waters, but cost under 0.1% of GDP; waste under pillar 2 of CAP; waste of over-prescriptive water standards; abuse of UK student loan system
Unforeseen ¼ Costs of ‘health tourism’ and ‘benefits tourism’, plus some Commitments allowance for possible recapitalization of EU institutions Total 11 Conclusion: the UK is about 11% of GDP worse-off because of its membership of the EU.
The EU has free trade agreements with Mexico and Israel, and is seeking one with Japan. Norway, Switzerland and Turkey are ‘in the European orbit’ and have access to the EU’s single market, but are not members of the EU. The UK can leave the EU, and retain strong and vibrant trade links with the EU. Outside the EU, we can put in place the free trade agreement with our European partners, which is all that most people in Britain wanted when we joined the then ‘Common Market’ in 1973.
3 8
3 8


5How much does the European Union cost Britain?
Contents
Foreword by Gerard Batten MEP 7
Author’s introduction 9
1. The direct fiscal cost 11
2. The costs of regulation 17
3. The costs of resource misallocation 29
4. The cost of lost jobs 35
5. The costs of waste, fraud and corruption 42
6. The costs of unforeseen commitments 52
7. The total cost: roughly 11% of national output 56

Some basic arithmetic
In this study frequent reference is made to the costs of EU membership ‘as a % of the UK’s gross domestic product (or GDP)’.
For non-economists, GDP means the same thing as ‘the UK’s national output’ or ‘what we produce as a nation’. This is also the sum of all our incomes our ‘the UK’s national income’. (This is not the same concept as ‘how much we consume as a nation’, because part of our incomes is saved and part of our output is invested.)
In 2012 the UK’s GDP is estimated by the Office for National Statistics to have been £1,562,263 million. (Strictly, this figure refers to ‘GDP at market prices in current price terms’. The full explanation of the meaning of this phrase is technical.)
A ‘billion pounds’ is ‘a thousand million pounds’.
So in 2012
- the UK’s GDP was £1,560 billion, roughly, and - 1% of GDP was almost £16 billion, and - a figure somewhat more than £1.5 billion was 0.1% of GDP.
The numbers for 2013 will differ a bit, but – if we think of ‘1% of GDP’ as ‘a bit more than £15 billion’, we are close enough for the purposes of public debate.
The total cost of the UK’s EU membership is estimated in this publication as ‘about 11% of GDP’, which is roughly £165 billion - £170 billion. (The figures change as the years go by, which explains why this publication needs to appear on an annual basis.)

7How much does the European Union cost Britain?
Foreword by Gerard Batten MEP
Imagine this if you will: Professor Tim Congdon buries a copy of this booklet in a time-capsule at the bottom of his garden. In one or two millennia, when the EU is a long forgotten and failed experiment, some archaeologists dig it up. After they have deciphered the archaic English they find the contents strange reading. It seems that the people of Britain in the second half of the 20th century, despite their historic love of freedom and independence, had voluntarily submitted themselves to the authority of a foreign state? Surely not, the document must be a hoax! However forensic and scholarly tests pronounce it to be genuine.
The scholars read in disbelief. Surely the people must have been bribed with untold riches to allow such a thing? But no, close examination of the text shows they paid dearly for the privilege of being a member of the European Union. The Union itself was purportedly governed by a wise, all-knowing, bureaucratic Elite. The Elite had decided that ordinary people were not capable of governing themselves through their own elected representatives and it was in their best interests to be governed by them, the Elite.
An annul tribute was levied on each member state, with Britain being one of the highest contributors; and with the sum increasing each year. This was the direct monetary cost of membership, but there were also other indirect economic costs to be borne. The Union dictated agricultural and fishing policy – and not in order to maximise yield and decrease prices, but rather to favour some farmers and fisherman over others for political reasons, and thereby greatly increasing the costs of food to the ordinary citizen. But this was a price worth paying to keep the Union together.
The Union made many thousands of new laws in a continual process to instruct businesses from the smallest to the greatest on how to go about their business. No occupation or profession was too small to escape their attention. A vast body of bureaucrats occupied their time studying every possible human activity in order to better instruct the practitioners on how to go about it. These new laws inevitably incurred a vast cost which resulted in many businesses going out of business, and with less choice and increased prices to the customer. But the ‘perfection’ of a Utopia always comes at a cost, the ends always justify the means.
On top of this, Professor Congdon also calculated the many and varied costs understood by the ancient practitioners of the mysterious art of economics: opportunity costs, resource misallocation; and sadly, the cost of the ever present human failings of fraud,
corruption and waste. Not forgetting of course the enormous and misguided costs of human climate change legislation so in vogue at that time.
The future scholars read that up to the time of the publication of this historic document the total cost of being a member of the Union to the ancient British people had risen to around 11% of all the wealth they produced in a year. Just like ancient peoples long before them who had sacrificed their precious objects and treasures to appease the gods, the British people of the 21st century sacrificed their wealth to the EU for the promise of ‘peace, stability and prosperity’.
Now let us come back to the present time with a bump. Professor Congdon shows in his masterly dissection of the cost of EU membership that it now amounts to a scandalous 11% of GDP or around £165/£170 billion per annum – with the cost rising every year. And what do we receive for this sacrifice? We were told that the EU would deliver greater prosperity, but Professor Congdon shows that the burden of EU membership has significantly slowed the growth rate of high-income EU economies in comparison with the growth rate of non-EU advanced economies. Further, unemployment rates are higher in the EU than in non-EU countries with similar economies.
The EU has not produced more jobs or more prosperity. It is actually restricting all of those things while costing more every year as it expands its political ambitions. As Professor Congdon clearly states, the whole EU project is not, and never was, about the development of trade and prosperity for its member states. It is about the creation of a United States of Europe. It is an undemocratic, utopian, political project advanced by lies and deceit; unwanted and unloved by the British, and increasingly by most ordinary Europeans.
Tim Congdon’s latest masterly update is valuable ammunition for all of us troops in the field fighting the good fight to take our country out of the EU.
Gerard Batten MEP3th September 2013

Some basic arithmetic…continued
So in 2012
- the UK’s GDP was £1,560 billion, roughly, and - 1% of GDP was almost £16 billion, and - a figure somewhat more than £1.5 billion was 0.1% of GDP.
The numbers for 2013 will differ a bit, but – if we think of ‘1% of GDP’ as ‘a bit more than £15 billion’, we are close enough for the purposes of public debate.
The total cost of the UK’s EU membership is estimated in this publication as ‘about 11% of GDP’, which is roughly £165 billion - £170 billion. (The figures change as the years go by, which explains why this publication needs to appear on an annual basis.)
In 2012 the UK had 26.8 million households. So the total cost of EU membership to the average household was over £6,000 a year. (Yes, seriously.)
Notice that this is much higher than the estimate of £750 a year per household for the direct fiscal cost, which is on page 16 and is explained in chapter 1.
The £6,000-a-year per household number reflects all the additional costs of EU membership, reviewed in chapters 2 to 6, meaning the costs of regulation, the costs of resource misallocation, the costs of waste, fraud and corruption, the cost of lost jobs, and the cost of the contingent liabilities for which provision should be made. The average British household pays higher taxes because of EU membership, but it also has higher food bills, and it has to pay more for electricity, water and a range of items, as a result of that membership.
British workers are also less likely to find employment in their own country, because the UK labour market is open to immigration from the rest of the EU, and because employment prospects are reduced by unnecessary restrictions and regulations.
Moreover, in the last 15 to 20 years the growth of household incomes has been held back by the directives and regulations in the so-called acquis communautaire. Thousands of small businesses no longer exist, as they cannot meet the costs of complying with the acquis. The EU’s directives and regulations have in fact reduced growth all over Europe and the economies of Western Europe have stagnated in the last few years, with virtually no economic growth whatsoever. (See p. 61.)

9How much does the European Union cost Britain?
Author’s introduction
In the 2012 edition of How Much Does the European Union Cost Britain? I set out the analysis behind the conclusion that our EU membership cost Britain a tenth of its national output. I tried to be detailed, specific and rigorous, and welcomed comment and indeed criticism. I wanted a heavyweight and serious debate; I hoped that ‘the other side’ would respond in a similar spirit, with an appeal to facts and figures, to logic and statistics, and to the recognised princi-ples of cost-benefit appraisal. I am afraid this has not happened. No, ‘the other side’ – despite having the immense resources of the European Commission in the background – has been pathetic. (See pp. 13 – 14 below.) The legacy of the Blair-Brown-Mandelson ‘New Labour’ phase of British politics is that it reduced political debate to spin and sound-bite. With a handful of exceptions, politicians in the so-called ‘three main political parties’ are unable to articulate an organized argument on the key issue (‘should we belong to the EU or not?’) determining our nation’s destiny in the early 21st century. (Well, they are unable to do so, unless they have Civil Service assistance.) I wish I could speak better of them, but for the most part they are a wretched lot. None of the ‘three main political parties’ is able to prepare a meaningful study of the costs and benefits of EU membership. Since opinion polls show that a majority of the British people want to leave the EU, this inability speaks volumes about the inadequacies of the left-liberal pro-EU ‘establishment consensus’. That consensus is shared by the top ranks of the Conservative Party, the Labour Party and the Liberal Democrats.
Let me emphasize that I was not claiming that, once we had left the EU, we would be ‘better off out’ – immediately, automatically and painlessly – by 10% of national output. Our EU membership has harmed our economy for over 40 years. The damage has been particularly serious since the expansion of the EU’s ‘competences’ that began in the early 1990s, following the passage of the Single European Act in 1986. As and when we leave the EU, it will take at least a decade for that damage to be repaired. Small businesses destroyed by the acquis communautaire cannot be re-established overnight, factories closed and demolished because of the EU’s renewables agenda and excessive energy bills cannot be rebuilt in a few weeks, employment discouraged by silly EU regulations can resume only after a period of job search and recruitment, and so on. Nevertheless, by leaving the EU, we would quickly save the direct fiscal contribution we make to the EU budget and avoid such nonsenses as fines from the European Court of Justice, and over time the small businesses, factories and employment would return. After a decade outside
the EU, Britain would be a much more prosperous nation, as well as having the opportunity to restore its traditional constitutional and legal arrangements.
In this year’s edition of How Much Does the European Union Cost Britain? I have raised the estimate of the cost from 10% to 11% of national output. Evidence? That is easy. If EU membership were holding back output, if it were preventing our workforce and companies from producing as much as is possible (giving technology, educational standards, resource endowments and so on), we would expect our nation – and the EU as a whole – to be falling behind other high-income countries. And that is exactly what is happening. (See pp. 25 – 26 and p. 61 of the study.) The longer that Britain remains in the EU, the more persistent will be the gap between growth in our country and in comparable non-EU high-income nations around the world. The greater therefore will be the cost to us of staying in.
For those new to the exercise, this is the sixth in a series of studies initiated by Gerard Batten MEP for the UK Independence Party in 2006. All the studies have been concerned to answer the question, How much does the European Union cost Britain? Gerard’s work was vital research for the most important political debate now facing our country. It identified problems of definition and measurement, it reviewed a number of analytical difficulties, and it established key facts and figures. It has been a challenge and an honour for me to follow in Gerard’s footsteps, both last year and in the current edition.
Let me repeat that I welcome corrections, criticisms, ideas, thoughts… As I said last year, ‘I hope other researchers will tread similar ground, and I look forward to debating the subject with them and getting closer to the truth. Sure, I have made mistakes. Of course I have. But on one point I am 100% confident, that no one will find that Britain today enjoys net economic benefit from its EU membership.’
Professor Tim Congdon CBE3rd September, 2013


11How much does the European Union cost Britain?
But we have to start somewhere. The chart above shows the UK’s net contribution to the EU, according to balance-of-payment data prepared by the Office of National Statistics, and published in the 2013 Pink Book and updated for the latest quarterly balance-of-pay-ments press release. The data remain subject to revision since new details may still be found, but they give the best available official view from the information now at hand. The numbers include transactions between the UK private sector and EU institutions, although they are dominated by government payments in and out.
The exercise generates a nice and easy round number. In 2011 the UK paid a net figure of £9.3 billion to the EU and in 2012 £10.5 billion. If someone wants a single number for the direct cost to the UK of its EU membership, ‘£10 billion’ is a good and perfectly reasonable one to choose. £10 billion is slightly under 0.7% of gross domestic product. To put it another way, for every £140 of output produced in our country, a net £1 is sent to the EU for its purposes and is lost to us. That is a neat and straight-forward measure of the UK’s direct ‘membership fee’.
0
2,000
4,000
6,000
8,000
10,000
12,000
Net transfers to EU institutions by the UKIn £m., on balance-of-payments basis
2005 2006 2007 2008 2009 2010 2011 2012
Chart 1 AW 2013. 24.08.13
Table 1.1: UK government gross and net payments to the EU, 2006 to 2016/17
£m. % of GDP Gross payments Net contributions Gross payments Net contributions by the UK by the UK by the UK by the UK government government government government to the EU to the EU to the EU to the EUOutturn 2006 12,426 3,909 0.9 0.3 2007 12,456 4,601 0.9 0.3 2008 12,653 3,294 0.9 0.2 2009 14,129 4,336 1.0 0.3 2010 15,197 7,375 1.0 0.5 2011 15,357 8,102 1.0 0.5Plans 2012 15,021 6,895 1.0 0.4 20012/13 15,358 6,959 1.0 0.5 20013/14 17,122 8,342 1.1 0.5 20014/15 18,713 9,366 1.1 0.6 20015/16 18,264 8,851 1.1 0.5 20016/17 17,560 8,260 1.0 0.5Source: HM Treasury European Union Finances 2012, p.14 and p.17
1. The direct fiscal cost
Its membership of the European Union requires the UK government to make certain payments to EU institu-tions, and entitles it to a number of receipts. How much are these direct fiscal costs and benefits, and what is the net position? That may seem like a simple question which can be answered with a single number or set of numbers. Surely, when the government spends £100 million, it spends £100 million, and it does so without fuss or ambiguity. In fact, a range of complexities mean that no one figure for many EU financial concepts is ex-actly ‘right’. Like love, the UK’s financial contribution to the EU is a ‘many-splendored thing’. Again like love, it causes many squabbles.
The cost summarized: no single number is right
The first difficulty is that definite figures relate only to the past, after accounts have been prepared and final-ized. If the object is to find out how much the UK is paying at present or will be paying in the next few years, estimates are needed. But these may prove unreliable in the end, because of – for example – the vagaries of the weather, which affect Common Agricultural Policy spending.1 Another problem is that statistics can refer to different notions of ‘the UK’. This may seem strange, but the UK could sensibly in this context be viewed as ‘the UK government’ or ‘the UK as a whole’. If ‘the UK as a whole’ is taken to be the more relevant, allowance has to be made for private sector receipts and outgo-ings that arise from the EU treaties and the resulting interactions between the UK private sector and EU institutions. Further, even when the time period has been decided, and the meaning of ‘the UK’ pinned down, interpretation can be confused by the existence of several alternative sources of information. All the sources may appear to be authoritative, but experience shows that they also conflict for no apparent reason. Bizarre though it may sound, the analyst has to make a lucky dip.

How much does the European Union cost Britain?12
But at the time of writing (August 2013) the 2012 figure is to a degree history. To have a more up-to-date view it is necessary to check the latest official forecasts. Every year since 1980 the Treasury has published a Statement on the Budget of the EU, for submission to Parliament and a subsequent document on European Union Finances. The latest such document (Cm. 8405) was published in July 2012 and gave certain numbers for the UK’s net and gross contributions to the EU budget. (The 2013 edition of the document is not yet available at the time of writing. See below for further discussion.)
A comparison of the numbers in this table with the chart on the previous page may be a little unsettling. The table’s number for 2012 of a net contribution of £6.9 billion is much less than the chart’s figure of almost £10.5 billion. However, the two answers are consistent. The concepts at work are different, while the table relates to government expenditure and receipts as such, unlike the chart which is about the UK as a nation. (Note that in the first quarter of 2013 – the latest for which official data are now [August 2013] avail-able – net transfers to the EU on a balance-of-pay-ments basis were £3.4 billion. This was the highest figure ever and annualizes at almost £14 billion, but it may have been erratically high.)
The table is also more complete than the chart, in that it presents data on gross payments to the EU as well as the net contribution. The difference between the two reflects the EU’s various payments to the UK. These are mostly Common Agricultural Policy money for farmers and development money for the regions, which are dis-cussed in more detail in the next section. At present gross payments by the government to the EU run at about £16 billion to £17 billion a year. (They are due to rise to £18.7 billion in 2014/15 and then to fall back.) On top of that the private sector also makes payments in its own name to the EU, bringing the gross figure for the nation as a whole towards £20 billion year, which is over £50 million a day.2 While it is true that about 40% of that £50 million comes back to the UK, we do not in fact have much discretion about how the returned 40% is spent. The explanation is that the UK government’s freedom is constrained by EU treaty commitments. Even with the money that is sent back from Brussels, the British government is not able to take decisions according to perceived local conditions for the benefit of the people most immediately affected. So a legitimate statement is that, ‘we in Britain pay £50 million a day to European institutions, to be spent by the EU for its pur-poses’. That is just above 1¼% of our national output. For every £100 of output produced in our country, about £1.30 is sent to the EU for its purposes and is not under our control. (When the cost of the EU is totalled, let us stick to 1% to avoid the charge of exaggeration.)
Another clear message is that the UK’s direct fiscal cost of membership has been rising in the last few years. Broadly speaking, the cost from now on will be about ¼% of GDP higher than it was before the end of the Blair premiership in 2007. Unfortunately, the future
prospect is quite murky, quite a lot murkier in fact than the apparently neat-and-tidy numbers in Table 1.1. The government has not so far (August 2013) published the 2013 edition of European Union Finances, perhaps because of uncertainties about the future direction of the EU’s finances. An intergovernmental agreement on the EU Budget appeared to have reached in February 2013, with ‘cuts’ (i.e., cuts relative to previously agreed in-creases) in expenditure. But in the middle of May the UK was outvoted at a meeting of the Council of Ministers, with an implied extra annual cost of £770 million.3
Despite the complexities, a fair summary of the facts is that the UK is a net contributor as a nation to EU institu-tions of about £10 billion a year and a gross contributor of about £20 billion. These figures are respectively 0.7% and over 1¼% of our national output. (The UK govern-ment pays less, but – to repeat – it is the nation that matters.) The next section will consider whether the gross or the net concept is the more indicative of the burden falling on the UK, and hence the more valid and useful in debates on this subject.4
Which figure is right? Gross or net?
Many people are confused by the wide range of different possible estimates. It would be nice if it were at least possible to say whether the UK’s gross or net contribution to EU institutions was the more meaning-ful. The answer depends on assessing the benefit that the UK receives from the money that is sent, to both our government and private sector, by the EU. That, of course, depends in turn on whether the money is spent well or not. It must be reiterated and underlined that the expenditure is controlled by the EU bureaucracy, not the British government. According to the European Union Finances 2012 report, the UK public sector receipts are mainly from the FEAGA (‘Fonds européen agricole de garantie’), the EAFRD (‘European Agricultural Fund for Rural Development’) and the Social and Regional De-velopment Funds. Together these amounted to £5 bil-lion. In 2012 another £890 million was paid directly to the UK’s private sector by the EU. In other words, the sums of money that the EU spends ‘for the UK’s benefit in the UK itself’ are concentrated in two areas, regional aid and farming. How worthwhile are the EU expendi-tures in these two areas?
The great bulk of the EU’s regional development spend takes place in the poorer member states, such as Poland and other East European countries. Only a small part of it is allocated to the relatively rich member states, of which the UK is one. The UK is generally regarded as having a competent and honest government machine, with its ministries answerable to parliament for tight expenditure control. By contrast, the Euro-pean Commission does not have a strong reputation for administrative efficiency. Perhaps not surprisingly, concern has been expressed at the highest level in the UK that the EU’s regional development expenditure in the UK is ineffective and wasteful, and that a

13How much does the European Union cost Britain?
better outcome could be achieved if responsibility for the expenditure were returned to the British govern-ment. In England the only part of the country to receive significant amounts of EU regional money is Cornwall. A parliamentary enquiry into the European Regional Development Fund last year judged that so far the ERDF expenditure in the 2007 – 13 period could not be said to have had ‘a significant impact’ in Cornwall or the Scilly Isles. In fact, ‘It is not even possible to conclude that the 2000 – 06 ERDF round has done so, because of the lack of robust evidence.’6
More crudely, the EU’s regional development spend had done little obvious good. The consensus on this subject in UK parliamentary circles has been strong and well-defined for many years, and both Conservative and Labour governments have tried to repatriate regional expenditure. As long ago as 2003 the then Chancellor of the Exchequer, Gordon Brown, said that the time was ripe ‘to bring regional policy back to Britain’. Even the Commission has conceded that the whole process of structural aid for Europe’s poorer regions creates ‘considerable administrative and opportunity costs’.7 A reasonable conclusion is that – because the EU is bad at spending regional aid money in the UK – the benefits are less than implied by the many billions that over the years have appeared under this category of EU expenditure. By extension, the true cost to the UK of its EU membership is closer to the gross cost than the net cost.
The same sort of conclusion is almost certainly justified by the second head of expenditure here, namely agri-culture and farm support, although less emphatically. At the start of European integration in the 1960s, farm expenditure dominated expenditure by the European Economic Community. It was intended to encourage production, not least because of painful memories of food shortages following the Second World War. The prices received by European farmers were well above the prices prevailing in world markets. By the late 1980s the resulting increases in output were impressive in absolute terms. But they were also out of line with market forces, and huge stockpiles of grain, butter, wine and so on had emerged. It was widely accepted that the over-production was a poor advertisement for the wider cause of European integration. So in 1988 the EEC intro-duced set-aside payments, in which farmers were paid for not producing grain on a certain proportion of their land. (In other words, they were being incentivised to do nothing! This is discussed in more detail in chapter 5.) From the McSharry reforms of 1992 onwards EU policy towards farming changed direction, with the new aim being to protect rural communities and the environ-ment. Today the Common Agricultural Policy has two so-called ‘pillars’, direct farm payments which continue to be related to production and rural development.
What, exactly, is ‘rural development’? No doubt the phrase has many potential meanings. ‘A cleaner and safer countryside’, ‘a sustainable environment’, ‘the preservation of traditional ways of life in the rural
context’, ‘respect for the vernacular in local culture’, and so on, are good things in their way. No doubt. How-ever, the truth is that money is being paid to tens of thousands of people for no clear benefit economically to the 63 million people who constitute the nation as a whole. So here is another example of EU spending that has a definite cost to the taxpayers of the UK, but a benefit which is limited to only a handful of people and is in fact associated with the conscious restriction of output. Again, this must mean that the true cost to the UK of its EU membership is closer to the gross figure (i.e., 1¼% of national output) than the net one.
The Polish foreign minister’s missing nought
The discussion so far has acknowledged numerous complications and difficulties in calculating the direct fiscal cost of EU membership. Nevertheless, it has identified two straightforward and easy-to-remember conclusions. First, the net fiscal cost is currently running at about £10 billion a year. Second, the gross cost of 1% - 1¼% of GDP (which is between £16 billion and £20 billion) is probably a better measure of the burden to the British people than the net cost. The gross cost deserves to be highlighted because ample evidence is available that much of the money that ‘comes back to the UK from the EU’ is badly spent.
The 2012 edition of this publication translated numbers like this into a ‘per household cost’. It took the then es-timate of the gross UK government payments to the EU in 2013/14, which was expected to be £17.6 billion, and added in some private sector costs to arrive at a total gross cost of £20 billion. This £20 billion was divided by the number of households in the UK, thought to be 26.7 million. The result was that the cost per UK household of EU membership was, more or less, £750 a year. It was also surmised that further eastward expansion of the EU, by for example allowing Turkey to join, could push that number up towards £1,000 a year. This would be equivalent to the cost of an annual holiday for a small family, something for which many less well-off house-holds have to make a conscious decision to save during the rest of the year. In other words, the cost to the British people of EU membership – in terms of the direct fiscal cost – is not crushing, but neither is it trivial.
Alarmingly, a few weeks after the publication of the 2012 edition of How much does the European Union cost Britain? a series of erroneous stories circulated in the press about the size of the direct fiscal cost. The first by Radek Sikorski, Poland’s foreign minister, appeared in The Times on 25th September under the title ‘Seven EU myths you should never believe’. According to Sikorski, ‘Your [i.e., the UK’s] annual net contribution of £8 billion - £9 billion…is less than £15 per UK citizen.’
It seems that Sikorski’s procedure had been to divide £9 billion (which was the UK’s net contribution in 2010) by the UK population of 60 million people, to arrive at…

How much does membership of the European Union cost Britain?8 How much does the European Union cost Britain?14
well, to arrive at £15. Now one does not need to be Sherlock Holmes to work out that, if one divides 9,000 million by 60 million, the answer is not 15, but 150. The Polish foreign minister had missed off a nought! (Even more upsetting perhaps, the sub-editors of The Times – reputedly one of Britain’s greatest newspa-pers – had not spotted the mistake.)
Worse was to follow. On 28th November The Daily Telegraph took a letter from Roland Rudd, in which he pushed Tony Blair’s credentials as a future President of the European Union, and said that the UK’s contribu-tion to the EU budget amounted to 1% of GDP or ‘about £15 per person’. Let us get this straight. 1% of GDP in 2012 was £15.2 billion, using the concept of ‘GDP at market prices in nominal terms’ (or ‘money GDP’) which is standard in this sort of exercise. If one divides 15,200 million by 60 million, the answer is just over £253, not £150 and certainly not £15. Rudd, in a letter representing a former British prime minister in a lead-ing newspaper, hadn’t been able to perform a simple division sum correctly.8
The blunders in elementary arithmetic made by Sikorski and Rudd were pointed out to them, and might in a rational world have led to a period of silence from the Europhiles about the per-capita cost of EU mem-bership. But, no, on 26th January 2013 David Miliband, a former Foreign Secretary and someone once seen as a possible leader of the Labour Party, offered his view
on the matter in an article ‘Cameron leaves us with a “Tantric” time bomb’ in The Daily Telegraph.9 Accord-ing to Miliband, ‘the EU costs us each £1 per week…The world is getting smaller, and the EU makes us bigger.’ Miliband may have strong opinions on the smallness and bigness of Britain in the world, but sadly he does not have a good intellectual grasp of the smallness and bigness of the cost to Britain of EU membership. Heaven knows where his £52-a-year number comes from. It may a translation of the Sikorski-Rudd £15-a-year-per-person notion into a per- household figure. (Who knows?) Anyhow it is baloney, and does not justify much confidence in Miliband’s geopolitical ramblings, tantric or otherwise.
The UK’s contribution to the EU Budget set in context
The UK’s contribution to the EU Budget may seem small relative to our national production and wealth. At about 1% of GDP, the UK’s gross contributions are of course heavily outweighed by the 99% of our output which we can use for ourselves regardless of bureaucrats and politicians from other European nations. But so it should be. The world includes other free-trading arrangements between nations, often referred to as ‘customs unions’. Typically, the only supra-national administrative struc-ture needed is a panel (of judges, usually) to settle dis-putes in the interpretation of the treaties establishing
Europhile howlers
What they said
1. ‘£15 a head’ – Radek Sikorski, the Polish Foreign Minister, estimated this as the net cost to the UK of its direct fiscal contribution to the EU budget, in an article in The Times on 25th September, 2012. 2. ‘£15 per person’ – Statement on gross cost of EU membership, by Roland Rudd in a letter to The Daily Telegraph on 28th November, 2012.
3. ‘£1 a week’, or presumably £52 a year, for ‘us’ as a measure of what ‘the EU costs us’, claimed by David Miliband in The Daily Telegraph of 26th January, 2013.
The truth
1. The £15-a-head figure came from dividing £9 billion (£9,000 million) by 60 million, but in fact 9,000 million divided by 60 million is 150, not 15. The nought was in the wrong place!
2. Rudd’s £15-per-person figure for the gross cost of EU membership may have been borrowed from the Polish Foreign Minister, but was also equated with ‘1% of GDP’. 1% of GDP in 2012 was £15.2 billion which, divided by 60 million, is £253. Rudd had miscalculated by 94%!
3. The source of Miliband’s £52-a-year number was not stated in his article in The Daily Telegraph, but it may have related to the average household rather than the average individual, and have arisen from reading the Polish Foreign Minister and Rudd. Anyhow it is wrong as are the Sikorski and Rudd numbers.
9How much does membership of the European Union cost Britain? 15How much does the European Union cost Britain?
the customs union. The cost of such panels, and even of the supporting bureaucracy, is trivial, less than a thou-sandth of 1% of GDP.
When the UK first engaged in ‘the European construc-tion’ (to use the phrase often favoured by EU bureau-crats), the British public’s understanding was that we were ‘joining the Common Market’. In other words, the objective was economic, to participate in a free trad-ing area and to enjoy the higher rates of output growth that had been seen in the Common Market nations in the 1960s. The British people did not want to help the building of a European super-state in which their inde-pendence would be weakened and lost. Unfortunately, by the early 1970s many top British policy-makers were afraid that the UK would be ‘left behind’ its economi-cally dynamic European neighbours. To them member-ship of the Common Market seemed absolutely essen-tial and they were prepared to pay a price for joining it. They were prepared to pay a price, even though all that the UK wanted was European free trade and – as has explained – the cost of administering customs unions ought to be tiny. But the Heath government that negoti-ated Common Market accession in 1973 knew that the membership fee could not be too much, as that would alienate British public opinion.
The result was therefore a membership fee – in terms of the direct fiscal cost – which was neither enormous nor trivial relative to GDP, although for most of the last 40 years it has been higher than that of any other mem-ber state apart from Germany. Of course Germany’s motives for the large sums that it has committed to European integration have always been totally different from the UK’s. Germany not only lost the Second World War, but also did so after horrific breaches of civilised standards in its treatment of racial minorities and sub-jugated territories in the early 1940s. German public opinion has seen European integration as a means both of compensating its neighbours for past wrongs and of seeking wider geopolitical reinstatement.
The rest of this study will show that the direct fiscal cost is, in fact, only part of the cost of EU membership to the UK. Far more important nowadays are the costs of regulation and waste, which were not even con-sidered in the original negotiations. It is important to remember that the UK’s status as a net contributor to EU funds goes back to the disappointments and resent-ments of the original applications back in the 1960s and early 1970s. From a wider historical perspective, the UK – unlike the other big consistent contributor, namely Germany – has no reason to be ashamed of its past or to offer ‘blood money’ to its neighbours. The British in-terest in Europe has always been commercial and eco-nomic, while a customs union or free trade area can operate successfully with a disputes panel with a cost that is negligible compared with the current direct fiscal cost of the UK’s EU membership.
Bluntly, we should not be paying a membership fee at all. Sure enough, many bigwigs in British public life –
including such figures as Tony Blair and David Miliband, aided by the public relations guru, Roland Rudd – have deluded themselves that the pay-off (in terms of ‘influ-ence at the top table’) is worth the membership fee. But their views on the subject would have more credibility if they had a correct understanding of the elementary arithmetic of EU membership. In late 2012 they made ludicrous blunders in their estimate of what that mem-bership fee meant to the average British citizen and household.
How much does membership of the European Union cost Britain?8 How much does the European Union cost Britain?16
Appendix How much does the average British household pay each year to the EU?
We have seen that no single number measures the direct fiscal cost of the UK’s EU membership. Neverthe-less, Table 1.1 shows that the gross government cost in 2014/15 is expected to be £18.7 billion. Further, various payments are made to and from EU institutions by the private sector. Let us take it that in the next fiscal year the gross cost to the UK is £20.5 billion. We have also argued that the gross cost is more valid as a guide to the UK’s burden than the net cost.
The UK had 26.4 million households on census day in 2011. The number of households is officially estimated to rise by about 200,000 households a year. So in 2014 the UK will have 27.0 million households. What, then, is the direct fiscal cost per British household?
The answer is,
The cost to the average British household of belonging to the EU is £759 a year (£20.5 billion divided by 27 million) or, as near as makes no difference, £750 a year. Sure, we get some of this money back for some regional development spending, but that only benefits the regions that receive the money. Anyhow our government cannot control exactly how it is spent. In most of the UK the average household is £750 a year worse-off because of our membership of the EU.
But that is not all. The three ‘main’ political parties have said they want the EU to expand to take in much of the Balkans and Turkey. The Balkans and Turkey would be large recipients of regional aid and agricultural support. If they joined the EU, the cost of membership to the average British household could well rise towards £1,000 a year.
1 The Common Agricultural Policy is discussed and explained in chapters 3 and 5 below. 2 The UK Independence Party has for some time made the statement ‘EU membership costs £53 million a day’. That statement is correct, despite all the ambiguities discussed in the text. The author has a copy of a letter of 29th April, from Peter Wilding of the British Influence pressure group, to Nigel Farage which says, ‘we believe [the £53-million-a-day figure is] materially misleading to audiences and as such…liable to be in breach of the Broadcasting Code’. 3 Matt Chorley ‘Britain loses EU budget battle’, Daily Mail, 15th May 2013. 4 The 2012 edition of this publication had a long discussion of how events had determined the UK’s EU membership fee. It has been deleted for space reasons, but is available from [email protected] Cmnd. 8405 European Union Finances 2012 (London: Stationery Office, 2012), p. 14. 6 Department for Communities and Local Government Government Response to the House of Commons Communities and Local Government Committee Second Report of Session 2012/13 (Cmnd. 8389 [London: Stationery Office, 2012), box to clause 4.] 7 Off Target: the case for bringing regional policy back home (London: Open Europe, 2012), p. 3. 8 The Daily Mail of 15th December 2011 carried a story on Rudd. To quote, ‘this arch-fixer’ had recently held his annual drinks party at Tate Britain which ‘was among the most glamorous and exclusive of City end-of-year bashes. Captains of industry mingled with the big beats of Westminster. Such leverage made him an obvious choice to mastermind the Europhile Lib Dems’ fightback after David Cameron’s veto of a new treaty left the party [the political party, that is] floundering.’ Incidentally, Nigel Farage and the author of this publication – the leader of the UK Independence Party and its economics spokesman – sent a letter to The Daily Telegraph correcting Rudd’s howler. It was not published. 9 David Miliband ‘Cameron leaves us with a “Tantric” time bomb’, The Daily Telegraph, 26th January 2013.

9How much does membership of the European Union cost Britain? 17How much does the European Union cost Britain?
2. The costs of regulation
Cost of acquis communautaire criticized by EU supporters
The cost of implementing the 120,000 pages of legislation is massive. Given the multiplicity, complexity and diversity of the EU’s directives and regulations, precise estimates of the cost – estimates that purport to be accurate to a few hundred millions of euros – are not to be expected. Only broad-brush, rough-and-ready numbers make sense. Given the vast scope of the EU’s regulatory effort, the present study cannot pretend to offer detailed and rigorous new quantitative research. All that can be done here is to collate and synthesize the results of other analyses that seem well-intentioned in purpose and well-grounded in fact.
Criticism of the cost of the acquis communautaire has come from a wide range of authorities, including many who are strongly supportive of European integration. The 2012 edition of this publication cited comments from such figures as a former EU commissioner, Gunter Verheugen, and Peter Mandelson, the famously Europhile politician, that pointed towards this cost being a few per cent of the EU’s gross domestic product. It also discussed at some length a 2010 report, Still Out of Control?: Measuring eleven years of EU regulation, from the London-based think-tank Open Europe, which used official ‘impact assessments’ of hundreds of regulations to quantify their costs. To quote from the 2012 edition of How much does the European Union cost Britain?, ‘A key conclusion was that, “in 2009 the cost arising from all regulations [i.e., all regulations, including those of UK origin] introduced since 1998 was £32.8 billion”, with 59% (or £19.3 billion) being EU-derived. For the purposes of presentation, this was rounded up to £20 billion a year.’ Since Open Europe has stated that it wants the UK to remain in the EU, the £20-billion-a-year figure may raise eyebrows.
The willingness of pro-EU politicians and commentators to attack the EU’s regulatory burden speaks volumes, in that it suggests that almost everyone accepts that ‘something has gone wrong’. However, the Open Europe analysis could have been more probing and begged many questions. For example, it overlooked that sensible estimates of the cost to the UK of only one part of the acquis, the renewables programme, are as much as £20 billion a year (or thereabouts). The full economic cost of EU regulations to the UK is in fact much higher than £20 billion a year, as will be readily demonstrated in the next few pages. Defenders of the acquis have to justify it in non-economic terms, because of its actual or supposed social and environmental benefits. However, as explained at the end of this chapter, the claim that such benefits are the rationale for the acquis is bogus. The main driver of EU integration is geopolitical, the fear in Germany and other European nations that a divided Europe might again plunge into the kind of senseless warfare seen in the first half of the 20th century.
The impact of the EU’s regulatory burden is reviewed in the rest of this chapter under four headings,
From a constitutional standpoint, the European Union is a monstrosity. Powers have been ceded to EU institutions that place them above the member nations in the constitutional hierarchy. These institutions are, in effect, federal bodies that constitute a ‘government’ for the EU as a whole. Nevertheless, the member nations have retained the essential trappings of statehood, and in particular continue to have their own military forces, their own legal systems and their own fiscal prerogatives. Critically, most taxes are raised and most public ex-penditure is administered at the national level. EEC expenditure was a mere 0.03% of member states’ aggre-gate gross domestic product in 1960, and had climbed to 0.53% of that figure in 1973 on the UK’s accession. The ratio has subsequently risen to slightly more than 1% of EU GDP, as we saw in the last chapter. But it is striking that Germany – the main sponsor of European integration – has over the last 20 years been one of the member states most opposed to additional spending in the union’s name. At the Edinburgh meeting of the European Council in 1992 Germany actively supported a spending ceiling of 1.27% of aggregate member nations’ GDP.1
On the face of it the EU has two layers of government, one at the national level and the other for the union as a whole. But the word ‘layer’ implies, falsely, that a clear and definitive understanding has been established on the proper relationship between the two. The true situation is a blur. In fact, EU member states are in the dysfunctional situation of having two distinct governments, one in the national capital and the other in Brussels, with their relative powers and responsibilities largely unsettled. The EU bureaucracy has been unable to wrench the key fiscal prerogatives, the powers to tax and spend, from the member states. To compensate for this failure, it has tried to expand its influence by pressing for more European ‘laws’. The heart of the process is that the European Commission proposes new ‘directives’ and ‘regulations’ to the Council of Ministers. Successive treaties have weakened the power of individual nations to block new EU legislation that they dislike. Particularly since the Single European Act of 1986 the nation states have become increasingly feeble in restraining the EU juggernaut. Over the 55 years of its existence the European Commission has authored thousands of directives and regulations that have the force of law across the EU.
At the last count the EU’s various legislative enactments – which are termed the acquis communautaire – covered over 120,000 pages. As far as the EU is concerned, the acquis is sacrosanct and must be adopted by all new member states without cavil. Directives and regulations are the main expression of EU authority, and nowadays infiltrate every nook and cranny of national life. In the words of Lord Denning over 20 years ago, ‘Our sover- eignty has been taken away by the European Court of Justice…No longer is European law an incoming tide flowing up the estuaries of England. It is now like a tidal wave bringing down our sea walls and flowing inland over our fields and houses – to the dismay of all.’2

How much does membership of the European Union cost Britain?8 How much does the European Union cost Britain?18
major facilities – in Anglesey and Lynemouth, North-umberland – were closed down in 2009 and 2012 respectively. The UK’s cement industry is a heavy user of energy and is also responsible for substantial CO2
emissions when limestone is heated to make clinker. It is facing big increases in costs, partly because of higher electricity bills, but also because of the cost of obtaining permits under the Emissions Trading Scheme. As cement is expensive to transport, most countries produce most or all of the cement they use. But the UK is increasingly a net importer. As the Civitas think-tank noted in a December 2012 discussion, UK cement production in 2011 was 28% down on the 2007 level, but imports had stayed roughly constant at about 1.1 million tonnes a year. Indeed, cement imports are expected to rise if and when the construction industry recovers.4
Government departments have of course had to advise ministers on the costs of the UK’s adoption of the EU’s green agenda. The Guardian has received a series of leaks from sources in the Department for Business, Enterprise and Regulatory Reform (formerly the Department of Trade and Industry) on key energy policy issues that have been and remain in dispute. Some leaked documents indicated that the cost of meeting EU targets would be between £5 billion and £11 billion a year. Indeed, according to the documents, the long-term goal of 20% of total energy being from renewables would cost £22 billion.5 It needs to be stressed that, unlike the cost calculated in impact assessments which are in principle justified by offset-ting benefits, these costs are costs, full stop. £22 billion is about 1½% of GDP. Note that this is above the direct fiscal cost, even on a gross basis, discussed in chapter one! Because the British government has at the EU’s behest imposed expensive methods of electricity generation, and because it has deliberately added to energy-using industries’ costs to stop them emitting carbon, Britain is worse-off without qualification. (The selection of costly methods of electricity generation may eventually prove to have been correct, in that lower CO2
emissions may help ‘to save the environment’. But – as of now – that is conjecture.)
Is a rethink under way? The 2009 Renewable Energy Directive was accompanied by a Fuel Quality Directive which altered the provisions in the 2003 Bio Fuel Directive. The EU’s aim in this policy area had been to reduce the carbon intensity of EU road transport fuels by 6% by 2020. Biofuels – fuels that are derived from plants grown on farmland – were always envisaged as the alternative to fossil fuels. So expansion of the land area under biofuel crops had to be a corollary of the EU’s approach. However, it is obvious that the more land is used for biofuels, the less land is available for food production. With the earth’s population increasing, the world needs more food. The 2009 Fuel Quality Directive therefore said that ‘ILUC factors’ would have to be part of fuel suppliers’ reporting requirements and warned that subsidies for biofuels might not continue after 2020. (‘ILUC’ stands for ‘indirect land use change’,
- The cost of the renewables legislation, - The cost of employment laws, - The cost of financial regulation, and- The cost of regulations to ban substances and to manage processes.
Also significant are the costs of the EU’s environmental legislation, and the EU’s various interventions in the farming and fishing sectors. However, the damage in these areas might be better interpreted as resource misallocation and waste, and so is discussed in the next two chapters.
Cost of EU renewables legislation
The three key directives in the renewables area are the 2001 Large Combustion Plant Directive, the 2003 Bio Fuel Directive and 2009 Renewable Energy Directive. The last of these is the most significant and the most dangerous. (The EU’s complex Emissions Trading Scheme, launched in 2005 is also worth mentioning, but there is no space here for a detailed assessment. Under the scheme permits to emit a limited amount of CO2
are issued to industries known to be heavy polluters and these can then be traded between energy- using companies.) The EU bureaucracy has accepted the so-called ‘warmist’ doctrine that, because of the carbon emissions arising from modern industrialism, mankind is largely to blame for the global warming of recent decades. The purpose of the 2009 Renewables Directive is, explicitly, to move towards a 20% drop in the EU’s carbon emissions by raising the proportion of electricity generated by renewables (wind, wave, solar and so on) to 20% by 2020. The cost of electricity generation by means of renewable energy is much higher than that by conventional methods (gas and coal firing, mostly). For example, electricity from offshore wind farms costs at least three times as much to produce as electricity from a gas-fired combined-cycle power station.
This is not the place for a lengthy discussion of the environmental impact of carbon emissions. It may or may not be proved 20 or 30 years from now that global warming has been caused predominantly by mankind. Whatever the outcome of that debate, several nations are not making major adjustments today to their policies towards energy, electricity generation and the environ-ment. In electricity generation they continue to invest in order to minimize cost. As a result, households and companies in every country in the EU – and not just the UK – will have to pay well above the international price for electricity. Industries heavily reliant on energy usage and electricity consumption will become too high-cost compared with suppliers from other countries. They will stop investing in the UK and other EU countries. As a news story in The Sunday Times on 6th February 2011remarked, ‘Leading chemical companies have warned the government that its energy policies will render them uncompetitive, leaving plants to “die on the vine” to quit Britain for lower-cost countries.’ 3 The UK no longer has an aluminum smelting industry, as the two

9How much does membership of the European Union cost Britain? 19How much does the European Union cost Britain?
The UK’s position in the Maastricht negotiations was resented by other EU member states. Although Major kept the Social Chapter as such out of the treaty, the treaty tacked on a protocol which said the provisions of the Social Chapter would be in force in eleven member states. That is, the Social Chapter would be in force in all the member states apart from the UK! When Labour was elected to power in the 1997 general election, the new government under Tony Blair quickly adopted the protocol for the UK. The 1997 Treaty of Amsterdam, to which the UK was a signatory, incorporated the Social Chapter in full. Over the following 16 years a host of ‘social protection’ measures have been incorporated in British law, so that in this respect the UK increasingly resembles its neighbours.
The narrative of the last three paragraphs is important, because it demonstrates that the burden of EU employment legislation was unquestionably a major concern for one of the UK’s two main political parties in the 1990s. John Major and his colleagues did think that the Social Chapter reduced employment, distort-ed the labour market and reduced living standards, and they made no secret of their views on the matter. So – if an analyst in 2013 holds the same view – that should not be seen, in the UK at least, as particularly iconoclastic.
Were the Conservatives of the Thatcher-Major era right to be worried about the consequences of the Social Chapter? Their main concern was that, because implementing such a wide range of social and employment protection measures would raise the effective price of labour, the level of employment would be reduced. As explained, the Social Chapter is now in force across the whole of the EU, although labour market policy continues to differ significantly between EU member states. If the Social Chapter had indeed destroyed jobs, one result ought to be a lower level of employment (as a proportion of the employable work-force) in the EU than in the rest of the advanced world. The relevant information is compiled by the Paris-based Organization of Economic Cooperation and Develop- ment, and given in Table 2.1 on the next page. It relates to the final quarter of 2012. In Europe two important countries do not belong to the EU, namely Switzerland and Norway, while the UK had for an extended period in the 1990s a consciously less restrictive labour market policy than other EU member states. The table shows that the employment ratios in these three nations are well above those in the EU on average and, to a somewhat greater extent, than in the Eurozone. The gap between the EU/Eurozone on the one hand and Switzerland and Norway on the other amounts to over 10% of the workforce, and must go some way to accounting for the considerably higher living standards in the two fortunate non-EU countries. The difference is less marked compared with the UK, but it still amounts to over 6% of the working- age population. Meanwhile the employment ratios in the USA, Japan and the three high-income Common-
i.e., the loss of land that could produce food.)6 Plainly, official policy is uncertain and confused, and it has been presented inconsistently. Nevertheless, a new petrol – called E10 – was reported by The Daily Mail (12th March 2013) as likely to be introduced before the end of the year, in order to begin the UK’s compliance with the 2003 and 2009 directives. E10 will give fewer miles to the gallon than existing fuels, while millions of cars may not have engines that are compatible with it. The Daily Mail quoted a Chatham House report that the lower mileage of E10 might cost UK motorists £1.5 billion a year.
On balance, it seems reasonable to conclude that the UK’s implementation of the EU’s renewables agenda will cost the nation between 1¾% and 2¼% of GDP, year after year, when we are fully compliant with the directives in the 2020s. But much of that eventual recurrent cost has already hit us, as the investments to reach full compliance (in terms of offshore wind farms and the like) have been made in recent years.
Cost of EU employment legislation
The EU’s encroachment on national governments’ ability to govern began seriously in the late 1980s, follow-ing the Single European Act of 1986. The Conservative government under Margaret Thatcher was an eager supporter of the Single European Act, but Thatcher and some of her colleagues soon had second thoughts. Directives and regulations to promote the supposedly benign ‘Single Market’ were accompanied by directives and regulations to introduce undoubtedly costly measures of social protection. The Thatcher government had battled from 1979 to remove such measures in the UK, since they were believed to reduce employment and hence national output. Although Thatcher herself left office in 1990, the Conservative government under her successor, John Major, had similar priorities. It was anxious to prevent unjustified employment legislation coming onto the UK statute book as a by-product of signing EU treaties. In the negotiations related to the 1992 Maastricht Treaty the UK threatened to veto the inclusion of ‘the Social Charter’. The effect was to stop a so-called ‘Social Chapter’, with 30 general principles of employment law, being applied in the UK.7
These 30 principles covered a wide range of topics, rights to parental leave at childbirth, pension provi-sion, rights of migrant workers, the treatment of the disabled, dismissal procedures, and even rights to decent housing and health care. The application of these principles would add to business costs and discourage companies from taking on staff, and the Conservative government under John Major was wholly opposed to making the principles part of British law. To quote from Major’s memoirs on the conduct of the Maastricht negotiations, ‘I pointed to the excellence of our record in job creation: we were creating more new employment in Britain than in all our partners put together.’ 8

How much does the European Union cost Britain?8 How much does membership of the European Union cost Britain?8 How much does membership of the European Union cost Britain?8 How much does the European Union cost Britain?20
the sole cause of the EU/Eurozone’s apparently severe under-performance?
No doubt the debating points can be batted around endlessly. However, other more specific evidence on particular examples of regulation argues strongly that EU labour legislation is bad for jobs and output. In the Thatcher-Major period the UK government tried hard to promote a flexible labour market, with employers freely permitted to offer temporary work, to notify staff needs to agencies and so on. That has been reversed since 1997. For instance, in late 2011 the UK was obliged to implement the Agency Workers Regulations which say that, after 12 weeks on an assignment, agency workers are to have the same rights (to pay, holidays and so on) as permanent staff. As the Open Europe think-tank estimated in research published in September 2011, around 28,000 temporary employment contracts for those aged between 16 and 24 were threatened by the new regulations. The government itself calculated that the total annual cost of the new regulations would be £1.8 billion a year, with the bulk of that falling on the private sector.9 But the Agency Workers Regulations are only a fraction of the total of EU-based employment law. Dozens of other regulations could be mentioned, analysed and discussed. The box on page 21 lists just seven directives, to give a flavour of the mass of regu-latory injunctions now affecting British companies (and of course companies all over the EU).10
A few weeks after issuing its press release on the cost of the Agency Workers Regulations, Open Europe pub-lished a more detailed report on EU social policy as a whole. The remit of this report Repatriating EU social policy: the best choice for jobs and growth was to
wealth countries are plainly well above those in the EU/Eurozone. On the face of it, something is wrong with the labour market in the EU/Eurozone.
What is the cost to the UK of its incorporation of the EU’s social and employment legislation in its law? Of course, the kind of people excluded from employment by the EU’s rules and regulations are unlikely to be of average productivity, since they are on the margin of employment. Suppose – for the sake of argument – that they are half as productive as the average worker, and that the difference (which is about 8%) between employment ratios in the non-Eurozone European states (i.e., the UK, Switzerland, Norway) and the Euro-zone is entirely attributable to the Social Chapter, then the output cost of the Social Chapter is 4% of GDP. On that basis John Major and his ministerial colleagues were correct to keep the UK out of the Social Chapter in 1992, and Blair and his team were wrong to allow it to come to the UK after 1997.
Of course, the proposition being made here – that all of the difference in employment ratios between the Eurozone countries, with their commitment to ‘ever closer union’, and three more semi-detached European countries is 100% due to Social Chapter measures – is controversial. Perhaps only part of the difference in employment ratios is to be interpreted in these terms. It is interesting, for example, that within the Eurozone the employment ratio in Germany (73.1%) at the end of 2012 was actually above the UK level, and far higher than in France (64.1%), Italy (56.5%) and Spain (54.6%). If Germany does so well despite having social protection arrangements comparable with those elsewhere in the EU, are those arrangements
Table 2.1: Employment ratios in high-income countries
Table shows proportion of people in 15-64 age group that are in employment.Figures relate to the fourth quarter of 2012 and come from the OECD database.
%
Switzerland 79.6 Norway 75.5 Australia 72.5 New Zealand 72.3 Canada 71.3
United Kingdom 70.6
Japan 70.9 USA 67.3
European Union 64.2 Eurozone 63.6
Source: OECD database, at August 2013.

9How much does the European Union cost Britain? 9How much does membership of the European Union cost Britain? 9How much does membership of the European Union cost Britain? 21How much does the European Union cost Britain?
consider how the UK could bring control over these areas of national life back to the UK legislature and government, and to estimate the size of the benefit that might follow.11 To quote,
Repatriating EU social law could allow the UK to seek changes and cost savings that would be very difficult to achieve if they were subject to agreement at the EU level…[C]utting the cost of EU regulations in this area by 50% could result in the equivalent of 140,000 new jobs…if the entire increase in output as a result…goes into employment. In reality, however, the benefits from deregulation would likely be split between employment and productivity. Under such a scenario, a 50% cut in regulation could create the equivalent of 60,000 new jobs in the UK in addition to adding £43 billion to the country’s economic output. We also estimate that 100% deregulation of EU social law would yield an annual £14.8 billion boost to UK GDP – though the figure is merely illustrative as complete deregulation is not a practical option.
Now £14.8 billion is about 1% of the UK’s GDP. So, again, we are talking about the adverse economic impact of the EU regulatory burden being similar to or larger than the direct fiscal costs discussed in the first chapter. Further, this critical appraisal of the EU’s impact on the UK came from an organization which believed that the UK should remain in the EU.12
The exact cost of Social Chapter-type measures to the UK economy will always be a matter of debate. Undoubtedly, employment and output are lower than they would be without all the rules and regulations, and it is a matter of opinion whether people value extra job security, guaranteed paternity leave and so on. (Many employees can find work easily and arrange pat- ernity leave with employers, regardless of government diktats on the subject.) The intensity of the well-argued opposition to such measures suggests the Open Europe estimate of their cost may be viewed as a lower bound, whereas the 4%-of-GDP figure implied by the EU/ Eurozone’s low employment ratio is an upper bound. It is therefore proposed that a cost of between 2% and 2½% of GDP is plausible.13 Moreover, this cost
may well be rising over time as more Social Chapter- type measures are introduced.14
The cost of EU-imposed financial regulation
The 2012 edition of this study had an extended dis- cussion, running to about 2,500 words, on the boom in the UK’s exports of financial services in the 40 years to the onset of the Great Financial Crisis in 2007. This boom was central to the UK’s good ‘supply-side performance’ in the two decades from the mid-1980s, when its national output grew faster than that of its European neighbours. As is well-known, the UK financial service sector is concentrated in London and particu-larly in the ‘City of London’ itself (i.e., ‘the Square Mile’, with boundaries that correspond more or less to those of the Roman city 2,000 years ago). It was pointed out in the 2012 edition of How much does the European Union cost Britain? that in the decades of the City’s success the regulation of the financial sector was predominantly a UK matter. Concern was expressed that the Lisbon Treaty had transferred ultimate regulatory control to authorities subordinate to the European Commission, and taken it away from national parliaments, including the UK’s own Parliament in Westminster. The three newly-formed authorities were the European Banking Authority (located in London), the European Securities and Markets Authority (in Paris), and the European Insurance and Occupational Pensions Authority (in Frankfurt).
The fear was that these bodies would be remote from, and so unsympathetic to, the UK’s own financial sector. Large financial firms, often with a global scope and perspective, would therefore emphasize the growth of businesses outside the UK and indeed outside the EU altogether. As Anthony Belchambers, chief executive of the London-based Futures and Options Association, commented to the Financial Times, that ‘red tape, ill-informed tax initiatives, protectionist policies and high “pass on” costs will damage the international reach of the City’.15
Bluntly, key policy-making individuals in Germany, France and other continental European countries have long disliked the financial services industry, and resented the UK’s past success in these activities. The euro was seen as a means of shifting Europe’s financial centre of gravity from London to the European mainland. In the words of Wolfgang Munchau, a prominent columnist on the Financial Times, ‘…if the Eurozone has a collective interest in anything, it is to stop the City acting as its main financial centre’.16 But that does not go far enough. Prominent European politicians hardly bother to hide their aversion to financial activity or their desire to handicap or even expel the most complex and highly-paid financial industries from the EU. While the UK remains a member of the EU, expulsion from the EU means expulsion from the UK.
Have the fears of an EU-based campaign against the
Table 2.2: Examples of EU ‘social’ directives
Safety and Health at Work Directive 1989
Works Council Directive 1994
Parental Leave Directive 1996
Race Directive 2000
Equal Treatment Directive 2000
Working Time Directive 2003
Gender Equality Directive 2004

How much does the European Union cost Britain?22
UK financial sector been justified so far? The last year has seen vigorous advocacy by the EU of a number of policy changes that, if and when implemented, would profoundly harm the City of London. For the commer-cial banking and securities industries, much the most damaging would be the proposed ‘financial transactions tax’. The European Commission published a range of documents and policy statements about this tax, and there is little doubt that it wanted the tax to go ahead. To an uninformed observer, the tax rates (of 0.1% on securities and 0.01% on derivatives) were very low and therefore innocuous. However, the City of London specializes in highly competitive areas of financial trade, mostly between big firms and of a so-called ‘wholesale’ nature, with very narrow margins between buying and selling prices. The 0.1% and 0.01% tax rates were higher than the profit margins in some kinds of financial transaction, which would therefore become uneconomic and would either leave the EU or cease. On 14th February 2013 the European Commission put its name on a Powerpoint presentation that unashamedly envisaged a 75% fall in derivatives trading.17 It was plainly indifferent to the job losses (running into the tens of thousands) and ruined livelihoods that would result. Its officials must have been aware – indeed, they may have been delighted – that the job losses and ruined livelihoods would be mostly in London and the South-east of England.
Such activities as derivatives trading and futures bro-king are complex, often requiring substantial back-up
in terms of information technology and professional support (i.e., law, accountancy and so on). In banks and other organizations active in these areas profit streams can be large and volatile, and so also are the incomes of top staff. Incomes in the City of London often therefore have a major or even dominant bonus element, which helps the banks in handling the marked and unpredict-able fluctuations in the profitability of different revenue streams. Here, too, the EU has decided to interfere. A new cap on top bankers’ bonuses, which are to be limited to the same level as salary (or twice salary with explicit shareholder approval), is to take effect in 2014. The effects on Britain’s banking industry will undoubt-edly be adverse. The largest bank headquartered in the UK is HSBC, although most (about 80%) of its operations are outside the EU. Because it is UK-based, it will have to apply the bonus cap to all its operations around the world, a development about which it has been openly angry and hostile. Of course, one way of side-stepping the new EU regulation would be to relocate the head-quarters from London to, for example, Hong Kong, where in fact the bulk of the profit is earned. As Norman Lamont, a former Chancellor of the Exchequer, remarked in an article in The Daily Telegraph on 26th February 2013, government interventions in pay create ‘distortions, as companies find ways of circumventing them. If implemented, the new pay restrictions would lead to an exodus of bankers and traders to Switzerland and the Far East.’18
Compared with banking, insurance has been out of the
‘Financial services’ as suchAll services receipts due to ‘the City’
0
10
20
30
40
50
60
70
80
90
100
1991 1993 1995 1997 1999 2001 2003 2005 2007 2009 2011
Has the City of London gone ex-growth?Value in £b. of exports of financial services, on two definitions, from official data: last year is 2012
2013

23How much does the European Union cost Britain?
media limelight in the last few years. Unlike bankers, top insurance underwriters and brokers have not been blamed for the Great Recession of late 2008 and 2009. However, the UK’s insurance industry also has been affected by EU regulation. Lloyd’s of London, which dates its origins back to 1688, remains the focal point for the UK’s international insurance industry. Its four largest national markets (by premium written) are the USA, the UK, Canada and Australia, while the EU is something of a side-show. (Premiums from the USA are 20 times those from France.) But Lloyd’s’ global outlook has not exempted it from the EU’s regula-tions. Because it is located in the EU, it must comply with them whether it likes to or not. In the last few years these have taken the form of the introduction, or rather the attempted introduction, of a capital regime known as ‘Solvency II’. UK insurers have spent billions of pounds – in management time, consultancy fees and the like – so that their businesses can meet the Sol-vency II standards. Unfortunately, German and French insurance companies are at loggerheads over the provi-sions of Solvency II, and cannot reach agreement. So all the money committed to Solvency II by Lloyd’s of London and other UK insurance companies has been spent prematurely and, to that extent, wasted. Andrew Bailey, a top Bank of England official, said in February 2013 that the ‘mounting costs’ of Solvency II implemen-tation were ‘frankly indefensible’.19 Some insurance companies have become so irritated by the delays and inefficiency of EU regulation that they have left London altogether. 20
The impact of EU regulation on the British financial sec-tor is a large and painful subject, but a brief summary is needed. The verdict at this point in last year’s How much does the European Union cost Britain? was that
The Lisbon Treaty has led to the surrender, to hostile European politicians and bureaucrats, of regulatory control over industries in which the UK had been particularly dynamic and successful, and which account for about 5% of UK GDP. A case can surely be argued that the regulatory follow-through of the Lisbon Treaty will check the growth of the UK’s international financial services sector and may even cause it to contract. What is the cost of that to the UK in terms of lost opportunities for highly-paid employment, profits and tax revenues? Given that the value added in the international financial services industries runs at perhaps £40 billion to £75 billion a year, that they had been growing at 15% a year and now face stagnation, and that use of the same resources will be less productive elsewhere, the UK’s loss from EU-imposed regulation might be estimated at £1.7 billion in the first year, but increasing with time. The capital loss to the UK – on assumptions which discount the loss aggressively (i.e., make it smaller than it otherwise would be) – might be almost £60 billion.21
That assessment again seems reasonable, although the
loss now needs to be raised towards £3.5 billion to £5b., which is about ¼% - 3/8% of GDP. In fact, given the waste arising only from the botched introduction of Solvency II, the number may be on the low side. The surmise that the City of London would stagnate, instead of growing at 15% a year as it had done for over a generation until 2007, has so far been correct. (See the chart opposite. The figure for ‘financial exports as such’ is taken directly from official statistics. The wider category adds insurance to that figure and 40% of ‘other business services’, on the grounds that the demand for a high proportion of these services is derived from the financial sector.) According to official UK balance-of-payments data, the UK’s exports of financial service exports in 2012 were £46.0 billion, slightly down on the 2007 figure of £47.4 billion and much less than the 2008 figure of £54.8 billion. The impressive growth of the 40 years to 2007 lies in the past, with EU regulation now a major obstacle to the dynamism and prosperity of the City of London.
Regulations to ban substances and manage processes
As was explained at the start of this chapter, because the EU bureaucracy has been thwarted in its hopes of taking fiscal powers away from the member states, it has sought to justify its existence by the proliferation of the rules and regulations in the acquis communautaire. But what belief-system, if any, motivates the content of the rules and regulations? A vague notion of ‘social justice’ seems to underlie the employment legislation and it also may have played a part in the new wave of financial regulation. (In EU circles the cap on bankers’ bonuses was rationalized by the argument that ‘the bonus culture’ caused banks to take too large risks. However, the European Parliament wanted the cap extended to the fund management industry, which is quite distinct from commercial banking. The inescap-able message is that the EU dislikes people earning exceptionally high incomes, simply on the grounds that exceptionally high incomes are wrong.)
But also important is that the EU bureaucracy has been persuaded by ‘the precautionary principle’. According to Wikipedia, this principle ‘states if an action or policy has a suspected risk of causing harm to the public or to the environment, in the absence of scientific consensus that the action or policy is harmful, the burden of proof that it is not harmful falls on those taking an act’. In other words, when the finger of blame for an alleged evil is pointed at certain businesses and individuals, those businesses and individuals must prove that they are not to blame or face a ban or restriction of some sort. The EU bureaucracy’s inclination is therefore to meddle and forbid. It cannot stand back and allow people to resolve their differences by agreement or arbitration, subject to the rule of law. The EU’s attitude has led to the out-lawing across Europe of hundreds, perhaps thousands, of substances that had formerly been permitted at the national level.

How much does the European Union cost Britain?24
Particularly contentious have been the EU’s directives in the medical area. The effectiveness of familiar over-the-counter medicines is often doubtful compared with modern prescription drugs. For example, many herbal medicines may be assessed as little better than placebos by expert testing. In 2004 the EU introduced a Traditional Herbal Medicinal Products Directive (THMPD), which required herbal remedies to be registered and approved, even if they had been sold freely for decades. According to the website of the Alliance for Natural Health, the globally recognised pharmacopoeia of herbal medicine includes ‘up to 1,500 different plant species’. But, after a decade of the THMPD, the EU’s registration scheme ‘has allowed a total of 133 herbal species through its doors, very few of which are associated exclusively with non-European traditions’.22
Herbal medicines may or may not work, and there may not be much sympathy for them in some circles. But other banned medicines have long been accepted as of genuine therapeutic value. Milk of Magnesia is a well-known remedy for indigestion, but its sale was prohibited by the EU in 2013 because it contained more than 0.5% sulphates. In its report on the matter The Daily Telegraph quoted a Mrs. Taylor from Lancashire, ‘I used it on my children and they’re all walking around fine. Mum knows best, not those suited bigwigs in Europe.’23 Numerous other examples of the arguably harmful banning of substances could be cited, including the banning of insecticides (which are needed to protect grain and fruit crops) and rodenticides (which of course kill of rats, mice and other pests).24
The damage to the economy here has been two-fold. First, the companies that had made the banned substances have to withdraw supply, and that may lead to job losses and factory closures. In the extreme small businesses may have no alternative to closure, with the complete destruction of the owners’ equity. Secondly, the substances still permitted by EU regulation may be less efficient and worthwhile than those that
cease to be available, so that consumers are worse-off. (Milk of Magnesia bottles are said to sell on Ebay for £20, instead of the £2 price charged when they were still in the shops.) In economists’ jargon, there are losses of both ‘producers’ surplus’ and ‘consumers’ surplus’.
The same dual burden of regulation applies when the EU enforces certain procedures, typically of product authorisation. But it is seen and felt far more by pro- ducers than consumers, and may be invisible to the man or woman ‘in the street’. Again, numerous illustrations can be provided, some of them going back many years. As remarked in The Great Deception, an outstanding book on the EU by Christopher Booker and Richard North, the impact of EU regulation intensified in the early 1990s in association with ‘the 1992 Single Market programme’. The Great Deception mentioned three significant examples on two pages, one of the effect of a ‘Electro-magnetic Compatibility Directive’ on a business producing electronic devices used in dredging work, another of a small garden centre suddenly required to pay an extra £20,000 for waste removal, and the final one in which tighter regulations for slaughter-houses and abattoirs obliged a 100-year-old butcher’s business to close.25
One theme in the wave of new regulations is that they frequently have their source in an existing standard in France or Germany. This reflects the original dynamic behind European integration, which was (and remains) Germany’s ambition to recover geopolitical standing after its misdeeds in the early 20th century. In 1963 it persuaded the French government under Charles de Gaulle to participate in the task of integration, and the German and French governments signed the Élysée Treaty of friendship between their nations. Officials and ministers from Germany and France regularly meet before European summits. They decide the agenda, agree a common front and work together (to ‘stitch up’ other nations, including the UK) at the summits themselves.
Table 2.3 Summary of the costs of the acquis communautaire to the UK economy Costs at present, Tendency of costs Eventual cost impact, as % of GDP over time as % of GDP
Renewables agenda 1¾ - 2¼ Capital cost being incurred now 1¾ - 2¼
‘Social Chapter’, etc. 2 - 2½ Rising ?
Financial regulation ¼ - ½ Rising rapidly ?
Substances & processes ¾ - 1¼ Rising slowly ?
Total 4¾ - 6½ Rising by 1/2% to 1% of GDP a year ?

25How much does the European Union cost Britain?
It was a French practice that has been behind the impo-sition of the droit de suite on London fine art auctions. Since the 1920s the creators of works of art have in France been entitled to receive a share of the proceeds not just of the first sale of their work, but of all sub-sequent resales within a certain period. In the UK and most other countries this was not so until 2006, when – under EU pressure – the UK accepted the droit de suite principle for works of art by living artists. In 2012 this was extended to works of art for artists deceased 70 years or less. According to Anthony Browne, executive director of the British Art Market Federation in an inter-view for ARTnews, ‘The problems with the law are al-ready evident, and they’re just going to get worse’. The problem, in his view, was that the artists’ resale royalty ‘is expensive and complicated to administer, and it will shift buyers and sellers from the UK, which has lost a considerable amount of global art market share in the past five years, to countries where there is no royalty to be paid’, such as the United States and Switzerland. 26
Much more material could be presented on the costs to the British economy of the banning of substances and regulation of processes that stem from the acquis com-munautaire. Unfortunately, much of it is miscellaneous and technical nature. Nevertheless, it is clear that the damage, while small-scale in any particular year, has been cumulative over a period of more than 20 years. If it were suggested, realistically, that in any particular year since 1992 (i.e., the start of ‘the Single Market’ pro-gramme) the expansion of the acquis had added regula-
tions that reduced national output by 0.05% (i.e., by a twentieth of 1%), then the loss of output would now be 1% or thereabouts (¾% - 1 ¼%) of GDP. Something of this sort has been going on.
Overall cost of regulation now running at 5% - 6% of GDP
It is time to bring together the main points of this chapter. The first chapter established that the direct fiscal cost to the UK of EU membership now runs at about 1% of GDP. 27 This chapter has discussed the costs of regulation from several angles, with comments on both broad-brush estimates of the costs in the round, and then a survey of four areas where EU regulation is well-known and perhaps notorious. Curiously, the broad-brush estimates were often from sources that were supportive of EU integration. Never-theless, they arrived at numbers for the total cost of EU regulation that were appreciably higher than the direct fiscal cost to the UK of its EU membership. That verdict is confirmed by the survey of more specific effects, which is condensed in the box above. A summary is that the 120,000 pages of EU legislative enactments in the acquis have effects, negative, de-structive and deleterious, on output and employment, which in total have a cost to the UK somewhere in the vicinity of 5% to 6% of national output. (Note that the discussion in the current chapter is far from being exhaustive. The 2012 edition of this publication also
Advanced economiesEurozone
1
3
5
-1
-3
-5
1992 1994 1996 1998 2000 2002 2004 2006 2008 2010 2012 2014 2016 2018
The cost of EU regulation% annual output changes, actual until 2012 and IMF forecast thereafter
2013
In the 20 years of ‘the Single market’since 1992 Eurozone growth was 1/2% - 3/4% a year slower than in the advanced economies as a whole. The IMF expects the gap to widen in the next few years.

How much does the European Union cost Britain?26
mentioned the 1999 Landfill Directive [costed at £1.1 billion a year by local government sources] and the 2009 Data Retention Directive [which requires telecom-munications companies to keep immense amount of customers’ internet data, at much cost to them, possibly for later police and national security use].) 28
The number has undoubtedly been rising over time and must have acted to retard economic growth. The box above suggests that the retardation amounts to be-tween ½% and 1% a year, and that it continues. It must be emphasized that the acquis applies all over the EU and is therefore holding back all its members, not just the UK. Is there any rigorous method of demonstrating that EU regulation is doing great economic harm to all the member states? One approach is to compare the growth rates of national output in EU member states with those in other advanced economies. The chart on page 25 uses data from the International Monetary Fund, and compares growth rates in the Eurozone with those in ‘the advanced economies’ as a whole from the start of the Single Market in 1992. The Eurozone is chosen rather than the EU as a whole, because the UK and much of Eastern Europe do not belong to the Eurozone, and for part of the period since 1992 either resisted major elements in the acquis or were not member states at all. At any rate, the message is unambiguous. In the 20 years from 1992 the average growth rate in the Eurozone was 0.6% lower than in the advanced economies as a whole. Given that the Eurozone had a big weight in advanced-economy output in these years, the Eurozone typically saw output growth between ½% and 1% a year lower than in other advanced economies in this 20-year period. Moreover, the IMF plainly expects the gap to widen in the next few years. The conjecture made above – that excessive regulation is responsible for weak or negligible growth in EU member states – is certainly not disproved by this evidence.
If the EU is taken out of the picture, the advanced-
economy world consists of the USA, Japan and a bit more than a dozen countries (or ‘semi-countries’ like Hong Kong) scattered across the globe. These countries include the two non-EU European nations (to recall, Switzerland and Norway), some EU nations that do not use the euro (the Czech and Slovak Republics, and Slovenia), Israel, Iceland, three Asian societies (South Korea, Taiwan and Hong Kong), and the wealthiest members of the Commonwealth (Canada, Australia, New Zealand and Singapore). Table 2.4 below compares the gap in output growth between the Eurozone on the one hand, and the advanced world as a whole and the ‘other advanced economies’, which is this group of more than a dozen countries. The ‘other advanced economies’ are interesting, because in most of them English is the language of business and the governments are free to organize regulatory frame- works in their own national interest. (They have to respect international agreements, if they subscribe to them, but they can interpret such agreements in response to local pressures and needs.) As Table 2.4 shows, the growth gap between the Eurozone and these ‘other advanced economies’ has been and remains conspicuously wide (i.e., about 2% a year). Again, the numbers argue that the EU suffers from a major handicap of some kind. The obvious such handicap is the regulatory burden implied by the acquis communautaire.
Britain has no need to suffer the regulatory burden
The argument of this chapter may seem unduly alarm-ist, even over-cooked. The cost of the EU regulatory apparatus to the UK is an extraordinary 5% - 6% of GDP, and a similarly-sized burden must hurt all EU countries. And how can such a large group of nations – nations that belong to the continent which pioneered scientific rationality and industrial civilization – be so foolish as to accede to regulations that destroy jobs and prosperity?
Table 2.4 The Eurozone’s growth shortfall in the advanced world The table below shows the average annual shortfall of the % output growth of the Eurozone compared with the % output growth in the advanced world as a whole and the ‘other advanced economies’. For the meaning of the ‘other advanced economies’, see the text. Eurozone compared with
Advanced Other economies advanced as a whole economies
Decade from 1992 0.7 2.1
Decade from 2002 0.5 2.4
Seven years to 2018 (IMF estimates) 1.2 2.2
Source: IMF and author’s calculations.
27How much does the European Union cost Britain?
Is this not madness on a gigantic scale? Further, if excessive regulation is impoverishing Europe by 5% or GDP or perhaps even more, why are nations on the European fringe still keen to join the EU? The answer – as in so much that conditions modern public policy in European nations – is to be sought in history.
It has to be recalled that in the 20th century Europe was the main theatre of two horrific world wars, with the principal European landed power – Germany – the loser on both occasions. Although Germany made a good recovery from the Second World War before the main EU institutions had emerged, Germany’s guilt and its people’s desire for geopolitical reinstatement have been the main motivating forces behind European integration. (Does one have to point out that they pay the bills?) But the citizens of Germany are not alone in wanting a European continent that is stable and peace-ful. For example, the Baltic republics were for a few decades rubbed off the map of Europe after the Soviet Union invaded them in 1940 to carry out the secret protocol of the 1939 Molotov-Ribbentrop pact. They were tiny nations with modest populations, but over 30,000 Latvians, 35,000 Lithuanians and 60,000 Estoni-ans were summarily deported and often killed by the Russian invaders.29
In much of Europe – and particularly in small, fragile nations such as the Baltic republics – the stability and prosperity of the last few decades are attributed to the ‘European construction’, meaning the EEC from 1957 and the EU from 1993. Both Germany and the smaller nations, and to a degree all the member states of the EU, have been prepared to invest in the process of integration, and to overlook its flaws and costs. They see European integration as a stage-like and inevitable historical progress in which they must participate.30
But Europe’s past is littered with the debris of utopian historicist doctrines. The overburdening of the economy by excessive regulation is – in other words – another example of how the doctrine that ‘the ends justify the means’ is leading to a major disaster for European civilization.31
The puzzle here is why the citizens of the UK, or at any rate so many influential members of its policy-making elite, feel that their country must be involved. Its own history and traditions are very different from those of the continental European nations; it has no need to apologize for its past, to invest in European integration or to feel particularly vulnerable to renewed geopolitical trauma in its neighbours. As it happens, the dysfunc-tional characteristics of EU integration, and especially of the attempt at economic and monetary union that pivots on the introduction of the single currency, have now themselves become a potential cause of tension and upheaval. The UK has no need to suffer from the enormous burden of the 120,000 pages of directives and regulations that constitute the acquis. We do not have to lose 5% or so of our GDP, with the toll rising over time, to participate in the great historical drama of ‘ever closer union’. On the contrary, the move ‘towards ever closer union’ is a process to which the overwhelming majority of our citizens are opposed.
The citizens of other European countries may be able to persuade themselves that a regulatory burden costing 5% - 6% of GDP is desirable and necessary for larger reasons of European ‘destiny’. But most people in Britain are not interested in this destiny, whatever it was, is or may become. We should not allow a foreign bureaucracy to squander a colossal chunk of our national output for a purpose that in fact we despise.
1 Rodney Leach Europe: a Concise Encyclopaedia (London: Profile Books, 2nd edition, 1998), p. 20. 2 Lord Denning Introduction to The European Court of Justice: Judges or Policy Makers? (London: Bruges Group, 1990).3 Danny Forston ‘Chemicals cry for help’, The Sunday Times, 6th February 2011.4 Kaveh Pourvand ‘Are our carbon-reduction targets self-defeating?’, in Ideas for Economic Growth (London: Civitas, 2012), p. 3. 5 David Campbell-Bannerman The Ultimate Plan B: a positive vision of an independent Britain outside the European Union (Cheltenham: The Freedom Association, 2011), p. 30. 6 For those who want further enlightenment, see a memo on ‘Indirect Land Use Change’ published by the European Commission on 17th October 2012.7 The Social Charter needs to be distinguished from the Social Chapter. Indeed, the European Social Charter began in 1961 not as an instrument of the EEC/EU, but of the separate Council of Europe. For further detail, the reader should look up the Wikipedia entries and/or such sources as Whitaker’s Almanack or The Statesman’s Yearbook. 8 John Major The Autobiography (London: HarperCollins, 1999), p. 282. 9 Press release of 29th September 2011 ‘New EU regulations on agency workers’ (London: Open Europe).10 In May 2012 the Beecroft Report was published, on the scope for liberalizing employment law. It showed that many of the current restrictions on employment have an EU aspect of one kind or another. 11 Stephen Booth, Mats Persson and Vincenzo Scarpetta Repatriating EU social policy (London: Open Europe, 2011). The quote in the next sentence comes from p. 2.12 Notice that Open Europe has estimated that the annual cost of EU regulation in total is about £20 billion, but it finds that the cost of EU employment legislation by itself might be almost £15 billion. Since there is little doubt that the cost to the UK of the EU’s renewables agenda is well above £5 billion, it appears to the author that Open Europe’s £20 billion estimate for the total cost of EU regulation is too low.

How much does the European Union cost Britain?28
13 Another way of thinking about the problem is to suggest that the level of ‘the natural rate of unemployment’, the rate of unemployment at which inflation is stable, depends partly on the character and intensity of labour market regulation. The more onerous is regulation, the higher in the natural rate of unemployment and the lower (on a continuous basis) is the level of output consistent with stable inflation. The author’s surmise is that, when economists calculate ‘the natural rate of unemployment’ (or ‘the equilibrium rate of unemployment’, to use the terminology chosen in Richard Layard, Stephen Nickell and Richard Jackman Unemployment: Macroeconomic performance and the labour market 2nd edition [Oxford: Oxford University Press, 2005]) in the UK over the relevant period (i.e., the period from 1997 to today), they will find that the natural rate has risen by 2% or so. To the extent that the natural rate of unemployment has risen because of EU regulation, the EU is to blame for a permanent loss of UK output. 14 An example is the EU’s demand that women occupy 40% of the positions on company boards. On 27th July 2013 Helena Morissey, chief executive of Newton Investment Management and a strong supporter of female representation on boards, had an article in The Sunday Telegraph in which she said that she was opposed to making female participation mandatory in the EU fashion. She concluded, ‘I am certainly not a backward-looking “little Englander”. On the contrary, I have great confidence that Britain and the British people could thrive outside the EU.’ 15 The quotation is from an article by Alex Barker on Barnier in the Financial Times on 8th November 2011. 16 Wolfgang Munchau ‘The bonus issue is the first shot in a long battle’, Financial Times, 4th March 2013. 17 Implementing enhanced cooperation in the area of the Financial Transaction Tax (Brussels: European Commission, 2013), slide 20 of the Powerpoint presentation.18 Norman Lamont ‘A cap on bankers’ bonuses would be lunacy’, The Daily Telegraph¸ 26th February 2013. 19 Alistair Gray ‘Lloyd’s chief airs Solvency II frustration’, Financial Times, 27th March 2013.20 Alistair Gray ‘Lloyd’s insurer off to Bermuda’, Financial Times, 26th April 2013.21 Assume that the value added in the export of UK financial services is £57.5 billion, that growth of 15% a year has been prevented by EU regulation and that on average resources in these activities are 25% more efficient than in their nearest alternative use, i.e., that the nearest alternative use of the resources is 80% as efficient as the City of London. Then the loss in the first year is (£57.5 billion x 15% x 20%, which is £1.7 billion. Assume that the figure rises year by year, because of the end of growth. Let us restrict the calculation to a period of only a decade, because the world is full of uncertainty and let us discount the ten years of losses at an annual rate of 10%. Then the capitalized value of the loss is £58.1 billion. For more on the EU threat to the City of London, see Tim Congdon The City of London under Threat: the EU and its attack on Britain’s most successful industry (London: Bruges Group, 2009). 22 Alliance for Natural Health ‘EU herbal medicines legislation fails again’, website article, 10th July 2013.23 Hayley Dixon ‘EU rules force mother’s Milk of Magnesia off the shelves’, The Daily Telegraph, 30th June 2013.24 In early 2013 the EU banned a range of neonicotinoids, which are present in many insecticides, on the grounds that they threatened bee populations. The science behind the EU’s claim is widely regarded as unproven. On rodenticides, see, for example, ‘Where now for rodenticides in the EU?’ Pest Magazine, 8th June 2010. 25 Christopher Booker and Richard North The Great Deception: a Secret History of the European Union (London: Continuum, 2003), pp. 291 – 2. 26 Daniel Grant ‘Droit de suite debate hots up’, ARTnews, 1st November 2012. 27 To recall, the concept under consideration is the total of payments made by the British government and private sector to EU institutions, and over which we in the UK have no subsequent control.28 On the cost of EU regulation for the UK water industry, see – for example – Christopher Booker ‘Keeping us short of water is now government – and EU – policy’, The Sunday Telegraph, 13th May 2012. 29 Wikipedia is the source of these numbers.30 The historicist inspiration of the EU project was examined in my 2011 Goldsmith Lecture, which is available for the author from [email protected]. See, particularly, pp. 6 – 11 of Tim Congdon The handover of Great Britain (London: Centre for Democracy and Independence, 2011), available from the author at [email protected] This may sound pompous. It is a reference to Isaiah Berlin’s essay on Alexander Herzen, which influenced Tom Stoppard’s 2002 trilogy The Coast of Utopia. ‘The fundamental thesis [in Herzen’s work]…is the terrible power over human lives of ideological abstractions.’ Isaiah Berlin Russian Thinkers (London: Hogarth Press, 1978), p. 193.

29How much does the European Union cost Britain?
Nations have a finite quantity of resources. According to one influential tradition of economic thought, the economic problem is to allocate these resources in the best way between different branches of production in order to deliver the greatest benefit to consumers. In the words of Lionel Robbins’ 1932 Essay on the Nature and Significance of Economic Science, economics could be defined as ‘the science which studies human behaviour as a relationship between ends and scarce means which have alternative uses’.1 In a celebrated discussion in book IV of The Wealth of Nations Adam Smith had illustrated the practical implication of Robbins’ definition over 150 years earlier.2
Even in the late 18th century Scotland had the technological capacity to make wine. To recall a famous passage in The Wealth of Nations, ‘By means of glasses, hotbeds and hot walls, very good grapes can be raised in Scotland, and very good wine too can be made of them.’ Would it not then be reasonable ‘to prohibit the importation of all foreign wines to encourage the making of claret and burgundy in Scotland?’. Obviously not, as the outcome would be leave society in a worse- off situation or, in economists’ jargon, with ‘a sub- optimal allocation of resources’. The explanation is that Scotland’s resources are finite and the maximisation of wine output would lead to the loss of other kinds of production.
If all of Scotland’s available labour and capital had been committed in 1776 to the cultivation of grapes and the making of wine, there would have no scope for it to produce oats and barley, or linen and whisky. Smith conjectured that the cost of obtaining wine from glasses,hotbeds and hot walls might be about 30 times ‘the expense for which equally good [wines] can be brought from foreign countries’. The answer was for Scotland to allocate three units of resources to making whisky and to exchange whisky for wine, so that 97 units of resources could be allocated to other branches of production. Indeed, the great virtue of free trade is that – if people are allowed to specialize in particular activities as they see fit, and to choose goods and services without restriction – the economy tends to move towards an optimal allocation of resources. In economists’ jargon, the unfettered operation of market forces takes people and companies towards a situation in which marginal costs are in line with prices and prices correspond to marginal utility, and in which the sum of so-called ‘consumers’ and producers’ surpluses’ is maximised.3
The purported ‘four freedoms’ of the single market
The intellectual case for free trade is compelling. The official rhetoric of the EU does in fact pay homage to ‘freedom’ in the abstract. The EU’s internal market – also known as ‘the single market’ – is said to promote ‘four freedoms’, the freedom of movement of goods, capital, services and people, between the member
states. To its credit, the EEC/EU has also participated in the global trend towards trade liberalisation over the last 50 years. That has meant that the level of tariffs is now very low, and trade between EU member states and countries outside Europe is a high multiple of its volume in the late 1950s.
However, the pursuit of the four freedoms in the EU’s internal market has not altogether precluded restrictions on trade with the rest of the world. To its discredit, the EEC/EU has obstructed the liberalisa-tion of international trade in two major respects. First, agricultural protectionism in the form of the Common Agricultural Policy has been a central feature of ‘the European construction’ since the early 1960s. Secondly, from its early days the EEC/EU has acted as a customs union, with a common external tariff against imports from the rest of the world. More seriously, the common external tariff has sometimes been supplemented by outright protectionism, usually justified on the grounds that foreign products from non-EU countries are being ‘dumped’ on the European market. Both the CAP and anti-dumping measures have led to resource misalloca-tion. This resource misallocation has made the citizens of EU member states – including the UK – poorer than they otherwise would have been. The extent of the resource misallocation therefore needs to be measured and incorporated in any cost-benefit assessment of EU membership. The CAP is discussed first, because from the outset – even in the 1960s – it was regarded in the British debate as a major negative of EU membership. Indeed, the CAP has always been an embarrassment to British Europhiles, and the British government has put constant pressure on other EU governments to wind down and limit the CAP. One perhaps surprising mes-sage of this chapter will be that nowadays resource misallocation due to more general EU protectionism has a much higher cost to the UK than resource misal-location due to the CAP.
The costs of the Common Agricultural Policy
The UK can obtain its food in two ways. It can produce the food itself, or it can make non-food products and sell them to other countries in exchange for food. The relative efficiency of the two methods depends on the quantity of resources needed, allowing of course for transport costs, which ought inherently to favour UK production. The optimal approach may be for the UK to use its resources of land, labour and capital to produce manufactured goods and services, to sell some of these goods and services to other countries, and to import food at world prices. That makes particular sense if the world price of food is lower than the UK production cost. There is nothing inevitably beneficial or advantageous to our country in trying to accom-plish 100% self-sufficiency in food supply.4 (The argu-ment here is just the same as in Adam Smith’s parable about the making of wine in 18th century Scotland. It would have been wrong, economically sub-optimal, for
3. The costs of resource misallocation

How much does the European Union cost Britain?8 How much does the European Union cost Britain?30
Scotland to aim for 100% self-sufficiency in wine; it would also be wrong, economically sub-optimal, for the UK today to aim for 100% self-sufficiency in food. To concentrate resources on food production would be misguided, even if the craziness of 100% food self-sufficiency for modern Britain is less obvious than the craziness of 100% wine self-sufficiency in 18th century Scotland.)
Unfortunately, self-sufficiency in food is a nice sound-bite in contemporary European politics. The origins of the CAP are to be sought – as with so much of the EU’s institutional framework – in history, particularly in the post-war context of large parts of continental Europe. Difficult though it may be to imagine nowadays, most of the current EU membership suffered severe food short-ages in the closing phase of the Second World War and its immediate aftermath. With calorie intake per person lower than in the 1930s, the diversity and quality of food in the shops was sharply reduced, and rationing was extensive. Europe was for some years dependent on American food supplies and goodwill. Memories of this period survive to this day. In evidence to the House of Lords European Union Committee, for its 7th report of the 2007/8 session, Yves Madre of the French Permanent Representation to the EU said that the CAP was intended to secure ‘food independence’ for Europe. The French government’s view was that ‘food is a political tool and if you have a shortage of food you will be weak’.5
The French attitude is that the political security of food supply should sometimes take precedence over the efficient allocation of resources. The CAP has therefore from its start in 1962 caused the cost of food in the EU to be higher than would otherwise be the case. In par-ticular, it is higher than it would be if imports were un-restricted, if European production were not artificially subsidized and if European households could buy food at the world price. Estimates of the size of the loss to the UK have varied over the years. The Organization of Economic Cooperation and Development is said to have estimated in 1993 that, in one way or another, the CAP was adding £1,000 a year, or £20 a week, to the food bill of the average UK family.6 At the time the average annual personal disposable income per head was £7,909, while the average household with more than one breadwinner would have had to cope on an after-tax income of under £20,000.7 Indeed, £1,000 per household implied a cost to the UK of over 4% of gross domestic product. In qualification, it needs to be remembered that this figure included both the government transfer to the EU to cover the UK’s share of the fiscal cost of the CAP and the loss to the UK from the misallocation of resources to agriculture. The figure nevertheless looks implausibly high, since the farm sector – then and now – does not represent anywhere near 5% of the UK’s value added (i.e., its output). If the total value of farm output is not as much as 5% of national output, how can a distortion in resource allocation amount to that kind of number?
A more up-to-date analysis has been provided by Open
Europe, confirming its reputation as a key source of authoritative and interesting research on the EU. In a briefing note on a report of 27th February 2012, under the title More for Less: Making the EU’s farm policy work for growth and the environment, it made the following comment
The cost to consumers and taxpayers across Europe of the EU’s farm subsidies and tariffs now stands at €86.9bn – of this €52.5bn stems from CAP subsidies. If, hypothetically, the CAP and other EU measures to protect farming, such as tariffs, were fully liberalised and the money freed up were re-channelled to more productive areas of the economy, it could be worth a boost in output equivalent to €139bn or 1.1% of EU GDP. Britain would experience a boost in output of €14.2bn or the equivalent of 135,000 full-time and part-time jobs.8
This sort of number – 1.1% of GDP – is far more sensible than the 4% of GDP suggested almost 20 years ago. In its February 2012 exercise Open Europe again worked with an analysis from the OECD. Total support to farmers and others in the food supply chain in the EU was estimated by the OECD to have been €105 billion, of which €27.2 billion came from national programmes.
The remaining €77.8 billion represented the cost of the CAP for the EU as a whole, with a €8.27 billion share attributable to the UK by itself. That €8.27 billion in turn reflected both the direct fiscal cost to the UK of the CAP and the cost of resource misallocation with which we are more specifically concerned in this chapter. In the first chapter it was shown that the direct fiscal cost of EU membership to the UK has risen since 2008, while allowance has also to be made for movements in ex- change rates and prices. With some other adjustments, that could take the total cost to the UK of the CAP today towards Open Europe’s figure of 1.1% of GDP, which is in fact over £16 billion. The proportion of this that might be blamed on the EU’s tariffs on imported food and other CAP protectionism depends on the assumptions made, but 50% seems generally considered to be reasonable.9 (See also pp 44-45 on the waste attributable to the CAP.)
The cost to the UK of the resource misallocation inher-ent in the CAP then emerges as about ½% of GDP or about £7½ billion a year. The point ought already to be clear, but it needs to be emphasized that the cost of resource misallocation is additional to the direct fiscal cost of the EU’s agricultural subsidies.
The costs of trade distortion overall
This loss of ½% of GDP arises partly because the UK devotes too high a proportion of its scarce resources to producing food, when it ought to be allocating those resources to exports (i.e., exports of manufactured goods and services) and using those exports to pay for

9How much does the European Union cost Britain? 31How much does the European Union cost Britain?
cheaper food imports.10 But it is also due to another distortion. UK consumers and food manufacturers take decisions, given the UK’s position as an EU member, to buy their food from other EU nations at a higher price than the world market price. These decisions are taken only because their choices are distorted by the EU’s tariff regime, which raises the cost to them of food from the rest of the world. The typical tariffs on food imports into the EU are in the 18% - 28% range, although also deserving of mention are a range of non-tariff barriers. These barriers include often bogus obstacles to imports on the grounds that they do not meet EU health or nutritional standards, and are enforced with bureau-cratic unpredictability and arbitrariness.
However, in the EU tariffs and barriers apply not just to agricultural products, but also across a wide range of goods. Tariffs are much lower now than in the 1950s, because of the almost continuous move towards glo-bal trade liberalization that has characterised the post- war era. As a broad generalization, the EU’s common external tariff on manufactured goods from other developed countries has dropped to an average of about 3% and from developing countries to an average of about 5%. It has also to be said that the EU has nego- tiated free trade agreements with non-EU countries, notably Mexico and Israel. (The significance of these agreements for the UK’s own EU membership is con- siderable, as to be discussed in chapter 7.) However, the EU does enforce an assortment of non-tariff bar-riers to trade with the rest of the world. These are plainly important and, like protectionism under the CAP, cause large-scale resource misallocation.
How high is the true level of protection, when allowance is made for non-tariff barriers? And how much resource misallocation then follows? The answers to these ques-tions are difficult, far more difficult than those arising from the measurement of direct fiscal costs. Much depends on the conceptual framework adopted, and the interpretation placed on particular facts and statis- tics. The main source for the estimates provided in the current chapter is a 2005 book Should Britain Leave the EU? by Patrick Minford, Vidya Mahambare and Eric Nowell. It was published by the Institute of Economic
Affairs and is called ‘the Minford 2005 study’ in the next few paragraphs.11 The study was a remarkably ambitious attempt to draw lessons from a so-called ‘general equilibrium model’ in which resources can move between four of the economy’s sectors, agriculture, basic manufacturing, high-tech manufacturing and services. It was therefore deliberately intended to measure the costs of resource misallocation, as that notion was explained and understood a few paragraphs ago. More technically, it was intended to show how protectionism caused land, labour and capital to be put to work in ways and in places that reduced the sum of consumers’ and producers’ surpluses relative to a free-trade situation.
The study borrowed from a 2003 paper from the Washington-based Institute for International Economics, by Scott Bradford, on ‘Paying the price for final goods protection in OECD countries’ for the specialist journal, Review of Economics and Statistics.12 According to Bradford, the true levels of tariff-equivalent protection implied by the EU’s trade policy towards the rest of the world were much higher than signposted by the ‘head-line’ tariff rates in the low single digits per cent (i.e., of 3%, 5% and so on mentioned above). His assessment was that the EU’s tariff-equivalent rate of protection for imports of basic manufactured goods was 16% and for imports of high-tech manufactured goods no less than 58%.13 The Minford 2005 study incorporated the Bradford assessment in its own calculations of the resource cost of EU protectionism for the UK’s manu-factured sector. By contrast, for the services sector (in which the UK is generally regarded as highly efficient by international standards, but the rest of the EU is not) the Minford 2005 study judged that the protection level for the UK was ‘effectively nil’.14
The discussion in the Minford 2005 study was com-plex and not easy to summarize. The analysis was of both the UK’s withdrawal from the EU and its unilat-eral adoption of free trade, and of the EU’s move to free trade with the UK remaining a member. In both instances significant welfare gains were delivered. Obviously, our interest here is in the case where the UK leaves the EU and the EU’s own trading arrange-
Table 3.1: Gains from better resource allocation if the UK leaves the EU
Table shows gains/losses, as % of GDP from improved resource allocation on (mostly), if the UK leaves the EU and unilaterally adopts free trade.
Gain/loss as % of GDP
To the UK To the rest of the EU
Agriculture + 0.3 - 0.06Basic manufacturing + 1.4 - 0.06High-tech manufacturing + 1.6 - 0.1Traded services - -
Total + 3.3 - 0.22
Source:Main, Mitford and Nowell, 2009 working paper, see text.

How much does the European Union cost Britain?32
ments remain much as now.15 The Minford 2005 view was that departure from the EU (leading to a fall in the effective rate of import protection to zero, from 16% for basic manufactured goods and 58% for high-tech manufactured goods) would lead for the UK by itself to resource allocation gains of 1.4% of GDP in the basic manufacturing area and 1.6% of GDP in the high-tech manufacturing area. The rest of the EU would lose very slightly, as UK trade would be diverted towards the rest of the world and less import tariff revenue would be collected. The table above – taken from the Minford 2005 study – sets out the main points.16 The cost to the UK of resource misallocation due to EU trade policy was put at over 3% of GDP. Given that no large changes to the EU’s international trade regime have occurred since 2005, that still seems a reasonable benchmark for thinking about the subject today.17
Examples of EU protectionism
This number – over 3% of GDP – may seem large, perhaps surprisingly large. But an obtrusive fact about the modern world is the markedly higher standard of living in genuine free-trade jurisdictions (such as Hong Kong and Singapore) than in neighbouring societies, and the spectacular advances in living standards that have accompanied unilateral trade liberalizations. (The Chinese trade liberalization since the late 1970s is the most salient example, but there are many others.) When the UK joined the EEC in 1973 the increased cost of food, and the resulting damage to the efficiency of UK resource allocation and British farming, were identified as major drawbacks of accession. They were indeed major drawbacks, but it has to be conceded that – as the farm sector has shrunk in relative importance – so also has the significance of the trade distortions arising from the CAP.
But that does not mean that all is well. The UK’s interests, in food manufacturing as well as agriculture, remain vulnerable to mischievous regulatory decisions from the European Commission. The 2012 edition of this publication discussed a particularly alarming illustration, the closure threat to Tate & Lyle Sugars refinery on the Thames. That closure threat stemmed from the EU proposal that sugar beet quotas would be eliminated by October 2015, while sugar cane imports would stay heavily restricted. The subtext here was that several EU countries, including Germany and France, are producers of sugar beet, whereas sugar cane is imported from the tropics. The understood effect of the proposal was to favour farmers (that is, German and French farmers) producing sugar beet, while companies refining imported cane sugar would be penalized. At the time of writing (August 2013) newspaper reports are that sugar beet quotas are likely to stay in place until 2017 or even 2020, but that the matter is contentious and unresolved. As explained in the 2012 edition of How much does the European Union cost Britain?, the EU’s approach – clearly the result of the Franco-German entente in the EU – was and remains
an affront to economic efficiency, since cane-based sugar refining is undoubtedly the lowest cost method of providing sugar to the European market.
The last year has seen several other examples of EU decisions that flout basic principles of good trade policy, although it is interesting that trade partners in other continents have sometimes retaliated and forced a rethink. Both China and the EU are large producers of solar panels, a means of converting sunlight into elec-tricity. But in the last few years China has successfully reduced the cost of production, so that its companies have been able to undercut European rivals and gain market share. By spring 2013 the European solar panel industry was heavily loss-making. The European Commission decided to slap tariffs, possibly of almost 70%, on imports of the panels from China. The Chinese government quickly made clear that this was unaccept-able. On a visit to Berlin in May the newly-appointed premier, Li Keqiang, said that China would retaliate with new tariffs on imports of luxury cars from the EU unless the proposed EU solar panel tariffs were withdrawn. The German government then discussed the issue with the Commission, which had to backtrack. The outcome seems to have been an agreement on a minimum price for China’s solar panels in the EU, which is plainly anti-competitive but does mean that the EU solar panel industry can survive for a few more years.18
But in another case an EU move towards protectionism was put into effect, despite the UK government’s strong disapproval. Historically, China was of course a huge exporter of pottery items to Europe, a phenomenon recognised in the use of the word ‘china’ to denote them. In the last 40 years of the Chinese economic transformation, it has again become a huge exporter of plates, cups, saucers and so on, in a phrase of ‘china from China’. Again, European producers have had difficulty meeting the competitive threat. At the end of 2012 the European Commission imposed a duty of almost 60% on the wholesale price of ceramics imported into the EU from China. Ironically, the British company, Portmeirion, has over half its crockery products made in China. So, in order to meet demand from its European customers, it had to pay the duty, and accept lower (net-of-tariff) prices and profits. In a results announce-ment on 2nd August 2013 it noted that profits had fallen almost 40% compared with the same period in 2012, ‘largely due to an anti-dumping levy on Chinese ceramic imports’.19
Summary: resource misallocation costs over 3% of GDP
Resource misallocation is less obvious than a direct fiscal payment. It does not appear on a bank statement or in a standard set of accounts. Nevertheless, the cost of resource misallocation is as definite as the cost of a tax payment or a fiscal transfer. In an economy closed to international trade consumers and producers are worse-off relative to a free-trade situation. (Suppose

33How much does the European Union cost Britain?
that Somerset were cut off from trade with the rest of the world. Even if Somerset had access to every modern technology, it would be massively worse-off because it would have to stop specializing, and instead [try to] produce the very wide range of products it currently imports from the rest of the UK and the world’s other nations.)
The EU is undoubtedly a protectionist organization to some extent, most conspicuously because of the CAP but also because of restrictions on manufactured imports. The UK would be better-off in a free-trade situation than it is today as a participant in EU protec-tionism. An estimate of the degree of resource misal-location is therefore an essential part of any wider appraisal of the cost of the EU. The Minford 2005 study provided such an estimate in a sophisticated analytical framework. The answer is that resource misallocation due to EU protectionism causes a loss to the UK of
over 3% of its GDP.20 A later analysis reached a similar conclusion, suggesting that continued protectionism reflected the interests of ‘European elites’ and express-ing concern that little change is to be expected with existing EU arrangements. ‘At best the EU seems condemned to suffer poor policies for a long time to come, with reforms arriving glacially if at all.’21 If supporters of European integration want to dispute the Minford estimates, they are of course free to do so. But they too must employ an equally rigorous analytical model which conforms to the recognised theoretical principles in this branch of economics. Brussels bureau-crats may give bland reassurances that trade policy is developed in order to serve the interests of the EU as a whole. The disgraceful treatment of Tate & Lyle Sugars’ refinery on the Thames, as well as the EU’s ad hoc protectionism in the solar panels dispute and Chinese ceramics, shows that such reassurances are not to be trusted.
1 Lionel Robbins An Essay on the Nature and Significance of Economic Science (London: Macmillan, 1932), p. 16. 2 R. H. Campbell and A. S. Skinner (eds.), of Adam Smith An Enquiry into the Nature and Causes of the Wealth of Nations (Oxford: Clarendon Press, 1976, originally published in 1776), p. 458. 3 This proposition is generally known as ‘the first fundamental theorem of welfare economics’, and is basic to the defence of free markets and competition. Its mathematical proof, usually attributed to Kenneth Arrow and Gerard Debreu, is complex. Because a number of potentially unrealistic assumptions have to be made to derive the proof in its full rigour, the theorem is controversial. Nevertheless, it provides a benchmark for thinking about the problem of resource allocation. 4 Yet somehow this silly idea still receives a hearing in the British public debate and is pushed by the National Farmers Union. See a story in The Daily Telegraph of 14th August 2013 on ‘British-produced food would run out today’. 5 House of Lords European Union Committee, 7th report of the 2007/8 session, The Future of the Common Agricultural Policy, vol.1: Report, HL paper 54-I (London: The Stationery Office, 2008), p. 17. 6 The attribution of this estimate to the OECD was made by Christopher Booker and Richard North in their book The Mad Officials (London: Constable, 1994). 7 Economic Trends (London: The Stationery Office, 1997), July 1997 issue, p. T6.8 Christopher Howarth, Anna Kullmann and Pawel Swidlicki More for Less: Making the EU’s farm policy work for growth and the environment (London: Open Europe, 2012). 9 In More for Less, Howarth, Kullmann and Swidlicki suggested that – of their estimated €8.27 billion total cost in 2008 - €4.6 billion was ‘for taxpayers’ (i.e., it was the direct fiscal cost) and €3.67 billion was ‘for consumers’ (i.e., it reflected resource misallocation), implying a resource misallocation proportion of 44%. I have raised the proportion slightly, because Howarth, Kullmann and Swidlicki seem to have over-estimated the CAP element in the UK’s gross contribution to the EU budget. For many years the EU’s regional development budget has been growing relative to the agricultural support budget. They conceded that it ‘is impossible to trace exactly where the consumer transfers come from’, while observing that ‘nearly all result from CAP-related intervention in EU agricultural markets’. Howarth, Kullmann and Swidlicki More for Less, p. 17. 10 Similarly, in every EU member state the CAP causes more resources to be allocated to farming than would be true in a free-trade situation. As is well-known, by the early 1990s the resulting over-production led to the notorious ‘wine lakes’ and ‘butter mountains’, with the surplus products then being dumped on world markets at prices not only less than the cost of production, but even lower than the world price that had earlier prevailed. The over-production was tackled in a series of reforms (the 1992 MacSharry reforms, the 2003 Fischler reforms), so that EU subsidies were no longer related to production. However, the economic rationale of subsidization then became even less obvious, with money sometimes being to farmers for setting aside their land from production altogether! Farmers of course have to justify receiving the money by filling up a large number of forms. ‘Detested by farmers for the paperwork it begets, and by free-marketeers for its self-contradictions, set-aside is a CAP measure, introduced in 1988, for cutting production by compensating farmers for taking part of their land

How much does the European Union cost Britain?34
out of cultivation.’(Rodney Leach Europe: a Concise Encyclopaedia [London: Profile Books, 3rd edition, 2000), p. 211.) 11 Patrick Minford, Vidya Mahambare and Eric Nowell Should Britain Leave the EU? (London: Institute of Economic Affairs, 2005). 12 Scott C. Bradford ‘Paying the price for final goods protection in OECD countries’, Review of Economics and Statistics (Boston, USA: MIT Press, 2003), vol. 85, issue no. 1, pp. 24 – 37.13 The Bradford study was not wildly out-of-line with studies from other researchers. Messerlin calculated in a 2001 paper that the average tariff-equivalent extra-EU trade barrier across both agriculture and industry was 12% in 2000, down from 14% in 1990, but still much higher than the published average tariff rate. Another paper in the following year by Bouet suggested that the average tariff-equivalent rate in 1999 was 9%. See Patrick A. Messerlin, Measuring the Costs of Protection in Europe: European Commercial Policy in the 2000s (Washington: Peterson Institute Press, 2001), number 102, and Antoine Bouet ‘Protection, discrimination et distorsion en Europe’, Economie Internationale (Elsevier for the CEPII institute in Paris: Amsterdam), 2002, vol. 90, no. 1, papers from Forum on Trade Policy. For a wider review of EU trade policy, see Marius Brulhart and Alan Matthews ‘EU External Trade Policy’, pp. 921 – 67, in Ali M. El-Agraa (ed.) The European Union: Economics and Policies (Cambridge: Cambridge University Press, 2007), 8th edition. 14 Minford, Mahambare and Nowell Should Britain Leave the EU?, p. 178.15 The EU’s trade arrangements would of course not be exactly the same, because the UK would have left and a new EU/UK trade understanding would have to be reached.16 For more detailed discussion, see pp. 175 – 81 of Minford, Mahambare and Nowell Should Britain Leave the EU?, The study also considered, as a conjecture, a further case in which agricultural free trade was accompanied by the removal of planning restrictions on the use of farmland, so that all farmland became available for manufacturing and other uses. The verdict was that ‘the gain to welfare to the UK is dramatically larger at 29%’ of GDP. The study cautioned that, ‘One may legitimately have doubts about the political feasibility of this solution which is why we do not use it as our central estimate.’ (Minford, Mahambare and Nowell Should Britain Leave the EU?, p. 184.) 17 The results of the Minford 2005 study are comparable with other analyses in this area. According to the Brulhart and Matthews’ paper mentioned in footnote 14 above, Messerlin went on from his estimate of the tariff-equivalent rate of protection to suggest that the cost of EU protectionism for the EU as a whole was ‘around 7% of GDP’, while Bouet arrived at a number – also for the EU as a whole – of 2.5% of GDP. The whole subject is technical and controversial. Nevertheless, it is clear the EU remains protectionist to a significant degree. That means all its member states, including the UK, have lower living standards than justified by their resource endowment and technological capability. 18 ‘EU and China reach deal in solar panel dispute’, BBC News website, 27th July 2013. 19 Szu Ping Chan ‘Portmeirion blames EU levies after dent to profits’, The Daily Telegraph, 2nd August 2013. 20 Strictly, the Minford 2005 study calculated the resource misallocation cost, plus a ‘transfer effect’ where one EU member pays to another EU member more than the world price for a good or service because of the customs union, plus also an allowance for the impact of EU policy on the world prices of imports and exports (i.e., ‘a terms of trade effect’). 21 See Vo Phuong Mai, Patrick Minford and Eric Nowell ‘Economic policy: protectionism as an elite strategy’, Cardiff Business School Working Paper Series, no. E2009/1 (Cardiff: Cardiff Business School, 2009).

The first three chapters of this study have trodden relatively familiar ground in the debate on the UK’s membership of the EU. Right from the start of our membership in 1973 it was understood that the UK would be a net contributor to EEC/EU funds, and that the protectionist CAP would cause an increase in food prices and resource misallocation. By contrast, the topics surveyed in this chapter could not have been foreseen 40 years ago because, at that stage, hardly anyone envisaged large-scale inward migration from the rest of the EEC/EU. The subject is difficult and sensitive, because opposition to immigration is sometimes characterised as the result of prejudice, particularly prejudice against those of different race, religion and so on. Nevertheless, the notions of ‘a government’, ‘a nation’ and ‘public policy’ imply that a defined group of people (‘a nation’) exists for whom its government frames public policy to its benefit.1 The words ‘a government’, ‘a nation’ and ‘public policy’ would other- wise have no clear meaning. The group of people that constitutes ‘a nation’ cannot include anyone from any country of the world. To the extent that public policy allows people from other countries to reduce the nation’s welfare, something has gone wrong.
There can now be little doubt that in the last few years inward migration, particularly from Eastern Europe, has restricted the availability of jobs to some British people. That inward migration has been the direct result of the UK’s membership of the EU, while ‘the British people’ are to be understood here as people who are UK-born as well as enjoying British residence and citizenship.
Inward migration has therefore hurt the citizens of our country and been costly to us. Precise calculations of the costs are difficult and will not be attempted here.2 The subject is likely to become even more fraught in the next year or two, as its EU membership will oblige the UK to ‘open its doors’ to immigrants from Bulgaria and Romania on 1st January 2014. That will further undermine job security for people who regard them-selves as long-term British.
Blair opens UK labour market
The downfall of communism in the late 1980s and early 1990s was one of the most welcome developments in modern European history. It was welcome not least because it confirmed the superiority of the market economies of Western Europe, with their respect for the rule of law and private property, over the planned and largely state-owned economies of the former Soviet bloc. Once they were freed from Moscow’s clutches most of the countries in the former Soviet bloc wanted to join the EU. Various entry criteria were specified in the 1990s and these took a number of years to meet, but eight central and Eastern European countries (Czech Republic, Estonia, Hungary, Latvia, Lithuania, Poland, Slovakia, and Slovenia) were able to join the EU on 1st May 2004. This was the largest single enlarge-ment in terms of people, and number of countries, in the history of the EEC/EU.3
Income levels in the ‘EUA8’ (an abbreviation for the ‘EU accession eight’) were appreciably below those in
4. The cost of lost jobs
35How much does the European Union cost Britain?
United KingdomPolandRomaniaBulgaria
0
10,000
20,000
30,000
40,000
50,000
60,000
70,000
Income disparity between the UK and Eastern EuropeIncome per head in $s of the day, according to the IMF
2003 2004 2005 2006 2007 2008 2009 2010 2011 2012

How much does the European Union cost Britain?8 How much does the European Union cost Britain?36
Western Europe. (See the chart above. In 2004 the UK’s income per head, at over $36,000 in terms of current price $s, was more than five times higher than in Poland. In 2012 the UK’s income per head was still more than three times that in Poland, and about five times that in Bulgaria and Romania.) As noted in the previous chapter, the freedom of movement of people is one of the ‘four freedoms’ of the EU’s single market. But, if the EUA8 had been granted such freedom on their accession to the EU, the income disparities would almost certainly have led to large movements of workers to the richer EU member states. Most of the EU’s older member states introduced a seven-year transition period, in which they limited inward migration from the EUA8. The UK, led by prime minister Tony Blair, decided not to follow this course. Instead people would be free to move from the EUA8 to the UK as soon as the EUA8 belonged to the EU. From 1st May 2004, potentially millions of working-age people were free to move from the EUA8 to the UK (and indeed Ireland, since people can move freely between the UK and the Republic of Ireland). The British government expected only a modest influx of new workers. In practice immigration from the EU8 was on an extensive scale, with major effects on the UK labour market. Official data show that in spring 2004 64,000 people born in the EUA8 were employed in the UK, about double the level of five years earlier, but still
only 0.2% of total UK employment. Between March 2004 and the end of 2007, a period of relatively buoyant economic conditions and strong demand for labour, the number rose from 64,000 to 487,000. Within less than four years the importance of EUA8 workers had therefore increased so sharply that they accounted for 1.7% of total UK employment. The growth of employ-ment in this period for UK-born workers was only a little more than 100,000, a mere quarter of the surge of over 400,000 in employment of EUA8-born workers.
From late 2007 the UK economy’s performance deterio- rated markedly. The situation was not too bad in early 2008, but by late 2008 grave weaknesses in the inter-national banking system became evident, and a major downturn in demand and employment began. The worst phase of the ensuing Great Recession was in the opening months of 2009, when tens of thousands of jobs were disappearing every week. The labour market in the UK was then dominated by UK-born workers, as it still is today, although to a lesser extent. At the end of 2007 total employment was just under 29.5 million, split between UK-born of 25.9 million (87.7% of the total) and foreign-born of 3.6 million (12.3%). The foreign-born workers had generally been in their jobs for a shorter period than the UK-born, while in many cases they occupied temporary positions or had only a half-hearted commitment to the UK.4 A reasonable surmise might
Q1 Q2 Q3 Q4 Q1 Q2 Q3 Q4 Q1 Q2 Q3 Q4 Q1 Q2 Q3 Q4 Q1 Q2 Q3 Q4 Q1 Q2
0
200
400
600
800
-200
-400
-600
-800
-1000
UK bornForeign-born, but not from EU8 From EU8
Employment trends in the Great RecessionChart shows employment change, quarterly, in thousands from end - 2007 level
2013
2008 2009 2010 2011 2012 2013

9How much does the European Union cost Britain? 37How much does the European Union cost Britain?
UK - bornForeign-born excluding EUA10 EUA10
4
-6
14
24
34
44
54
2013
2008 Q1 2009 Q1 2010 Q1 2011 Q1 2012 Q1 2013 Q1
Employment trends in the Great RecessionChart shows % cumulative change, quarterly, from end - 2007 levels in UK - and foreign-born employment.EUA10 consists of the eight EU accession countries in 2004, plus Bulgaria and Romania.
have been that a fall in the demand for labour would cause higher job losses for the foreign-born than the UK-born. That surmise would, in the event, turn out to be completely wrong. In the Great Recession and the immediately subsequent years UK-born employment dropped heavily, whereas foreign-born employment rose and employment of people from the EUA8 climbed dramatically. The figures are set out in the chart below.
UK-born people did lose jobs
The fall in UK-born employment was concentrated in the year to mid-2009 and amounted to about 800,000 peo-ple, about 3% of the number of UK-born people in jobs at the end of 2007. After mid-2009 the number of UK-born people at work has fluctuated markedly from time to time, but the underlying trend has been for slight growth of about ¼% a year. In reality labour market conditions have remained tough. Many British people have left full-time employment, while part-time employment and self-employment have expanded. Youth unemployment has been high and rising. By contrast, foreign-born people have made continuing inroads into the UK job market. The chart on page 36 opposite relates to changes in the level of employment, in terms of thousands. It shows that, from the start of the Great Recession in 2008, employment of people born in the EUA8 has risen by about 200,000, while employment of people born in the rest of the world (i.e., in neither the UK nor the EUA8) has increased by about 600,000.
A small adjustment in presentation emphasizes the message. When the numbers are set out as % changes, the result is altogether more dramatic because the number of Eastern European people in Britain in late 2007 was still quite low. (The employment surge was from a small base.) Employment of EUA8-born people soared by 45% in the five years to end-2012. In short, in the Great Recession and its sequel the number of jobs occupied by the UK-born slumped by 800,000 in a year and then failed to recover to anywhere near the end-2007 level, whereas the number of jobs occupied by the EUA8-born increased by 200,000 or about 45%.
At any rate, the net inflow of workers from the EUA8 is now stabilizing, partly because East European workers have considered returning ‘home’ as incomes in their countries begin to catch up with UK levels. But that is far from being the end of the threat to British workers’ jobs. In the last few quarters a new development has been a sharp rise in employment of people of Bulgarian and Romanian birth, even though in principle the UK labour market is open to them freely only from the start of 2014. (For several years they have been able to come here as temporary workers.) Official data are now being made available for the number of people of Bulgarian and Romanian birth employed in the UK. The chart below shows the % changes in employment since the end of 2007 of the UK-born, those born in what one might term ‘the EUA10’ (i.e., the EUA8 plus Bulgaria and Romania) and those born in the rest of the world. The leap in the EUA10 category is obvious. Further, while
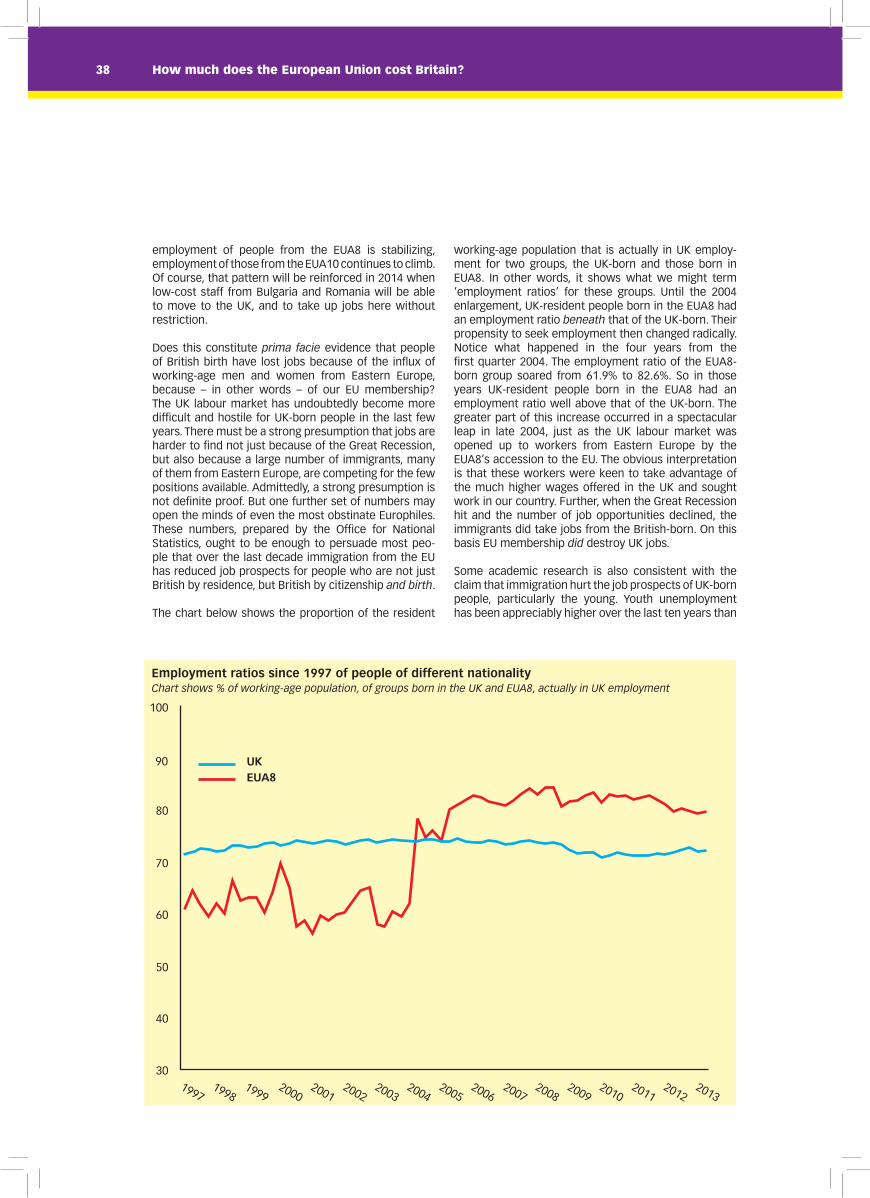
How much does the European Union cost Britain?8 How much does the European Union cost Britain?38
employment of people from the EUA8 is stabilizing, employment of those from the EUA10 continues to climb. Of course, that pattern will be reinforced in 2014 when low-cost staff from Bulgaria and Romania will be able to move to the UK, and to take up jobs here without restriction.
Does this constitute prima facie evidence that people of British birth have lost jobs because of the influx of working-age men and women from Eastern Europe, because – in other words – of our EU membership? The UK labour market has undoubtedly become more difficult and hostile for UK-born people in the last few years. There must be a strong presumption that jobs are harder to find not just because of the Great Recession, but also because a large number of immigrants, many of them from Eastern Europe, are competing for the few positions available. Admittedly, a strong presumption is not definite proof. But one further set of numbers may open the minds of even the most obstinate Europhiles. These numbers, prepared by the Office for National Statistics, ought to be enough to persuade most peo-ple that over the last decade immigration from the EU has reduced job prospects for people who are not just British by residence, but British by citizenship and birth.
The chart below shows the proportion of the resident
working-age population that is actually in UK employ-ment for two groups, the UK-born and those born in EUA8. In other words, it shows what we might term ‘employment ratios’ for these groups. Until the 2004 enlargement, UK-resident people born in the EUA8 had an employment ratio beneath that of the UK-born. Their propensity to seek employment then changed radically. Notice what happened in the four years from the first quarter 2004. The employment ratio of the EUA8-born group soared from 61.9% to 82.6%. So in those years UK-resident people born in the EUA8 had an employment ratio well above that of the UK-born. The greater part of this increase occurred in a spectacular leap in late 2004, just as the UK labour market was opened up to workers from Eastern Europe by the EUA8’s accession to the EU. The obvious interpretation is that these workers were keen to take advantage of the much higher wages offered in the UK and sought work in our country. Further, when the Great Recession hit and the number of job opportunities declined, the immigrants did take jobs from the British-born. On this basis EU membership did destroy UK jobs.
Some academic research is also consistent with the claim that immigration hurt the job prospects of UK-born people, particularly the young. Youth unemployment has been appreciably higher over the last ten years than
Employment ratios since 1997 of people of different nationalityChart shows % of working-age population, of groups born in the UK and EUA8, actually in UK employment
19971998
19992000
20012002
20032004
20052006
20072008
20092010
20112012
2013
UKEUA8
30
40
50
60
70
80
90
100

9How much does the European Union cost Britain? 39How much does the European Union cost Britain?
in the 1980s. As noted by Petrongolo and van Reenen in a study for the London School of Economics’ Centre for Economic Performance, since ‘the rise in youth unemployment dates back to 2004, the year of the EU’s enlargement to take in eight central and eastern European countries…, it would be natural to think that the increase in youth unemployment is related to stronger competition from immigrant labour’. When a regression was estimated between youth unemploy-ment and the immigration across UK regions over time, evidence showed that ‘a one percentage point increase in the proportion of foreign-born in the working-age population is associated with an increase in youth unemployment of 0.43 percentage points’. 5
Official endorsement
The conclusion must be that the heavy immigration to the UK from Eastern Europe since 2004 has taken jobs away from the long-term British. This claim is highly contentious, not least because it challenges the ‘cosmopolitan’ or ‘internationalist’ outlook of many key opinion-formers.6 However, the notion that immigration could reduce UK-born employment has been endorsed in two official reports. The first was published in January 2012 and prepared by Professor David Metcalf, the chairman of the Migration Advisory Committee, which is sponsored by the UK Border Agency. The second appeared in June 2013 and came from the Paris-based Organisation for Economic Cooperation and Development.
The MAC report claimed that employment of 160,000 more British people would have been possible in the 2005 – 10 period if no migrants from outside the EU had come to the UK. Asked directly if there would have been this number of extra jobs if immigration from outside the EU had been stopped, Metcalf answered, ‘yes, that would be a reasonable way of putting it’. 7
The puzzle here is the restriction of the MAC analysis to immigration from outside the EU. If immigration from outside the EU can reduce employment for British citi-zens, why cannot immigration from within the EU have the same effect? Common sense would suggest that the employment-reducing effect of immigration ought to apply regardless of the source country. The argument might be made that immigration from outside the EU was generally of lower-wage workers than, say, EUA8 immigration. However, that in fact was not true. Non-EU immigration was partly from such countries as the USA, Canada and Australia with much higher living stand-ards than the EUA8. Indeed, an analysis prepared inside the government machine showed that workers from the EUA8 countries tended to be in low-wage employ-ment to a far greater extent than the UK-born. To quote, ‘Examination of the occupations of workers born in EU14 countries [i.e., long-standing EU members] show that they are predominantly employed in “Professional occupations” (23.3%), “Associate professional and technical” (17.6%) and “Management and senior officials” (14.3%). These categories account for 55.3%
of EU14-born workers. The same occupations account for 44.2% of UK-born workers and 46.6% of other non-UK-born workers, but only 14.5% of EUA8-born workers. EUA8-born workers are predominately employed in “Elementary occupations” (37.5%).’ 8
The MAC analysis said that the 160,000 jobs lost due to immigration reflected ‘700,000’ extra working-age migrants in the 2005 – 10 period. In fact, official data for the period from the final quarter of 2004 to the first quarter of 2011 show an increase in non-EU immigrant workers of 652,000 and of EU immigrant workers of 588,000. If the ‘700,000’ non-EU immigrant workers are supposed to have destroyed 160,000 jobs for the UK-born, then the 588,000 EU immigrant workers de-stroyed about 135,000 jobs for the UK-born.
The OECD’s report appeared in its annual 2013 Interna-tional Migration Outlook publication.9 Before the onset of the Great Recession in 2007 foreign-born men in the UK were less likely to have a job than those that were born here. In 2006 the employment ratio for UK-born men was 76.9%, whereas for the foreign-born it was 76.3%. But by 2013, after the worst economic downturn since the 1930s, the employment rate of UK-born men had dropped to 74.3%, while that for the foreign-born was up to 76.9%. The OECD analysis received widespread press coverage, not least because it clearly signalled a harsher job-seeking environment for the long-term British. (Note the similarity of the OECD conclusion to that in this publication’s earlier discussion of the employment ratios of the UK-born and people from the EUA8.)
A Home Office spokesperson pointed out that half of the UK-resident foreign-born people in the UK had now become British citizens. She went on, ‘We are building an immigration system that works in the national interest and is supporting growth. Our reforms are working, and they are having an impact in all the right places…[N]et [im]migration is down by almost a third as a result’.10 The tell-tale phrase here is ‘our reforms’. Without being too direct about the matter, the Home Office spokesperson was admitting that in the previous decade much had gone wrong. ‘Reforms’ had become necessary. It is indeed true that since 2010 government policy has been, consciously and actively, to limit immi-gration from outside the EU. The UK remains sovereign in the sense that it can control movements across its borders by people who are not EU citizens.
However, because the UK is a member of the EU, it can-not stop immigration from within the EU. In that sense the UK is not sovereign and it cannot ‘reform’ anything. To repeat, from 1st January 2014 its borders will be open to large-scale immigration from Bulgaria and Ro-mania. Both these countries are at present in recession, as a by-product of the wider macroeconomic malaise in central Europe which is related to the travails of the single currency system. According to a 2011 National Public Opinion Institute in Bulgaria, 12% of the popu-lation would emigrate once EU restrictions were lifted in 2014.11 (Bulgaria has a population of seven million
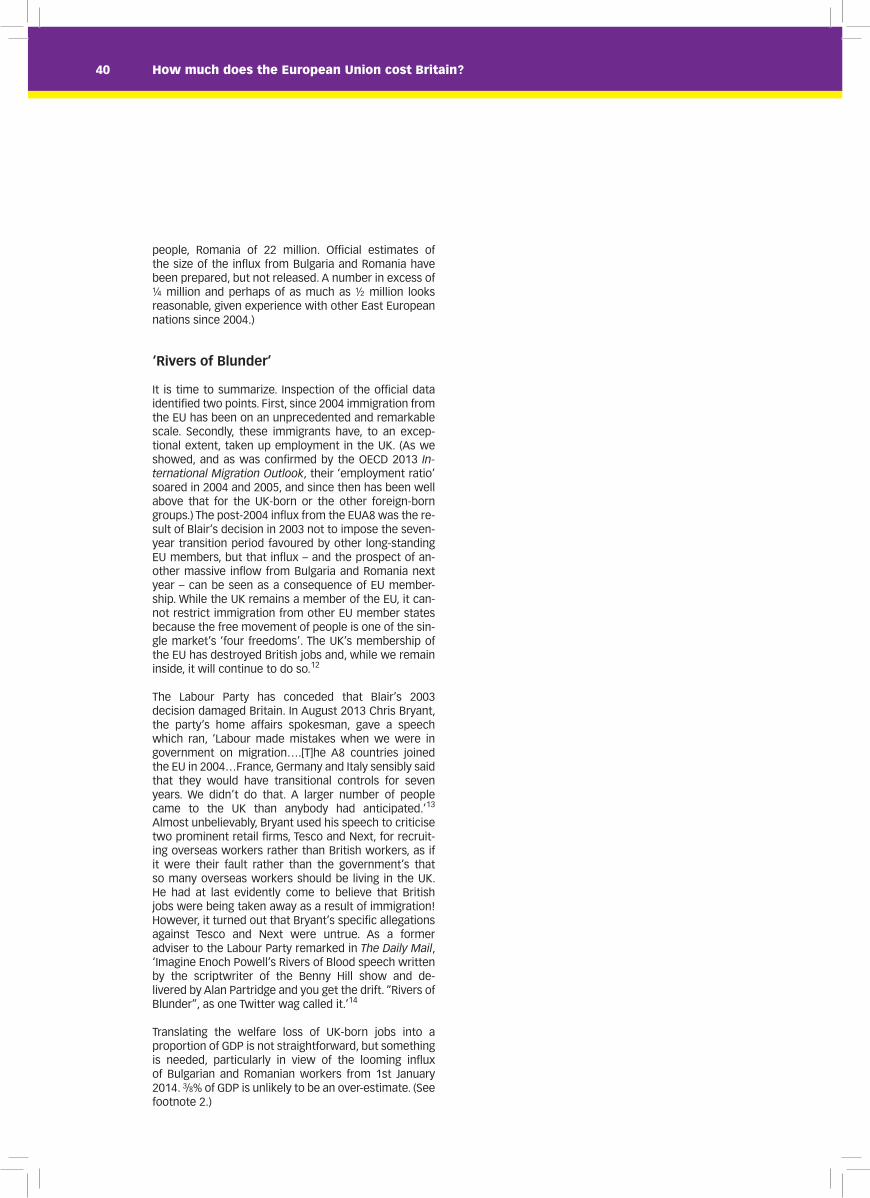
How much does the European Union cost Britain?40
people, Romania of 22 million. Official estimates of the size of the influx from Bulgaria and Romania have been prepared, but not released. A number in excess of ¼ million and perhaps of as much as ½ million looks reasonable, given experience with other East European nations since 2004.)
‘Rivers of Blunder’
It is time to summarize. Inspection of the official data identified two points. First, since 2004 immigration from the EU has been on an unprecedented and remarkable scale. Secondly, these immigrants have, to an excep-tional extent, taken up employment in the UK. (As we showed, and as was confirmed by the OECD 2013 In-ternational Migration Outlook, their ‘employment ratio’ soared in 2004 and 2005, and since then has been well above that for the UK-born or the other foreign-born groups.) The post-2004 influx from the EUA8 was the re-sult of Blair’s decision in 2003 not to impose the seven-year transition period favoured by other long-standing EU members, but that influx – and the prospect of an-other massive inflow from Bulgaria and Romania next year – can be seen as a consequence of EU member-ship. While the UK remains a member of the EU, it can-not restrict immigration from other EU member states because the free movement of people is one of the sin-gle market’s ‘four freedoms’. The UK’s membership of the EU has destroyed British jobs and, while we remain inside, it will continue to do so.12
The Labour Party has conceded that Blair’s 2003 decision damaged Britain. In August 2013 Chris Bryant, the party’s home affairs spokesman, gave a speech which ran, ‘Labour made mistakes when we were in government on migration….[T]he A8 countries joined the EU in 2004…France, Germany and Italy sensibly said that they would have transitional controls for seven years. We didn’t do that. A larger number of people came to the UK than anybody had anticipated.’13
Almost unbelievably, Bryant used his speech to criticise two prominent retail firms, Tesco and Next, for recruit-ing overseas workers rather than British workers, as if it were their fault rather than the government’s that so many overseas workers should be living in the UK. He had at last evidently come to believe that British jobs were being taken away as a result of immigration! However, it turned out that Bryant’s specific allegations against Tesco and Next were untrue. As a former adviser to the Labour Party remarked in The Daily Mail, ‘Imagine Enoch Powell’s Rivers of Blood speech written by the scriptwriter of the Benny Hill show and de- livered by Alan Partridge and you get the drift. “Rivers of Blunder”, as one Twitter wag called it.’14
Translating the welfare loss of UK-born jobs into a proportion of GDP is not straightforward, but something is needed, particularly in view of the looming influx of Bulgarian and Romanian workers from 1st January 2014. 3/8% of GDP is unlikely to be an over-estimate. (See footnote 2.)

41How much does the European Union cost Britain?
1 A favourite conceit of left-leaning ‘intellectuals’, including many working in universities, is that the focussing of public policy on a particular nation is anti-internationalist, and therefore narrow-minded and backward-looking. But that does not stop British academics asking for more British government money to finance British universities. In January 2012 Sir Martin Rees, a former Master of Trinity College, Cambridge, authored a pamphlet for the Politeia think-tank setting out the case for more government funding for UK universities in order that they be ‘internationally competitive’. (Sir Martin Rees Right Aims, Wrong Policy? [London: Politeia, 2012].) See also footnote 6 below. 2 The difficulty arises partly from the ambiguity of the concept of ‘a nation’. Is a nation to be defined as those people resident in it at a particular time or over a particular period, or the people born there (again with some time interval in mind ), or the people who are ‘citizens’ (where the notion of citizenship is also to some extent a matter of definition)? Later in the chapter a statement will be made to the effect that ‘135,000 jobs were lost because of immigration from the EU’ in the 2005 – 10 period. One calculation of the loss ‘to the UK’ might then be the output that would have expected from 135,000 people, if they had been in work and had had average UK productivity, which comes out at about £7 billion a year, which is almost ½% of GDP. The author is under few illusions about the fragility of the assumptions required to deliver this result. Note that this figure will need to be raised in 2014 because of immigration from Bulgaria and Romania. 3 Note that Cyprus and Malta joined at the same time, but they were of course not from the former Soviet bloc and are ignored in the rest of the chapter.4 Official data show that in the year to September 2011 696,00 people of Indian birth and 614,000 people of Polish birth were estimated to be resident in the UK, and these were the two most common countries of birth (apart of course from the UK). They also show that in the same period the 654,000 Polish nationals, 341,000 nationals of the Republic of Ireland and 330,000 Indian nationals were estimated to be resident in the UK. Clearly, birth status and nationality did not coincide, and nearly all of the people of Polish birth resident (and usually working) in the UK regarded themselves as Polish, which was not true of those of Indian origin. 5 Barbara Petrongolo and John van Reenen ‘Youth unemployment’, Centrepiece (London: Centre for Economic Performance), summer 2011 issue, pp. 2 – 5. The quotations are from p. 3. The authors of this piece tried to retract their conclusion by saying that it depended on the inclusion of London in the sample. But why should London be excluded? They refer to another paper in 2005 by David Card in The Economic Journal. But in 2005 no data whatsoever could have been available about the medium-run effects of opening-up of the UK labour market to EUA8 immigration. 6 See David Held Cosmopolitanism (London: Polity, 2010) for an example of this sort of thinking. ‘Cosmopolitanism’ is defined on p. x as elaborating ‘a concern with the equal moral status of each and every human being and creates a bedrock of interest in what it is that human beings have in common, independently of their particular familial, ethical, national and religious affiliations’. Whether Britain exists primarily for the benefit of the British – meaning people of British birth, citizenship and residence – then becomes far from clear. 7 ‘160,000 jobs “lost to migration”, article in The Daily Express, 10th January 2012.8 Jessica Coleman ‘Employment of foreign workers, 2007 – 09’, ONS occasional paper (London and Newport: Office for National Statistics, 2010), p. 7. 9 International Migration Outlook (Paris: Organisation of Economic Cooperation and Development, 2013 edition).10 Daniel Martin ‘So much for British jobs for British workers!’, Daily Mail, 13th June 2013. 11 ‘Almost a million Bulgarians are planning to move abroad’, Daily Mail, 14th June 2013. 12 This chapter has not discussed the employment-reducing effect of a range of employment directives and regulations. As the cost of regulation was covered in the second chapter, to quantify and add that cost here would be double- counting. The total employment-reducing effect of EU membership – both the lost jobs from inward migration and the lost jobs from misguided EU legislation – must run into the hundreds of thousands, perhaps even into the low millions. 13 Jack Doyle ‘Labour finally admits: we let in too many migrants’, The Daily Mail, 13th August 2013. 14 Dan Hodges ‘Hypocrisy and the mother of all U-turns’, The Daily Mail, 13th August 2013.

How much does the European Union cost Britain?42
The title of this chapter is not a joke. Membership of the EU is acknowledged to lead to outright waste in sev-eral important areas of public policy, while its institu-tions are routinely described as ‘riddled with fraud and corruption’.1 A visitor from Mars might wonder why any country – let alone 28 of them – would want to belong to a supranational structure about which such phrases could be written. But the European political elite wants the still quasi-sovereign nation states of Eu-rope to transfer yet more ‘competences’ to this set of institutions.2 Four sections follow on waste, two covering the Com-mon Fisheries Policy, the next on the Common Agricul-tural Policy and the fourth on the effects of EU direc-tives on water standards. Other forms of EU-related waste could be examined and the treatment is far from exhaustive, but space is limited.3 The following section focuses on one just one example of fraud, where the evidence is clear-cut and the cost to the UK beyond dis-pute. Of course it is inherent in the subject-matter that a discussion of fraud cannot have access to all the facts, as the parties at fault will try to conceal them. How-ever, dissatisfaction with the EU’s internal accounting is widespread and of long-standing. The British govern-ment’s White Paper (Cmnd. 8405) on European Finances 2012 is sub-titled Statement on the 2012 EU Budget and measures to counter fraud and financial mismanage-ment. The truth is that the distribution of regional devel-opment and agricultural money in several EU member states involves fraud of an almost systematic kind.4 Finally, a few paragraphs discuss the corruption – par-ticularly the corruption of the European political class – that has accompanied integration under EU auspices.
Background to the Common Fisheries Policy
The Common Fisheries Policy did not exist until the UK sought EEC membership in the early 1970s. As was ex-plained in chapter 1 of this study, the EEC member gov-ernments knew of British eagerness at the time ‘to join the Common Market’. These governments, particularly the French, used their strong bargaining position to en-croach on the UK’s fortunate position, in fishing terms, of being an island nation. Everyone knew that the UK’s home waters had some of the world’s most abundant fish resources. (Aneurin Bevan, a Labour Party politi-cian best known as the founder of the National Health Service, had quipped memorably in May 1945 that, ‘This island is made mainly of coal and surrounded by fish.’) Equal access to the UK’s fishing grounds was therefore proposed as a condition of EEC entry by the UK’s new trading ‘partners’.5 After a ten-year derogation in which the UK fishing industry continued much as before, the EEC applied the Common Fisheries Policy to the UK.
The global fishing industry suffers seriously from a much-analysed difficulty in economic organization known as ‘the tragedy of the commons’.6 A resource – paradig-matically a piece of land in common ownership – has
great value to the individual people who may use it and benefit from it. However, the resource is finite and each individual’s right of exploitation is unlimited. Each indi-vidual therefore has an incentive to take as much of the common resource as possible, but that leads to over-exploitation and degradation. If the degradation goes too far, the resource in common ownership may be des- troyed. The Nobel laureate in economics, Elinor Ostrom, surveyed such situations in her 1990 book on Governing the Commons.7 Several of her examples showed that, if left to themselves, local people realized that they faced the organizational dilemmas implied by the tragedy of the commons. In their own long-run economic interests and without prompting from outside, they put in place arrangements to restrict over-exploitation.
Unfortunately, the CFP is designed and overseen by the European Commission in Brussels. The Commission is a remote supranational bureaucracy and its officials have little direct contact with everyday business reality. They have no personal economic interest in the success or failure of any of Europe’s multiplicity of small fishing communities. It ought not therefore to be a surprise that the EU’s centralized control over fishing has been a disaster, both economically and in terms of environmental impact. The CFP sets quotas for how much of each species can be caught in a certain area. Each country is given a quota based upon the total available (Total Allowable Catch, TAC) and their tradi-tional share, expressed as a percentage. TACs are fixed annually by the Council of Ministers. After quotas are fixed by the Council of Ministers, each EU member state is responsible for policing its own quota. Different countries allocate their quota among fishermen, with enforcement methods varying between them.
Two costs: loss of fishing rights and waste of discarded fish
The problem has been that actual catches may ex-ceed the maximum catch specified in the TACs. If the fishermen land all the actual catch they are breaking the law and so are subject to fines. Understandably, their response has been to discard the excess fish. The discards have now become substantial relative to maximum catches permitted under the TACs. By far the most productive ‘fishing area’ for the EU – to which all EU member states in principle have ‘equal access’, al-though only as determined by a bureaucratic formula – is the so-called ‘Atlantic north-east’. (This means in practice the North Sea, and the areas of the Atlantic within the British, Irish, Icelandic and Norwegian 200-mile limits, plus the areas within the 200-mile limits off the Atlantic coasts of Denmark, France, Spain and Por-tugal.) In 2010 the EU catch in the Atlantic north-east was over 3.7 million tonnes, which was more than 70% of the EU’s total catch of almost 5.0 million tonnes.8 According to a 2012 release on the Fish2fork website, an estimated 1.3 million tonnes of fish from the Atlantic north-east are discarded every year, with up to 900,000 tonnes in the North Sea alone, including many cod.9
5. The costs of waste, fraud and corruption

43How much does the European Union cost Britain?
The precise value of this 1.3 million tonnes is not easy to calculate, because the prices of the various fish spe-cies fluctuate, as does the species composition of the discard. But, as mackerel and herring are usually the principal species, we can concentrate on them. Their prices weakened in late 2012 and are somewhat be-neath recent peaks, with mackerel going for about £800 a tonne and herring for over £400 a tonne.10 (Cod is more valuable, at £2,000 - £3,500 a tonne.) If we take the average value as £750 a tonne (which looks sen-sible), the annual value of fish discards comes out as about £1 billion.
The estimate of £1 billion a year of pure waste applies to the EU as a whole. If Britain had never joined the EEC, if Britain had behaved like Norway and decided to keep control of its fishing grounds, how much of this waste would be attributable to fishing in UK waters? Given that 900,000 tonnes of the discard occurs in the North Sea, of which the UK would have half (more or less) if it had not joined the EEC, and that a big chunk of the remaining discard must happen in the rich coastal waters off Scotland, discard in what might have been ‘UK waters’ must be about 600,000 tonnes. It follows that the value of the annual waste in British territorial waters, due to fish discard, is about £450 million (i.e., 600,000 tonnes multiplied by £750 a tonne). This loss can be blamed on the CFP and the UK’s membership of the EU, since means would surely have been found of preventing it if the UK were again in control of its own fishing grounds. The squandering of nature’s bounty has been going on for many years. The capital value of the
waste is enormous, and probably lies between £5 billion and £10 billion, depending on the assumptions made.11
Note that this is not a measure of the full cost of the CFP to the UK. The undoubted result of joining the EEC/UK was that the UK lost control of its territorial waters. Fishing boats from other European nations have been allowed to fish in waters that would otherwise have been open exclusively to the British fleet. Roughly speaking, what might have been ‘UK territorial waters’ account – in terms of potential catch – for about half of the EU’s sea fishing resource.12 But the quota system has been ap-plied to limit the UK share of EU output to about 12% of the total.13 An estimate of the resulting loss to the UK depends to some extent on how fishing rights would have been allocated in the UK if we had retained full control of the territorial waters. (UK-born people might have quit fishing for more salubrious occupations, even if we had not joined the EEC/EU. Who knows?)14
However, a reasonable surmise is that the UK industry might be double its present size if we had stayed out-side the EU. If the resources (the capital cost of the fleet, the cost of the fishermen’s labour and so on) involved in the activity would be a third less productive in the near-est alternative use, the cost of the CFP to the UK might be over £300 million a year at present fish prices.15 This cost is due to the CFP as such. It arises because the CFP has caused the UK’s fishing fleet and catch to be smaller than it would be if the UK had stayed, like Norway, fully independent and outside the EEC/EU. Again, the capital cost of this loss must run into the
Denmark 16.8
Spain 15.0
United Kingdom 12.4
France 9.0 Ireland 6.5
Netherlands 5.8
Italy 4.8
Portugal 4.5
Germany 4.3
Sweden 4.3
Latvia 3.4
Lithuania 2.8
Poland 3.0
Finland 3.1 Others 4.3 0.0
Fishing catches in the EU
Chart shows % share of total EU catch in 2010
Others 4.3 Finland 3.1
Poland 3.0Lithuania 2.8
Latvia. 3.4
Sweden 4.3
Poland 4.5
Germany 4.3
Italy 4.8
Ireland 6.5
Netherlands 5.8
France 9.0
UK 12.4
Spain 15.0
Denmark 16.8
Fishing catches in the EUChart shows % shares of total EU catch in 2010
2013

How much does the European Union cost Britain?44
billions. (The chart on page 43 relates to 2010 and shows the % shares of EU member states in the total EU sea catch. The UK has the best fishing grounds of any country, but its share is under 12½%. The combined share of Poland, Latvia, Lithuania and Estonia – which became EU members only in 2004 – is similar to the UK’s. A tough line in EU bargaining could easily have stopped this outcome. The UK government has been craven and incompetent in CFP negotiations for over 40 years, and overall its behaviour towards the fishing industry has to be described as shameful.)
Whatever the sensitivities of the British and the citizens of other EU member states about these matters, one point cannot be controversial. The discarding of dead fish on an industrial scale is outrageous. (And, for once, the phrase ‘on an industrial scale’ is not hyperbole.) It is a shocking indictment of the European Commission that such immense waste can be directly attributed to one of its areas of policy responsibility. Under the terms of the Lisbon Treaty the EU has an exclusive competence for conservation of fishing, whereas the management of fisheries is a competence shared with the mem-ber states. Jeremy Paxman of the BBC’s Newsnight pro-gramme has commented, ‘if discards are conservation, I’m a Mad Hatter’. A number of the UK’s ‘celebrity chefs’ have protested vigorously about the iniquities of the CFP, with Hugh Fearnley-Whittingstall organizing a Fish-Fight website and a television programme of the same name. In June 2012 the Council of Ministers reacted to this pressure by agreeing that discards must stop. In May 2013 the agreement was made more definite, with the ban on discards to be phased in from 2015. Once discards have been outlawed, quotas will be based on scientific advice on the ‘maximum sustainable yield’ and implementation will be facilitated by new monitor-ing technologies. (Boats will have to install cameras, weighing equipment that can be tracked from shore and so on.) A small margin for discards will continue to be allowed.
It has to be said that, for all the problems, cuts in sea catches over the last few years have improved the sustainability of Europe’s fisheries. According to the June 2013 European Market Observatory for Fisheries and Aquaculture Products, ‘Although 39% of assessed fish stocks in EU waters of the north-east Atlantic are still overfished, this is down from 47% one year before and 95% in 2005.’16 In fact, cod – which is one of the most valuable species – is currently abundant in the North Sea, despite scientific concern about its sustain-ability in European waters. The EU has reduced the UK’s cod quotas in the last two years, as a penalty deduction for previous over-fishing (relative to quota), even though cod is certainly not in short supply. As one fisherman said to a House of Commons committee in December 2011, ‘I am happy with individual quotas, but not with quotas being set by scientific assessment if the scientific assessment is not 100%. You will agree with me…that it is ridiculous to have a situation where we are virtually knee deep in cod, but fishermen cannot catch them.’17
Set-aside and ‘rural development policy’
Discussion of the resource misallocation due to the Common Agricultural Policy took up a large part of the third chapter. However, EU policy towards the farm sector has another deleterious effect. It not only causes Europe’s farmers to use scarce land and other inputs inefficiently and without regard to market demands; it also to some extent pays Europe’s farmers for doing nothing at all or according to a formula linked to past production. In other words, payments are made that have no relation to current or future production, and therefore cannot be responsive to the latest market indications of under- or over-supply.
The rot started in the late 1980s, when awareness of the over-production sponsored by the CAP became general. In 1992 so-called ‘set-aside’ became com-pulsory. Arable farmers had to take 15% of their land out of production, in order to halt the growth of the EU’s ‘grain mountain’. (The 15% was later reduced to 10%.) In 2005 payments to farmers were made for ‘set-aside entitlements’, meaning the area of land that had historically been taken out of production. More recently, rising Asian prosperity has increased food prices, in-cluding the price of grain, and set-aside arrangements have been abolished. However, the EU continues, via various ‘income support’ schemes, to pay farmers for past patterns of land use and even to compensate them when they are not producing food at all. These are usually justified on the grounds that they help the environment or rural development. The fact remains that they are, in effect, payments for doing nothing whatsoever. Seen objectively, they are waste pure and simple. Farming in response to market demand, which was of course the norm in British agriculture before EU accession in 1973, has been replaced by the farming of grants, subsidies and concessionary loans, mostly by means of form filling.
When allowance is made for the rules and regulations that restrict farm productivity (such as those that limit or prohibit certain seeds, pesticides, rodenticides and so on), the loss of production must run into hundreds of millions of pounds a year, perhaps even into the billions. Given that the second chapter covered the costs of reg-ulation, the focus here must be the costs of set-aside and its sequel, the ‘second pillar’ of the CAP, which is also known as ‘the rural development policy’. Payments under the second pillar are biased towards the small farms, on the grounds that large farms are more likely to pursue highly modern and intensive farming meth-ods. But large firms are also those that are the most efficient and productive.18 By common consent, the UK could produce much more food than it currently does, and would do so if its farmers had greater freedom in land usage and were subject to market forces. No one knows exactly how much more productive UK farming might be in a very different unsubsidized and lightly-regulated context, but a rise of a fifth to a quarter might be feasible. Gross value added in UK agriculture in 2010 was £7.4 billion.19 The cost of lost farm output, due

45How much does the European Union cost Britain?
to payments for not producing, burdensome and un-necessary regulation and so on, might be £1½ billion to £2 billion a year, not enormous compared with the damage to most of the economy from EU regulation, but still worth mentioning. (£2 billion is about 1/8th of one per cent of GDP.)
EU directives and the water industry
In early 2012 the UK was in a strange position. It is a nation blessed by abundant rainfall with a long history
of high-quality and low-cost tap water for the great majority of households, while over the previous dec-ade investment in water supply had been higher than in any previous 10-year period. But large parts of the UK were forecast to be subject to a hose-pipe ban in the summer months.20 The ban was expected, because reservoirs and other water catchment facilities were thought liable to run dry, and water had to be conserved. How had this come to pass?
Central to any answer must be the effect of EU en- vironmental directives on the UK water industry. Super-
Table 5.1: List of EU directives relevant to the UK water industry
1976 Bathing Water Directive
1985 Environmental Impact Assessment Directive
1991 Nitrate Directive
1991 Urban Waste Treatment Directive
2000 Water Framework Directive
2001 Strategic Environmental Directive
2006/7 Revised Bathing Water Directive
2008 Integrated Pollution and Prevention Control Directive
2008 Environmental Quality Standards Directive
2010 Industrial Emissions Directive
0
100
200
300
400
500
600
1999 2000 2001 2002 2003 2004 2005 2006 2007 2008 2009 2010
Payments for producing nothingPayments in £m. to UK farm sector under Common Agricultural Policy
Set-aside
Agri-environment schemes

How much does the European Union cost Britain?46
ficially, the purpose of these directives has been benign. As they have mandated that the whole of the EU must move to higher levels of air and water quality, they can be portrayed as attempts to make the world a better place. However, the benefits of higher air and water quality, and of better environmental standards more generally, can be bought only at a cost. Ideally, a bal-ance should be maintained between cost and benefit, and policy should respect the recognised principles of social cost/benefit accountancy.21 Many well-informed observers feel that the benefits of environmental im-provement have been bought at too high a price. The history of the European Commission’s endeavours to enhance the EEC/EU’s environment goes back to the mid-1970s, with the 1976 Bathing Waters Directive. As Table 5.1 shows, several directives have subsequently been passed. Indeed, the 2000 Water Framework Directive has often been seen as a new departure in the rigour of the EU’s environmental prescriptions. One discussion of the resulting policy issues referred to the 2000 Water Framework Directive and ‘its daughter directives’.22
The UK government has been more active than that of most other member states in seeking a proper reckon-ing of the costs and benefits of these exercises. In 1999 the Department of the Environment, Transport and the Regions considered the potential costs to the UK of the imminent Water Framework Directive, and arrived at a figure of between £3.2 billion and £11.2 billion at cur-rent prices (i.e., the prices of 1999) over the period to 2040, assuming full implementation by 2010.23 Since then prices have risen by about a third, while – as Table 5.1 brings home – additional directives have come into effect. Precise quantification needs another in-depth study, but we are evidently talking – in terms of 2012 prices – of a cost that lies somewhere between £5 bil-lion and £20 billion, perhaps more. Of course this cost is incurred over a period of a few decades. All the same, the bulk of the cost lies in the early years of implement-ing the directives, which results in the greatest pressure on the nation’s resources at that stage. It is not silly to be thinking in terms of extra costs of at least £500 million a year for the UK to meet the assortment of EU environmental impositions.
A major counter-argument is that this expenditure has important benefits, in terms of cleaner and less polluted water, the return of fish to rivers, the hygienic advan-tages of swimming off beaches unaffected by sewage, and so on. However, the UK’s water industry had been investing in the various forms of environmental improvement for decades before the EU directives came into force and indeed before the UK joined the EEC. Even the Commission has accepted that the UK is ‘fairly advanced in the field of water monitoring and administrative systems compared to many member states’.24 Any worthwhile appraisal must weigh the extent of improvement against the costs involved. In a 2007 official answer in the House of Lords to a question from Lord Pearson of Rannoch, a UK government min-ister said that over the previous decade compliance with the Water Framework Directive and ‘its daughter
directives’ had necessitated investment of £65 billion. By contrast, only £14 billion of investment had been available for the water industry’s infrastructure.25
On the face of it, the UK water industry has been characterized by over-investment, even extreme over-investment, in attempts to ameliorate water quality, and under-investment in infrastructure to maintain and expand supply to its customers. The misguided invest-ment pattern can be attributed, almost entirely, to the UK’s obligation to comply with EU directives. The under-investment in infrastructure in turn explains the para-dox faced in early 2012. In the previous 15 years over £100 billion had been invested by the water industry. But the industry’s storage capacity had not changed, as too much of the investment had been to meet EU water purification targets. That was how, in an island notorious for its rainy weather, millions of households were forecast to be subject to a hose-pipe ban. In a re-cent analysis Sir Ian Byatt, the director general for water services at Ofwat (the UK water regulator) in the 1990s, was blunt. ‘We should switch the emphasis from the vol-ume of investment to its quality, to better returns from assets, to better management of networks, to the trad-ing of water and abstraction rights and to the regulatory monitoring of outcomes rather than of projects.’26 The first line of his executive summary read, ‘The drive to attain ever-increasing water and environmental quality at ever-increasing cost must come to an end’.
So we have here another area of public policy where costly mistakes have been made over an extended period because of the UK’s membership of the EU. The drive to purify UK water has been taken to extremes. It has had an unnecessarily high cost and, in that sense, it has involved a great deal of waste. The discussion here makes no pretence at being definitive, but the level of waste per year must run into the hundreds of millions, perhaps into the billions, and the capitalized value of the waste must be £5 billion or more. (A smaller figure would make little sense, given the investment totals involved and the virtual unanimity of informed commentary on the misdirection of investment.)
Corruption, fraud and irregularity
This and the next section are concerned with ‘fraud’, ‘corruption’ and ‘irregularity’ in the EU, and the effect of this fraud, corruption and irregularity on the cost of EU membership to the UK. But the distinctions in this area are a little fuzzy, while the whole subject is vast. A few years ago Carolyn Warner, an American academic with a Harvard doctorate and now professor of political science at Arizona State University, published a schol-arly yet still devastating book on what might be termed the EU’s ‘corporate governance’.27 The book was called The Best System Money Can Buy, but the implicit sarcasm was made clear with the sub-title Corrup-tion in the European Union. The titles of the chapters included ‘Corruption dynamics in the European Union’, ‘“Corruption is our friend”: exporting graft in infrastruc-

47How much does the European Union cost Britain?
ture, arms and oil’, ‘The corruption of campaign and party financing’ and ‘The pathologies of an international organization’. Obviously, something is wrong.
Numerous allegations have been made of large-scale and endemic fraud in EU institutions. In early 1999 the allegations reached such a crescendo that the Com-mission, headed by Jacques Santer of Luxembourg, was obliged to appoint a Committee of Independent Experts on its own workings. Its report was produced on 15th March, and presented to the Commission and Parliament. Nearly all members of the Commission were cleared, more or less, of doing anything improper. But Edith Cresson – Commissioner for Research, Science and Technology and a former French prime minister – was not. The verdict was that she ‘failed to act in response to known, serious and continuing irregulari-ties over several years’ and, in particular, she was guilty of not reporting failures in a youth training programme from which vast sums went missing. The independent experts concluded, more generally, that inside the Commission, ‘It was becoming increasingly difficult to find anyone who had the slightest sense of responsi-bility’.28 Given the damning tone of the report, the entire Commission felt obliged to resign.
The Santer Commission episode might have been expected to be followed by an improvement in record-keeping, and the clarification of reporting lines, re-sponsibilities and so on, but this appears not to have been the case. As the ultimate paymaster of European integration, the German taxpayer has to be concerned. According to a 2007 report in Der Speigel, fraud committed in Brussels was running at one million euros per day. At that time 400 investigative procedures against EU officials were pending. The Commission claimed that corruption was no more widespread in Brussels than anywhere else, but the budget expert for the German CDU in the European Parliament, Inge Grässle, described this view as ‘laughable’. The figure of
one million euros a day of loss through fraud may sound bad enough, but the true figure – both then and now – is probably much higher.29
So the EU is ‘riddled with fraud’, as the standard cliché claims. How does that affect the cost of EU membership to the UK, which is the central interest of this study? A simple and straightforward calculation will not emerge, because by its intrinsic nature fraud is opaque or con-cealed. The Cmnd. 8405 White Paper on European Union Finances 2012 did contain a table on the EU’s financial ‘irregularities’ and their ‘estimated impacts’ in terms of millions of euros at stake, the main points of which are reproduced in Table 5.2. For the record, in 2010 there were over 10,000 cases of irregularity in the spending of EU money and about €1,800 million was in jeopardy. A marked increase in financial control problems took place in the two years to 2010, since in 2008 there were under 6,600 cases of irregularity and less than €800 million was at stake. But, as noted above, because the UK’s direct fiscal costs come to much the same thing as our payments to finance the EU Budget, the UK share of this €1,800 million (which might be about €250 million) should not be interpreted as the additional cost of EU fraud to us. (Remember that direct fiscal costs were covered in chapter 1. To add €250 million for the cost of fraud would be double-counting. We have paid the money and that is that. Citizens in the recipient coun-tries ought to be dismayed that the money they receive from the EU is being grotesquely misdirected, but it is not our problem.) Nevertheless, a striking recent exam-ple of semi-fraud, actual or potential, deserves mention and is discussed in the next three paragraphs. As it hap-pens, the sums involved are not part of the UK’s direct fiscal costs and adding them to the overall cost of EU membership does not risk double-counting.
In the 1960s the UK embarked on a massive programme of university expansion, following the Robbins Report of 1963. One objective was to increase the skill levels of
Table 5.2: Number of EU irregularities and estimated financial impacts
2009 2010
No. of Amounts No. of Amounts cases (€ millions) cases (€ millions) Agricultural (EAGF and EAFRD) * 1,621 12 1,825 131 Structural Funds and Cohesion Funds 4,737 1,183 7,062 1,550 Direct expenditure 705 28 1,021 43 Pre-accession funds 706 117 424 83 Total expenditure 7,769 1,453 10,332 1,807
Source: The EU Commission’s 2010 Fight against Fraud report, as reproduced in Cmnd. 8405 and published by the Stationery Office in 2012. * EAGF stands for ‘European Agricultural Guarantee Fund’ and EAFRD for ‘European Agricultural Fund for Rural Development’ Note: Cmnd. 8405 cautions that ‘a reported irregularity is in most cases not a fraud (a deliberate act)’.

How much does the European Union cost Britain?48
the British workforce, since recent academic research had found strong returns on investment in higher education. Plainly, the post-Robbins expansion was intended to benefit the British specifically and to improve the UK’s international economic competitive-ness. By common consent the UK’s universities have long constituted, and still do so today, the best higher education system in Europe.
However, because of the UK’s membership of the EU and the resulting pressures for the equalization of access to every member states’ institutions, British universities have increasingly to invite entry on the same basis to students from all over the EU. British universities are not meant to discriminate in favour of British students. Further, since 2006 students from around the EU have been eligible for low-cost loans, to cover tuition fees, from the British state. But will the UK get the money back? UK-based graduates have loan repay-ments automatically deducted from income under the PAYE arrangements. But no such method can be ap-plied to graduates from British universities who return to, say, Portugal or Slovenia. According to a story in The Daily Mail for 10th August 2012, ‘42% of EU students [who had graduated from UK universities]…are liable for repayments, but are failing to keep up’. On 12th May 2013 The Daily Mail carried another story amplifying the message. In its words, ‘Overseas students who have returned home after graduating from British universi-ties have failed to pay back their tuition fee loans, cost-ing UK taxpayers more than £50 million. With amounts owed by many European graduates spiralling, the Stu-dent Loan Company has taken the drastic step of calling in private investigators to find the missing money.’30
In effect, by reneging on their debts, students from the rest of the EU obtain a free education at the expense of the British taxpayer. The Robbins expansion of our universities is therefore benefiting foreigners, not us. As the former Conservative Cabinet minister, Peter Lilley MP, observed, ‘we will need to do something to stop subsidizing the EU by providing their brightest and best with free education’.31 The eventual loss to the UK is difficult to conjecture. Unsurprisingly, students from the EU countries with the worst recessions, namely Greece and Cyprus, are proving the most awkward. EU students’ outstanding debt to the UK’s Student Loans Company has climbed to just over £117 million in the last five years. Students from Cyprus have borrowed £24 million, but paid back only £15.5 million.32 The amount eventually written off may be in the tens of mil-lions if proper controls are soon introduced or in the low hundreds of millions if nothing is done for several years. We have here an obvious case of pure loss to the UK taxpayer because of fraud arising from our EU membership.
Costs of corruption
The British have traditionally made a great song and dance about their history, and the specialness of their
institutions (the home of parliamentary democracy, the rule of law, the separation of the executive from the ju-diciary, the flexibility of the common law, the bicameral parliament in which one house is for revising legislation, habeas corpus, trial by jury, and so on). Unfortunately, to the extent that we still make a great song and dance about the marvel of our constitutional arrangements, we are becoming ridiculous. The fact is that many of our key traditional constitutional arrangements are null and void; the reality is that, as in other EU mem-ber states, the dominant source of new legislation is not the democratically-elected House of Commons, but an alien bureaucracy in a foreign land. Elected politicians from our own country have often to kow-tow to unelected functionaries from several foreign countries, where these functionaries act with the authority of the EU and its institutions.
The enormity of the betrayal must raise questions about the motivations of the politicians involved, as well of course of their civil service advisers and associates. No one is claiming that heads of state, senior ministers and top officials have received direct bribes from EU insti-tutions to persuade them that they should surrender powers to the EU. Nevertheless, corruption has been at work. In politics a distinction can be drawn between ‘hard’ and ‘soft corruption’, just as in diplomacy there is one between ‘hard’ and ‘soft power’. Hard corruption is the payment of specific sums for an identifiable im-proper action, usually in its immediate aftermath. Soft corruption is the hinting that unspecified favours will be granted, perhaps at a distant date in the future, for an action just far enough from the border-line of political propriety. Whereas hard corruption deals in money, soft corruption deals in jobs and honours.
The EU abounds in soft corruption. Bluntly, there is no doubt that the British political class has been turned by the jobs and honours on offer. The Labour Party’s manifesto in the 1983 general election included with-drawal from the EEC. Neil Kinnock, an MP since 1970, was prepared to fight the 1983 election on that mani-festo. However, after becoming leader in October 1983, Labour’s opposition to European unification was diluted and eventually abandoned. After losing the 1992 gener-al election Kinnock became a European Commissioner and stayed in Brussels for nine years. His wife, Glenys, was a Member of the European Parliament from 1994 to 2009. In 2009 she was made a life peer and for a few months she served as Minister of State for Europe. On 14th June 2010 The Daily Mail carried a story on how Neil and Glenys Kinnock had ‘received more than £10m. in pay, allowances and pension entitlements during their time working at the European Union in Brussels’. According to the story, ‘the couple’s lavish lifestyle’ was ‘funded from the public purse’.33
The growth of soft corruption is related to the rise of the so-called ‘career politician’. A career politician might be defined as someone who wishes to be engaged on a full-time basis in political advocacy from which he or she intends to make a living. The intention to make
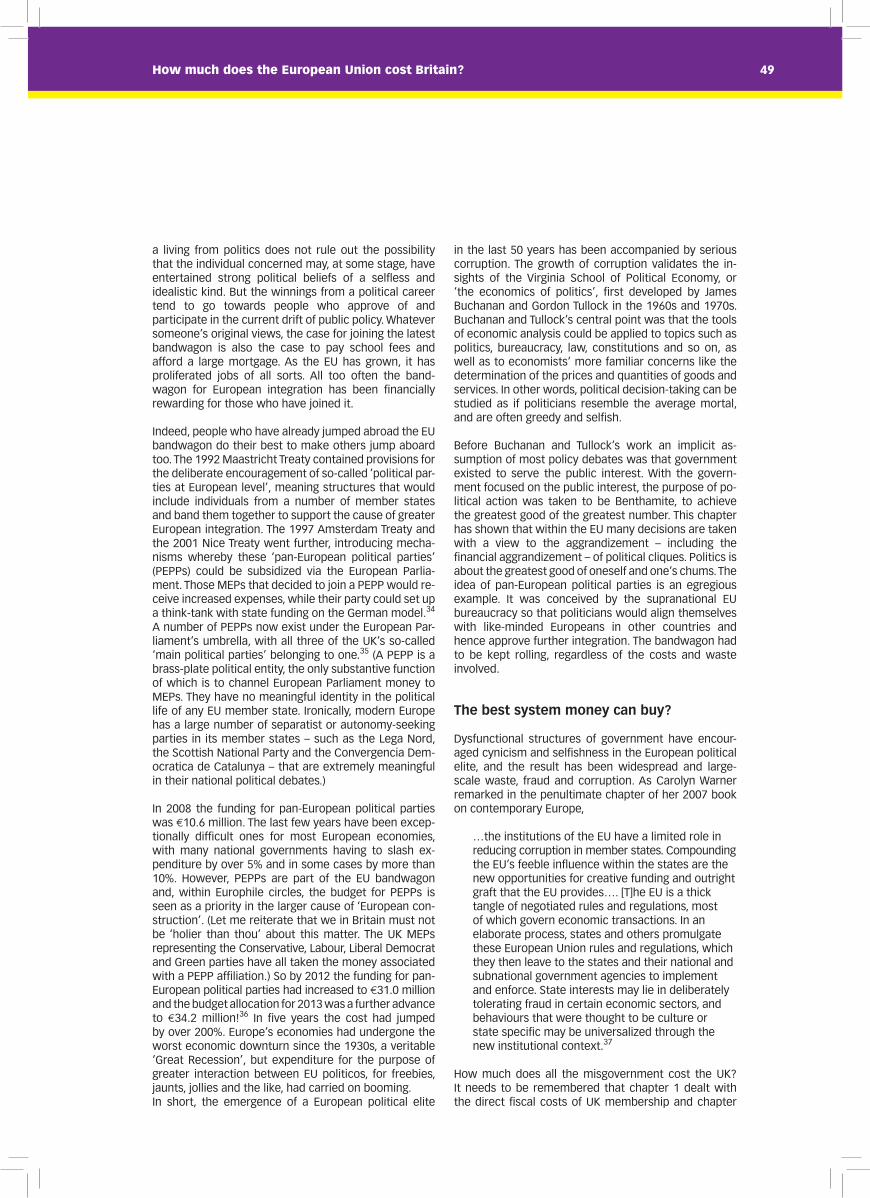
49How much does the European Union cost Britain?
a living from politics does not rule out the possibility that the individual concerned may, at some stage, have entertained strong political beliefs of a selfless and idealistic kind. But the winnings from a political career tend to go towards people who approve of and participate in the current drift of public policy. Whatever someone’s original views, the case for joining the latest bandwagon is also the case to pay school fees and afford a large mortgage. As the EU has grown, it has proliferated jobs of all sorts. All too often the band-wagon for European integration has been financially rewarding for those who have joined it.
Indeed, people who have already jumped abroad the EU bandwagon do their best to make others jump aboard too. The 1992 Maastricht Treaty contained provisions for the deliberate encouragement of so-called ‘political par-ties at European level’, meaning structures that would include individuals from a number of member states and band them together to support the cause of greater European integration. The 1997 Amsterdam Treaty and the 2001 Nice Treaty went further, introducing mecha-nisms whereby these ‘pan-European political parties’ (PEPPs) could be subsidized via the European Parlia-ment. Those MEPs that decided to join a PEPP would re-ceive increased expenses, while their party could set up a think-tank with state funding on the German model.34
A number of PEPPs now exist under the European Par-liament’s umbrella, with all three of the UK’s so-called ‘main political parties’ belonging to one.35 (A PEPP is a brass-plate political entity, the only substantive function of which is to channel European Parliament money to MEPs. They have no meaningful identity in the political life of any EU member state. Ironically, modern Europe has a large number of separatist or autonomy-seeking parties in its member states – such as the Lega Nord, the Scottish National Party and the Convergencia Dem-ocratica de Catalunya – that are extremely meaningful in their national political debates.)
In 2008 the funding for pan-European political parties was €10.6 million. The last few years have been excep-tionally difficult ones for most European economies, with many national governments having to slash ex-penditure by over 5% and in some cases by more than 10%. However, PEPPs are part of the EU bandwagon and, within Europhile circles, the budget for PEPPs is seen as a priority in the larger cause of ‘European con-struction’. (Let me reiterate that we in Britain must not be ‘holier than thou’ about this matter. The UK MEPs representing the Conservative, Labour, Liberal Democrat and Green parties have all taken the money associated with a PEPP affiliation.) So by 2012 the funding for pan-European political parties had increased to €31.0 million and the budget allocation for 2013 was a further advance to €34.2 million!36 In five years the cost had jumped by over 200%. Europe’s economies had undergone the worst economic downturn since the 1930s, a veritable ‘Great Recession’, but expenditure for the purpose of greater interaction between EU politicos, for freebies, jaunts, jollies and the like, had carried on booming. In short, the emergence of a European political elite
in the last 50 years has been accompanied by serious corruption. The growth of corruption validates the in-sights of the Virginia School of Political Economy, or ‘the economics of politics’, first developed by James Buchanan and Gordon Tullock in the 1960s and 1970s. Buchanan and Tullock’s central point was that the tools of economic analysis could be applied to topics such as politics, bureaucracy, law, constitutions and so on, as well as to economists’ more familiar concerns like the determination of the prices and quantities of goods and services. In other words, political decision-taking can be studied as if politicians resemble the average mortal, and are often greedy and selfish.
Before Buchanan and Tullock’s work an implicit as-sumption of most policy debates was that government existed to serve the public interest. With the govern-ment focused on the public interest, the purpose of po-litical action was taken to be Benthamite, to achieve the greatest good of the greatest number. This chapter has shown that within the EU many decisions are taken with a view to the aggrandizement – including the financial aggrandizement – of political cliques. Politics is about the greatest good of oneself and one’s chums. The idea of pan-European political parties is an egregious example. It was conceived by the supranational EU bureaucracy so that politicians would align themselves with like-minded Europeans in other countries and hence approve further integration. The bandwagon had to be kept rolling, regardless of the costs and waste involved.
The best system money can buy?
Dysfunctional structures of government have encour-aged cynicism and selfishness in the European political elite, and the result has been widespread and large-scale waste, fraud and corruption. As Carolyn Warner remarked in the penultimate chapter of her 2007 book on contemporary Europe,
…the institutions of the EU have a limited role in reducing corruption in member states. Compounding the EU’s feeble influence within the states are the new opportunities for creative funding and outright graft that the EU provides…. [T]he EU is a thick tangle of negotiated rules and regulations, most of which govern economic transactions. In an elaborate process, states and others promulgate these European Union rules and regulations, which they then leave to the states and their national and subnational government agencies to implement and enforce. State interests may lie in deliberately tolerating fraud in certain economic sectors, and behaviours that were thought to be culture or state specific may be universalized through the new institutional context.37
How much does all the misgovernment cost the UK? It needs to be remembered that chapter 1 dealt with the direct fiscal costs of UK membership and chapter

How much does the European Union cost Britain?50
1 See the alarming accounts in Marta Andreasen Brussels Laid Bare (Yelverton, Devon: St. Edward’s Press, 2009) and David Craig The Great European Rip-off (London: Random House, 2009). The EU’s Budget is subject to a quality test (‘a declaration of assurance’) by the European Court of Auditors. The EU’s annual accounts have not been certified in this sense by the external auditor since 1994. In its annual report on the implementation of the 2009 EU Budget, the Court of Auditors found that the two biggest areas of the EU budget, agriculture and regional spending, had not been signed off on and remained ‘materially affected by error.’ 2 On 7th June 2012 Angela Merkel, the German chancellor, said on the ARD German television channel ahead of the next summit of EU leaders on 28th June, ‘We need political union first and foremost. Step by step we must from now on give up more competences to Europe, and allow Europe more powers of control…I don’t believe that there will be one single summit that will decide on a big bang. But what we have been doing for some time, and on which a working plan will certainly be presented in June, is to say we need more Europe’. Merkel was undoubtedly ‘in the driving seat’ at the summit itself. 3 The British government has on more than one occasion asked for the full repatriation of spending of regional development money, saying that it would save a few hundred millions of pounds of administrative costs. The subject was also discussed in chapter 1.4 But note that this is not an extra cost to the UK, over and above that already discussed. The money is already included in the direct fiscal cost to us, which was discussed in the first chapter.5 The story of the UK’s virtual abandonment to other European nations of its control of a major national resource is told on pp. 152 – 55 of Christopher Booker and Richard North The Great Deception: a Secret History of the European Union (London: Continuum, 2003). Norway was also an applicant for EU entry at the time, but – when the fisheries minister realized the implications of the equal access provision for Norway’s industry – he resigned in protest. When the Norwegian people were asked in a referendum in late 1972 for their view on EEC membership, they voted against by 52.7% to 47.3%. 6 The seminal article is Garrett Hardin ‘The tragedy of the commons’, Science, vol. 162, 13th December 1968, pp. 1243 – 8. For a discussion of the larger issues raised by this problem in social organization, the fifth chapter of Roger Scruton’s book on Green Philosophy is excellent. (Roger Scruton Green Philosophy [London: Atlantic Books, 2012], pp. 137 – 82. 7 Elinor Ostrom Managing the Commons: the Evolution of Institutions for Common Action (Cambridge: Cambridge University Press, 1990). 8 In the 2012 edition of this publication the source was Facts and Figures on the Common Fisheries Policy (Brussels: European Commission, 2012 edition), p. 20. No 2013 edition of Facts and Figures on the Common Fisheries Policy was available at the time of writing (August 2013). The source for the figures was the fisheries section of the European Commission’s Eurostat website, as at 21st August 2013. 9 ‘Campaigners hail deal to ban discards across Europe’, Fish2fork website (www.fish2fork.com), 13th June, 2012. The estimate of 1.3 million tonnes seems originally to have made by the United Nation’s Food and Agricultural Organization, but the author has not been able to verify the exact source. 10 ‘Scottish fishermen landed catches worth more than £500 million last year – a 10-year high – according to provisional figures posted by the Scottish Government. The figures show a 15 per cent increase in the value of landings valued at £435 million in 2010. Price per tonne landed for herring rose from £280 in 2010 to £450 last year, and mackerel from £839 a tonne to £1,118.’ Business section of Scottish Daily Record website (www.business7.co.uk), ‘Value of Scottish fishing landings at 10-year high’, by Scott McCulloch, 17th April 2012. 11 The net present value of £500 billion over 20 years discounted at 7% is £5.3 billion or discounted at 3% £7.4 billion. As far as I am aware, this is the first comprehensive estimate of the cost of fish discards to the UK, although the subject has received extensive media coverage in other respects. Let me emphasize that, as noted in the text, much depends on fish prices and species composition. 12 Fishing is split between sea fishing (‘pelagic’ and ‘demersal’) and aquaculture. (Pelagic fish are found near the surface and include herring and mackerel; demersal are ‘bottom-feeders’, and include cod and haddock.) The CFP applies almost entirely to sea fishing. It should be noticed that aquaculture – mostly fish farming in inshore or inland waters – is also a huge industry, with UK output of over £500 million. The UK has the EU’s second largest aquaculture production and is by far the largest producer of farmed salmon. For the most part the aquaculture industry is outside the ambit of the CFP. The great majority of the UK’s salmon is farmed in Scotland, where production soared from 28,500 tonnes in 1989 to almost 170,000 in 2003, but has subsequently gone sideways.13 Facts and Figures of the CFP, p. 21.
3 with the costs of regulation. Although many of the developments discussed in the current chapter are deplorable, we must avoid double-counting. The water industry is an interesting borderline case. The loss from over-investment in water purification could be viewed as a cost of regulation or as an example of waste, and there is nothing sacrosanct about the allocation of topics to particular chapters adopted here. At any rate, the fish discard is clearly waste, indeed – as we have said – waste on an industrial scale. That justified including the Common Fisheries Policy in the present chapter. Although the fishing industry is small, the CFP undoubtedly makes the UK several hundreds of millions of pounds a year worse-off than it would have been if, like Norway, it had stayed out of the EU and kept
control of its territorial waters. Similarly, payments to farmers for producing nothing are also waste. They may be modest in the larger scheme of EU extravagance, but they should not be overlooked.
Britain could also lose out from its apparent subsidiz-ation of foreign EU students at its universities, and the corruption that marks the extravagant expansion of the EU’s bureaucracy and associated political hanging-on. Although the costs of the EU to the UK from waste, fraud and corruption are small relative to its GDP, they are costs. Precise quantification is elusive, but another 3/8% of GDP looks more valid than saying that there are no costs at all.38

51How much does the European Union cost Britain?
14 Parts of Scotland (Argyll, and the Highlands and Islands) have seen a boom in aquaculture in the last 20 years, with the resulting farmed output meeting a significant part of UK demand and also being exported to the rest of the EU. (See foot note 12.) The resources used in aquaculture can be regarded, to some degree, as having been ‘freed up’ by the UK’s loss of sea fishing quotas. The author would like to emphasize that he nevertheless deplores the handing-over of fishing rights in UK territorial waters to foreigners. 15 Roughly speaking, the value of the UK’s sea fish catch is about £1 billion a year, with much depending on prices, species composition and so on. If it were twice the size, obviously output would be higher by another £1 billion, but that would mean less production of other goods and services. Assuming that the same resources were one third less productive in other branches of production, the loss to the UK because of the CFP – in terms of a smaller fishing fleet and catch than would be outside the EU – comes to £330 million a year. This estimate is rough and ready, but gives a sense of magnitudes. Another difficulty is to allow for the possible reduction in the size of the UK’s fish processing sector because we have a lower catch by our own fleet. But, since the UK fish processing sector can buy from other EU fisheries, it is not clear to the author that any allowance should be made for this point. Trade in fish between EU member states is a very high proportion of output. 16 European Market Observatory for Fisheries and Aquaculture Products (Brussels: European Commission), June 2013 issue, p. 12. 17 Evidence of Paul Joy, chairman of the Hastings’ Fishermen’s Protection Society, to the House of Commons’ Enviornment, Food and Rural Affairs Committee, 8th December 2011. 18 Sean Rickard ‘Liberating farming from the CAP’ (London: Institute of Economic Affairs), Discussion paper no. 37 (February 2012). See, particularly, p. 14. 19 The gross value of UK farm output is much higher, at over £20 billion. But much of this goes to pay for inputs from other sectors of the economy, and gross value added is smaller. Gross value added at market prices in fact soared from under £5.0 billion in 2007 to £7.4 billion in 2010, largely because of the impact of the sterling devaluation in 2008 and early 2009 on farm profitability. Annual Abstract of Statistics (London: The Stationery Office), 2011 fourth quarter, Table 24.1. (Gross value added differs from net by the value of the depreciation of farm equipment.) Note that household expenditure on food is over £70 billion. Food manufacturing and distribution are much larger than farming. 20 In the event the reputation of the water industry was rescued by the British weather! The spring of 2012 was one of the wettest on record.21 Ian Little and James Mirrlees Manual of Industrial Project Analysis for Developing Countries (Paris: OECD, 1969) is the key reference here. 22 Deloitte Consulting Support to Fitness Check Water Quality (Project for European Commission – General Directorate Environment), 14th June 2011. 23 Water Quality Division, Department of the Environment, Transport and the Regions Regulatory Impact Assessment of the Water Framework Directive (DETR: London, 1999). 24 Giorgos Kallis and David Butler ‘The EU water framework directive: measures and implications’, Water Policy (London: World Water Council), no. 3, 2001, pp. 125 - 42 25 Christopher Booker ‘£65 billion of water budget poured down the drain’, The Sunday Telegraph, 29th July 2007. In the 20 years to 1997 the investment required to conform to EU directives is said to have totalled £48 billion.26 Ian Byatt Water: Supply, Price, Scarcity and Regulation (London: Institute of Economic Affairs, August 2012), Current Controversies Paper no. 37, p. 6. The saga has been followed by Christopher Booker in his Sunday Telegraph column. In December 2011 the Department of the Environment, Food and Rural Affairs produced a White Paper on Water for Life, ostensibly to help in the public discussion of water management. As Booker acidly commented, ‘not once…is there any mention of a need to build new reservoirs’. (Christopher Booker ‘Keeping us short of water is now government – and EU – policy’, The Sunday Telegraph 13th May 2012.) UK officialdom apparently believes that global warming may affect UK rainfall and hence that attempts to combat global warming are vital to prevent what it terms ‘water stress’. A quick check on the UK’s Met Office website at the time of writing (summer 2012) found the following statement. ‘The UK annual average rainfall has increased by a relatively small amount - around 2% - when comparing 1981–2010 with 1971–2000. This is a similar increase to that from 1961–1990 to 1971–2000.’ There is no evidence whatsoever that such ‘global warming’ as has occurred in the last 30 or 40 years has reduced the UK’s rainfall. 27 Carolyn M. Warner The Best System Money Can Buy (Ithaca and London: Cornell University Press, 2007). 28 The source is Nils Ringer ‘The Santer Commission resignation crisis’, University of Pittsburgh research papers (February 2003), cited in the Wikipedia entry on the Santer Commission.29 The material in this paragraph has appeared in several Eurosceptic blogs and it is not clear to me which is the original source. An article in Der Spiegel of 28th July 2007 may be the beginning of the story. 30 ‘Student loans company calls in private eyes to track down EU students who owe £50m.’, The Daily Mail¸ 12th May 2013.31 Laura Clark ‘Half of EU students failing to repay loans’ The Daily Mail, 10th August 2012. 32 The source for the figures is The Daily Mail story of 12th May 2013. 33 Simon McGee ‘Revealed: How the Kinnocks have enjoyed an astonishing £10m. ride on the EU gravy train’. 34 The state funding of think tanks is an established feature of the German political system. 35 In 2011 the UK Independence Party had an active internal debate on whether its MEP group should join a PEPP. The party membership voted by a majority of two to one against UKIP’s MEPs becoming affiliated to a PEPP.36 European Parliament website, as at mid-August 2013. ‘The Budget of the European Parliament’, line-by-line analysis for 2013, Chapter 4-0. 37 Warner Best System, p. 159.38 The number may be ad hoc, but that is better than nothing. The treatment in this chapter has been far from exhaustive. For example, the EU’s emission trading scheme turns out – to use that so-often-repeated phrase again – to ‘have been riddled with fraud’. To quote from a story in The Guardian (23rd January, 2011), ‘Hopes that a key tool in the fight against climate change can be brought back into full operation on Wednesday were fading as national governments struggled to beef up security after a huge carbon fraud was uncovered in Europe’s pioneering emissions trading scheme (ETS). The European Commission stepped in to ban “spot” trading in carbon on any local exchanges last Wednesday after a £28m cyber-attack on the Czech, Austrian and other national markets and was hoping to lift the restriction this week, but there are growing fears that new security will not be in place on time in all locations. Market experts are now calling for victims of carbon trading fraud to be compensated by the European Union to prevent the latest in a series of scandals turning traders off the ETS, which was meant to provide a blueprint for national carbon reduction schemes to be introduced in America and further afield.’ Similarly, nothing has been about the effect of the Working Time Directive on the hours worked by junior doctors and the waste attributable to their longer training period. Numerous other examples of EU-related misgovernment and consequent waste, often a by-product of fraud, could be cited.

How much does the European Union cost Britain?52
Governments do not have 20/20 forward vision. They sometimes make commitments which turn out to be far more expensive than expected. In its relations with the EU, the British government may in coming years have to spend money in ways that it could not reasonably have foreseen 15 years ago, let alone when it joined the EEC in 1973. Two types of expenditure are to be emphasized.
First, since the Second World War the UK has been a welfare state in which ‘everyone’ is both entitled to certain public services and benefits, and obliged to pay taxes to cover the costs. In the current era of heavy im-migration the notion of ‘everyone’ becomes tricky. Of course tourists are not eligible for UK public services and benefits. But what about students who are here for nine months? Or seasonal workers who are in the UK, on the same job, for three months over a period of 15 years? Or people of foreign birth who have had a full-time position in the UK for a decade and have become citizens? The awkwardness arises because the long-term British (the British by birth, citizenship and residence) have paid taxes for many years and have a resulting sense of entitlement to the welfare state. They do not feel that more recent and possibly more transient residents should receive state benefits and public services on the same basis. Newspapers have focussed on the use of the National Health Service by ‘foreigners’ and their claiming of benefit.1 In terms of now familiar phrases, the problem areas are ‘health tourism’ and ‘benefit tourism’, both of which are given sections in this chapter.
Second, the UK has sensibly not adopted the euro as its currency. Nevertheless, the UK does have some potential exposure to financial failures in EU institutions. In other words, the UK has incurred ‘contingent liabilities’ because of its proximity to the EU and the European single currency area. In the last edition of this study the size of these liabilities was considered in a quite detailed discussion of an April 2012 Bruges Group pamphlet by Bob Lyddon on The UK’s risks and exposure to the European Investment Bank and other European financial mechan- isms. There is no point in the 2013 edition repeating the discussion, but a brief section summarizes the key points.
‘Health tourism’
In most of the world, including the EU, health is financed by a mixture of taxation and private money, often with insurance arrangements. The NHS is different, in that it is ‘free at the point of delivery’. As already explained, the absence of charging mechanisms allows foreigners resident in the UK to take advantage of NHS treatments and facilities for which they have not paid by taxation.2 In that sense the long-term British are worse-off. To the extent that EU membership facilitates ‘health tourism’ of this kind, it contributes to the cost of health tourism for the British taxpayer.
How large is the problem? One view is that each immi-grant imposes an additional burden in terms of health costs which is no different, typically, from that of each long-term UK citizen. Further, since the heavy immigra-tion of recent years has mostly been of people who can and do find work, and since they must therefore be pay-ing tax, the whole question of health tourism is exag-gerated.3 A government estimate is that some abuse is to be found, but that the cost is minor in the wider picture. The lowest figure mentioned in this context is only £20 million. Jeremy Hunt, the Secretary of State for Health, has been quoted as giving a much higher figure of £200 million, but that is a fleabite compared with a total bill for the NHS of over £110 billion (i.e., £110,000 million, or over 500 times Hunt’s view of the cost of health tourism).4 However, Professor J. Meirion Thomas has claimed in articles in The Spectator and The Daily Mail that systems to limit improper use of the NHS by ineligible foreigners are ineffective. He has as-serted that, ‘as a senior consultant in the NHS who has researched this issue thoroughly, I believe the cost to the taxpayer to be billions of pounds annually.’5
The scaremongers do sometimes seem to rely too much on anecdote and gossip, and more rigorous evi-dence is needed.6 However, the £20 million and £200 million figures must be absurd. Part of the NHS budget consists of payments to foreign health services for treatments to British patients in their countries. In 2012 the bill presented to the NHS by other EU countries came to over £900 million.7 Anecdotal evidence has its weaknesses, but in this case the incentive for foreign-ers to seek free-at-the point-of-delivery health solutions in the UK is obvious. It is implausible that the value of treatment received by foreigners in the UK should be so dramatically less than the value of treatment received by the British abroad. More generally, suppose we assume that ‘foreigners’ (however that word is defined) make up 10% of the British resident population and use the NHS to the same degree as the long-term British. Then the cost of the health care provided to ‘foreign-ers’ is £11 billion, even if they are paying for it to some extent by means of taxation on incomes from work in the UK. Numbers like £20 million and £200 million are plainly under-estimates.8
Only approximate orders of magnitude can be estimat-ed. At present immigration from the EUA8 countries is a big talking-point. Most immigrants to the UK from the EUA8 are here because incomes are higher than in their own countries. They are also generally on low incomes by UK standards. They must therefore be paying less tax per worker than the average UK worker, while being fully entitled to NHS treatment when they have passed the residence test. Suppose that their average income is two-third that of long-term British workers, so that their tax payments would be – say – 55% as much. If EUA8 residents are assumed to be 2% of the UK popula-tion (which is somewhat less than their share of the UK workforce), then they are benefiting from the relatively low cost to them of the NHS by about £1 billion. Sure enough, numerous allegations are made about mothers
6. The costs of unforeseen commitments

53How much does the European Union cost Britain?
in late pregnancy coming to the UK ‘to exploit’ (there is no other word) NHS maternity services. Insofar as these mothers are coming from the rest of the EU, including long-standing EU member states and not just the EUA8, the UK taxpayer is ‘being taken for a ride’. But it is difficult to believe that the loss to the UK taxpayer is more than a few hundred millions pounds, say, £500 million at the outside. That gives perhaps £1½ billion as the maximum cost of the UK of health tourism arising from its EU membership.9 The reader should be warned that this is a very rough-and-ready figure.
‘Benefit tourism’
People’s freedom of movement in a fully-integrated European state – a Europe without borders – has always been an attractive aspect of the vision of ‘ever closer union’. Unfortunately, certain practicalities come in the way. In their respective nation states citizens have entitlement to social security benefits and state pensions, often – as in the UK’s case – because of many years of contributions to a fund of some sort.10 Suppose the citizens of other EU countries come to live and ostensibly to work in the UK. Suppose also that, for whatever reason, they suffer misfortune, lose their jobs and need social security benefits to survive. Should they receive such benefits or not? In many cases they may not have contributed to the UK’s national insurance system or indeed paid any meaningful tax in the UK whatsoever. But, as fellow citizens of EU member states, a case could be argued that they deserve benefits just as much as long-term British citizens and residents. As several newspapers have commented, if anyone from the EU can claim benefits in any member state, people are likely to migrate to wherever benefits are highest. People in the poorer EU states may indulge in a form of ‘benefits tourism’.
The European Commission is taking an active line on this question. The British government is opposed to making the UK’s social security net available to immi-grants from the rest of the EU, and it has the support of many other EU governments. But the Commission is taking our government, and the other governments, to the European Court of Justice on the grounds of break-ing freedom of movement legislation. The dispute is therefore between EU-based legislation and national social security rules. The precedents are not encourag-ing for the UK’s stance, since the ECJ has a track-record of favouring the cause of EU integration. As reported in The Daily Express on 12th July 2012, Chris Grayling, the UK employment minister had become anxious that, in his words, ‘The EU institutions seem to be taking us to a position where the members states are obliged to open their benefit systems to people coming from other countries – and that is not what any government wants at a time when budgets are tight. The European Court of Justice is consistently finding in favour of Europe over the right of the nation state. We’ve got a monumental clash between freedom of movement rules and social security rules.’
This is potentially a vast subject. British civil servants worry that the Commission may even try to extend, to everyone from an EU member state living in the UK, eli-gibility for the UK state pension. The Department of Work and Pensions is reported as having been angry about the Commission’s ‘underhand tactics’.11 The DWP has been reluctant to quantify how much is at stake, but an analy-sis was released in January 2012 showing that – from a total of 5.5 million welfare recipients – 371,000 were foreign-born claimants and 258,000 of these came from outside the European Economic Area.12 By implication, 113,000 came from the EEA and the great bulk of these (probably over 98%) would have been from the EU as such. Various assumptions could be made to obtain an estimate of the cost to the UK taxpayer. With 110,000 out of the UK’s 5.5 million welfare recipients coming from the rest of the EU, an assumption that the average amount received by this 110,000 group was two-thirds that of the typical claimant would give a cost of rather more than £2 billion a year (which is a bit more than 0.1% of GDP). In late 2011 and early 2012 the DWP did indeed put its name to estimates of about this size.13 However, later in 2012 there was considerable back-tracking. Surveys of immigrants who had qualified for benefit showed that the cost was much lower, at about £155 million a year.14 However, this could change enor-mously in future, depending on how the rules are set. Ultimately, the cost to UK-born British citizens of open-ing up our social security and pension arrangements to all-comers from the rest of the EU could run into many billions of pounds each year and the capitalized loss would amount to tens of billions.
Also to be mentioned here are the possible costs to lo-cal authorities of housing immigrants and their families if they cannot find suitable and affordable accommoda-tion. No doubt many of the reports of queue-jumping immigrants are exaggerated. Nevertheless, concern about immigrants’ eligibility for housing benefits spans the entire political spectrum. On 7th May 2013 The Guardian gave publicity to John Mann, the Labour MP for Bassetlaw in Nottinghamshire, who asked in a Labour Party publication, ‘How is it fair that a youth can be born in a council house, live in it for 18 years and lose out in allocation to a Polish family who have been in the country for a few months. How is this social justice? Why it is fair that a 58-year-old man, disabled from coalmining loses his incapacity benefit, but a family new to the country gets full housing benefit?.’15
What will now happen? Will the ECJ decide that the EU ‘freedom of movement’ principle requires the govern-ment to pay benefits to foreigners? No doubt most peo-ple in Britain would be furious if the Commission were to win its cases at the ECJ. There is an obvious injustice in British citizens being forced to pay taxes to finance benefits for foreigners that have only lived in the UK for a year or two, and may indeed have caused people of British birth to lose their jobs. (See chapter 4 of this study for more on the cost of lost UK jobs arising from EU membership.) But – if the UK government were to ignore the ECJ verdicts and restrict benefit payments

How much does the European Union cost Britain?54
to long-term contributors or according to a citizenship criterion – it would be in breach of European law. It would then become subject to fines, also potentially running into billions of pounds!
UK to face € billions of fines?
If this sounds far-fetched, note that fines have been levied on UK public sector bodies for not flying the EU flag or mentioning money received from, for example, the European Regional Development Fund. Doncaster Council has had to pay £5,250 for ‘failure to advertise ERDF support during a radio’ announcement. In recent years the Commission is reported as having ‘punished dozens of British organizations for failing to display the EU’s branding [flag, logo and so on]’.)16 The notion of a supposedly sovereign state being fined for events with-in its own borders by a foreign judiciary would be funny if it were not true. Undoubtedly many people in Britain find the whole thing peculiar or even farcical. Britain has an army, the Royal Navy, the Royal Air Force, a so-called ‘independent’ nuclear deterrent, and a national anthem, and it wins gold medals at the Olympics. How on earth can it be fined by ‘euro-crat’ officials, acting at the behest of a court decision reached in another country? However, according to a story in The Daily Telegraph on 19th January 2011 the National Audit Office had at that stage identified £398 million of fines already paid and another £601 million of money set aside for future payments of fines. (Hence the story’s headline, which was ‘Britain faces £1 billion of EU fines’.)
These fines related to misspending by the Treasury, that is, by British central government. On top of that the Local Government Association has expressed concern that local councils ‘could face fines of up to £1 billion a year under’ plans put forward by the Coalition government. The association raised the issue, because it feared that the government’s Localism Bill broke EU rules (i.e., the acquis communautaire). Finally, as already noted the EU could fine the UK because it did not pay welfare benefits to citizens from other EU countries that had come to live and work in the UK.17
Fall-out from Eurozone break-up
Although in the long run it would be beneficial in that nations could again organize monetary policy according to their own macroeconomic circumstances, the break-up of the Eurozone would have disastrous initial effects on the European economy. One such effect would be that the countries with large debts to the European Central Bank and the European Stability Mechanism could not pay back those debts, and they would have to be written off.18 The resulting loss to the creditor na-tions would run into hundreds of billions of euros. They are a massive contingent liability, and the taxpayers of Germany, the Netherlands and Finland are rightly con-cerned about these matters. Fortunately, the UK would not be directly affected, because it has not joined the
single currency area. It does not have a treaty obligation to recapitalize the ECB or the ESM.
But there is a separate institution which does deserve a few sentences. The UK has long been a shareholder in another EU supranational financial institution, the European Investment Bank. (The EIB describes itself as ‘the European Union’s bank’, with its job being not to maximise profits, but to promote the EU’s objectives.) In his 2012 Bruges Group pamphlet Bob Lyddon argued that the EIB’s assets were of such low-quality that a proportion might have to be written off. The UK might then have to take a loss on its past investment in the EIB, while also injecting new capital. The ‘bill’ might theoretically be €35.7 billion, according to Lyddon. The point needs to be noted, although – in the author’s view – a figure as high as €35.7 billion is hypothetical and highly implausible. At the end of 2012 the EIB’s loans outstanding were €413.4 billion, but its accounts said that it was profitable and had indeed been profitable for many years. Its ‘own funds’, the capital owed to the shareholder governments partly because of retentions of past profits, amounted to €55.2 billion. This was in fact well above the initial investment of ‘paid-in capital’ of €21.6 billion.
Summing-up
It is time to bring this chapter to an end. A range of unforeseen spending commitments and contingent liabilities have arisen as a by-product of the UK’s participation in European integration. The possible costs to the UK state reflect the tensions and misunderstand-ings due to having two ‘governments’ (i.e., a government in the national capital, and a separate and to a significant degree competing government in Brussels) for one ‘sovereign’ country. A reasonable view is that the UK needs to set aside another ¼% of GDP each year for these unforeseen spending commitments and possible liabilities.

55How much does the European Union cost Britain?
1 The word ‘foreigner’ is ambiguous and appears in quotation marks. Of course they are people and to be respected, just as the British are people and to be respected. But that does not make redundant the notion of a British government overseeing British public policy for the benefit of the British people.2 People of foreign birth must be ‘ordinarily resident’ in order to qualify for NHS treatment, which is sometimes interpreted to mean ‘resident for longer than a year’. Places on UK general practitioner lists are apparently highly valued by some foreigners. In October 2012 the BBC Panorama programme reported a NHS practice manager selling registrations for £800 a time. Once registered, a foreigner can be treated at a UK hospital. Stephen Adams ‘“Health tourists” paying £800 for an illegal place on GPs’ lists’, The Daily Telegraph, 3rd October 2012. 3 Jonathan Wadsworth ‘Mustn’t grumble: immigration, health and health service use in the UK and Germany’, Fiscal Studies (London: Institute for Fiscal Studies), vol. 34, no. 1, 2013, pp. 55 – 82. 4 ‘In 2011/12 the NHS officially spent £33 million on treating foreign nationals, £21 million of which was recovered. This means that just £12 million, or 0.01% of the health service’s £109 billion annual budget, was lost to “health tourists”. In March, when David Cameron raised the issue in his speech on immigration, Hunt claimed that the true figure was £200 million, but produced no evidence to support his claim.’ The quotation is from an article on ‘How much does “health tourism” actually cost the NHS?’ by George Eaton in New Statesman, 30th June 2013. 5 Professor J. Meirion Thomas ‘A £200 bill won’t stop foreigners abusing our NHS’, The Daily Mail, 4th July 2013 and ‘International health service’, The Spectator, 6th April 2013.6 Sue Reid ‘Yesterday the Mail revealed health tourism is costing the NHS “billions”’, The Daily Mail, 5th April 2013.7 Ted Jeory ‘Cost to NHS of Britons abroad soars to £1 billion’, The Sunday Express, 2nd June 2013. 8 The £20 million number may relate to treatment provided to tourists as such! But this totally misunderstands the meaning of the phrase ‘health tourism’. The phrase refers to the failure of the British state to recover the cost of treatment and care to visiting or semi-resident foreigners who would certainly not be eligible for that treatment and care if they were only tourists! The 10% figure in the text was not chosen at random. Records are maintained of so-called ‘Flag 4s registrations’ with general practitioners. These are provided to the Office for National Statistics from the Patient Register Data Service (PRDS) data collated by the NHS Connecting for Health (NHSCfH) function. Flag 4s are codes within the PRDS system which indicate that someone who has registered with a GP in England and Wales was previously living overseas. In 2010 Flag 4s GP registrations were 11% of all GP registrations in England and Wales, according to the ONS website. 9 Note that the total cost of health tourism may be appreciably higher because of patients from outside the EU seeking NHS treatment, but that is not the direct concern of this publication. 10 In the UK national insurance contributions are in form contributions to the National Insurance Fund, with legislation prescribing that the fund should be run on an actuarially sound basis. The reality nowadays is somewhat different, but books on the subject still refer to ‘the contributory principle’ of the original Beveridge welfare state.11 Martyn Brown ‘All migrants to get a British pension’, The Daily Mail, 7th May 2012. 12 Robert Winnett ‘370,000 migrants on the dole’, The Daily Telegraph, 19th January 2012. 13 A story by Macer Hall in The Daily Express on 6th December 2011 gave a figure of £2½ billion a year, and seems to have been guided by information from the Department of Work and Pensions. 14 Brian Wheeler ‘Iain Duncan Smith’s £2 bn. benefit tourism estimate cut by 92%’, BBC News online: Politics section, 14th September 2012. 15 Patrick Wintour ‘Restrict EU immigrants’ access to benefits, says pro-Europe group’, The Guardian, 7th may 2013.16 Glen Owen ‘Brussels orders EU flag must fly over Whitehall’, The Daily Mail, 28th April 2012. 17 See the story by Macer Hall mentioned above in footnote 9. The Daily Express story says that the EU directive being interpreted by the ECJ accepts that eligibility for benefits does not extend to those areas of the welfare system where such benefits arise from a contributions record at the national level (i.e., from the UK’s National Insurance so-called ‘system’). Fine, but ‘the contributory principle’ has now been diluted in the UK almost to meaninglessness. (See footnote 10, and the related discussion in the main text, above.) The ECJ seems to believe that the EU directive applies to Child Benefit, Child Tax Credit, State Pension Credit, Income-based Jobseekers’ Allowance, and Income-based Employment and Support Allowance! Evidently, if the UK accepts the ECJ verdict (and as a member of the EU it has no choice, unless Her Majesty’s Government is prepared to break ‘the law’, i.e., the law contained in the acquis communautaire, refuse the pay the EU fines and so on), the UK taxpayer could every year be paying billions of pounds of year to people who are not British by birth or citizenship, but happen to comply with a UK residence criterion of some sort. 18 The author is taking it for granted that the debts of a nation’s banking system to the ECB (i.e., its net debtor position in the TARGET system of inter-bank settlement) would in practice become the debts of the nation as such.

How much does the European Union cost Britain?56
It is now time to bring the strands of the analysis together. There is no single, exact number for the dam-age that EU membership does the UK, but vast damage has been done. Chapter 1 established that, reasonably interpreted, the direct fiscal cost of the UK’s EU mem-bership is now 1¼% of gross domestic product each year; chapter 2 examined the damage of EU regulation in terms of employment and energy use, and in the international financial sector (i.e., ‘the City’), and also discussed small business closures because of sub-stance and product authorisation regulations, and arrived at a number of between 5% and 6% of GDP each year at present, but growing over time; chapter 3 borrowed from sophisticated modelling work by the OECD and Minford to reach an estimate that resource misallocation due to the EU’s trade regime costs the UK over 3% of its GDP each year; chapter 4 argued that, because the UK labour market had been too open to immigration from Eastern Europe due to our EU membership, over 100,000 UK-born people had been without jobs over a significant length of time, with a cost that may be difficult to quantify precisely, but might be 3/8% of GDP for the relevant period; chapter 5 surveyed the costs of waste, fraud and corruption, and argued that the Common Fisheries Policy, the Com-mon Agricultural Policy, environmental directives, and fraud and corruption in EU- or EU-related administration led to waste that in total might be 3/8% of GDP; and chapter 6 looked at actual and potential losses from ‘health tourism’, ‘benefit tourism’, fines from the
European Court of Justice and ‘contingent liabilities’, which added another ¼% of GDP. So we can now add up the numbers and reach our answer. It is 11% of GDP. The precision of the figure should not be pressed too far, but – as a ballpark number – this is about right. Roughly speaking, the UK is worse-off each year by a bit more than a tenth of its national output because it is a member of the EU. It would be appreciably better-off if it left the EU and became, like most of the world’s countries, indepen- dent and sovereign except for the obligations involved in belonging to the World Trade Organization, the IMF and so on. The vital role of these institutions needs to be re-membered. The proposal to leave the EU is emphatically not an exercise in ‘little England-ism’. On the contrary, it recognises that the supranational and multilateral institutions set up in the mid-1940s have been vital to global peace and prosperity in the last few decades.
Understanding the 11% figure: a flow relative to GDP
In one of the paragraphs above the phrase ‘each year’ followed the cost estimate. This was necessary, so that the cost could be compared with the UK’s annual GDP. The word ‘cost’ does need to be qualified and pinned down in this way, as it is sometimes used without suffi-cient care. What kinds of misuse are we thinking about?
7. The total cost: roughly 11% of national output
Table 7.1: Summary of the costs to the UK of its EU membership
Nature of cost % of Rationale GDP (In all cases, see relevant chapter for detailed argument).
Direct fiscal cost 1¼ Relatively easy to quantify from official publications and balance-of-payments data; concept is of gross payments to EU institutions over which UK government has no further control.
Costs of regulation 5½ Reduced employment due to ‘Social Chapter’-type legislation, cost of renewables agenda and financial regulation, businesses closed because of substance and procedure regulations.
Costs of resource 3¼ CAP long recognised to cause large resource misallocation. misallocation This may now be only ½% of GDP, but other EU protectionism estimated by Minford et al 2005 to cost further 3% of GDP.
Cost of lost jobs Open UK labour market from 2004 allowed in 700,000 Eastern Europeans, taking away jobs of over 100,000 UK-born people; labour market soon to open to Bulgaria and Romania.
Costs of waste, CFP involves fish discard and effective ‘gift’ to other nations of fraud and corruption fishing rights in UK territorial waters, but cost under 0.1% of GDP; waste under pillar 2 of CAP; waste of over-prescriptive water standards; abuse of UK student loan system
Unforeseen ¼ Costs of ‘health tourism’ and ‘benefits tourism’, plus some allowance Commitments for possible recapitalization of EU institutions
Total 11 Conclusion: the UK is about 11% of GDP worse-off because of its membership of the EU.
3 8
3 8

57How much does the European Union cost Britain?
First, the ‘cost’ may be a one-off hit of some sort. A particular interpretation of an EU regulation may cause harm in a particular year, but not be on-going1; or the demand for the capitalization or recapitalization of an EU institution may be a once-for-all event; or the UK may be asked to contribute to an EU-sponsored emer-gency foreign aid package to a country devastated by civil war or famine, where the civil war or famine are not expected to go on for ever; and so on. One-off hits are not included in the 11% number, because it is difficultto allow for them. Arguably, the annual figure should include an allowance for the expected probability in any one-year period of one-off hits.
Secondly, the cost is an annual number (i.e., the flow in a one-year period), not a capital value (i.e., a number – like a net present value of discounted costs – which attempts to calculate one number for the stock of dis-advantages to the UK of EU membership, in effect, a number that expresses the cost ‘for all time’). Estimates of the capital value raise many uncertainties. Policies may change at a later date, while the discount rate applied to costs in future years is contentious. In some of the footnotes to these pages crude attempts have been made at capitalization, particularly where the damaging effect of regulations is cumulative and the current year understates the cost to the UK.2 The preference has been for a high rate of discount, because of all the imponderables. Nevertheless, there can be little doubt that the UK’s membership of the EU – which is now defensible only on political grounds (see below) – has an economic cost, in capital terms, running into the trillions of pounds.3
Understanding the 11% figure: the problem of the counterfactual
A fundamental criticism of the analysis here, and particularly of the analyses in chapters 2 and 3, is that the costs are overstated because the counterfactual – the situation in which the UK has left the EU – has not been adequately spelt out and explained. Specifically, as regards the costs of regulation, UK departure from the EU would not mean that the UK’s industries were totally unregulated and estimates of the cost of EU membership depend on the assumptions made about the severity of the UK’s domestic regulatory regimes if we were outside the EU. Cynics might suggest that the UK would have ferociously tight regulation, which would hurt British industry and finance even more than EU regulation. The same kind of objection can be made to this study’s estimate of the costs of resource misallocation. The UK’s departure from the EU would allow us to adopt unilateral free trade, which economists tend to regard as the best policy, but in the hurly-burly of practical politics there is no guarantee that – outside the EU – the UK would in fact be a free-trade nation. (It was not before 1973.) So the estimates of the cost of resource misallocation made in this study can be at-tacked for falsely taking for granted that the alternative to EU membership would be free trade.
The problem of the counterfactual is basic not only to any discussion of the UK’s membership of the EU, but also to the yet more fundamental debates on the right governing ‘philosophy’ for the UK as a nation and its general geo-political stance. Implicitly in this study it is assumed that Britain is, above all, a nation with an enduring ‘public philosophy’ that upholds the freedom of the individual and the non-discriminatory rule of law.4 Further understood commitments are to the free market economy and, hence, to the defence of private property rights. Given that, the implicit counterfactual in the cost estimates in this study is that, outside the EU, the UK would be a free-trade nation with light regu-lations and low taxes. Of course that counterfactual is open to review and criticism.
A further clarification must also be emphasized here. To say that the cost to the UK of EU membership is about 11% of GDP is not to claim that, within hours of our exit from the EU, everyone in our country would better-off – visibly and without further ado – by that amount. It is not that incomes would be higher at the next pay date by 11%, while prices would be the same. That is not what is being said. By exiting the EU, the UK would indeed be moving – within relatively short order – to saving almost 1% of GDP, because it would not have to pay the direct fiscal cost discussed in chapter 1.5 Within a year or two we would gain from preventing benefits and health ‘tourism’, we would stop the fish discards, we would adopt more sensible water standards and so on, and we would chuck the ECJ fine notices in the bin. Altogether we are talking about perhaps another ½% - 1% of GDP quite quickly.
But the savings from unravelling the acquis (and dis-carding it with the debris of the dead fish in the North Sea, where many of the regulations belong) would take several years to emerge, while the welfare improve-ments from improved resource allocation would never appear in a pay cheque or a profit-and-loss statement. The gains from improved resource allocation would nevertheless be real enough and would be evident in, for example, a sharp fall in the relative price of food and increased purchasing power. Over five or ten years the British people would see a material improvement in their living standards from leaving the EU, and their economy would move onto a higher growth path. Small businesses that have closed because of EU regulations would re-open, jobs ended because of burdensome ‘social’ legislation would be advertised and filled again, factories shut because of excessive energy bills would be rebuilt, and so on.
Understanding the 11% figure: the effect on the budget deficit
In the year since the 2012 edition of this study was published, the author has come across a recurrent misunderstanding of its analysis. The 11%-of-GDP figure is the economic cost to Britain as a nation. The concept of the economy of a nation has to be sharply

How much does the European Union cost Britain?58
distinguished from the public finances of that nation. Fortunately, nations are much more than their govern-ments, while the wealth of a nation is ultimately owned only by its people as individuals and is a high multiple of public debt.
The misunderstanding is to think that the 11%-of-GDP cost is the cost to government. A leap is then made to conclude that, if we left the EU, the whole £165 billion would be available ‘to reduce the budget deficit’. Sorry, no, that is not the case. If we left the EU, the budget deficit would indeed decline as a result, in two main ways. First, as already noted, both the UK as a nation and the UK government would save in short order about 1% of GDP from ending our financial contributions to EU institutions (i.e., the ‘direct fiscal cost’ discussed in chapter one), and there would also quite quickly be the savings from avoiding ‘health tourism’, ‘benefit tourism’, the ECJ fines and so on. But overall we are talking at most of 1½% - 2% of GDP of direct and fairly early benefit to the budget balance. Second, the ditching of the acquis communautaire would – also as explained – be followed by the return of small businesses, the renewed employment of people forced out of jobs by excessive regulation, the rebuilding of factories, and so on. After, say, a decade outside the EU the regulatory cost of EU membership (i.e., the 5% - 6% of GDP discussed in chapter 2) would no long-er handicap the economy. It would be history. In that decade growth would be ½% a year higher than it would have been inside the EU, and the level of full-employment output at its end would be about 5% more. Some of that output would be paid to the government in the form of taxation, with 40% being a reasonable proportion to assume. So the tax take would be 2% of GDP higher (i.e., 40% of the 5% uplift to national output).
Leaving the EU would help is restoring balance to the UK’s public finances. A side-effect of withdrawal would be a big reduction in the budget deficit, which is now over 7% of GDP. Roughly a halving of the deficit might be envisaged. But the 11%-of-GDP cost of EU member-ship is the cost to Britain as a nation, largely from over-regulation and resource misallocation, and this must not be confused with the direct fiscal cost to the British government.
Benefits of EU membership?
Enthusiasts for the UK’s continued membership of the EU may counter that our answer is one-sided, because no benefits have been identified and the benefits have not been balanced against the costs. But that begs the question, ‘what economic benefits does the UK receive from EU membership?’. (The politics are another matter and are mentioned briefly in the final section.)
The only serious answer that the Europhiles give – in-deed, the only substantive benefit that the UK could be said to receive from EU membership – is that British
companies enjoy free trade in industrial products with their most immediate neighbours. To the extent that the EEC/EU has promoted industrial free trade since its founding in 1957, the citizens of Britain and the rest of European should be grateful to it. When in a 2004 speech to the CBI, the pro-EU politician, Peter Mandel-son, wanted to identify something to offset the cost of EU regulations to business, it was entirely understand-able that he should point to the benefits of the single European market.
It was true that in the early 1970s, when the UK sought Common Market membership, the full opening of the EEC area to British companies would prove advanta-geous to the UK.6 But that was 40 years ago, when in-ternational trade was still hampered by high tariff barri-ers and other restrictions. Today the situation is utterly different, because of radical trade liberalization across the globe. Before the Tokyo Round of trade liberaliza-tion under GATT auspices, which ran from 1973 to 1979, many tariffs on industrial products were in the 10% - 20% area, with effective rates of protection sometimes being well over 30%.7 The Tokyo Round brought tariffs down to under 5% in principle. The next round – known as ‘the Uruguay Round’ – lowered tariffs further and also extended the key principles of the GATT to trade in services.8
But another trend was perhaps yet more important than the GATT trade rounds. From the 1980s onwards the governing elites of many developing countries, includ-ing such formerly (or nominally) communist countries as China, realized that unilateral trade liberalization was of enormous economic benefit. The result has been a radical transformation of the international business en-vironment. In the early 1970s the European Common Market was an oasis of (relatively) free trade in a world where virtually entire continents, including most of Asia and Latin America, were deserts of protectionism. To-day the EU’s single market may be larger and more at-tractive for British companies than the Common Market was in the late 1970s and early 1980s, but the differ-ence is hardly revolutionary. Much more important, countries that were virtually closed to British exporters in the early 1970s, such as China, Russia and Brazil, are now quite open to our products. The European single market, with its free-trade arena in our backyard, is not the only ‘game in town’. In effect, industrial free trade has become available globally.
Free trade with the EU, but outside it
This is not to deny that, if the UK’s exit from the EU led to the end of industrial free trade with existing EU member states, the UK would lose valuable gains from trade. The logic is straightforward, and we can appeal again – as in chapter 3 – to Adam Smith’s ex-position in The Wealth of Nations. If late-18th-century Scotland had slapped 2,000% tariffs on imports of wine, grapes might have been grown in ‘glasses, hotbeds and hot walls’, to recall Smith’s words, and wine might be

59How much does the European Union cost Britain?
Importance of EU trade surplus with UK
The UK is a massive exporter of goods and services to the rest of the EU. In 2011 these exports totalled over £222 billion. However, it is an even larger importer. In 2011 imports from other EU member states came to about £266½ billion. Further, people and companies in the EU27 (i.e. the EU without the UK) have made vast investments in the UK, owning, for example, big stakes in the various utility industries. Last year the EU27 re-ceived £74.1 billion in income from their investments in the UK, whereas the UK received £46.8 billion in income from its investments in the EU27. So other EU mem-ber states had a surplus on their transactions with us of altogether £71.6 billion, not much less than 5% of what we produce as a nation.11 Of course, relative to the economies of the other member states, £71.6 billion is much smaller, a bit more than ½% of their combined GDPs. Nevertheless, a surplus of ½% or so is worth having, particularly in the current global context when the financing of external deficits has become far more problematic than it was before the Great Recession.
Suppose that the UK has left the EU. Suppose also that the UK has indicated to the other member states that it has every wish to maintain friendly and close trade re-lations. The aim would be that European exporters can sell as easily to British customers, and British exporters can sell as easily to European customers, as at present. Would the other EU member states (‘the 27’) be inclined to turn us down? The answer must be ‘of course not’. Precisely because they have a surplus on their trade with us, they have more to lose from ‘a trade war’ than we have. (And heaven forbid that the phrase ‘trade war’ has to be much repeated in this context.) The existence of a surplus on their trade with us must bias the 27 to want the retention of industrial free trade with the UK. In other words, outside the EU, the one aspect of our interaction with the EU membership that is genuinely beneficial – free trade in goods and services (outside the contentious areas of farming and fisheries) – would still be available to us.
In his 2004 speech to the CBI Mandelson said the sin-gle market was worth about 2% of GDP to the UK and contended that this benefit of EU membership had to be weighed in the balance against the cost of regula-tion, which was 4% of GDP. His claim does not stand up. The benefit of industrial free trade with our European neighbours can be enjoyed outside the EU, just as read-ily as it can be enjoyed inside it. A common argument in British political debate is that the UK must belong to the EU in order to participate in the industrial free trade that accompanies ‘the single market’. That argument is bogus. Sure, in exporting to the EU27 British companies would have to meet the EU’s regulatory requirements. But we can negotiate over the content of these regula-tions, just as Mexico, Israel and Japan have done in their FTAs. More generally, British companies have to meet national regulatory requirements when they export to the USA, China or India. But no one has proposed that the UK has to embrace full-scale political union with
made from the grapes and a prodigious application of labour. But Scotland would have been far poorer than if it had imported wine from Spain and Portugal, and paid for the imports of wine with exports of whisky. In general, nations benefit from specializing ‘according to comparative advantage’.9 Whether the UK is inside or outside the EU, we should want free trade with our European neighbours.
Europhiles sometimes talk as if the UK’s exit from the EU would leave us ‘isolated’, and hence in some sense marginalized and poorer.10 The severing of trade ties would indeed be a calamity, for both the UK and the rest of Europe, if that were to accompany our leaving the EU. But no diminution of trade is necessary or to be expected. First, the EU has industrial free trade with Norway, Switzerland and Turkey, and none of these three countries is an EU member. As the trade regime with the EU varies for each of the countries, and as the variations are complex and idiosyncratic, there is no space to go into detail here. But their prosperity demonstrates that EU membership is not a condition for close and exten-sive trade interaction with EU members, even for na-tions that are geographically in the European orbit. (Nor-way, Switzerland Turkey have all enjoyed substantial increases in income per head, at current prices and ex- change rates, relative to the EU in the last 10 to 15 years.)
Secondly, and much more fundamentally, the EU has reached free trade agreements with nations that are distant from Europe, in terms of both geography and culture. Two salient such agreements are those with Israel, signed in 1995, but taking effect in 2000, and Mexico, agreed in 2000. In both cases industrial free trade is the heart of the FTA. At present negotiations are under way with the USA and Japan over a FTA. Ample precedent has therefore been set for the negotiation of a FTA between the UK and the continuing members of the EU, once the UK had left. If the EU is interested in free trade with Norway, Switzerland and Turkey, and even in free trade with Japan, Mexico and Israel, then it should be interested in free trade with the UK. Indeed, if the EU were not interested in a FTA with the UK once the UK had regained its independence, the whole basis of international cooperation since the 1950s would be challenged. There have been many lapses, by a large number of nations, from the free-trading ideal since the GATT began its work in the late 1940s. Nevertheless, on balance nations have eliminated tariff and non-tariff barriers to trade, trade has expanded faster than out-put, and living standards have increased everywhere as nations specialize according to comparative advan-tage. Surely, it would be bizarre for the EU to maintain FTAs with such nations as Mexico and Israel, and yet to refuse to contemplate a FTA with the UK. Further, one vital consideration – discussed in the next section – suggests that the EU would be foolish to disdain a FTA with us. Indeed, this consideration argues that open EU discrimination against goods and services exported from a fully independent UK would be so counter-pro-ductive as to be crazy.

How much does the European Union cost Britain?60
the USA, China or India in order for these exports to be acceptable in these important foreign markets.
Rising cost of EU membership
So the UK can escape the heavy costs of the EU’s regu-latory apparatus and other EU-related burdens by leav-ing the EU, and it can still secure the free trade with its neighbours that it has always wanted. If the Europhiles deny this proposition, can they perhaps explain the will-ingness – indeed the apparent keenness – of the EU bu-reaucracy to negotiate free trade arrangements with a variety of countries (i.e., Mexico, Israel and Japan) which are more remote from the EU than the UK and have far less trade with it? But this hints at a puzzle. Why do any nations belong to the EU? The same kind of calcula-tions done in this study for the UK can be done for all the member states. Given the force of the analysis, in most cases the economic case for withdrawal is likely to be clear-cut.12 No doubt much of the explanation is to be sought in institutional inertia and popular apathy in virtually all the member states, and – for Germany and the East European countries – EU membership can perhaps be justified by geopolitics and history. (‘They are “too close” to Russia’, ‘Germany must atone for its past’, etc.) But also relevant is that the cost of EU mem-bership has been rising over the decades. This trend has been slow and unobtrusive, and commentators have taken time to appreciate the damage being done. Only
in the last few years has the EU’s image and reputation deteriorated significantly.
In the early years of the ‘European construction’ the move towards industrial free trade conferred sub-stantial benefits on the original six members, causing widespread anxiety in the UK about relative economic decline. The British people ‘joined the Common Market’ because they were afraid that their country was be-coming ‘the poor man of Europe’. In the 1970s and early 1980s the economic pluses and minuses of EU mem-bership were indeed relatively balanced. The UK par-ticipated in and gained from the free trade area, while paying less in its fiscal contribution (relative to GDP) than today and postponing the implementation of such iniquities as the Common Fisheries Policy. If this study had been carried out in, say, 1983, it would not have reached such a negative verdict about EU membership. Here we come to a key point: the costs have increased since the late 1980s, mostly because the proliferation of regulations at the EU level of European ‘government’ has competed with and gained ground from existing regulations at the national level.
The wave of over-regulation is hardly secret. To quote from a recent press statement by John Longworth, the director-general of the British Chambers of Commerce, ‘British firms seem to feel that the balance of advan-tage of EU membership is lessening…[O]ne third of firms think that the negatives associated with…regula-
Exports to rest of the EUImports from rest of the EU
0
50
100
150
200
250
300
1997 1999 2001 2003 2005 2007 2009 2011
The UK’s trade deficit with the rest of the EU Chart shows annual trade totals, in £b., with rest of the EU
2013

61How much does the European Union cost Britain?
tion outweigh the benefits of the single market’.13 In-deed, British business regards some new EU directives as downright nutty. Last year the European Parliament considered a directive which would require companies to measure employee happiness before and after a layoff. According to The Daily Telegraph (16th August, 2012), ‘The rules, drafted by Spanish MEP Alejandro Cer-cas, would make it mandatory for workplaces across the Union to assess mental health after redundancy. The results of such tests would then be used to deter-mine if an employer should provide retraining, interview coaching and general job-seeking counsel to former employees.’ A representative from the Engineering Employers Federation described the idea as ‘ridiculous’.
The proliferation of regulations began with the 1986 Single European Act. The Single European Act was the first major transfer of competences to EU institutions since the founding treaties, as the then president of the Commission, Jacques Delors, was fully aware. The transfer of competences, and the proliferation of regu-lations, received further momentum in a sequence of further treaties, notably the Maastricht Treaty of 1992, the Amsterdam Treaty of 1997 and the Nice Treaty of 2000, with the process culminating in the Lisbon Treaty of 2007. In the early 1980s, the era of so-called ‘eurosclerosis’, most key government decisions on the European continent were taken in national capitals, and the different nations had distinctive legal and regulatory structures. Today the situation has been transformed.
So many competences are now in the hands of EU institutions that most top policy decisions in the ‘domestic’ area (i.e., apart from foreign policy, diplomatic and military decisions) are taken in Brussels. Meanwhile the EU purports to have in the acquis communautaire a regulatory and legal framework for virtually the entire continent, with no regard for national boundaries.
This study has identified the heavy cost of the regula-tory acquis as the biggest single cost to the UK of its EU membership. That message emerged in chapter 2 and is clear from Table 7.1. By implication, the drift of power to the Brussels bureaucracy since 1986 has been a disaster. Clearly, if it has been a disaster for the UK, it ought also to have been a disaster for other EU member states. The chart below shows the ‘trend’ rate of eco-nomic growth in the three largest original members of ‘the European construction’ (i.e., Germany, France and Italy) since 1984. (The ‘trend’ is taken – for simplicity – as the five-year moving average of the annual % rates of change. So the value for 1984 is the average of the growth rates in the period 1980 – 84 inclusive. More sophisticated methods of de-trending would no doubt have led to smoother lines, but the direction of the lines would certainly still have been downwards.) Many other forces have been at work to depress economic growth in this period. Even so, if the transfer of competences to EU institutions is supposed to have been an answer to ‘eurosclerosis’, some hard thinking now needs to be
FranceGermanyItaly
-2
-1
1
0
3
2
4
5
1984 1986 1988 1990 1992 1994 1996 1998 2000 2002 2004 2006 2008 2010 2012
‘Trend’ output growth in the three largest economies of the original Common Market ‘Six’ Chart shows five-year moving average of annual % GDP rates of change
2013

How much does the European Union cost Britain?62
done. Economic growth in the original six members of the Common Market has come almost to a complete halt. (Growth continues in Eastern Europe, as the nations there have much catching-up still to do relative to Western Europe.) The truth is that the cost of EU membership has been rising for all of the member states and not just the UK.
What about the politics of exit?
Britain’s membership of the EU has a heavy econom-ic cost. A large number of criticisms can of course be levelled against the analysis in this study, and some of the particular lines of argument and methods of calculation may be wrong. Nevertheless, the main features of the analysis are robust, in that they have been put together from a range of sources that both Europhiles and Europhobes recognize in discussing these topics. The conclusion has been that EU member-ship costs the UK a bit more than a tenth of its annual output. But – even if that number were halved – it would still be too high and unacceptable. The economic case for leaving the EU is overwhelming. Admittedly, the cost estimate made in this publication is at the high end of quite a wide spectrum.14 But it fits with other evidence, particularly in the collapse in the EU’s and Eurozone’s shares of world output in the last 25 years.15
The focus here has been on economics, not politics. Enthusiasts for the UK’s membership of the EU might counter that the case for staying in is essentially political in character. They might contend that European integration under the EEC/EU ‘brand’ has kept the continent at peace for over 50 years. They might further claim that the facts of geography dictate that the UK’s most enduring geopolitical commitments must be to the rest of Europe. This sort of rhetoric is often accompanied by claims that the UK must ‘sit at the top table’ and that it would lose international influence if it were ‘by itself’, out of the EU. As the present study is long enough already, this is not the place to put forward the political argument for withdrawal. The political argument for withdrawal may in fact be
stronger than the economic. An imperative of the UK debate on ‘our place in the world’ must be to recall the distinctive constitutional and legal arrangements that until 1973 had served our country so well for centu-ries. Those arrangements (such as habeas corpus and trial by jury) are now being sidelined and forgotten in a European super-state.
The political case for leaving the EU is for another time and a separate piece of work. It cannot be emphasized too strongly that, when the UK joined ‘the Common Market’ in 1973, the benefits for the British people were sold as being predominantly economic in nature. Advocates of entry insisted, on numerous occasions, that national independence and sovereignty would be safeguarded. Events have shown that national independ-ence and sovereignty were at risk, while the economic costs have exceeded the benefits by an ever-widening margin. As more people suffer from EU regulations, with jobs lost and livelihoods shattered, disillusionment and hostility are growing. Sooner or later a referendum on the UK’s membership of the EU will have to be held. A huge debate on the UK’s position in Europe is certain to precede the referendum. This study has established that, from an economic standpoint, the case for with-drawal is overwhelming. In the 2010 edition of this study Gerard Batten put down a challenge. To quote, ‘If the Coalition government believe that membership of the EU is financially and economically beneficial to Britain, then let them commission an independent cost-benefit analysis to prove it’.16 Quite so. Let all the facts and figures relevant to the UK’s EU membership be compiled and assessed by a group of well-qualified and unbiased experts, and let us see their verdict.
For over 40 years officialdom has lied to the British people about the UK’s membership of the EEC and the EU. They must be told the truth. The analysis in this document has at times been complex and technical, and may not always have been easy to follow. But its consistent purpose has been to tell the truth. To repeat its central conclusion, from an economic standpoint, the case for the UK’s withdrawal from the European Union is overwhelming.

63How much does the European Union cost Britain?
1 ‘Rare algae halts £160m. dock plan’, The Daily Telegraph, 26th March 2011. ‘A £160 million dockside regeneration scheme that would create 800 jobs has been blocked by a EU ruling to protect algae on the seabed.’ The losses from this EU intervention may be deplorable, but they are one-off, not recurrent. 2 See footnote 21 to chapter 2 above.
4 Winston Churchill, almost invariably regarded as the greatest British statesmen of the 20th century, highlighted the freedom of the individual and the rule of law as hallmarks of the British contribution to progress. 5 An awkward difficulty here is that the Lisbon Treaty provides for a two-year period of departure from the EU, with a national government having to confer with the Council of Ministers and agree to the modalities! There are limits to the range of topics this pamphlet can sensibly discuss. 6 Let it not be forgotten that some companies had difficulty standing up to the new competition from other European countries on EEC entry, and had to contract or close down operations. The car industry was the most conspicuous example. But overall economic efficiency improved because the UK concentrated its resources in activities where it was particularly productive.7 ‘GATT’ of course denotes ‘the General Agreement on Tariffs and Trade’. The ‘effective’ rates of protection for a particular industry can be much higher than the apparent published rate, because tariffs are also levied on imports that are raw materials or other inputs to that industry’s and competing industries’ production.8 The key principles of the GATT, and nowadays of the World Trade Organization, are non-discrimination between trade partners, and avoidance of artificial state support for exporting and import-competing industries. The latest round of trade liberalization – the so-called ‘Doha round’ – has stalled. The pattern today is for bilateral ‘free trade agreements’ between governments rather than multilateral liberalization under WTO auspices. There is no room here to discuss this possibly worrying development, which is a retreat from the liberal internationalism promoted by the key post-war institutions (i.e., the GATT, the IMF and so on). Razeen Sally Trade Policy, New Century (London: Institute of Economic Affairs, 2008) covers the ground. 9 ‘Comparative advantage’ is a difficult and far from intuitive idea. A country is said to have a comparative advantage in a particular line of production if the opportunity cost of that production is lower than in another country (or in the world as a whole). The key point is that a nation may be more inefficient relative to its trading partners, in absolute terms of the inputs required, in the production of everything. Nevertheless, it makes sense for that nation to specialize in its area ‘of comparative advantage’, to sell to its more efficient partner(s) and to buy other things from it/them. For example, Sir James Goldsmith would almost certainly have been a first-rate personal secretary. That is, he would have been good at taking shorthand, organizing filing systems, putting together Christmas card lists and so on. But the more time he had spent on shorthand, Christmas cards and so on, the less time he would have had for negotiating business deals. He therefore hired a personal secretary and bought her services, and specialized on corporate finance. No doubt the lady (or ladies) who performed Goldsmith’s secretarial job (or jobs) was/were very competent, but in truth they could do nothing as well as Goldsmith. The idea is a commonplace of microeconomics textbooks, but is not widely understood. (It was not understood – for all his abilities – by Goldsmith himself. See James Goldsmith The Trap [London: Carrol & Graf, 1994]. For a defence of free trade, see the author’s 1981 pamphlet for the Centre of Policy Studies on Against Import Controls.)10 For example, Nicholas Clegg, leader of the Liberal Democrats, said on the BBC’s Today radio programme on 31st October 2011 that, ‘I’m in favour of reform, yes; isolation, no. Why? Because isolation costs jobs, costs growth, costs people’s livelihoods.’ The author has criticized Clegg’s position in a recent pamphlet for the Freedom Association. (See Tim Congdon ‘Europe’ doesn’t work [London: Freedom Association, 2013].)11 The figures in this paragraph are all taken from the 2013 edition of The Pink Book on UK balance-of-payments data published by the Office for National Statistics. The deficit on transactions does not include the deficit on transfers (i.e., mostly payments to and from EU institutions, discussed in chapter 1 of this study), which was another £11.5 billion in 2012. 12 See the discussion in footnote (15) below of Switzerland.13 Kathryn Hopkins ‘Companies seek escape from red tape in Europe’, The Times, 6th August 2012. 14 The main alternative with a similar ballpark estimate is Matthew Elliott’s 2009 book on The Great European Rip-Off for the Taxpayers Alliance, which arrived at an estimate of £118 billion for the UK. Elliott said that the real cost of EU membership is many times the net direct fiscal cost, a judgement with which the present study strongly agrees. He also proposed that the heaviest price to us is paid by British businesses complying with European regulations and the taxes needed to cover the government bureaucracy to administer all the rules. Again, this seems right and accords with the analysis in chapter 2 above. The Treasury issued a rebuttal of Elliott’s book, saying that he had overlooked the benefits of EU membership. But – apart from the single market – there are in fact no such benefits, while the present chapter has argued that the equivalent of the single market (i.e., industrial free trade without European neighbours) would be available to the UK outside the EU. 15 A 2006 report for the Swiss Federal Council said that the cost to Switzerland of joining the EU would be six times that of continuing with its large number of bilateral arrangements with the EU. Under these arrangements Switzerland does make net payments to the EU, but of only SFr 500 million – 600 million a year. Its net annual payments as an EU member would be SFr 3.4 billion, six times higher. Ruth Lea and Brian Binley MP Britain and Europe: a new relationship (London: Global Vision, 2012), p. 18. 16 Batten How much does the European Union cost Britain?, p. 36.
3 Assume that EU membership is to be for a generation. The annual cost is 11% of GDP which, at the time of writing, is about £1,600 billion. The capitalized value of £176 billion over 25 years at a discount rate of 3% is £3,065 billion (or almost £3.1 trillion) or at a discount rate of 7% £2,051 billion (or over £2 trillion).

How much does the European Union cost Britain?64
Some basic arithmetic….continued
In 2012 the UK had 26.8 million households. So the total cost of EU membership to the average household was over £6,000 a year. (Yes, seriously.)
Notice that this is much higher than the estimate of £750 a year per household for the direct fiscal cost, which is on page 16 and is explained in chapter 1.
The £6,000-a-year per household number reflects all the additional costs of EU membership, reviewed in chapters 2 to 6, meaning the costs of regulation, the costs of resource misallocation, the costs of waste, fraud and corruption, the cost of lost jobs, and the cost of the contingent liabilities for which provision should be made. The average British household pays higher taxes because of EU membership, but it also has higher food bills, and it has to pay more for electricity, water and a range of items, as a result of that membership.
British workers are also less likely to find employment in their own country, because the UK labour market is open to immigration from the rest of the EU, and because employment prospects are reduced by unnecessary restrictions and regulations.
Moreover, in the last 15 to 20 years the growth of the incomes has been held back by the directives and regulations in the so-called acquis communautaire. Thousands of small businesses no longer exist, as they cannot meet the costs of complying with the acquis. The EU’s directives and regulations have in fact reduced growth all over Europe and the economies of Western Europe have stagnated in the last few years, with virtually no economic growth whatsoever. (See p. 61.)


How much does the European Union cost Britain?
Does Britain win or lose economically from its membership of the European Union? And how do any benefits compare with the costs? Is there in fact a net cost to us from belonging to the so-called ‘European club’? And, if there is a net cost, how large is it and what does that mean for the UK’s membership of the EU in future?
In this study Tim Congdon, the economics spokesman for the UK Independence Party and runner-up in UKIP’s 2010 leadership election, reviews the costs of EU membership to our country. These include the direct fiscal cost, the costs of regulation, the costs of resource misallocation, the cost in lost jobs, the costs of waste, fraud and corruption, and the potential costs from the possible failure of EU institutions and ‘benefits tourism’. His verdict is that the costs total 11% of our national output. (This is 1% of national output higher than his estimate in the 2012 edition of How Much Does the European Union Cost Britain?, reflecting the ever-increasing burden of EU regulation.)
Are there any offsetting benefits? While the UK does gain from free trade in industrial products with our European neighbours, the EU has free trade agreements with Mexico and Israel, and is seeking one with Japan. As the UK runs a trade deficit with other EU member states, a free trade agreement between the UK and the EU would almost certainly be available to us outside the EU. The benefits of European industrial free trade would therefore continue. So – Congdon argues - the net cost to the UK of its EU membership is the full 11% of gross domestic product that he has identified.
In other words, Britain is today a bit more than about a tenth worse-off than if, like Norway and Switzerland, it had never joined ‘the European project’. We need to become again an independent and sovereign nation, fully in control of our destiny. If we left the EU, we would fairly quickly save about 2% of GDP by reducing fiscal and other payments arising from our EU membership. Over time living standards would benefit from lower regulatory costs, lower food bills, lower electricity prices, lower water charges, more small businesses, more employment, more energy-using industry and so on. The economy would also move to a higher growth path.
This study is the sixth in a series started by Gerard Batten MEP in 2006. Tim Congdon is a well-known and influential economist, who was a member of the Treasury Panel of Independent Forecasters (‘the wise men’) between 1992 and 1997, and advised the then Conservative government in a successful period for economic policy-making. Gerard – who supported Tim in his 2010 UKIP leadership bid – was first elected to the European Parliament as MEP for London in 2004 and was re-elected in 2009. He uses his position as an MEP to campaign for Britain’s unconditional withdrawal from the EU.
First Published in Great Britain by Tim Congdon September 2013.Copyright © Tim Congdon 2013. All rights reserved. Printed and bound by Caxton Press Ltd.Unit 16, Midas Business Centre, Wantz Road, Dagenham, Essex RM10 8PS.
First edition August 2006, second edition August 2007, third edition November 2008, fourth edition March 2011, fifth edition September 2012, Sixth edition September 2013.
Contact
Tim Congdon Economic spokesman for the UK Independence Party
01452 830070 [email protected]