how much does the european union cost britain?timcongdon4ukip.com/docs/ukip cost of the eu.pdf ·...
TRANSCRIPT

How much does the European Union cost Britain?
Tim Congdon
With a foreword by Gerard Batten MEP2012 Edition

The 2012 edition of How much does the European Union cost Britain?, is the fifth of the UK Independence Party research series
started by Gerard Batten in 2006.

How much does the European Union cost Britain?
Tim Congdon
With a foreword by Gerard Batten MEP
2012 Edition

First Published in Great Britain by Tim Congdon September 2012.Copyright © Tim Congdon 2012. All rights reserved.
Printed and bound by Caxton Press Ltd.
Unit 16, Midas Business Centre, Wantz Road, Dagenham, Essex RM10 8PS.
First edition August 2006, second edition August 2007, third edition November 2008, fourth edition March 2011.
Fifth edition 2012.
Key points of the UK Independence Party’s research paper on
How much does the European Union cost Britain?
The UK is roughly 10% of GDP – about £150 billion – worse-off every year because it is a member of the EU. It should instead be an independent sovereign nation, like Norway and Switzerland on our own continent, or Canada and Australia in the wider English-speaking world.
The main reason for the heavy cost of the EU is the damage that misguided EU ‘legislation’ (in the form of the directives and regulations that constitute the acquis communautaire) is doing to British business. Small-and medium-sized businesses have been particularly disadvantaged, as they cannot cope with the paperwork, bureaucracy and restrictions.
Other costs include the direct fiscal cost, the costs of resource misallocation, the cost in lost jobs, the costs of waste, fraud and corruption, and the potential costs from the possible failure of EU institutions and ‘benefits tourism’. Each of these is covered in a chapter in the following publication. The breakdown of the 10% of GDP is shown in the box below.
Nature of cost % of Rationale GDP (In all cases, see relevant chapter for detailed argument). Direct fiscal cost 1 Relatively easy to quantify from official publications and balance- of-payments data; concept is of gross payments to EU institutions over which UK government has no further control. Costs of regulation 5 Mandelson 2004 to CBI conference 4% of GDP, but many other sources confirm approximate estimate of this size; many subsequent directives etc. have increased costs. Costs of resource 3¼ CAP long recognised to cause large resource misallocation. misallocation This may now be only ½% of GDP, but other EU protectionism estimated by Minford et al 2005 to cost further 3% of GDP. Cost of lost jobs ¼ Open UK labour market from 2004 allowed 700,000 Eastern Europeans into the UK, taking away jobs of over 100,000 UK-born people; labour market is still open. Costs of waste, ¼ CFP involves fish discard and effective ‘gift’ to other nations of fraud and corruption fishing rights in UK territorial waters, but costs under 0.1% of GDP; waste of over-prescriptive water standards; abuse of UK student loan system. Contingent liabilities ¼ Costs of ‘benefits tourism’, plus some allowance for possible recapitalization of EIB and other EU institutions. Total 10 Conclusion: the UK is about 10% of GDP worse-off because of its membership of the EU.
The EU has free trade agreements with Mexico and Israel, and is seeking one with Japan. Norway, Switzerland and Turkey are ‘in the European orbit’ and have access to the EU’s single market, but are not members of the EU. The UK can leave the EU, and retain strong and vibrant trade links with the EU. Outside the EU, we can put in place the free trade agreement with our European partners, which is all that most people in Britain wanted when we joined the then ‘Common Market’ in 1973.


5How much does the European Union cost Britain?
Contents
Foreword by Gerard Batten MEP 7
Author’s introduction 9
1. The direct fiscal cost 11
2. The costs of regulation 16
3. The costs of resource misallocation 25
4. The cost of lost jobs 31
5. The costs of waste, fraud and corruption 36
6. The potential costs from contingent liabilities 45
7. The total cost: roughly 10% of national output 49

Some basic arithmetic
In this study frequent reference is made to the costs of EU membership ‘as a % of the UK’s gross domestic product (or GDP)’.
For non-economists, GDP means the same thing as ‘the UK’s national output’ or ‘what we produce as a nation’. This is also the sum of all our incomes or ‘the UK’s national income’. (This is not the same concept as ‘how much we consume as a nation’, because part of our income is saved and part of our output is invested.)
In 2011 the UK’s GDP is estimated by the Office for National Statistics to have been £1,516,153 million. (Strictly, this figure refers to ‘GDP at market prices in current price terms’. The full explanation of the meaning of this phrase is technical.)
A ‘billion pounds’ is ‘a thousand million pounds’.
So in 2011
- the UK’s GDP was £1,500 billion, roughly, and - 1% of GDP was £15 billion, and - £1.5 billion was 0.1% of GDP.
The numbers for 2012 will differ a bit, but – if we think of ‘1% of GDP’ as £15 billion, we are close enough for the purposes of public debate.
The total cost of the UK’s EU membership is estimated in this publication as ‘about 10% of GDP’, which is roughly £150 billion. (The figures change as the years go by, which explains why this publication needs to appear on an annual basis.)

7How much does the European Union cost Britain?
Foreword by Gerard Batten MEP
One of the problems confronting opponents of the European Union in the past was the lack of a reliable figure for the cost of EU membership to the British economy. Every government since 1972 has stead-fastly refused to conduct a cost-benefit analysis on the grounds that ‘the benefits were self-evident’. Some commentators did attempt the task and there were a variety of figures bandied about. These figures depended on whether one used just the direct contributions to the EU budget (gross or net), or some element, if any, of the indirect costs factored in. Anyone who wished to know the actual overall cost had no reliable figure to quote.
In August 2006 I published a short pamphlet entitled, How much does the European Union cost Britain? My intention was to give my own party, and anyone else who wanted it, one reliable figure to use. My methodology was straightforward: to identity the gross and net direct contributions to the EU budget; to identify the indirect costs, in the shape of the Common Agricultural Policy, the Common Fisheries Policy, and EU regulation on business; and to add them all together.
The publication grew into a booklet and three more editions followed in 2007, 2008 and 2011. As the number of pages increased so did the costs uncovered. The figures I published were always ‘conservative’, and referenced from reliable and respected sources. But I always knew, and stated, that the overall figure would be higher than the one I had calculated from the identifiable sources.
In 2011 I showed my latest draft to Professor Tim Congdon. I was pleased when he endorsed my work and was kind enough to write the foreword to that
edition. We later discussed the scope of the work and the difficultly of trying to pin down what is always going to be a moving target. He was then kind enough to take on the work of researching and writing the 2012 edition. Tim’s expert knowledge has enabled him to widen the scope of the study and to take into account other additional costs. This has resulted in his shocking revelation that EU membership currently costs Britain about 10% of GDP, or around £150 billion pounds per annum.
This is a truly criminal waste of money given our country’s dire economic situation and the financial hardship faced by many people in their daily lives. The only reason for this colossal waste is the pursuit of a political ideology that no one wants except for the Europe-wide, out-of-touch political elite who promote it. All three of the old UK political parties, the Lib-Lab-Con, are equally guilty of this criminal irresponsibility.
Being able to identify the financial and economic cost of EU membership is an important step in the political struggle to take Britain out of the economic and democratic disaster that is the European Union.
Gerard Batten MEP7th September 2012

Some basic arithmetic…continued
So in 2011
– the UK’s GDP was £1,500 billion, roughly, and – 1% of GDP was £15 billion, and – £1.5 billion was 0.1% of GDP.
The numbers for 2012 will differ a bit, but – if we think of ‘1% of GDP’ as £15 billion, we are close enough for the purposes of public debate.
The total cost of the UK’s EU membership is estimated in this publication as ‘about 10% of GDP’, which is roughly £150 billion. (The figures change as the years go by, which explains why this publication needs to appear on an annual basis.)
In 2011 the UK had 26.3 million households. So the total cost of EU membership to the average household was over £5,000 a year. (Yes, seriously.)
Notice that this is much higher than the estimate of £750 a year per household for the direct fiscal cost, which is on page 15 and is explained in chapter 1.
The £5,000-a-year per household number reflects all the additional costs of EU membership, reviewed in chapters 2 to 6, meaning the costs of regulation, the costs of resource misallocation, the costs of waste, fraud and corruption, the cost of lost jobs, and the cost of the contingent liabilities for which provision should be made. The average British household pays higher taxes because of EU membership, but it also has higher food bills, and it has to pay more for electricity, water and a range of items, as a result of that membership.
British workers are also less likely to find employment in their own country, because the UK labour market is open to immigration from the rest of the EU, and because employment prospects are reduced by unnecessary restrictions and regulations.
Moreover, in the last 15 to 20 years the growth of personal incomes has been held back by the directives and regulations in the so-called acquis communautaire. Thousands of small businesses no longer exist, as they cannot meet the costs of complying with the acquis. The EU’s directives and regulations have in fact reduced growth all over Europe and the economies of Western Europe have stagnated in the last few years, with virtually no economic growth whatsoever.

9How much does the European Union cost Britain?
Author’s introduction
Britain’s position in the European Union has become politically controversial, while no aspect of the British position is more fundamental than the relative costs and benefits of EU membership. In 2006 Gerard Batten MEP wrote the first of a series of four studies for the UK Independence Party on How much does the European Union cost Britain? Gerard’s work was vital research for the most important political debate now facing our country. It identified problems of definition and measurement, it reviewed a number of analytical difficulties, and it established key facts and figures. I was much honoured when he invited me to write the foreword to the 2010 edition of the study and then suggested that I might prepare the next edition. I have been an economist, with an emphasis on the public policy challenges facing Britain, for almost 40 years. Much of my work has given me a lot of intellectual fun and I am told that some of it, particularly in the two decades to 1997, was quite influential. (I have been little consulted by officialdom since the election of New Labour in 1997, and I regard the Gordon Brown administration and David Cameron/Clegg Coalition government as equally bad. Please don’t blame me for the current mess!)
But the writing of the fifth edition of How much does the European Union cost Britain? has been the most wide-ranging and interesting job in my career. Implicitly, the question ‘How much does the EU cost Britain?’ is really about ‘Should we stay in the EU or not?’ At a short remove, the matters at stake include our country’s geopolitical direction and its wider ‘philosophical’ commitments. (Forgive my pomposity, but these things are important.) My main conclusions are simple. Britain today is about 10% of gross domestic product worse-off than if it were a fully-independent sovereign nation, like Norway and Switzerland in our own continent, or Canada and Australia in the wider English-speaking world.
In my view, Britain should seek to recover its full independence from the EU for economic reasons. Further, these economic reasons are not just clear, but overwhelming. I am well-aware that the debate is about politics as well as economics. As it happens, I see the political case for withdrawal from the EU as even more basic and compelling than the economic. As amply demonstrated in the two world wars of the 20th century, our nation’s long-run commitments are to maintain the freedom of the individual in a society under the law. The current version of the EU has a quite different agenda. That agenda is for a bureaucracy to impose and enforce certain standards
of behaviour, by means of ‘legislation’ (directives and regulations), with the bossiness justified by an arrogant paternalism that ‘the man in Brussels’ knows best. In other words, the EU is authoritarian and anti-democratic. We must leave the EU as soon as we can.
I know that critics will mock. They will say that in a study like this UKIP had to reach a nice, round number like ‘10% of GDP’. Well, actually, no. When I started this work a few months ago, I had an open mind. I was expecting something above 5% of GDP, but not the eventual result. As a young man I was against Britain ‘joining the Common Market’, and am a well-known and long-standing sceptic about all things to do with ‘the European construction’. Nevertheless, I have been appalled by what I have found out while preparing this study. At the start of 2012 I had not read Open Europe’s Still Out of Control?, Minford’s Should Britain Leave the EU?, Carolyn Warner’s The Best System Money Can Buy or the 2011 White Paper on European Union Finances. I had not looked at websites on EU environmental policy or at those (www.fishfight.com and www.fish2fork.com) on the Common Fisheries Policy. I had several files of press cuttings, mostly from The Daily Telegraph and The Sunday Telegraph, the Daily Express and the Daily Mail, but I had not collated the material and tried to put it into some sort of order. I was – very genuinely – on a research mission. The outcome could just as well have been 6¾% of GDP or 11.2%. The answer really did emerge as 10% of GDP, without my taking a conscious decision to guide it there.
If you don’t believe me, why not read this pamphlet and check for yourself? I hope other researchers will tread similar ground, and I look forward to debating the subject with them and getting closer to the truth. Sure, I have made mistakes. Of course I have. But on one point I am 100% confident, that no one will find that Britain today enjoys net economic benefit from its EU membership.
Professor Tim Congdon CBE4th September, 2012

11How much does the European Union cost Britain?
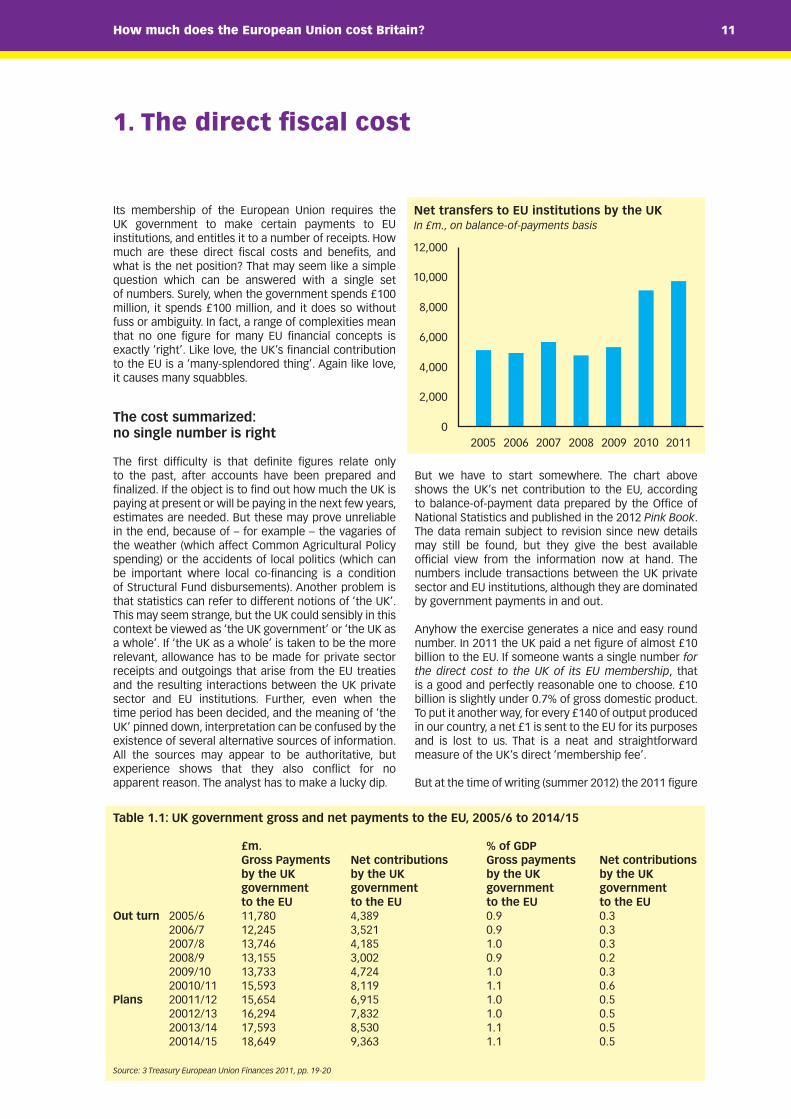
But we have to start somewhere. The chart above shows the UK’s net contribution to the EU, according to balance-of-payment data prepared by the Office of National Statistics and published in the 2012 Pink Book. The data remain subject to revision since new details may still be found, but they give the best available official view from the information now at hand. The numbers include transactions between the UK private sector and EU institutions, although they are dominated by government payments in and out.
Anyhow the exercise generates a nice and easy round number. In 2011 the UK paid a net figure of almost £10 billion to the EU. If someone wants a single number for the direct cost to the UK of its EU membership, that is a good and perfectly reasonable one to choose. £10 billion is slightly under 0.7% of gross domestic product. To put it another way, for every £140 of output produced in our country, a net £1 is sent to the EU for its purposes and is lost to us. That is a neat and straightforward measure of the UK’s direct ‘membership fee’.
But at the time of writing (summer 2012) the 2011 figure
0
2,000
4,000
6,000
8,000
10,000
12,000
Net transfers to EU institutions by the UKIn £m., on balance-of-payments basis
2005 2006 2007 2008 2009 2010 2011
Table 1.1: UK government gross and net payments to the EU, 2005/6 to 2014/15
£m. % of GDP Gross Payments Net contributions Gross payments Net contributions by the UK by the UK by the UK by the UK government government government government to the EU to the EU to the EU to the EUOut turn 2005/6 11,780 4,389 0.9 0.3 2006/7 12,245 3,521 0.9 0.3 2007/8 13,746 4,185 1.0 0.3 2008/9 13,155 3,002 0.9 0.2 2009/10 13,733 4,724 1.0 0.3 20010/11 15,593 8,119 1.1 0.6Plans 20011/12 15,654 6,915 1.0 0.5 20012/13 16,294 7,832 1.0 0.5 20013/14 17,593 8,530 1.1 0.5 20014/15 18,649 9,363 1.1 0.5
Source: 3 Treasury European Union Finances 2011, pp. 19-20
1. The direct fiscal cost
Its membership of the European Union requires the UK government to make certain payments to EU institutions, and entitles it to a number of receipts. How much are these direct fiscal costs and benefits, and what is the net position? That may seem like a simple question which can be answered with a single set of numbers. Surely, when the government spends £100 million, it spends £100 million, and it does so without fuss or ambiguity. In fact, a range of complexities mean that no one figure for many EU financial concepts is exactly ‘right’. Like love, the UK’s financial contribution to the EU is a ‘many-splendored thing’. Again like love, it causes many squabbles.
The cost summarized: no single number is right
The first difficulty is that definite figures relate only to the past, after accounts have been prepared and finalized. If the object is to find out how much the UK is paying at present or will be paying in the next few years, estimates are needed. But these may prove unreliable in the end, because of – for example – the vagaries of the weather (which affect Common Agricultural Policy spending) or the accidents of local politics (which can be important where local co-financing is a condition of Structural Fund disbursements). Another problem is that statistics can refer to different notions of ‘the UK’. This may seem strange, but the UK could sensibly in this context be viewed as ‘the UK government’ or ‘the UK as a whole’. If ‘the UK as a whole’ is taken to be the more relevant, allowance has to be made for private sector receipts and outgoings that arise from the EU treaties and the resulting interactions between the UK private sector and EU institutions. Further, even when the time period has been decided, and the meaning of ‘the UK’ pinned down, interpretation can be confused by the existence of several alternative sources of information. All the sources may appear to be authoritative, but experience shows that they also conflict for no apparent reason. The analyst has to make a lucky dip.

How much does the European Union cost Britain?12
is to a degree history. To have a more up-to-date view it is necessary to check the latest official forecasts. Every year since 1980 the Treasury has published a Statement on the Budget of the EU, for submission to Parliament. The latest such Statement (Cm. 8232) was prepared in December 2011 and gave the numbers in Table 1.1 for the UK’s ‘net contribution to the EU budget’.
A comparison of the numbers in this table with the chart on the previous page may be a little unsettling, because the table’s number for 2011/12 of a net con- tribution of £6.9 billion is quite a lot less than the chart’s figure of almost £10 billion. However, the two answers are consistent. They refer to different time-periods (calendar year and fiscal year), while the table relates to government expenditure and receipts as such, unlike the chart which is about the UK as a nation. Another qualification is that the Treasury document was prepared in December 2011 and, almost certainly, will eventually need to be updated by later and more accurate information.
The table is also more complete than the chart, in that it presents data on gross payments to the EU as well as the net contribution. The difference between the two reflects the EU’s various payments to the UK, which include CAP money for farmers and development money for the regions. At present the gross payments to the EU run at about £15½ billion to £16 billion a year, which is roughly £50 million a day. While it is true that about half of that £50 million comes back to the UK, we do not in fact have much discretion about how the returned half is spent. The explanation is that the UK’s discretion is constrained by EU treaty commitments. Even with the money that is sent back from Brussels, the British government is not able to take decisions freely according to perceived local conditions for the benefit of the people most immediately affected. So a legitimate statement is that, ‘we in Britain pay £50 million a day to European institutions, to be spent by the EU for its purposes’. That is about 1% of our national output. For every £100 of output produced in our country, £1 is sent to the EU for its purposes and is not under our control.
Another clear message is that the UK’s direct fiscal cost of membership has been rising in the last few years. Broadly speaking, the cost from now on will be about ¼% of GDP higher than it was before the end of the Blair premiership in 2007. The next section will consider how the UK’s membership fee has been determined. It is quite a long story and some history is needed.
Some history: the original negotiations and the 1984 rebate
How did the UK find itself in a situation in which it has to pay 1% of everything it produces to a foreign institution, the European Commission, to be distrib-uted for the purposes of a club of foreign nations, the European Union? Britain is a proud nation with a
remarkable history which, by common consent, has made a contribution to modern civilization out of all proportion to its size, natural resources and population. England – the core of Britain – has not been conquered by an invading military force for almost a thousand years. So why is it paying £1 out of every £100 of its output to benefit its European neighbours?
The answer lies in history. Britain received massive sup-port from members of the British Commonwealth in the Second World War, which was one reason why it emerged on the winning side. It also played a leader-ship role, with the United States of America, in forging the key supranational institutions of the post-war world (i.e., the United Nations, the International Monetary Fund, the General Agreement on Tariffs and Trade [now the World Trade Organization], and so on). But in the first post-war generation Commonwealth nations distanced themselves from Britain to some extent. The self-governing dominions (such as Canada and Australia) adopted more protectionist trade policies and sought to articulate voices of their own in international affairs, while the colonies obtained political independence. The partial closure of the Commonwealth markets restricted the expansion of British exports and imports.
Along with other misguided economic policies, the loss of Commonwealth export opportunities was associated with a poor rate of economic growth by the standards of other European nations. Six of these nations had established the European Economic Community, or so-called ‘Common Market’, in 1957. By the early 1970s the trading and industrial success of the original six members of the ‘Common Market’ appeared definite and incontrovertible relative to the UK’s failure. When the UK joined the EEC on 1st January 1973, it did so primarily for economic reasons. The dominant consideration in most people’s minds was the need to arrest the UK’s sharp decline, in output and exports, relative to its European neighbours. Extrapolations of the relative growth performance of the UK and the Common Market countries in the 1960s implied that, by the 1980s, the UK could be ‘the poor man of Europe’. Although public opinion on Common Market mem-bership was mixed, the political elite and the most influential sections of the media were in favour of joining. Indeed, many advocates of Common Market entry were desperate that its application for member-ship should succeed.
The existing six members of the EEC were well aware of the strength of their bargaining position and extracted a high price from the UK. The original deal back in 1957 had been, essentially, between Germany and France. As Germany wanted European free trade for its resurgent manufacturing industries and France sought financial help for its extensive agricultural sector, Germany agreed to pay money into a European fund. This money would be directed mostly to farmers, particularly French farmers. Because the UK had at the time of EEC entry a small and efficient farming industry by European standards, it was to follow Germany

13How much does the European Union cost Britain?
and also to be a significant net contributor to EEC institutions. At first the sums at stake were quite small. Indeed, the UK was a net beneficiary on one – although only one – occasion. (Amusingly, that was in 1975. This happened also to be the year when the British public was consulted in a referendum about EEC membership!) Thereafter the net contribution increased steadily, so that by the early 1980s the UK was the second largest net contributor after Germany. It was the second largest net contributor, even though a modest abatement (or ‘rebate’) was applied due to the original treaty provisions.
Official statistics indicated that in the late 1970s and early 1980s the UK had a lower income per head than France or the Benelux countries. So Britain, the victor country of the Second World War, was both relatively poor in the EEC context and a giver of money to loser countries that had now become better-off. Needless to say, this situation disappointed many people in Britain, including Margaret Thatcher, who had become prime minister in 1979. In a series of often awkward negotiations Thatcher secured a much larger rebate for the UK in 1984. Ever since this rebate has been a bone of contention between the UK and its European ‘partners’, with other countries objecting loudly to what they see as the UK’s allegedly special treatment. Table 1.2 above shows the importance of the rebate in mitigating the cost of EU membership to the UK. Over the 1984 – 2010 period the rebate was cumulatively worth £67.1 billion (or about 0.3% of GDP), compared with net contributions of £73.1 billion (also about 0.3%
of GDP). So, roughly speaking, the rebate halved the net cost of membership to our country until the last few years, when – as we shall now see – much of it was given away by Tony Blair, the Labour prime minister from 1997 to 2007.
The loss of much of the rebate from 2005
Just before Christmas 2005, as the end of the six-month British presidency of the European Council, Blair agreed that in the EU’s 2007-13 budget round, the British ‘rebate’ would be scaled down. The justification was that the EU had expanded dramatically because of the downfall of communism and the subsequent accession of several East European states. As the new members were generally poor compared with the long-standing West European states, they were deemed deserving of additional ‘regional development’ money. On this basis, the original arrangements made back in the 1970s and 1980s needed to be reviewed, and the UK rebate in particular came under the spotlight. All the same, Blair was under no obligation to surrender. Initially, the reduction in the rebate was ‘spun’ in the media as part of a deal whereby the French agreed to a cut in EU farm subsidies as a quid pro quo. But in the end Blair gave ground and the French did not. The French agreed only to a non-binding review of EU spending in 2008. Nothing much came from that which was to the UK’s benefit.
Blair set out the rationale for the rebate loss at a
Table 1.2: UK government payments to the EU and ‘the rebate’, 1973 – 2010
£ Billion % of GDP
Gross Public Negotiated Net Negotiated Net contributions sector abatements/ contributions abatements/ contributions receipts refunds (‘the refunds (‘the contributions contributions rebate’) rebate’)
5 years to 1978 3.1 1.7 0.0 1.3 0.0 0.25 years to 1983 11.4 5.5 2.6 3.3 0.2 0.35 years to 1988 21.9 10.6 5.2 6.1 0.3 0.35 years to 1993 32.5 13.2 9.8 9.5 0.3 0.35 years to 1998 43.7 21.2 8.5 13.9 0.2 0.45 years to 2003 52.4 20.2 16.5 15.7 0.3 0.3 2004 11.5 5.4 3.6 2.5 0.3 0.2 2005 13.1 6.4 3.7 3.1 0.3 0.2 2006 13.0 5.8 3.6 3.7 0.3 0.3 2007 13.1 5.3 3.5 4.2 0.3 0.3 2008 13.3 5.7 4.9 2.7 0.3 0.2 2009 14.8 5.5 5.4 3.9 0.4 0.3 2010 13.7 3.3 2.6 7.8 0.2 0.5
Total 1973-2010 257.6 110.1 69.7 77.8 0.3 0.3
Total 1984-2010 243.0 102.8 67.1 73.1 0.3 0.3
Source: Gerard Batten How much does the European Union cost Britain? (London UKIP 2010) and office for National Statistics website for GDP data.

How much does membership of the European Union cost Britain?8 How much does the European Union cost Britain?14
meeting of the European Parliament on 20th December 2005. The effect of the change was that the new EU budget would ‘transfer wealth from rich to poor countries’, adding that the result would be akin to ‘investing in Eastern Europe’. The British people were not consulted as to whether they wanted to support improving the infrastructure of Eastern Europe, as the subject was certainly not included in Labour’s 2005 election manifesto. Nevertheless, the cost to the British taxpayer in the 2007 – 13 budget round has officially been put at €10.5 billion at 2004 prices. With the completion of the ‘phasing in’ period at the end of 2011, the UK is now ‘participating fully’ in financing the cost of EU enlargement. In 2012 and subsequent years the cost will be about £2 billion per annum. It is this loss of rebate that is the principal reason for the increase in the UK’s net contribution – the increase amounting to about ¼% of GDP – that was noted earlier.
In the event of further EU enlargement yet more of the rebate will go. The list of candidate countries varies over time, but discussions of various kinds are under way with Bosnia, Croatia, Iceland, Macedonia, Montenegro and Turkey. Indeed, Croatia is set to become the 28th member of the EU on 1st July 2013. Because Croatia has a small economy, the cost to the UK in terms of rebate loss will be trifling. The situation would be very different if Turkey were to accede. Although enjoying high economic growth, it is poor compared to the EU and has an extensive agricultural base. The cost to the UK taxpayer of Turkish membership would run into hundreds of millions of euros/pounds and would increase the deficit in our public finances. Astonishingly, all three leaders of Britain’s largest political parties support Turkish membership of the EU.
The UK’s contribution to the EU Budget set in context
The UK’s contribution to the EU Budget may seem small relative to our national production and wealth. At about 1% of GDP, the UK’s gross contributions are of course heavily outweighed by the 99% of our output which we can use for ourselves regardless of bureaucrats and politicians from other European nations. But so it should be. When the UK engaged in ‘the European construction’ (to use the phrase often favoured by EU bureaucrats) in 1973, the British public’s understand-ing was that we were ‘joining the Common Market’. In other words, the objective was to participate in a free trading area, not to commit ourselves to the building of a European super-state in which our independence would be weakened and lost. The world includes other such areas, often referred to as ‘customs unions’. Typically, the only supra-national administrative structure needed is a panel (of judges, usually) to settle disputes in the interpretation of the treaties establishing the customs union. The cost of such panels, and even of the supporting bureaucracy, is trivial, less than a thousandth of 1% of GDP.
The 1% figure is best seen as an accidental outcome of historical forces. In the 1950s Germany was eager to re-establish its international respectability after the horrors of the Nazi period and the Second World War. It sought redemption from its past through intra-European cooperation, initially on the economic front, even though from the outset such architects of ‘the European construction’ as Robert Schuman and Jean Monnet envisaged an ‘ever closer union’ which might lead to a pooling of political sovereignty. Germany achieved a spectacular economic recovery in the 1950s, giving it the resources to bribe other European nations – particularly France – to forge in- dustrial free trade in a newly-established customs union. From the start until today Germany has been the largest financial contributor to the key European institutions, a fact which speaks volumes about the underlying motives and drivers of events. Britain was welcome at the founder meetings in the 1950s, but stayed aloof.
The British government changed its mind in the 1960s and applied for Common Market membership, only to be rebuffed twice (in 1963 and 1967) by an emphatic ‘non’ from the French president, Charles de Gaulle. (Germany wanted the UK to join.) De Gaulle’s two vetoes increased the UK membership fee. By the early 1970s top British policy-makers were afraid that the UK would be ‘left behind’ its economically dynamic European neighbours. To them membership of the Common Market seemed absolutely essential and they were prepared to pay a price for joining it. They were prepared to pay a price, even though all that the UK wanted was European free trade and – as has explained – the cost of administering customs unions ought to be tiny. But the membership fee could not be too much, as that would alienate British public opinion. The result was therefore a membership fee – in terms of the direct fiscal cost – which was neither enormous nor trivial relative to GDP, and which was higher than that of any other member state apart from Germany.
The rest of this study will show that the direct fiscal cost is, in fact, only part of the cost of EU member-ship to the UK. Far more important nowadays are the costs of regulation and waste, which were not even considered in the original negotiations. The important point to remember from the discussion so far is that the UK’s status as a net contributor to EU funds goes back to the disappointments and resentments of the original applications back in the 1960s and early 1970s. From a wider historical perspective, the UK – unlike the other big consistent contributor, namely Germany – has no reason to be ashamed of its past or to need to offer ‘blood money’ to its neighbours. The British in-terest in Europe has always been commercial and economic, and a customs union or free trade area can operate successfully with a disputes panel with a cost that is negligible compared with the current direct fiscal cost of the UK’s EU membership. Bluntly, we should not be paying a membership fee at all.

9How much does membership of the European Union cost Britain? 15How much does the European Union cost Britain?
Appendix 1: How much does the average British household pay each year to the EU?
We have seen that no single number can denote the direct fiscal cost of the UK’s EU membership. Neverthe-less, Table 1.1 shows that the gross government cost in 2013/14 is expected to be £17.6 billion, while the net government cost is put at £8.5 billion. Further, various payments are made to and from EU institutions by the private sector. Let us take it that in the next fiscal year the gross cost to the UK is £20b. and the net cost £10b.
In 2011 the UK had 26.3 million households. What, then, is the direct fiscal cost per British household of EU membership? Let us assume that in 2013 the number of households has risen by 1½% to 26.7 million. The answer is then,
The cost to the average British household of belonging to the EU is £749 a year (£20 billion divided by 26.7 million) or, as near as makes no difference, £750 a year. Sure, we get some of this money back for some regional development regions that receive the money. Anyhow our government cannot control exactly how it is spent. In most of the UK the average household is £750 a year worse-off because of our membership of the EU.
But that is not all. The three ‘main’ political parties have said they want the EU to expand to take in much of the Balkans and Turkey. If so, the cost would rise towards £1,000 a year.

How much does membership of the European Union cost Britain?8 How much does the European Union cost Britain?16
2. The costs of regulation
The tidal wave of the acquis communitaire: a broad-brush cost estimate
The cost of implementing the 120,000 items of legislation is massive. Given the multiplicity, complexity and diversity of the EU’s directives and regulations, precise estimates of the cost – estimates that purport to be accurate to a few hundred millions of euros – are not to be expected. Only broad-brush, rough-and-ready numbers make sense. Given the vast scope of the EU’s regulatory effort, the present study cannot pretend to offer detailed and rigorous new quantitative research. All that can be done here is to synthesize the results of other analyses that seem well-intentioned in purpose and well-grounded in fact.
As we have seen, Germany has always been the nation most committed to European integration. So a 2006 study undertaken for the German parliament by its former president, Roman Herzog, must be treated with respect. According to that study, 84% of Germany’s new laws come from the EU.3 Much the same kind of figure must have applied then – and must still apply now – across the EU, including the UK. It is a common- place that the EU bureaucracy has a vested interest in expanding its authority. If an EU commissioner puts forward a figure for the cost of regulation, that figure ought to be taken as unbiased even if it remains unproved. In October 2006 Gunther Verheugen, the EU commissioner for industry and enterprise, put out a statement which invited the interpretation that the annual cost of EU regulation was 600 billion euros or 5½% of GDP.4 Given that a President of Germany and an EU commissioner would be generally supportive of EU integration, these estimates – more than five sixths of new legislation and a cost of over 5% of national output – are remarkable.
Lord Mandelson is one of the UK’s most Europhile politicians. But in a speech to the Confederation of British Industry in 2004 he suggested that EU red tape cost 4% of GDP. Although he then argued that the benefit of the single market (estimated at 2% of GDP) had to be weighed against the burden of regulation, he appeared to accept that overall the UK economy was a net loser from application of the acquis to our economy. (Later in this study it will be argued that ‘the benefit of European free trade’ – the benefit that Mandelson quantified as 2% of GDP – is more or less the same thing as ‘the benefit of the single market’, and that a free trade agreement between the EU and the UK would be available to us outside the EU. So the cost of regulation is the cost of regulation without further ado. On a reasoned interpretation of statements from the highly Europhile Mandelson, this cost is a net 4% of the UK’s GDP.)
The Open Europe think-tank suggests a £20 billion annual cost
The Open Europe think-tank is often described as
From a constitutional standpoint, the European Union is a monstrosity. Powers have been ceded to EU institutions that place them above the member nations in the constitutional hierarchy. These institutions are, in effect, federal bodies that constitute a ‘government’ for the EU as a whole. Nevertheless, the member nations have retained trappings of statehood, and in particular continue to have their own military forces, their own legal systems and their own fiscal prerogatives. Critically, most taxes are raised and most public expenditure is administered at the national level. EEC expenditure was a mere 0.03% of member states’ aggregate GDP in 1960, and had climbed to 0.53% of that figure in 1973 on the UK’s accession. The ratio has subsequently risen to slightly more than 1% of EU GDP, as we saw in the last chapter. But it is striking that Germany – the main sponsor of European integration – has over the last 20 years been one of the member states most opposed to additional spending in the union’s name. At the Edinburgh meeting of the European Council in 1992 Germany actively supported a spending ceiling of 1.27% of aggregate member nations’ GDP.1
On the face of it the EU has two layers of government, one at the national level and the other for the union as a whole. But the word ‘layer’ implies, falsely, that a clear and definitive understanding has been established on the proper relationship between the two. In fact, EU member states are in the dysfunctional situation of hav-ing two distinct governments, one in the national capital and the other in Brussels, with their relative powers and responsibilities largely unsettled. The EU bureaucracy has been unable to wrench the key fiscal prerogatives, the powers to tax and spend, from the member states. To compensate for this failure, it has tried to expand its influence by pressing for more European ‘laws’. The heart of the process is that the European Commission proposes new ‘directives’ and ‘regulations’ to the Coun-cil of Ministers. Successive treaties have weakened the power of individual nations to block new EU legislation that they dislike. Particularly since the Single European Act of 1986 the nation states have become increasingly feeble in restraining the EU juggernaut. Over the 55 years of its existence the European Commission has authored tens of thousands of directives and regu- lations that have the force of law across the EU.
The EU’s various legislative enactments – which are termed the acquis communautaire – are so numerous as to fill 120,000 pages. As far as the EU is concerned, the acquis is sacrosanct and must be adopted by all new member states without cavil. Directives and regulations are the main expression of EU authority, and nowa-days infiltrate every nook and cranny of national life. In the words of Lord Denning over 20 years ago, ‘Our sovereignty has been taken away by the European Court of Justice… No longer is European law an incoming tide flowing up the estuaries of England. It is now like a tidal wave bringing down our sea walls and flowing inland over our fields and houses – to the dismay of all.’ 2
9How much does membership of the European Union cost Britain? 17How much does the European Union cost Britain?
to emerge in the vast majority of cases. Gaskell and Persson noted in their 2010 report that, ‘The “do nothing” option has not been recommended in a single impact assessment we have come across since last year, which shows an unwillingness among policymakers seriously to consider alternatives to regulation.’ 6
Apparently the government produces and maintains a large library of impact assessments, but they are not widely read. Cynics might remark that the task of preparing the impact assessments added to the piles in civil servants’ in-trays and hence justified the recruit-ment of more civil servants. The private sector had to pay more taxes to cover the cost of staff who analyzed the effect of regulations which it had not wanted in the first place. The impact assessments therefore increased the costs of tax and regulations, and added insult to injury. And did they serve any useful purpose? Gaskell and Persson mentioned one instance when an impact assessment argued against the introduction of a new regulation, but was ignored. In their words,
…the Waste Batteries and Accumulators Regulation 2009, which partially implemented EU Directive 2006/66/EC, was signed off [by a government minister] in April 2009, despite the impact assessment showing that the costs clearly outweighed the benefits. Annual costs were estimated at anywhere from £10.2 million to £17.2 million, while the benefits were estimated to be between £2.1 million and £2.8 million. In two distressing cases discussed by Gaskell and Persson (the Alternative Investment Fund Manage-ment Directive and a regulation on the conditions for frozen poultry meat) the concerns of some UK govern- ment departments were brushed aside by the EU bu- reaucracy and then steamrollered through the Council of Ministers.8
The cost of renewables legislation
One reason for being sceptical about Open Europe’s work is that both its reports failed to give sufficient emphasis to sectors known to be suffering particu-larly severe damage from EU regulations. Thus, the third chapter of the 2010 report included a list of five government departments, showing the proportion of the extra regulatory cost for each of them represent-ed by new EU-originating legislation as opposed to UK-derived legislation. This was fine and worthy in its way, but it suffered from a glaring oversight. Open Report’s Still Out of Control? 2010 report barely discussed the drastic impact of EU regulations on the UK’s energy and energy-related sectors, particularly electricity generation and chemicals.
The three key directives here are the 2001 Large Combustion Plant Directive, the 2003 Bio Fuel Directive and 2009 Renewables Directive. The last of these is the
‘Eurosceptic’, but in May 2012 it produced a report on the UK’s trading options which said that staying in the EU was the best choice for the future. So it can hardly be described as vehemently anti-EU. It has carried out two reports on the cost of EU regulation, one in 2009 and the other in June 2010, just after the election of the Conservative/LibDem coalition government. Both were heavily based on the ‘impact assessments’ of regula-tory proposals produced by the British government and the European Commission. As the first such impact as-sessment were prepared in 1998, the 2009 report dealt with over a decade of regulation. The second exercise in 2010 was entitled Still Out of Control?: Measuring eleven years of EU regulation, and was prepared by two Open Europe staff members, Sarah Gaskell and Mats Persson. It was based on studying 2,300 impact assess-ments and claimed to be ‘the most comprehensive and in-depth study to date of the cost of regulation in the UK’ for the period in question. One section examined the annual flow of regulations and the costs to which they gave rise. A key conclusion was that, ‘In 2009 the cost arising from regulations [i.e., all regulations, including those of UK origin] introduced since 1998 was £32.8 billion’, with 59% (or £19.3 billion) being EU-derived. For the purposes of presentation, this was rounded upwards to £20 billion a year.
That appears to be cut-and-dried, so that £20 billion can be added to the direct fiscal cost as a huge negative of EU membership for the UK. However, the Open Europe analysis begged many questions. Official impact assessments are supposed to weigh the benefits of extra regulation against the costs. Using the official calculations in the assessments, Open Europe contended that ‘the benefit/cost of the regulations we studied’ was 1.58. In other words, the benefits of regulation exceeded cost by a wide margin of almost 60%, tacitly implying that the UK and indeed every other EU country should openly embrace yet more regulation! In qualification, the study found that UK-originated regulations had a benefit/cost ratio of 2.5, dramatically higher than for EU regulation. For EU regulation alone the benefit/cost ratio was said to be a mere 1.02. Given that the overall result for EU regulation was so marginal, there must have been a high likelihood that many EU regulations had costs in excess of their benefits. The Open Europe study was therefore consistent with the widespread popular disenchantment with EU regulation, and a common perception that much of it was misguided and wasteful.
But closer reading casts some doubt on the rigour of the Open Europe analysis. In fairness, even its authors were far from dogmatic that they had reached the final truth in this conceptually elusive subject. As their work was in effect a compilation of impact assessments, it would not have been feasible without a large body of such assessments to consult. But – of course – the case for a new regulation would fall if the benefit/cost ratio were under one. From the very nature of the analytical process of drawing up impact assessments, a benefit/cost ratio of over one had – almost inevitably –
How much does membership of the European Union cost Britain?8 How much does the European Union cost Britain?18
policy issues that have been and remain in dispute. Some leaked documents indicated that the cost of meeting EU targets would be between £5 billion and £11 billion a year. Indeed, according to the docu-ments, the long-term goal of 20% of total energy being from renewables would cost £22 billion.10 It needs to be stressed that, unlike the cost calculated in impact assessments which are in principle justified by offsetting benefits, these costs are costs, full stop. Because the British government has at the EU’s behest imposed methods of electricity generation that are costly and inefficient, Britain is worse-off without qualification. (The selection of costly methods of electricity generation may eventually prove to have been correct, in that lower CO2
emissions may help ‘to save the environment’. But – as of now – that is conjecture.)
Two further points must now be highlighted. First, the identified cost to the UK of EU membership in this one part of the economy is much the same as the direct fiscal cost discussed in the first chapter. Secondly, as EU regulations affect many other parts of the economy, their cost is additional to the £5 billion to £22 billion that a government department has calculated in the energy, energy-using and electricity cluster of industries. The implications of these two points are brought out more sharply towards the end of this chapter.
The cost of EU-imposed financial regulation
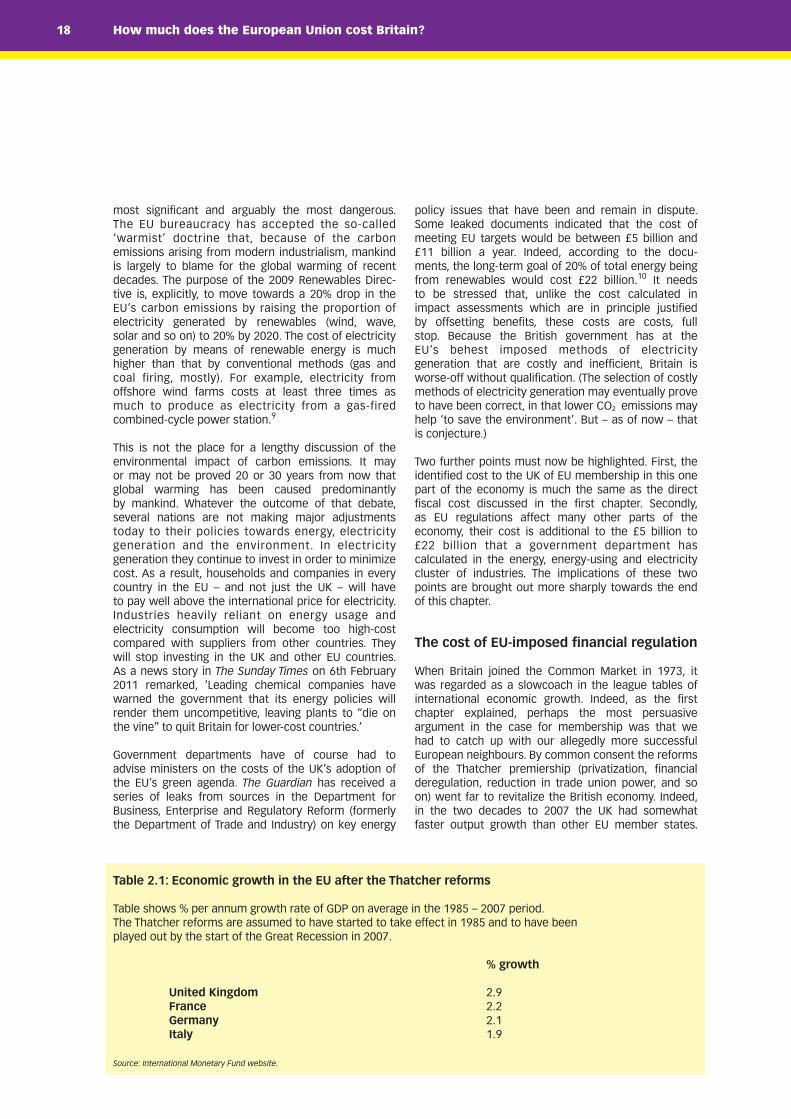
When Britain joined the Common Market in 1973, it was regarded as a slowcoach in the league tables of international economic growth. Indeed, as the first chapter explained, perhaps the most persuasive argument in the case for membership was that we had to catch up with our allegedly more successful European neighbours. By common consent the reforms of the Thatcher premiership (privatization, financial deregulation, reduction in trade union power, and so on) went far to revitalize the British economy. Indeed, in the two decades to 2007 the UK had somewhat faster output growth than other EU member states.
most significant and arguably the most dangerous. The EU bureaucracy has accepted the so-called ‘warmist’ doctrine that, because of the carbon emissions arising from modern industrialism, mankind is largely to blame for the global warming of recent decades. The purpose of the 2009 Renewables Direc-tive is, explicitly, to move towards a 20% drop in the EU’s carbon emissions by raising the proportion of electricity generated by renewables (wind, wave, solar and so on) to 20% by 2020. The cost of electricity generation by means of renewable energy is much higher than that by conventional methods (gas and coal firing, mostly). For example, electricity from offshore wind farms costs at least three times as much to produce as electricity from a gas-fired combined-cycle power station.9
This is not the place for a lengthy discussion of the environmental impact of carbon emissions. It may or may not be proved 20 or 30 years from now that global warming has been caused predominantly by mankind. Whatever the outcome of that debate, several nations are not making major adjustments today to their policies towards energy, electricity generation and the environment. In electricity generation they continue to invest in order to minimize cost. As a result, households and companies in every country in the EU – and not just the UK – will have to pay well above the international price for electricity. Industries heavily reliant on energy usage and electricity consumption will become too high-cost compared with suppliers from other countries. They will stop investing in the UK and other EU countries. As a news story in The Sunday Times on 6th February 2011 remarked, ‘Leading chemical companies have warned the government that its energy policies will render them uncompetitive, leaving plants to “die on the vine” to quit Britain for lower-cost countries.’
Government departments have of course had to advise ministers on the costs of the UK’s adoption of the EU’s green agenda. The Guardian has received a series of leaks from sources in the Department for Business, Enterprise and Regulatory Reform (formerly the Department of Trade and Industry) on key energy
Table 2.1: Economic growth in the EU after the Thatcher reforms
Table shows % per annum growth rate of GDP on average in the 1985 – 2007 period.The Thatcher reforms are assumed to have started to take effect in 1985 and to have been played out by the start of the Great Recession in 2007.
% growth
United Kingdom 2.9 France 2.2 Germany 2.1 Italy 1.9
Source: International Monetary Fund website.

9How much does membership of the European Union cost Britain? 19How much does the European Union cost Britain?
sense, but – relative to other financial centres – London was well-regarded. Indeed, the dynamism of the UK’s international financial services sector from the 1960s owed much to the perception that, despite the absence of external regulators, London firms provided fair, reliable and honest services to their customers.
The tradition of self-regulation under the law began to break down in the 1980s, even though the Financial Services Act of 1986 endorsed the creation of so-called ‘self-regulatory ogani-zations’ (or SROs). A more fundamental change occurred in 1997 and 1998 when a newly- elected Labour government decided to wind up the SROs and to establish the Financial Services Authority. The FSA was to be an over-arching, omni-competent regulator for all types of financial activity, from derivatives trading to household insurance. From then on external regulation, rather than self-regulation, became the norm in the UK’s financial sector. However, for most of its existence so far the FSA has taken its cue from the long-established ‘light touch’ mantra, while regulation was very much a British matter. Indeed, whatever the reservations that may have been felt about the concentration of regulatory power in the FSA, the most spectacular phase of the City’s boom came in the opening years of the twenty-first century. Large fortunes were made by well-placed and fortunate individuals in particularly dynamic sectors. Globalization and advances in information
(See Table 2.1 opposite.) Particularly dynamic were a group of international financial services industries mostly located in or near the Corporation of London’s Square Mile and often given the collective label ‘the City of London’. As the chart above shows, the UK’s exports of international financial services soared in the 15 years to the Great Financial Crisis, which is usually taken to start in late 2008. But in fact the boom has its roots much earlier, in the trend for financial business to go ‘offshore’ in the 1960s.11 Offshore financial business – business that to a large degree avoids the regulations and taxes of any one specific nation – has been growing rapidly for about 50 years.
For most of this period the activities centred in the City of London were subject to UK financial regula-tion, often on a so-called ‘light touch’ basis from the Bank of England. It also needs to be said that – certainly until the 1980s – the prevailing philosophy was of ‘self-regulation under the law’. In other words, people employed in the Square Mile’s various activities had to obey the law (i.e., the law that punished theft, taking money on false pretences, fraud, embezzlement and so on), just like people employed in any other walk of life. No external regulatory authority was imposed on them by the state. Instead they each had their own regulatory structures, often buttressed by a compensation fund to deal with customers who had a legitimate claim on them because of wrong-doing. The City’s ethical standards may have left much to be desired in some absolute
The boom in UK exports of financial services in the 15 years to the Great Financial CrisisValue in £b. of exports of financial services, on two definitions, from official data
‘Financial services’ as suchAll services receipts due to ‘the City’
The compound annual growth rateof the UK’s financial service exportsin the 17 years to 2008 was 13.2%
0
10
20
30
40
50
60
70
90
80
1991 1993 1995 1997 1999 2001 2003 2005 2007
How much does membership of the European Union cost Britain?8 How much does membership of the European Union cost Britain?8 How much does the European Union cost Britain?20
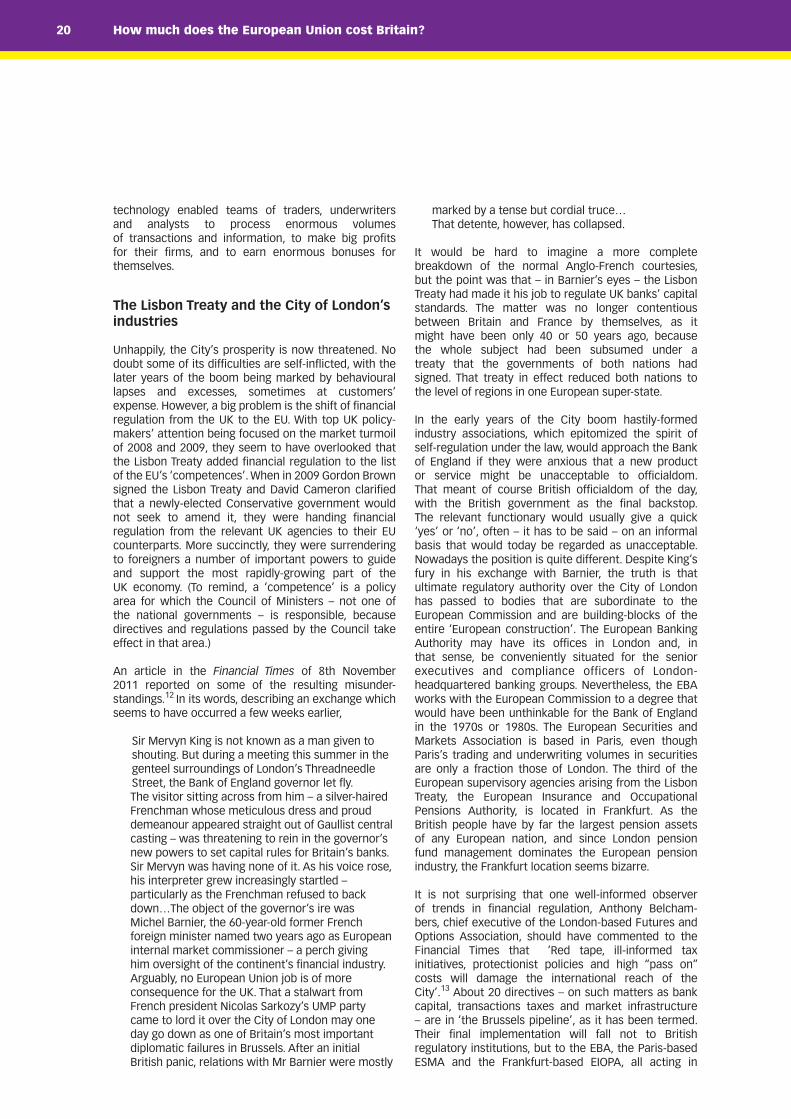
marked by a tense but cordial truce… That detente, however, has collapsed.
It would be hard to imagine a more complete breakdown of the normal Anglo-French courtesies, but the point was that – in Barnier’s eyes – the Lisbon Treaty had made it his job to regulate UK banks’ capital standards. The matter was no longer contentious between Britain and France by themselves, as it might have been only 40 or 50 years ago, because the whole subject had been subsumed under a treaty that the governments of both nations had signed. That treaty in effect reduced both nations to the level of regions in one European super-state.
In the early years of the City boom hastily-formed industry associations, which epitomized the spirit of self-regulation under the law, would approach the Bank of England if they were anxious that a new product or service might be unacceptable to officialdom. That meant of course British officialdom of the day, with the British government as the final backstop. The relevant functionary would usually give a quick ‘yes’ or ‘no’, often – it has to be said – on an informal basis that would today be regarded as unacceptable. Nowadays the position is quite different. Despite King’s fury in his exchange with Barnier, the truth is that ultimate regulatory authority over the City of London has passed to bodies that are subordinate to the European Commission and are building-blocks of the entire ‘European construction’. The European Banking Authority may have its offices in London and, in that sense, be conveniently situated for the senior executives and compliance officers of London- headquartered banking groups. Nevertheless, the EBA works with the European Commission to a degree that would have been unthinkable for the Bank of England in the 1970s or 1980s. The European Securities and Markets Association is based in Paris, even though Paris’s trading and underwriting volumes in securities are only a fraction those of London. The third of the European supervisory agencies arising from the Lisbon Treaty, the European Insurance and Occupational Pensions Authority, is located in Frankfurt. As the British people have by far the largest pension assets of any European nation, and since London pension fund management dominates the European pension industry, the Frankfurt location seems bizarre.
It is not surprising that one well-informed observer of trends in financial regulation, Anthony Belcham-bers, chief executive of the London-based Futures and Options Association, should have commented to the Financial Times that ‘Red tape, ill-informed tax initiatives, protectionist policies and high “pass on” costs will damage the international reach of the City’.13 About 20 directives – on such matters as bank capital, transactions taxes and market infrastructure – are in ‘the Brussels pipeline’, as it has been termed. Their final implementation will fall not to British regulatory institutions, but to the EBA, the Paris-based ESMA and the Frankfurt-based EIOPA, all acting in
technology enabled teams of traders, underwriters and analysts to process enormous volumes of transactions and information, to make big profits for their firms, and to earn enormous bonuses for themselves.
The Lisbon Treaty and the City of London’s industries
Unhappily, the City’s prosperity is now threatened. No doubt some of its difficulties are self-inflicted, with the later years of the boom being marked by behavioural lapses and excesses, sometimes at customers’ expense. However, a big problem is the shift of financial regulation from the UK to the EU. With top UK policy-makers’ attention being focused on the market turmoil of 2008 and 2009, they seem to have overlooked that the Lisbon Treaty added financial regulation to the list of the EU’s ‘competences’. When in 2009 Gordon Brown signed the Lisbon Treaty and David Cameron clarified that a newly-elected Conservative government would not seek to amend it, they were handing financial regulation from the relevant UK agencies to their EU counterparts. More succinctly, they were surrendering to foreigners a number of important powers to guide and support the most rapidly-growing part of the UK economy. (To remind, a ‘competence’ is a policy area for which the Council of Ministers – not one of the national governments – is responsible, because directives and regulations passed by the Council take effect in that area.)
An article in the Financial Times of 8th November 2011 reported on some of the resulting misunder-standings.12 In its words, describing an exchange which seems to have occurred a few weeks earlier,
Sir Mervyn King is not known as a man given to shouting. But during a meeting this summer in the genteel surroundings of London’s Threadneedle Street, the Bank of England governor let fly. The visitor sitting across from him – a silver-haired Frenchman whose meticulous dress and proud demeanour appeared straight out of Gaullist central casting – was threatening to rein in the governor’s new powers to set capital rules for Britain’s banks. Sir Mervyn was having none of it. As his voice rose, his interpreter grew increasingly startled – particularly as the Frenchman refused to back down…The object of the governor’s ire was Michel Barnier, the 60-year-old former French foreign minister named two years ago as European internal market commissioner – a perch giving him oversight of the continent’s financial industry. Arguably, no European Union job is of more consequence for the UK. That a stalwart from French president Nicolas Sarkozy’s UMP party came to lord it over the City of London may one day go down as one of Britain’s most important diplomatic failures in Brussels. After an initial British panic, relations with Mr Barnier were mostly
9How much does membership of the European Union cost Britain? 9How much does membership of the European Union cost Britain? 21How much does the European Union cost Britain?
coordination with the European Commission.
UK financial regulation leaves London
It might be objected at this point that, if the globali-zation of trade and finance has been a relentless trend over the last 60 years, the internationalization of financial regulation has been an inevitable accompaniment of that trend. London could not for-ever expect regulation to remain light, informal and local, as it once used to be with the Bank of England in the UK before the 1986 Single European Act. But globalization and internationalization do not mean that countries can forget about their national interest. It can-not be overlooked that EU authorities have advocated ‘a financial transactions tax’, to be levied like VAT on an EU-wide basis. This tax would fall disproportionately on the UK, because London is Europe’s principal centre for wholesale financial transactions.
There is little doubt that the governments of other European nations – including the German and French governments – have supported the tax because it would be at the UK’s particular expense. Indeed, the Commission has prepared analyses which, frankly and openly, acknowledge that jobs in London would be de-stroyed. According to one of these analyses, the FTT would cause 70% to 90% of trade in derivatives – in which London is the largest global player – to leave the EU. However, it asserted, ‘[s]uch disappearance
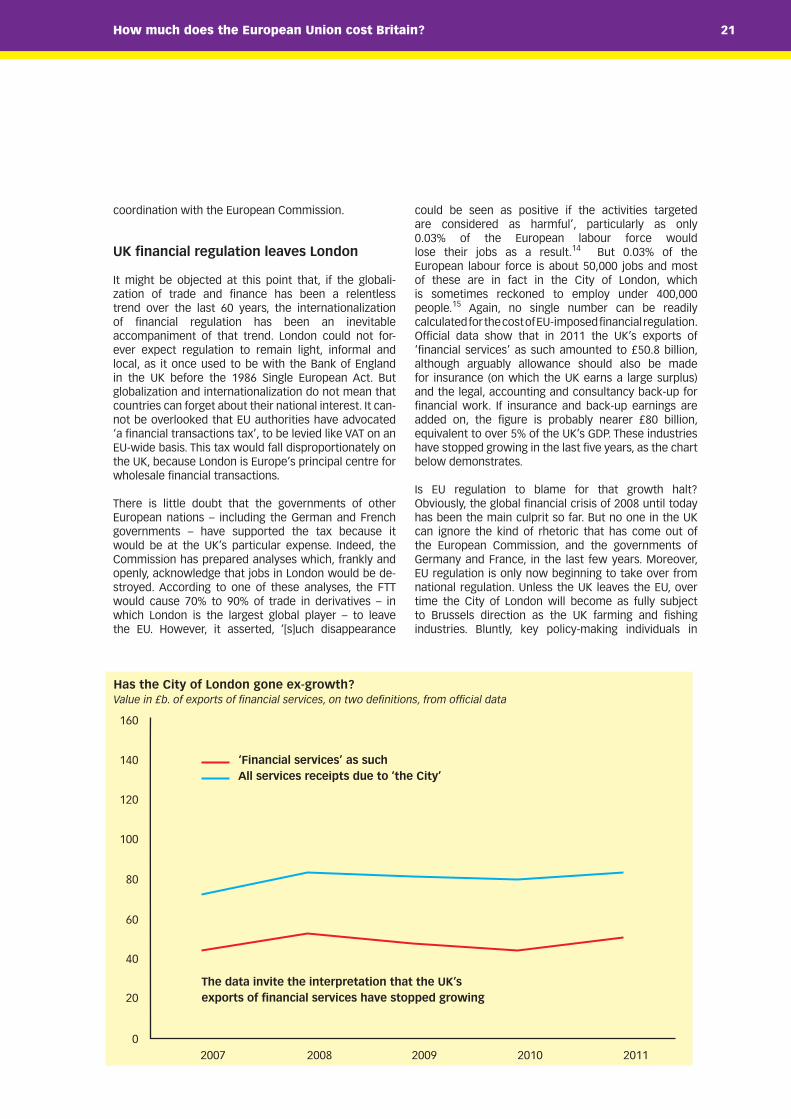
could be seen as positive if the activities targeted are considered as harmful’, particularly as only 0.03% of the European labour force would lose their jobs as a result.14 But 0.03% of the European labour force is about 50,000 jobs and most of these are in fact in the City of London, which is sometimes reckoned to employ under 400,000 people.15 Again, no single number can be readily calculated for the cost of EU-imposed financial regulation. Official data show that in 2011 the UK’s exports of ‘financial services’ as such amounted to £50.8 billion, although arguably allowance should also be made for insurance (on which the UK earns a large surplus) and the legal, accounting and consultancy back-up for financial work. If insurance and back-up earnings are added on, the figure is probably nearer £80 billion, equivalent to over 5% of the UK’s GDP. These industries have stopped growing in the last five years, as the chart below demonstrates.
Is EU regulation to blame for that growth halt? Obviously, the global financial crisis of 2008 until today has been the main culprit so far. But no one in the UK can ignore the kind of rhetoric that has come out of the European Commission, and the governments of Germany and France, in the last few years. Moreover, EU regulation is only now beginning to take over from national regulation. Unless the UK leaves the EU, over time the City of London will become as fully subject to Brussels direction as the UK farming and fishing industries. Bluntly, key policy-making individuals in
‘Financial services’ as suchAll services receipts due to ‘the City’
The data invite the interpretation that the UK’sexports of financial services have stopped growing
0
20
40
60
80
100
120
140
160
2007 2008 2009 2010 2011
Has the City of London gone ex-growth?Value in £b. of exports of financial services, on two definitions, from official data

How much does the European Union cost Britain?22
Germany, France and other continental European countries do not like the financial services industry at all. They resent the UK’s past success in these activities. The key individuals hardly bother to hide their aversion to financial activity or their desire to handicap or even expel the most complex and highly-paid financial industries from the EU. While the UK remains a member of the EU, expulsion from the EU means expulsion from the UK.
Let us be clear what we are talking about here. The Lisbon Treaty has led to the surrender, to hostile European politicians and bureaucrats, of regulatory control over industries in which the UK had been particularly dynamic and successful, and which ac-count for about 5% of UK GDP. A case can surely be argued that the regulatory follow-through of the Lisbon Treaty will check the growth of the UK’s international financial services sector and may even cause it to contract. What is the cost of that to the UK in terms of lost opportunities for highly-paid employment, profits and tax revenues? Given that the value added in the international financial services industries runs at perhaps £40 billion to £75 billion a year, that they had been growing at 15% a year and now face stagnation, and that use of the same resources will be less productive elsewhere, the UK’s loss from EU-imposed regulation might be estimated at £1.7 billion in the first year, but increasing with time. The capital loss to the UK – on assumptions which discount the loss aggressively (i.e., make it smaller than it otherwise would be) – might be almost £60 billion.16
An overall assessment: the cost of regulation rising to 5% of GDP
It is time to bring together the main points of this chapter. The first chapter established that the direct fiscal cost to the UK of EU membership now runs at about 1% of GDP.17 This chapter has discussed the costs of regulation from several angles, with comments on both broad-brush estimates of the costs in the round, and on more specific studies, including studies on particular sectors. Curiously, the broad-brush estimates were often from sources that were supportive or even enthusiastic about EU integration. Nevertheless, they arrived at numbers for the total cost of EU regulation – like 2% to 5½% of GDP – that are appreciably higher than the direct fiscal cost to the UK of its EU membership.
Open Europe’s 2010 report Still Out of Control? was considered. It offered a ballpark number, no less than £20 billion, of the annual cost of EU regulation. That is about 11/3% of the UK’s GDP. However, Open Europe’s exercise was heavily dependent on official impact assessments prepared by the British government and European Commission, and was only as analytically robust as these assessments themselves. On closer examination the Still Out of Control? report had over-looked the severity of the EU’s regulatory impact in
just one conspicuous and very important area, namely the impact of the EU’s renewables and environmental agenda in the energy industries (i.e., electricity supply and energy-using business such as chemicals). A UK government department had put the resulting costs at between £5 billion and £22 billion a year, depending on the assumptions used. A fair surmise is that the cost of the EU’s employment directives cannot be much less than that of the renewables and environmental directives, although they have not been discussed in the present study in much detail. It is a fair surmise simply because of the volume and articulacy of complaints from affected British businesses.
On top of that are, for instance, the burdens of the 1999 Landfill Directive (costed at £1.1 billion a year by local government sources), the 2006 Water Framework Directive (which forces the water industry to deliver water quality standards that are needlessly high, at fantastic cost), and the 2009 Data Retention Directive (which requires telecommunications companies to keep immense amount of customers’ internet data, at much cost to them, possibly for later police and national security use). These are just examples. Indeed the entire 120,000 pages of EU legis- lative enactments have effects, mostly negative, de- structive and deleterious, on output and employment. So more specific investigation of directives and regu- lations, and their impact on particular sectors and companies, is likely to arrive at a number that in the aggregate falls within the band of 2% to 5½% of GDP.
While exact quantification of the cost of the vast body of EU interferences is impossible, both the broad-brush approaches and the more nitty-gritty specific analyses suggest that each year the UK is losing between 2% and 5½% of GDP a year because of EU regulation. The number has undoubtedly been rising and, on that basis, must now be closer to 5½% of GDP than 2% of GDP. Given that the regulatory onslaught is gaining momentum all the time, the figure must be expected to increase in the next few years. We are therefore talking of the cost of EU regulation of, in the round, 5% of GDP. As that cost is much higher than the direct fiscal costs, it ought to receive at least as much media attention. In fact, it receives much less. No doubt supporters of greater European integration might object that talk of the ever-increasing momentum of regulation is gratuitous and unnecessary. Again a quote from Gunter Verheugen may be apposite. In his words,
There are 27 commissioners, which means 27 directorate-generals. And 27 directorate-generals means that everyone needs to prove that they are needed by constantly producing new directives, strategies or projects. In any case, the rule is more and more, more and more, all the time.19
Evidently, one of the EU Commissioners has accepted here the dysfunctional character of the organization of government, or rather of misgovernment, in the EU.
23How much does the European Union cost Britain?
The Brussels bureaucracy, thwarted in its hopes of assuming control over public spending and taxation, takes upon itself the task of regulating more and more areas of life. Unlike national parliaments, the EU’s Commissioners are not elected and do not have democratic legitimacy. Nevertheless, the range of EU competences is expanding constantly, at the expense of the power of national governments and legislatures. This is the practical meaning of the phrase ‘ever closer union’ in the preamble to the 1957 Treaty of Rome which founded the EEC (or ‘Common Market’).
Britain has no need to suffer the regulatory burden
The argument of this chapter may seem unduly alarmist, even over-cooked. If the cost of the EU regulatory apparatus is as much as 5% of GDP, does not that imply a similarly-sized burden for all EU countries? And how can such a large group of nations – nations that belong to the continent which pioneered scientific rationality and industrial civilization – be so foolish as to accede to regulations that destroy jobs and prosperity? Is this not madness on a gigantic scale? Further, if excessive regulation is impoverishing Europe by 5% or GDP or perhaps even more, why are nations on the European fringe still keen to join the EU? The answer – as in so much that conditions modern public policy in European nations – is to be sought in history.
In the 20th century Europe was the main theatre of two horrific world wars, with the principal European landed power – Germany – the loser on both occasions. Although Germany made a good recovery from the Second World War before the main EU institutions had emerged, Germany’s guilt and its people’s desire for geopolitical reinstatement have been the main driving forces behind European integration. But the citizens of Germany are not alone in wanting a European continent that is stable and peaceful. For example, the Baltic republics were for a few decades rubbed off the map of Europe after the Soviet Union invaded them in 1940 to carry out the secret protocol of the 1939 Molotov-Ribbentrop pact. They were tiny nations with modest populations, but over 30,000 Latvians, 35,000 Lithuanians and 60,000 Estonians were sum- marily deported and often killed by the Russian invaders.20
In much of Europe – and particularly in small, fragile nations such as the Baltic republics – the stability and prosperity of the last few decades are attributed to the ‘European construction’, meaning the EEC from 1957 and the EU from 1993. Both Germany and the smaller nations, and to a degree all the member states of the EU, have been prepared to invest in the process of integration, and to overlook its flaws and costs. They see European integration as a stage-like and inevitable historical progress in which they must participate.21 But Europe’s past is littered with the debris of utopian historicist doctrines. The over-burdening of the economy by excessive regulation is – in other words – another example of how the doctrine that ‘the ends justify the means’ is leading to a major disaster for European civilization.22
The puzzle here is why the citizens of the UK, or at any rate so many influential members of its policy-making elite, feel that their country must be involved. Its own history and traditions are very different from those of the continental European nations; it has no need to apologize for its past, to invest in European integration or to feel particularly vulnerable to renewed geopolitical trauma in its neighbours. As it happens, the dysfunctional characteristics of EU integration, and especially of the attempt at economic and monetary union that pivots on the introduction of the single currency, have now themselves become a potential cause of tension and upheaval. The UK has no need to suffer from the enormous burden of the 120,000 directives and regulations that constitute the acquis. We do not have to lose 5% or so of our GDP, with the toll rising over time, to participate in the great historical drama of ‘ever closer union’. On the contrary, the move ‘towards ever closer union’ is a process to which the overwhelming majority of our citizens are opposed.
The citizens of other European countries may be able to persuade themselves that a regulatory burden costing 5% of GDP is desirable and necessary for larger reasons of European ‘destiny’. But most people in Britain are not interested in this destiny, whatever it was, is or may become. We should not allow a foreign bureaucracy to squander a colossal chunk of our national output for a purpose that in fact we despise.
1 Rodney Leach Europe: a Concise Encyclopaedia (London: Profile Books, 2nd edition, 1998), p. 20. 2 Lord Denning Introduction to The European Court of Justice: Judges or Policy Makers? (London: Bruges Group, 1990).3 The 84% figure was given in the newspaper Welt am Sonntag in January 2007 in an article by Herzog. 4 Civitas EU Facts (London: Civitas website, updated 7th July 2011). 5 Sarah Gaskell and Mats Persson Still Out of Control?: Measuring eleven years of EU regulation (London: Open Europe, 2010), p. 5.6 Gaskell and Persson Still Out of Control?, p. 17.7 Gaskell and Persson Still Out of Control?, p. 17.8 Gaskell and Persson Still Out of Control?, p. 18.9 Danny Forston ‘Chemicals cry for help’, The Sunday Times, 6th February 2011.10 David Campbell-Bannerman The Ultimate Plan B: a positive vision of an independent Britain outside the European
How much does the European Union cost Britain?24
Union (Cheltenham: The Freedom Association, 2011), p. 30. 11 I discussed ‘the Bigger Bang’ of the offshore revolution in international financial services in an article in The Spectator ‘The Bigger Bang’, 18th October, 1986. 12 Alex Barker ‘Barnier vs. the Brits’, Financial Times, 8th November 2011. 13 The quotation is also from the Alex Barker article on Barnier in the Financial Times on 8th November 2011. 14 Jack Grimston ‘EU admits tax on bankers may cost 50,000 City jobs’, The Sunday Times, 9th October 2011. 15 The precise definition of ‘the City’ is difficult. Nowadays it is predominantly a provider of complex wholesale financial services to international customers, although the headquarters operations of UK-focussed organizations tend also to be located in London rather than other UK cities. I discussed the definitional issues in a Lombard Street Research report on Growth Prospects of City Industries for the Corporation of London, published in April 1998. The ‘City’ is usually said to employ between 350,000 and 500,000 people. 16 Assume that the value added in the export of UK financial services is £57.5 billion, that growth of 15% a year has been prevented by EU regulation and that on average resources in these activities are 25% more efficient than in their nearest alternative use, i.e., that the nearest alternative use of the resources is 80% as efficient as the City of London. Then the loss in the first year is (£57.5 billion x 15% x 20%, which is £1.7 billion. Assume that the figure rises year by year, because of the end of growth. Let us restrict the calculation to a period of only a decade, because the world is full of uncertainty and let us discount the ten years of losses by 10%. Then the capitalized value of the loss is £58.1 billion. For more on the EU threat to the City of London, see Tim Congdon The City of London under Threat: the EU and its attack on Britain’s most successful industry (London: Bruges Group, 2009). 17 To recall, the concept under consideration is the total of payments made by the British government and private sector to EU institutions, and over which we in the UK have no subsequent control.18 On the cost of EU regulation for the UK water industry, see – for example – Christopher Booker ‘Keeping us short of water is now government – and EU – policy’, The Sunday Telegraph, 13th May 2012. 19 Gunter Verheugen ‘The EU has no vision of where we are heading’ Der Spiegel, 9th February 2010. 20 Wikipedia is the source of these numbers.21 The historicist inspiration of the EU project was examined in my 2011 Goldsmith Lecture, which is available for the author from [email protected]. See, particularly, pp. 6 – 11 of Tim Congdon The handover of Great Britain (London: Centre for Democracy and Independence, 2011). 22 This may sound pompous. It is a reference to Isaiah Berlin’s essay on Alexander Herzen, which influenced Tom Stoppard’s 2002 trilogy The Coast of Utopia. ‘The fundamental thesis [in Herzen’s work]…is the terrible power over human lives of ideological abstractions.’ Isaiah Berlin Russian Thinkers (London: Hogarth Press, 1978), p. 193.

25How much does the European Union cost Britain?
Nations have a finite quantity of resources. According to one influential tradition of economic thought, the economic problem is to allocate these resources in the best way between different branches of production in order to deliver the greatest benefit to consumers. In the words of Lionel Robbins’ 1932 Essay on the Nature and Significance of Economic Science, economics could be defined as ‘the science which studies human behaviour as a relationship between ends and scarce means which have alternative uses’.1 In a celebrated discussion in book IV of The Wealth of Nations AdamSmith had illustrated the practical implication of Robbins’ definition over 150 years earlier.
Even in the late 18th century Scotland had the technological capacity to make wine. To recall a famous passage in The Wealth of Nations, ‘By means of glasses, hotbeds and hot walls, very good grapes can be raised in Scotland, and very good wine too can be made of them.’ Would it not then be reasonable ‘to prohibit the importation of all foreign wines to encourage the making of claret and burgundy in Scotland?’. Obviously not, as the outcome would be leave society in a worse- off situation or, in economists’ jargon, with ‘a sub- optimal allocation of resources’. The explanation is that Scotland’s resources are finite and the maximisation of wine output would lead to the loss of other kinds of production.
If all of Scotland’s available labour and capital had been committed in 1776 to the cultivation of grapes and the making of wine, there would have no scope for it to produce oats and barley, or linen and whisky. Smith conjectured that the cost of obtaining wine from glasses, hotbeds and hot walls might be about 30 times ‘the expense for which equally good [wines] can be brought from foreign countries’. The answer was for Scotland to allocate three units of resources to making whisky and to exchange whisky for wine, so that 97 units of resources could be allocated to other branches of production. Indeed, the great virtue of free trade is that – if people are allowed to specialize in particular activities as they see fit, and to choose goods and services without restriction – the economy tends to move towards an optimal allocation of resources. In economists’ jargon, the unfettered operation of market forces takes people and companies towards a situation in which marginal costs are in line with prices and prices correspond to marginal utility, and in which the sum of so-called ‘consumers’ and producers’ surpluses’ is maximised.3
The purported ‘four freedoms’ of the single market
The intellectual case for free trade is compelling. The official rhetoric of the EU does in fact pay homage to ‘freedom’ in the abstract. The EU’s internal market – also known as ‘the single market’ – is said to promote ‘four freedoms’, the freedom of movement of goods, capital, services and people, between the member
states. To its credit, the EEC/EU has also participated in the global trend towards trade liberalisation over the last 50 years. That has meant that the level of tariffs is now very low, and trade between EU member states and countries outside Europe is a high multiple of its volume in the late 1950s.
However, the pursuit of the four freedoms in the EU’s internal market has not altogether precluded restrictions on trade with the rest of the world. To its discredit, the EEC/EU has obstructed the liberalisation of international trade in two major respects. First, agricultural protectionism in the form of the Common Agricultural Policy has been a central feature of ‘the European construction’ since the early 1960s. Secondly, from its early days the EEC/EU has acted as a customs union, with a common external tariff against imports from the rest of the world. More seriously, the common external tariff has sometimes been supplemented by outright protectionism, usually justified on the grounds that foreign products from non-EU countries are being ‘dumped’ on the European market. Both the CAP and anti-dumping measures have led to resource misalloca-tion. This resource misallocation has made the citizens of EU member states – including the UK – poorer than they otherwise would have been. The extent of the resource misallocation therefore needs to be measured and incorporated in any cost-benefit assessment of EU membership. The CAP is discussed first, because from the outset – even in the 1960s – it was regarded in the British debate as a major negative of EU membership. Indeed, the CAP has always been an embarrassment to British Europhiles, and the British government has put constant pressure on other EU governments to wind down and limit the CAP. One perhaps surprising mes-sage of this chapter will be that nowadays resource misallocation due to more general EU protectionism has a much higher cost to the UK than resource misal-location due to the CAP.
The costs of the Common Agricultural Policy
The UK can obtain its food in two ways. It can produce the food itself, or it can make non-food products and sell them to other countries in exchange for food. The relative efficiency of the two methods depends on the quantity of resources needed, allowing of course for transport costs, which ought inherently to favour UK production. The optimal approach may be for the UK to use its resources of land, labour and capital to produce manufactured goods and services, to sell some of these goods and services to other countries, and to import food at world prices. That makes particular sense if the world price of food is lower than the UK production cost. There is nothing inevitably beneficial or advantageous to our country in trying to accomplish 100% self-sufficiency in food supply. (The argument here is just the same as in Adam Smith’s parable about the making of wine in 18th century Scotland. It would have been wrong, economically sub-optimal, for Scotland to
3. The costs of resource misallocation

How much does the European Union cost Britain?8 How much does the European Union cost Britain?26
aim for 100% self-sufficiency in wine; it would also be wrong, economically sub-optimal, for the UK today to aim for 100% self-sufficiency in food. To concentrate resources on food production would be misguided, even if the craziness of 100% food self-sufficiency for modern Britain is less obvious than the craziness of 100% wine self-sufficiency in 18th century Scotland.)
Unfortunately, self-sufficiency in food is a nice sound-bite in contemporary European politics. The origins of the CAP are to be sought – as with so much of the EU’s institutional framework – in history, particularly in the post-war context of large parts of continental Europe. Difficult though it may be to imagine nowadays, most of the current EU membership suffered severe food short-ages in the closing phase of the Second World War and its immediate aftermath. With calorie intake per person lower than in the 1930s, the diversity and quality of food in the shops was sharply reduced, and rationing was extensive. Europe was for some years dependent on American food supplies and goodwill. Memories of this period survive to this day. In evidence to the House of Lords European Union Committee, for its 7th report of the 2007/8 session, Yves Madre of the French Permanent Representation to the EU said that the CAP was intended to secure ‘food independence’ for Europe. The French government’s view was that ‘food is a political tool and if you have a shortage of food you will be weak’.4
The French attitude is that the political security of food supply should sometimes take precedence over the efficient allocation of resources. The CAP has therefore from its start in 1962 caused the cost of food in the EU to be higher than would otherwise be the case. In par-ticular, it is higher than it would be if imports were un-restricted, if European production were not artificially subsidized and if European households could buy food at the world price. Estimates of the size of the loss to the UK have varied over the years. The Organization of Economic Cooperation and Development is said to have estimated in 1993 that, in one way or another, the CAP was adding £1,000 a year, or £20 a week, to the food bill of the average UK family.5 At the time the average annual personal disposable income per head was £7,909, while the average household with more than one breadwinner would have had to cope on an after- tax income of under £20,000.6 Indeed, £1,000 per household implied a cost to the UK of over 4% of gross domestic product. In qualification, it needs to be remembered that this figure included both the govern-ment transfer to the EU to cover the UK’s share of the fiscal cost of the CAP and the loss to the UK from the misallocation of resources to agriculture. The figure nevertheless looks implausibly high, since the farm sector – then and now – does not represent anywhere near 5% of the UK’s value added (i.e., its output). If the total value of farm output is not as much as 5% of national output, how can a distortion in resource allocation amount to that kind of number?
A more up-to-date analysis has been provided by Open
Europe, confirming its reputation as a key source of au-thoritative and interesting research on the EU. In a brief-ing note on a report of 27th February 2012, under the title More for Less: Making the EU’s farm policy work for growth and the environment, it made the following comment
The cost to consumers and taxpayers across Europe of the EU’s farm subsidies and tariffs now stands at €86.9bn – of this €52.5bn stems from CAP subsidies. If, hypothetically, the CAP and other EU measures to protect farming, such as tariffs, were fully liberalised and the money freed up were re-channelled to more productive areas of the economy, it could be worth a boost in output equivalent to €139bn or 1.1% of EU GDP. Britain would experience a boost in output of €14.2bn or the equivalent of 135,000 full-time and part-time jobs.
This sort of number – 1.1% of GDP – is far more sensible than the 4% of GDP suggested almost 20 years ago. In its February 2012 exercise Open Europe again worked with an analysis from the OECD. Total support to farmers and others in the food supply chain in the EU was estimated by the OECD to have been €105 billion, of which €27.2 billion came from national programmes.
The remaining €77.8 billion represented the cost of the CAP for the EU as a whole, with a €8.27 billion share attributable to the UK by itself. That €8.27 billion in turn reflected both the direct fiscal cost to the UK of the CAP and the cost of resource misallocation with which we are more specifically concerned in this chapter. In the first chapter it was shown that the direct fiscal cost of EU membership to the UK has risen since 2008, while allowance has also to be made for movements in ex-change rates and prices. With some other adjustments, that could take the total cost to the UK of the CAP to-day towards Open Europe’s figure of 1.1% of GDP, which is in fact over £16 billion. The proportion of this that might be blamed on the EU’s tariffs on imported food and other CAP protectionism depends on the assump-tions made, but 50% seems generally considered to be reasonable.8
The cost to the UK of the resource misallocation inherent in the CAP then emerges as about ½% of GDP or about £7½ billion a year. The point ought already to be clear, but it needs to be emphasized that the cost of resource misallocation is additional to the direct fiscal cost of the EU’s agricultural subsidies.
The costs of trade distortion overall
This loss of ½% of GDP arises partly because the UK devotes too high a proportion of its scarce resources to producing food, when it ought to be allocating those resources to exports (i.e., exports of manufactured goods and services) and using those exports to pay for cheaper food imports.9 But it is also due to another
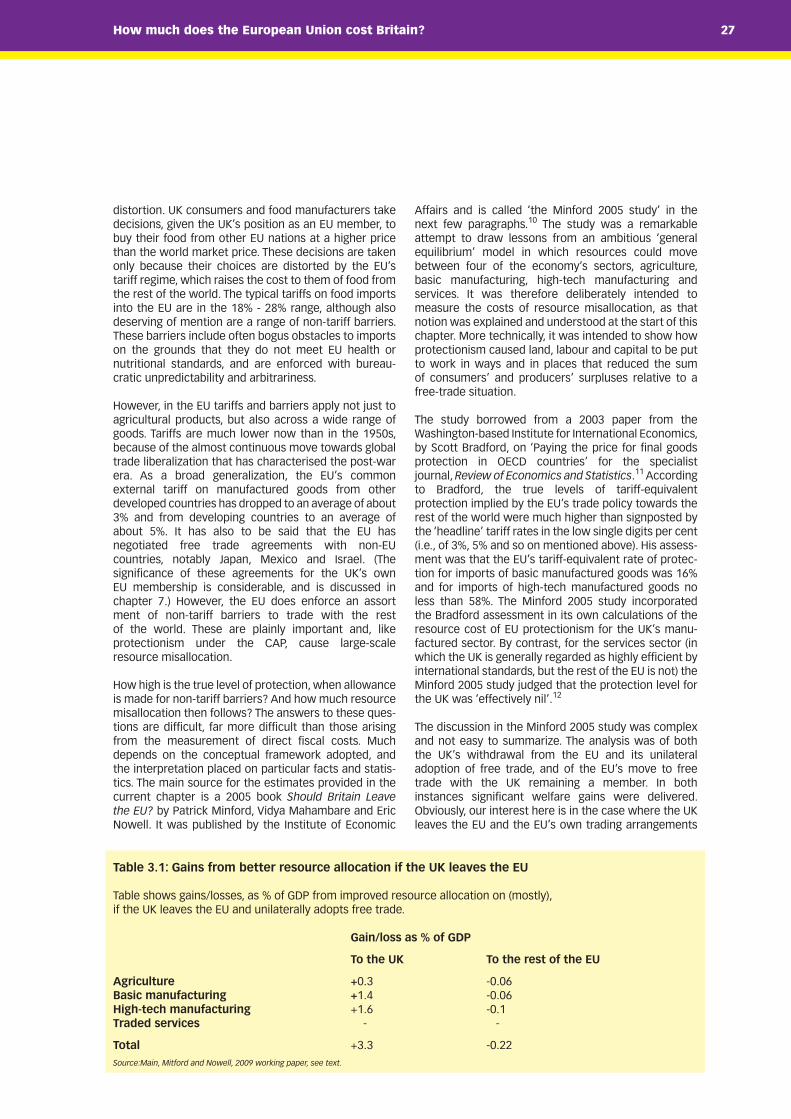
9How much does the European Union cost Britain? 27How much does the European Union cost Britain?
distortion. UK consumers and food manufacturers take decisions, given the UK’s position as an EU member, to buy their food from other EU nations at a higher price than the world market price. These decisions are taken only because their choices are distorted by the EU’s tariff regime, which raises the cost to them of food from the rest of the world. The typical tariffs on food imports into the EU are in the 18% - 28% range, although also deserving of mention are a range of non-tariff barriers. These barriers include often bogus obstacles to imports on the grounds that they do not meet EU health or nutritional standards, and are enforced with bureau-cratic unpredictability and arbitrariness.
However, in the EU tariffs and barriers apply not just to agricultural products, but also across a wide range of goods. Tariffs are much lower now than in the 1950s, because of the almost continuous move towards global trade liberalization that has characterised the post-war era. As a broad generalization, the EU’s common external tariff on manufactured goods from other developed countries has dropped to an average of about 3% and from developing countries to an average of about 5%. It has also to be said that the EU has negotiated free trade agreements with non-EU countries, notably Japan, Mexico and Israel. (The significance of these agreements for the UK’s own EU membership is considerable, and is discussed in chapter 7.) However, the EU does enforce an assort ment of non-tariff barriers to trade with the rest of the world. These are plainly important and, like protectionism under the CAP, cause large-scale resource misallocation.
How high is the true level of protection, when allowance is made for non-tariff barriers? And how much resource misallocation then follows? The answers to these ques-tions are difficult, far more difficult than those arising from the measurement of direct fiscal costs. Much depends on the conceptual framework adopted, and the interpretation placed on particular facts and statis-tics. The main source for the estimates provided in the current chapter is a 2005 book Should Britain Leave the EU? by Patrick Minford, Vidya Mahambare and Eric Nowell. It was published by the Institute of Economic
Affairs and is called ‘the Minford 2005 study’ in the next few paragraphs.10 The study was a remarkableattempt to draw lessons from an ambitious ‘general equilibrium’ model in which resources could move between four of the economy’s sectors, agriculture, basic manufacturing, high-tech manufacturing and services. It was therefore deliberately intended to measure the costs of resource misallocation, as that notion was explained and understood at the start of this chapter. More technically, it was intended to show how protectionism caused land, labour and capital to be put to work in ways and in places that reduced the sum of consumers’ and producers’ surpluses relative to a free-trade situation.
The study borrowed from a 2003 paper from the Washington-based Institute for International Economics, by Scott Bradford, on ‘Paying the price for final goods protection in OECD countries’ for the specialist journal, Review of Economics and Statistics.11 According to Bradford, the true levels of tariff-equivalent protection implied by the EU’s trade policy towards the rest of the world were much higher than signposted by the ‘headline’ tariff rates in the low single digits per cent (i.e., of 3%, 5% and so on mentioned above). His assess-ment was that the EU’s tariff-equivalent rate of protec-tion for imports of basic manufactured goods was 16% and for imports of high-tech manufactured goods no less than 58%. The Minford 2005 study incorporated the Bradford assessment in its own calculations of the resource cost of EU protectionism for the UK’s manu-factured sector. By contrast, for the services sector (in which the UK is generally regarded as highly efficient by international standards, but the rest of the EU is not) the Minford 2005 study judged that the protection level for the UK was ‘effectively nil’.12
The discussion in the Minford 2005 study was complex and not easy to summarize. The analysis was of both the UK’s withdrawal from the EU and its unilateral adoption of free trade, and of the EU’s move to free trade with the UK remaining a member. In both instances significant welfare gains were delivered. Obviously, our interest here is in the case where the UK leaves the EU and the EU’s own trading arrangements
Table 3.1: Gains from better resource allocation if the UK leaves the EU
Table shows gains/losses, as % of GDP from improved resource allocation on (mostly), if the UK leaves the EU and unilaterally adopts free trade.
Gain/loss as % of GDP
To the UK To the rest of the EU
Agriculture +0.3 -0.06Basic manufacturing +1.4 -0.06High-tech manufacturing +1.6 -0.1Traded services - -
Total +3.3 -0.22
Source:Main, Mitford and Nowell, 2009 working paper, see text.

How much does the European Union cost Britain?28
remain much as now.13 (The EU’s trade arrangements would of course not be exactly the same, because the UK would have left and a new EU/UK trade understand-ing would have to be reached.) The Minford 2005 view was that departure from the EU (leading to a fall in the tariff-equivalent rate of protection to zero, from 16% for basic manufactured goods and 58% for high-tech manufactured goods) would generate for the UK by itself resource allocation gains of 1.4% of GDP in the basic manufacturing area and 1.6% of GDP in the high-tech manufacturing area. The rest of the EU would lose very slightly, as UK trade would be diverted towards the rest of the world and less import tariff revenue would be collected. The table above – taken from the Minford 2005 study – sets out the main points.14 The cost to the UK of resource misallocation due to EU trade policy was put at over 3% of GDP. Given that no large changes to the EU’s international trade regime have occurred since 2005, that still seems a reasonable benchmark for thinking about the subject today.
An example: a London factory faces closure risk because of EU policy
This number – over 3% of GDP – may seem large, perhaps surprisingly large. But an obtrusive fact about the modern world is the markedly higher standard of living in genuine free-trade jurisdictions (such as Hong Kong and Singapore) than in neighbouring societies, and the spectacular advances in living standards that have accompanied unilateral trade liberalizations. (The Chinese trade liberalization since the late 1970s is the most salient example, but there are many others.) When the UK joined the EEC in 1973 the increased cost of food, and the resulting damage to the efficiency of UK resource allocation and British farming, were identified as major drawbacks of accession. They were indeed major drawbacks, but it has to be conceded that – as the farm sector has shrunk in relative importance – so also has the significance of the trade distortions arising from the CAP.
But that does not mean that all is well. The UK’s interests, in food manufacturing as well as agriculture, remain vulnerable to mischievous regulatory decisions from the European Commission. A particularly alarming illustration has emerged recently, from a proposal that sugar beet quotas are to be eliminated from October 2015, while sugar cane imports are to stay heavily re-stricted. The subtext here is that several EU countries, including Germany and France, are producers of sugar beet, whereas sugar cane is imported from the tropics. The effect of the proposal would be to favour farmers (that is, German and French farmers) producing sugar beet, while companies refining imported cane sugar would be penalized. The largest cane sugar refinery in Europe is in fact in London, with the main plants – which belong to Tate & Lyle Sugars – located on the Thames so that the raw material can be easily imported. Tate & Lyle Sugars (which is now American-owned) produces about 40% of the EU’s cane-based
sugar, with the bulk of it from the London operation.
The Commission’s proposal would wreck the com-petitiveness of cane-based sugar production in the EU and could lead to the complete closure of the Lon-don refinery, with the loss of 850 jobs. (The refinery is already working at well beneath capacity and some jobs have gone.) Needless to say, the owners of Tate & Lyle Sugars have protested vigorously. In evidence to the House of Commons’ Environment, Food and Rural Affairs Committee on 31st May 2012, they observed ‘a rudimentary economic analysis would flag that [the proposal] would destroy the cane refining industry in Europe as it does not provide fair and equal terms of access to raw materials’. Further, the Commission’s approach reflected lobbying and bargaining power, not economic rationality. To quote again from the 31st May evidence, ‘Just two member states rely solely on cane refining, whilst 18 rely solely on beet processing. Proposing equal treatment for cane refiners would be the right thing to do, but would clearly not be popular with a majority of member states.’
Cane-based sugar production requires far less resources to make sugar, particularly if the cane sugar is sourced at world prices, than beet-based sugar production. But the EU is openly planning to discriminate against the most economically efficient method of production in order to cater for special interest groups in certain countries. British output, jobs and tax revenue are at stake. As Stuart Agnew, MEP for the UK Independence Party and a farmer, said to the EU Agricultural Commis-sioner Dacian Ciolos in European Parliament proceed-ings, ‘the factory is going to close and you, actually, are the one person in the world who can keep it open’. The outcome will depend on lobbying and bargaining, not on respect for the laws of supply and demand, or the aim of optimal resource allocation.15 (What was that someone said about might before right? Or indeed macht geht vor recht?)16
Summary: resource misallocation costs over 3% of GDP
Resource misallocation is less obvious than a direct fiscal payment. It does not appear on a bank statement or in a standard set of accounts. Nevertheless, the cost of resource misallocation is as definite as the cost of a tax payment or a fiscal transfer. In an economy closed to international trade consumers and producers are worse-off relative to a free-trade situation. Consum-ers are worse-off because they have to pay more, in terms of the number of working hours needed, for all the products they consume, while producers have to reduce output because their inputs are needlessly expensive. The EU is undoubtedly a protectionist organization to some extent, most conspicuously because of the CAP but also because of restrictions on manufactured imports.
The UK would be better-off in a free-trade situation
29How much does the European Union cost Britain?
than it is today as a participant in EU protectionism. An estimate of the degree of resource misallocation is therefore an essential part of any wider appraisal of the cost of the EU. The Minford 2005 study provided such an estimate in a sophisticated analytical framework. The answer was that resource misallocation due to EU protectionism caused a loss to the UK of over 3% of its GDP.17 A later analysis reached a similar conclusion, suggesting that continued protectionism reflected the interests of ‘European elites’ and expressing concern that little change is to be expected with existing EU arrangements. ‘At best the EU seems condemned to
suffer poor policies for a long time to come, with reforms arriving glacially if at all.’18 If supporters of European integration want to dispute the Minford estimates, they are of course free to do so. But they too must employ an equally rigorous analytical model which conforms to the recognised theoretical principles in this branch of economics. Brussels bureaucrats may give bland reassurances that trade policy is developed in order to serve the interests of the EU as a whole. The disgrace-ful treatment of the Tate & Lyle sugar refinery on the Thames shows that such reassurances are not to be trusted.
1 Lionel Robbins An Essay on the Nature and Significance of Economic Science (London: Macmillan, 1932), p. 16. 2 R. H. Campbell and A. S. Skinner (eds.), of Adam Smith An Enquiry into the Nature and Causes of the Wealth of Nations (Oxford: Clarendon Press, 1976, originally published in 1776), p. 458. 3 This proposition is generally known as ‘the first fundamental theorem of welfare economics’, and is basic to the defence of free markets and competition. Its mathematical proof, usually attributed to Kenneth Arrow and Gerard Debreu, is complex. Because a number of potentially unrealistic assumptions have to be made to derive the proof in its full rigour, the theorem is controversial. Nevertheless, it provides a benchmark for thinking about the problem of resource allocation. 4 House of Lords European Union Committee, 7th report of the 2007/8 session, The Future of the Common Agricultural Policy, vol.1: Report, HL paper 54-I (London: The Stationery Office, 2008), p. 17. 5 The attribution of this estimate to the OECD was made by Christopher Booker and Richard North in their book The Mad Officials (London: Constable, 1994). 6 Economic Trends (London: The Stationery Office, 1997), July 1997 issue, p. T6.7 Christopher Howarth, Anna Kullmann and Pawel Swidlicki More for Less: Making the EU’s farm policy work for growth and the environment (London: Open Europe, 2012). 8 In More for Less, Howarth, Kullmann and Swidlicki suggested that – of their estimated €8.27 billion total cost in 2008 – €4.6 billion was ‘for taxpayers’ (i.e., it was the direct fiscal cost) and €3.67 billion was ‘for consumers’ (i.e., it reflected resource misallocation), implying a resource misallocation proportion of 44%. I have raised the proportion slightly, because Howarth, Kullmann and Swidlicki seem to have over-estimated the CAP element in the UK’s gross contribution to the EU budget. For many years the EU’s regional development budget has been growing relative to the agricultural support budget. They conceded that it ‘is impossible to trace exactly where the consumer transfers come from’, while observing that ‘nearly all result from CAP-related intervention in EU agricultural markets’. Howarth, Kullmann and Swidlicki More for Less, p. 17. 9 Similarly, in every EU member state the CAP causes more resources to be allocated to farming than would be true in a free-trade situation. As is well-known, by the early 1990s the resulting over-production led to the notorious ‘wine lakes’ and ‘butter mountains’, with the surplus products then being dumped on world markets at prices not only less than the cost of production, but even lower than the world price that had earlier prevailed. The over-production was tackled in a series of reforms (the 1992 MacSharry reforms, the 2003 Fischler reforms), so that EU subsidies were no longer related to production. However, the economic rationale of subsidization then became even less obvious, with money sometimes being paid to farmers for setting aside their land from production altogether! Farmers of course have to justify receiving the money by filling up a large number of forms. ‘Detested by farmers for the paperwork it begets, by free-marketeers for its self-contradictions, set-aside is a CAP measure, introduced in 1988, for cutting production by compensating farmers for taking part of their land out of cultivation.’(Rodney Leach Europe: a Concise Encyclopaedia [London: Profile Books, 3rd edition, 2000), p. 211.) 10 Patrick Minford, Vidya Mahambare and Eric Nowell Should Britain Leave the EU? (London: Institute of Economic Affairs, 2005). 11 Scott C. Bradford ‘Paying the price for final goods protection in OECD countries’, Review of Economics and Statistics (Boston, USA: MIT Press, 2003), vol. 85, issue no. 1, pp. 24 – 37.12 Minford, Mahambare and Nowell Should Britain Leave the EU?, p. 178.13 The EU’s trade arrangements would of course not be exactly the same, because the UK would have left and a new EU/ UK trade understanding would have to be reached.14 For more detailed discussion, see pp. 175 – 81 of Minford, Mahambare and Nowell Should Britain Leave the EU?, The study also considered, as a conjecture, a further case in which agricultural free trade was accompanied by the removal of planning restrictions on the use of farmland, so that all farmland became available for manufacturing and other uses. The verdict was that ‘the gain to welfare to the UK is dramatically larger at 29%’ of GDP. The study cautioned that, ‘One may legitimately have doubts about the political feasibility of this solution which is why we do not use it as our central estimate.’ (Minford, Mahambare and Nowell Should Britain Leave the EU?, p. 184.) 15 Written evidence submitted by Tate & Lyle Sugars to the House of Commons’ Environment, Food and Rural Affairs Committee, 31st May 2012, clauses 23 and 24. See also Boris Johnson ‘Brussels is slowly beeting the life out of our

How much does the European Union cost Britain?30
sugar industry’, The Daily Telegraph, 20th February 2012. In Johnson’s words, the original venture ‘was founded by Henry Tate in 1878, and he made so much money from the sweet tooth of the British empire that he was able to endow the great art gallery that bears his name. In 1921 he teamed up with Abram Lyle, and to this day Tate & Lyle are selling a million of their beautiful green-gold tins of syrup every year.’16 The phrase macht geht vor recht is commonly attributed to Bismarck, although he denied that he ever uttered it. It is an example of Prussian-ism at its worst. 17 Strictly, the Minford 2005 study calculated the resource misallocation cost, plus a ‘transfer effect’ where one EU member pays to another EU member more than the world price for a good or service because of the customs union, plus also an allowance for the impact of EU policy on the world prices of imports and exports (i.e., ‘a terms of trade effect). 18 See Vo Phuong Mai, Patrick Minford and Eric Nowell ‘Economic policy: protectionism as an elite strategy’, Cardiff Business School Working Paper Series, no. E2009/1 (Cardiff: Cardiff Business School, 2009).

The first three chapters of this study have trodden relatively familiar ground in the debate on the UK’s membership of the EU. Right from the start of our membership in 1973 it was understood that the UK would be a net contributor to EEC/EU funds, and that the protectionist CAP would cause an increase in food prices and resource misallocation. By contrast, the topics surveyed in this and the next two chapters could not have been foreseen 40 years ago because, at that stage, hardly anyone envisaged large-scale inward migration from the rest of the EEC/EU. Suggestions have been made in the media that in the last few years inward migration particularly from Eastern Europe, has restricted the availability of jobs to the UK-born. This development has therefore hurt the citizens of our country and been costly to us. Precise calculations of the costs are difficult and will not be attempted here.1 But it is clear that a harm has been inflicted on ‘the British people’, in the sense of people who are UK-born as well as enjoying British residence and citizenship.
Blair opens UK labour market
The downfall of communism in the late 1980s and early 1990s was one of the most welcome developments in modern European history. It was welcome not least because it confirmed the superiority of the market economies of Western Europe, with their respect for the rule of law and private property, over the planned and largely state-owned economies of the former Soviet bloc. Once they were freed from Moscow’s clutches most of the countries in the former Soviet bloc wanted to join the EU. Various entry criteria were specified in the 1990s and these took a number of years to meet, but eight central and Eastern European countries (Czech Republic, Estonia, Hungary, Latvia, Lithuania, Poland, Slovakia, and Slovenia) were able to join the EU on 1st May 2004. This was the largest single enlargement in terms of people, and number of countries, in the history of the EEC/EU. (Note that Cyprus and Malta joined at the same time, but they were of course not from the former Soviet bloc and are ignored in the rest of the chapter.)
Income levels in the ‘EU8’ (as they became known) were appreciably below those in Western Europe. (See chart below. In 2004 UK income per head, at over $36,000 in terms of current price $s, was more than five times higher than in Poland or Lithuania.) As noted in the pre-vious chapter, the freedom of movement of people is one of the ‘four freedoms’ of the EU’s single market. But, if the EU8 had been granted such freedom on their accession to the EU, the income disparities would almost certainly have led to large movements of workers to the richer EU member states. Most of the EU’s older member states therefore introduced a seven-year transition period, in which they limited inward migration from the EU8. The UK, led by prime minister Tony Blair, decided not to follow this course. Instead people would be free to move from the EU8 to the UK as soon as the EU8 belonged to the EU. From 1st May 2004, potentially millions of working-age people were free to move from the EU8 to the UK (and indeed Ireland, since people can move freely between the UK and the Republic of Ireland). The British government expected only a modest influx of new workers. In practice immigration from the EU8 was on an extensive scale, with major effects on the UK labour market. Official data show that in spring 2004 64,000 people born in the EU8 were employed in the UK, about double the level of five years earlier, but still only 0.2% of total UK employment. Between March 2004 and the end of 2007, a period of relatively buoyant economic conditions and strong demand for labour, the number rose from 64,000 to 487,000. Within less than four years the importance of EU8 workers had increased so sharply that they accounted for 1.7% of total UK employment. The growth of employment in this period for UK-born workers was only a little more than 100,000, a mere quarter of the surge of over 400,000 in employment of EU8-born workers.
From late 2007 the UK economy’s performance deteriorated markedly. The situation was not too bad in early 2008, but by late 2008 grave weaknesses in the international banking system became evident, and a major downturn in demand and employment began. The worst phase of the ensuing Great Recession was in the opening months of 2009, when tens of thousands of jobs were disappearing every week. The labour market in the UK was then dominated by UK-born workers, as it still is today, although to a lesser extent. At the end of 2007 total employment was just under 29.5 million, split between UK-born of 25.9 million (87.7% of the total) and foreign-born of 3.6 million (12.3%). On the whole the foreign-born workers had generally been in their jobs for a shorter period than the UK-born, while in many cases they occupied temporary positions or had only a half- hearted commitment to the UK.2 A reasonable surmise might have been that a fall in the demand for labour would cause higher job losses for the foreign-born than the UK-born. That surmise would, in the event, turn out to be completely wrong. In the Great Recession UK-born employment has dropped heavily, whereas foreign-born employment has risen and employment
4. The cost of lost jobs
0
10,000
20,000
30,000
40,000
50,000
60,000
1999 2001 2003 2005 2007 2009 2011
LithuaniaPolandUK
Income disparity between the UK and Eastern EuropeChart shows income per head in $s of the day according to the IMF
31How much does the European Union cost Britain?

How much does the European Union cost Britain?32
of people from the EU8 has climbed substantially. The figures are set out above, in the chart.
UK-born people did lose jobs
The fall in UK-born employment was concentrated in the year to mid-2009 and amounted to about 800,000 people, about 3% of the number of UK-born people in jobs at the end of 2007. After mid-2009 the number of UK-born people at work has fluctuated from time to time, but the underlying trend has apparently been for stability. In reality labour market conditions have remained tough in the last three years. Many British people have left full-time employment, while part-time employment and self-employment have expanded. By contrast, foreign-born people have made continuing inroads into the UK job market. The chart relates to changes in the level of employment, in terms of thousands. It shows that employment of both people born in the EU8 and people born in the rest of the world (i.e., in neither the UK nor the EU8) has increased by about 200,000 in the Great Recession (i.e., by about 400,000 for the two foreign-born groups altogether). The top chart opposite above gives the percentage change in employment relative to the end-2007 figure. The result is an altogether more dramatic picture, because the number of Eastern European people in Britain in late 2007 was still quite low and the employment surge was from a small base. Employment of EU8-born people soared by 45% in the four years to end-2011. In short, in the Great Recession the number of jobs occupied by the UK-born slumped by 800,000 in a year
and stayed down, whereas the number of jobs occupied by the EU8-born increased by 200,000 or by about 45%.
Does this constitute prima facie evidence that people of British birth have lost jobs because of the influx of working-age men and women from the EU8, because – in other words – of our EU membership? The UK labour market has undoubtedly become more difficult and hostile for UK-born people in the last few years. There must be a strong presumption that jobs are harder to find not just because of the Great Recession, but also because a large number of immigrants, many of them from Eastern Europe, are competing for the few positions available. Admittedly, a strong presumption is not definite proof. But one further set of numbers may open the minds of even the most obstinate Europhiles. These numbers, prepared by the Office for National Statistics, ought to be enough to persuade most people that over the last decade immigration from the EU has reduced job prospects for people who are not just British by residence, but British by citizenship and birth.
The bottom chart opposite shows the proportion of the resident working-age population that is actually in UK employment for three groups, the UK-born, those born in the EU14 (i.e., existing members of the EU before the 2004 enlargement) and those born in EU8. In other words, it shows what we might term ‘employment ratios’ for these groups. Until the 2004 enlargement, UK-resident people born in the EU8 had an employment ratio beneath that of both the UK-born
Q1
2008
Q2 Q3 Q4 Q1
2009
Q2 Q3 Q4 Q1
2010
Q2 Q3 Q4 Q1
2011
Q2 Q3 Q4
-1200
-700
-200
300
800 UK - bornBorn in EU8Born in rest of world
Employment trends in the Great RecessionChart shows employment change, quarterly, in thousands from level at end – 2007

33How much does the European Union cost Britain?
UK - bornBorn in EU8Born in rest of world
-10
0
10
20
30
40
50
Employment trends in the Great RecessionChart shows % cumulative change, quarterly, from end – 2007 levels in UK – and foreign-born employment
2008 2009 2010 2011
Employment ratios in the Great Recession of people of different nationality, by birthChart shows % of working-age population, of groups born in the UK and EU, actually in UK employment
1997 1998 1999 2000 2001 2002 2003 2004 2005 2006 2007 2008 2009 2010 2011
UK - bornBorn in EU14Born in EU8
30
40
50
60
70
80
90
100

How much does the European Union cost Britain?34
and those born in long-standing EU member states. Their propensity to seek employment then changed radically. Notice what happened in the four years from the first quarter 2004. The employment ratio of the EU8-born group soared from 61.9% to 82.6%. So in those years UK-resident people born in the EU8 had an employment ratio well above that of both the UK-born and those born in the EU14. The greater part of this increase occurred in a spectacular leap in late 2004, just as the UK labour market was opened up workers from Eastern Europe by the EU8’s accession to the EU. The obvious interpretation is that these workers were keen to take advantage of the much higher wages offered in the UK and sought work in our country. Further, when the Great Recession hit and the number of job opportunities declined, the immigrants did take jobs from the British-born. In this sense EU membership did destroy UK jobs.
Some academic research is also consistent with the claim that immigration hurt the job prospects of UK-born people, particularly the young. Youth unem-ployment has been appreciably higher over the last ten years than in the 1980s. As noted by Petrongolo and van Reenen in a study for the London School of Economics’ Centre for Economic Performance, since ‘the rise in youth unemployment dates back to 2004, the year of the EU’s enlargement to take in eight central and eastern European countries…, it would be natural to think that the increase in youth unemployment is related to stronger competition from immigrant labour’. When a regression was estimated between youth unemployment and the immigration across UK regions over time, evidence showed that ‘a one percentage point increase in the proportion of foreign-born in the working-age population is associated with an increase in youth unemployment of 0.43 percentage points’.3
Official endorsement, sort of
The conclusion just drawn is highly contentious, not least because it challenges the ‘cosmopolitan’ or ‘internationalist’ outlook of many key opinion-formers.4
However, the notion that immigration could reduce UK-born employment did receive official endorsement in January 2012 in a report prepared by Professor David Metcalf, the chairman of the Migration Advisory Committee, which is sponsored by the UK Border Agency. The MAC report claimed that employment of 160,000 more British people would have been possible in the 2005 – 10 period if no migrants from outside the EU had come to the UK. Asked directly if there would have been this number of extra jobs if immigration from outside the EU had been stopped, Metcalf answered, ‘yes, that would be a reasonable way of putting it’.5
The puzzle here is the restriction of the MAC analysis to immigration from outside the EU. If immigration from outside the EU can reduce employment for British citizens, why cannot immigration from within the EU have the same effect? Common sense would suggest that the employment-reducing effect of immigration
ought to apply regardless of the source country. The argument might be made that immigration from outside the EU was generally of lower-wage workers than, say, EU8 immigration. However, that in fact was not true. Non-EU immigration was partly from such countries as the USA, Canada and Australia with much higher living standards than the EU8. Indeed, an analysis prepared inside the government machine showed that workers from the EU8 countries tended to be in low-wage employment to a far greater extent than the UK-born. To quote, ‘Examination of the occupations of workers born in EU14 countries show that they are predominantly employed in “Professional occupations” (23.3%), “Associate professional and technical” (17.6%) and “Management and senior officials” (14.3%). These categories account for 55.3% of EU14-born workers. The same occupations account for 44.2% of UK-born workers and 46.6% of other non-UK-born workers, but only 14.5% of EU8-born workers. EU 8-born workers are predominately employed in “Elementary occupations” (37.5%).’ 6
The MAC analysis said that the 160,000 jobs lost due to immigration reflected ‘700,000’ extra working-age migrants in the 2005 – 10 period. In fact, official data for the period from the final quarter of 2004 to the first quarter of 2011 show an increase in non-EU immigrant workers of 652,000 and of EU immigrant workers of 588,000. If the ‘700,000’ non-EU immigrant workers are supposed to have destroyed 160,000 jobs for the UK-born, then the 588,000 EU immigrant workers destroyed about 135,000 jobs for the UK-born. No doubt the government could find spokesmen to deny that its research effort had implied any adverse effect on UK employment attributable to the post-2004 influx from Eastern Europe. But the discussion in this chapter has been carefully argued and meticulously sourced.
Inspection of the official data identified two points. First, since 2004 immigration from the EU8 has been on an unprecedented and remarkable scale. Secondly, these immigrants have, to an exceptional extent, taken up employment in the UK. (As we have just seen, their ‘employment ratio’ soared in 2004 and 2005, and since then has been well above that for the UK-born or the other foreign-born groups.) The post-2004 influx has been the result of Blair’s decision in 2003 not to impose the seven-year transition period favoured by other long-standing EU members, but the influx can be seen as a consequence of EU membership. While the UK remains a member of the EU, it cannot restrict immigration from other EU member states because the free movement of people is one of the single market’s ‘four freedoms’. The UK’s membership of the EU has destroyed British jobs and, while we remain inside, it will continue to do so.7 Translating this loss into a proportion of GDP is not straightforward, but something is needed and ¼% of GDP is unlikely to be an over-estimate. (See footnote 1.)

35How much does the European Union cost Britain?
1 The difficulty arises partly from the ambiguity of the concept of ‘a nation’. Is a nation to be defined as those people resident in it at a particular time or over a particular period, or the people born there (again with some time interval in mind ), or the people who are ‘citizens’ (where the notion of citizenship is also to some extent a matter of definition)? Later in the chapter a statement will be made to the effect that ‘135,000 jobs were lost because of immigration from the EU’ in the 2005 – 10 period. One calculation of the loss ‘to the UK’ might then be the output that would have expected from 135,000 people, if they had been in work and had had average UK productivity, which comes out at about £7 billion a year. I am under few illusions about the fragility of the assumptions required to deliver this result. 2 Official data show that in the year to September 2011 696,000 people of Indian birth and 614,000 people of Polish birth were estimated to be resident in the UK, and these were the two most common countries of birth (apart of course from the UK). They also show that in the same period the 654,000 Polish nationals, 341,000 nationals of the Republic of Ireland and 330,000 Indian nationals were estimated to be resident in the UK. Clearly, birth status and nationality did not coincide, and nearly all of the people of Polish birth resident (and usually working) in the UK regarded themselves as Polish, which was not true of those of Indian origin. 3 Barbara Petrongolo and John van Reenen ‘Youth unemployment’, Centrepiece (London: Centre for Economic Performance), summer 2011 issue, pp. 2 – 5. The quotations are from p. 3. The authors of this piece tried to retract their conclusion by saying that it depended on the inclusion of London in the sample. But why should London be excluded? They refer to another paper in 2005 by David Card in The Economic Journal. But in 2005 no data whatsoever could have been available about the medium-run effects of opening-up of the UK labour market to EU8 immigration. 4 See David Held Cosmopolitanism (London: Polity, 2010) for an example of this sort of thinking. ‘Cosmopolitanism’ is defined on p. x as elaborating ‘a concern with the equal moral status of each and every human being and creates a bedrock of interest in what it is that human beings have in common, independently of their particular familial, ethical, national and religious affiliations’. Whether Britain exists primarily for the benefit of the British – meaning people of British birth, citizenship and residence – then becomes far from clear. 5 ‘160,000 jobs “lost to migration”’, article in The Daily Express, 10th January 2012.6 Jessica Coleman ‘Employment of foreign workers, 2007 – 09’, ONS occasional paper (London and Newport: Office for National Statistics, 2010), p. 7. 7 This chapter has not discussed the employment-reducing effect of a range of employment directives and regulations. The omission is to avoid double-counting. Almost certainly EU legislation has cut employment by hundreds of thousands relative to the position that the UK would be in if it controlled employment legislation itself, but that should be seen as ‘a cost of regulation’. As the cost of regulation was covered in the second chapter, to quantify and add that cost here would be double-counting. The total employment-reducing effect of EU membership – both the lost jobs from inward migration and the lost jobs from misguided EU legislation – must run into the hundreds of thousands.

How much does the European Union cost Britain?36
The title of this chapter is not a joke. Membership of the EU is acknowledged to lead to outright waste in several important areas of public policy, while its institutions are routinely described as ‘riddled with fraud and corruption’.1 A visitor from Mars might wonder why any country – let alone 27 of them – would want to belong to a supranational structure about which such phrases could be written. But the European political elite wants the still quasi-sovereign nation states of Europe to transfer yet more ‘competences’ to this set of institutions.2 Three sections follow on waste, two covering the Common Fisheries Policy, and the other the effects of EU directives on water standards. Other forms of EU-related waste could be examined and the treatment is far from exhaustive, but space is limited.3 The following section focuses on one just one example of fraud, where the evidence is clear-cut and the cost to the UK beyond dispute. Of course it is inherent in the subject-matter that a discussion of fraud cannot have access to all the facts, as the parties at fault will try to conceal them. However, dissatisfaction with the EU’s internal accounting is widespread and of long-standing. The British government’s White Paper (Cmnd. 8232) on European Finances 2011 is sub-titled Statement on the 2011 EU Budget and measures to counter fraud and financial mismanagement. The truth is that the distribution of regional development and agricultural money in several EU member states involves fraud of an almost systematic kind.4 Finally, a few paragraphs discuss the corruption – particularly the corruption of the European political class – that has accompanied integration under EU auspices.
The costs of waste: background to the Common Fisheries Policy
The Common Fisheries Policy did not exist until the UK sought EEC membership in the early 1970s. As was explained in chapter 1 of this study, the EEC member governments knew of British eagerness at the time ‘to join the Common Market’. These governments, particu-larly the French, used their strong bargaining position to encroach on the UK’s fortunate position, in fishing terms, of being an island nation. Everyone knew that the UK’s home waters had some of the world’s most abundant fish resources. (Aneurin Bevan, a Labour Party politician best known as the founder of the National Health Service, had quipped memorably in May 1945 that, ‘This island is made mainly of coal and surrounded by fish.’) Equal access to the UK’s fishing grounds was therefore made a condition of EEC entry by the UK’s new trading ‘partners’.5 After a ten-year derogation in which the UK fishing industry continued much as before, the EEC applied the Common Fisheries Policy to the UK.
The global fishing industry suffers seriously from a much-analysed difficulty in economic organization known as ‘the tragedy of the commons’.6 A resource –
paradigmatically a piece of land in common ownership – has great value to the individual people who may use it and benefit from it. However, the resource is finite and each individual’s right of exploitation is unlimited. Each individual therefore has an incentive to take as much of the common resource as possible, but that leads to over-exploitation and degradation. If the degradation goes too far, the resource in common ownership may be destroyed. The Nobel laureate in economics, Elinor Ostrom, surveyed such situations in her 1990 book on Governing the Commons.7 Several of her examples showed that, if left to themselves, local people realized that they faced the organizational dilemmas implied by the tragedy of the commons. In their own long-run economic interests and without prompting from outside, they put in place arrangements to restrict over-exploitation.
Unfortunately, the CFP is designed and overseen by the European Commission in Brussels. The Commission is a remote supranational bureaucracy and its officials have little direct contact with everyday business reality. They have no personal economic interest in the success or failure of any of Europe’s multiplicity of small fishing communities. It ought not therefore to be a surprise that the EU’s centralized control over fishing has been a disaster, both economically and in terms of environmental impact. The CFP sets quotas for how much of each species can be caught in a certain area. Each country is given a quota based upon the total available (Total Allowable Catch, TAC) and their tra-ditional share, expressed as a percentage. TACs are fixed annually by the Council of Ministers. After quotas are fixed by the Council of Ministers, each EU member state is responsible for policing its own quota. Different countries allocate their quota among fishermen, with enforcement methods varying between them.
The costs of waste: the UK’s loss of fishing rights and discards
The problem is that actual catches may exceed the maximum catch specified in the TACs. If the fishermen land all the actual catch they are breaking the law and so are subject to fines. Understandably, their response has been to discard the excess fish. The discards have now become substantial relative to maximum catches permitted under the TACs. By far the most productive ‘fishing area’ for the EU – to which all EU member states in principle have ‘equal access’, although only as de-termined by a bureaucratic formula – is the so-called ‘Atlantic north-east’. (This means in practice the North Sea, and the areas of the Atlantic within the British, Irish, Icelandic and Norwegian 200-mile limits, plus the areas within the 200-mile limits off the Atlantic coasts of Denmark, France, Spain and Portugal.) In 2009 the EU catch in the Atlantic north-east was over 3.5 million tonnes, which was 70% of the EU’s total catch of almost 5.1 million tonnes.8 According to the Fish2fork website, an estimated 1.3 million tonnes of fish from the Atlantic north-east are discarded every year, with up to 900,000
5. The costs of waste, fraud and corruption

37How much does the European Union cost Britain?
tonnes in the North Sea alone, including many cod.9
The precise value of this 1.3 million tonnes is not easy to calculate, because the prices of the various fish species fluctuate, as does the species composition of the discard. But, as mackerel and herring are usually the principal species, we can concentrate on them. Their prices have been buoyant recently, with mackerel going for about £1,000 a tonne and herring for over £400 a tonne.10 (Cod is more valuable, at £2,000 - £3,500 a tonne.) If we take the average value as £800 a tonne (which looks about right), the annual value of the fish discarded comes out as just over £1 billion.
The estimate of over £1 billion a year of pure waste applies to the EU as a whole. If Britain had never joined the EEC, if Britain had behaved like Norway and decided to keep control of its fishing grounds, how much of this waste would be attributable to fishing in UK waters? Given that 900,000 tonnes of the discard occurs in the North Sea, of which the UK would have half (more or less) if it had not joined the EEC, and that a big chunk of the remaining discard must happen in the rich coastal waters off Scotland, discard in what might have been ‘UK waters’ must be about 600,000 tonnes. It follows that the value of the annual waste in British territorial waters, due to fish discard, is about £500 million (i.e., 600,000 tonnes multiplied by £800 a tonne). This loss can be blamed on the CFP and the UK’s membership of the EU, since means would surely have been found of preventing it if the UK were again in
control of its own fishing grounds. The squandering of nature’s bounty has been going on for many years. The capital value of the waste is enormous, and probably lies between £5 billion and £10 billion, depending on the assumptions made.11
Note that this is not a measure of the full cost of the CFP to the UK. The undoubted result of joining the EEC/UK was that the UK lost control of its territorial waters. Fishing boats from other European nations have been allowed to fish in waters that would otherwise have been open exclusively to the British fleet. Roughly speaking, what might have been ‘UK territorial waters’ account – in terms of potential catch – for about half of the EU’s pelagic fishing resource.12 But the quota system has been applied to limit the UK share of EU output to about 12% of the total.13 An estimate of the resulting loss to the UK depends to some extent on how fishing rights would have been allocated in the UK if we had retained full control of the territorial waters. (UK-born people might have quit fishing for more salubrious occupations, even if we had not joined the EEC/EU. Who knows?)
However, a reasonable surmise is that the UK industry might be double its present size if we had stayed out-side the EU. If the resources (the capital cost of the fleet, the cost of the fishermen’s labour and so on) involved in the activity would be a third less pro- ductive in the nearest alternative use, the cost of the CFP to the UK might be over £300 million a year at
4.6%. Others Finland. 3.1%
Latvia. 3.2%
Lithuania. 3.4%
Portugal. 3.9%
Sweden. 4.0%
Poland. 4.4%
Germany. 4.9%
Italy. 5.0%
Ireland. 5.3%
Netherlands. 7.5%. 8.7%. France
11.6%. UK
15.0%. Spain
15.3%. Denmark
Fishing catches in the EUChart shows % shares of total EU catch in 2009

How much does the European Union cost Britain?38
present fish prices.14 This cost is due to the CFP as such. It arises because the CFP has caused the UK’s fishing fleet and catch to be smaller than it would be if the UK had stayed, like Norway, fully independent and outside the EEC/EU. Again, the capital cost of this loss must run into the billions. (The chart on page 37 shows the % shares of EU member states in the total EU pelagic catch. The UK has the best fishing grounds of any country, but its share is under 12%. The combined share of Poland, Latvia and Lithuania – which became EU members only in 2004 – is similar to the UK’s. A tough line in EU bargaining could easily have stopped this outcome. The UK government has been craven and incompetent in CFP negotiations for over 40 years, and overall its behaviour towards the fishing industry has to be described as shameful.)
Whatever the sensitivities of the British and the citizens of other EU member states about these matters, one point cannot be controversial. The discarding of dead fish on an industrial scale is outrageous. (And, for once, the phrase ‘on an industrial scale’ is not hyperbole.) It is a shocking indictment of the European Commission that such immense waste can be directly attributed to one of its areas of policy responsibility. Under the terms of the Lisbon Treaty the EU has an exclusive competence for conservation of fishing, whereas the management of fisheries is a competence shared with the member states. Jeremy Paxman of the BBC’s Newsnight programme has commented, ‘if discards are conservation, I’m a Mad Hatter’. A number of the UK’s ‘celebrity chefs’ have protested vigorously about the iniquities of the CFP, with Hugh Fearnley-Whitting-stall organizing a FishFight website and a television programme of the same name. In June 2012 the Council of Ministers reacted to this pressure by agreeing
that discards must stop. However, it remains unclear exactly what will now happen, since discards arose from the setting of quotas. If the quotas remain and the landing of too many fish is illegal, it is difficult to see how fishermen can do anything with a surplus catch other than to throw it overboard.
The costs of waste: EU directives and the water industry
In early 2012 the UK was in a strange position. It is a nation blessed by abundant rainfall with a long history of high-quality and low-cost tap water for the great majority of households, while over the previous decade investment in water supply had been higher than in any previous 10-year period. But large parts of the UK were forecast to be subject to a hose-pipe ban in the summer months.15 The ban was expected, because reservoirs and other water catchment facilities were thought liable to run dry, and water had to be conserved. How had this come to pass?
Central to any answer must be the effect of EU en- vironmental directives on the UK water industry. Superficially, the purpose of these directives has been benign. As they have mandated that the whole of the EU must move to higher levels of air and water quality, they can be portrayed as attempts to make the world a better place. However, the benefits of higher air and water quality, and of better environmental standards more generally, can be bought only at a cost. Ideally, a balance should be maintained between cost and benefit, and policy should respect the recognised principles of social cost/benefit accountancy.16 Many well-informed observers feel that the benefits of
Table 5.1: List of EU directives relevant to the UK water industry
1976 Bathing Water Directive
1985 Environmental Impact Assessment Directive
1991 Nitrate Directive
1991 Urban Waste Treatment Directive
2000 Water Framework Directive
2001 Strategic Environmental Directive
2006/7 Revised Bathing Water Directive
2008 Integrated Pollution and Prevention Control Directive
2008 Environmental Quality Standards Directive
2010 Industrial Emissions Directive

39How much does the European Union cost Britain?
environmental improvement have been bought at too high a price. The history of the European Commission’s endeavours to enhance the EEC/EU’s environment goes back to the mid-1970s, with the 1976 Bathing Waters Directive. As Table 5.1 shows, several directives have subsequently been passed. Indeed, the 2000 Water Framework Directive has often been seen as a new departure in the rigour of the EU’s environmental prescriptions. One discussion of the resulting policy issues referred to the 2000 Water Framework Directive and ‘its daughter directives’.17
The UK government has been more active than that of most other member states in seeking a proper reckon-ing of the costs and benefits of these exercises. In 1999 the Department of the Environment, Transport and the Regions considered the potential costs to the UK of the imminent Water Framework Directive, and arrived at a figure of between £3.2 billion and £11.2 billion at current prices (i.e., the prices of 1999) over the period to 2040, assuming full implementation by 2010.18 Since then prices have risen by about a third, while – as Table 5.1 brings home – additional directives have come into effect. Precise quantification needs another in-depth study, but we are evidently talking – in terms of 2012 prices – of a cost that lies somewhere between £5 billion and £20 billion, perhaps more. Of course this cost is incurred over a period of a few decades. All the same, the bulk of the cost lies in the early years of implement-ing the directives, which results in the greatest pressure on the nation’s resources at that stage. It is not silly to be thinking in terms of extra costs of at least £500 million a year for the UK to meet the assortment of EU environmental impositions.
A major counter-argument is that this expenditure has important benefits, in terms of cleaner and less polluted water, the return of fish to rivers, the hygienic advantages of swimming off beaches unaffected by sewage, and so on. However, the UK’s water industry had been investing in the various forms of environmen-tal improvement for decades before the EU directives came into force and indeed before the UK joined the EEC. Even the Commission has accepted that the UK is ‘fairly advanced in the field of water monitoring and administrative systems compared to many member states’. 19 Any worthwhile assessment must weigh the extent of improvement against the costs involved. In a 2007 official answer in the House of Lords to a ques-tion from Lord Pearson of Rannoch, a UK government minister said that over the previous decade compliance with the Water Framework Directive and ‘its daughter directives’ had necessitated investment of £65 billion. By contrast, only £14 billion of investment had been available for the water industry’s infrastructure.20
On the face of it, the UK water industry has been characterized by over-investment, even extreme over-investment, in attempts to ameliorate water quality, and under-investment in infrastructure to maintain and expand supply to its customers. The misguided invest-ment pattern can be attributed, almost entirely, to the
UK’s obligation to comply with EU directives. The under-investment in infrastructure in turn explains the para-dox faced in early 2012. In the previous 15 years over £100 billion had been invested by the water industry. But the industry’s storage capacity had not changed, as too much of the investment had been to meet EU water purification targets. That was how, in an island notorious for its rainy weather, millions of households were forecast to be subject to a hose-pipe ban. In a recent analysis Sir Ian Byatt, the director general for water services at Ofwat (the UK water regulator) in the 1990s, was blunt. ‘We should switch the emphasis from the volume of investment to its quality, to better returns from assets, to better management of networks, to the trading of water and abstraction rights and to the regu-latory monitoring of outcomes rather than of projects.’ 21 The first line of his executive summary read, ‘The drive to attain ever-increasing water and environmental qual-ity at ever-increasing cost must come to an end’.
So we have here another area of public policy where costly mistakes have been made over an extended period because of the UK’s membership of the EU. The drive to purify UK water has been taken to extremes. It has had an unnecessarily high cost and, in that sense, it has involved a great deal of waste. The discussion here makes no pretence at being definitive, but the level of waste per year must run into the hundreds of millions, perhaps into the billions, and the capitalized value of the waste must be £5 billion or more. (A smaller figure would make little sense, given the investment totals involved and the virtual unanimity of informed commentary on the misdirection of investment.)
Costs of fraud
This and the next section are concerned with ‘fraud’ and ‘corruption’ in the EU, and the effect of this fraud and corruption on the cost of EU membership to the UK. But the distinction between fraud and corruption is a little blurred, while the whole subject is vast. A few years ago Carolyn Warner, an American academic with a Harvard doctorate and now professor of political science at Arizona State University, published a scholarly yet still devastating book on what might be termed the EU’s ‘corporate governance’.22 The book was called The Best System Money Can Buy, but the implicit sarcasm was made clear with the sub-title Corruption in the European Union. The titles of the chapters included ‘Corruption dynamics in the European Union’, ‘“Corrup- tion is our friend”: exporting graft in infrastructure, arms and oil’, ‘The corruption of campaign and party financing’ and ‘The pathologies of an international organization’. Obviously, something is wrong.
Numerous allegations have been made of large-scale and endemic fraud in EU institutions. In early 1999 the allegations reached such a crescendo that the Commis-sion, headed by Jacques Santer of Luxembourg, was obliged to appoint a Committee of Independent Ex-perts on its own workings. Its report was produced on 15th March, and presented to the Commission and

How much does the European Union cost Britain?40
Parliament. Nearly all members of the Commission were cleared, more or less, of doing anything improper. But Edith Cresson – Commissioner for Research, Science and Technology and a former French prime minister – was not. The verdict was that she ‘failed to act in response to known, serious and continuing irregularities over several years’ and, in particular, she was guilty of not reporting failures in a youth training programme from which vast sums went missing. The independent experts concluded, more generally, that inside the Commission, ‘It was becoming increasingly difficult to find anyone who had the slightest sense of responsibility’.23 Given the damning tone of the report, the entire Commission felt obliged to resign.
The Santer Commission episode might have been ex-pected to be followed by an improvement in record-keeping, and the clarification of reporting lines, re-sponsibilities and so on, but this appears not to have been the case. As the ultimate paymaster of European integration, the German taxpayer has to be concerned. According to a 2007 report in Der Speigel, fraud committed in Brussels was running at one million euros per day. At that time 400 investigative procedures against EU officials were pending. The Commission claimed that corruption was no more widespread in Brussels than anywhere else, but the budget expert for the German CDU in the European Parliament, Inge Grassle, described this view as ‘laughable’. The figure of one million euros a day of loss through fraud may sound bad enough, but the true figure – both then and now – is probably much higher.24
So the EU is ‘riddled with fraud’, as the standard cliché claims. How does that affect the cost of EU membership to the UK, which is the central interest of this study? A simple and straightforward calculation will not emerge, because by its intrinsic nature fraud is opaque or con-
cealed. The Cmnd. 8232 White Paper on European Union Finances 2011 did contain a table on the EU’s financial ‘irregularities’ and their ‘estimated impacts’ in terms of millions of euros at stake, the main points of which are reproduced in Table 5.2. For the record, in 2009 there were almost 8,000 cases of irregularity in the spending of EU money and almost €1,500 million was in jeopardy. But, as noted above, because the UK’s direct fiscal costs come to much the same thing as our payments to finance the EU Budget, the UK share of this €1,500 mil-lion (which might be over €200 million) should not be interpreted as the additional cost of EU fraud to us. (Remember that direct fiscal costs were covered in chapter 1. To add €200 million for the cost of fraud would be double-counting. We have paid the money and that is that. Citizens in the recipient countries ought to be dis-mayed that the money they receive from the EU is be-ing grotesquely misdirected, but it is not our problem.) Nevertheless, a striking recent example of semi-fraud, actual or potential, deserves mention. As it happens, the sums involved are not part of the UK’s direct fiscal costs and adding them to the overall cost of EU mem-bership does not risk double-counting.
In the 1960s the UK embarked on a massive programme of university expansion, following the Robbins Report of 1963. One objective was to increase the skill levels of the British workforce, since recent academic research had found strong returns on investment in higher education. Plainly, the post-Robbins expansion was intended to benefit the British specifically and to improve the UK’s international economic competitiveness. By common consent the UK’s universities have long con-stituted, and still do so today, the best higher education system in Europe.
However, because of the UK’s membership of the EU and the resulting pressures for the equalization
Table 5.2: Number of EU irregularities and estimated financial impacts
2008 2009
No. of Amounts No. of Amounts cases (€ millions) cases (€ millions) Agricultural (EAGF and EAFRD) * 1,133 102 1,621 125 Structural Funds and Cohesion Funds 4,007 585 4,931 1,223 Direct expenditure 932 35 705 27.5 Pre-accession funds 523 61 706 117 Total expenditure 6,595 783 7,963 1,492.50
Source: The EU Commission’s 2009 Fight against Fraud report, as reproduced in Cmnd. 8232 and published by the Stationery Office in 2011. * EAGF stands for ‘European Agricultural Guarantee Fund’ and EAFRD for ‘European Agricultural Fund for Rural Development’ Note: Cmnd. 8232 cautions that ‘a reported irregularity is in most cases not a fraud (a deliberate act)’.

41How much does the European Union cost Britain?
of access to every member states’ institutions, British universities have increasingly to invite entry on the same basis to students from all over the EU. British universities are not meant to discriminate in favour of British students. Further, since 2006 students from around the EU have been eligible for low-cost loans, to cover tuition fees, from the British state. But will the UK get the money back? UK-based graduates have loan repayments automatically deducted from income under the PAYE arrangements. But no such method can be applied to graduates from British universities who return to, say, Portugal or Slovenia. According to a story in The Daily Mail for 10th August 2012, ‘42% of EU students [who had graduated from UK universities]…are liable for repayments, but are failing to keep up’.
In effect, by reneging on their debts, students from the rest of the EU obtain a free education at the expense of the British taxpayer. The Robbins expansion of our universities is therefore benefiting foreigners, not us. As the former Conservative Cabinet minister, Peter Lilley MP, observed, ‘we will need to do something to stop subsidizing the EU by providing their brightest and best with free education’.25 The eventual loss to the UK is difficult to conjecture. EU students’ outstanding debt to the UK’s Student Loans Company was just over £111 million in 2010/11. The amount eventually writ-ten off may be in the tens of millions if proper controls are soon introduced or in the low hundreds of millions if nothing is done for several years. We have here an obvious case of pure loss to the UK taxpayer because of fraud arising from our EU membership.
Costs of corruption
The British have traditionally made a great song and dance about their history, and the specialness of their institutions (the home of parliamentary democracy, the rule of law, the separation of the executive from the judiciary, the bicameral parliament in which one house is for revising legislation, and so on). Unfortunately, to the extent that we still make a great song and dance about the marvel of our constitutional arrangements, we are becoming ridiculous. The fact is that many of our key traditional constitutional arrangements are null and void; the reality is that, as in other EU member states, the dominant source of new legislation is not the democratically-elected House of Commons, but an alien bureaucracy in a foreign land. Elected politicians from our own country have often to kowtow to unelected functionaries from several foreign coun-tries, where these functionaries act with the authority of the EU and its institutions.
The enormity of the betrayal must raise questions about the motivations of the politicians involved, as well of course of their civil service advisers and associates. No one is claiming that heads of state, senior ministers and top officials have received direct bribes from EU institutions to persuade them that they should surrender powers to the EU. Nevertheless, corruption has been at work. In politics a distinction can be drawn
between ‘hard’ and ‘soft corruption’, just as in diplomacy there is one between ‘hard’ and ‘soft power’. Hard corruption is the payment of specific sums for an identifiable improper action, usually in its immediate aftermath. Soft corruption is the hinting that unspeci-fied favours will be granted, perhaps at a distant date in the future, for an action just far enough from the bor-der-line of political propriety. Whereas hard corruption deals in money, soft corruption deals in jobs and honours.
The EU abounds in soft corruption. Bluntly, there is no doubt that the British political class has been turned by the jobs and honours on offer. The Labour Party’s manifesto in the 1983 general election included withdrawal from the EEC. Neil Kinnock, an MP since 1970, was prepared to fight the 1983 election on that manifesto. However, after becoming leader in October 1983, Labour’s opposition to European unification was diluted and eventually abandoned. After losing the 1992 general election Kinnock became a European Commis-sioner and stayed in Brussels for nine years. His wife, Glenys, was a Member of the European Parliament from 1994 to 2009. In 2009 she was made a life peer and for a few months she served as Minister of State for Europe. On 14th June 2010 The Daily Mail carried a story on how Neil and Glenys Kinnock had ‘received more than £10m. in pay, allowances and pension entitlements during their time working at the European Union in Brussels’. According to the story, ‘the couple’s lavish lifestyle’ was ‘funded from the public purse’.26
The growth of soft corruption is related to the rise of the so-called ‘career politician’. A career politician might be defined as someone who wishes to be engaged on a full-time basis in political advocacy from which he or she intends to make a living. The intention to make a living from politics does not rule out the possibility that the individual concerned may, at some stage, have entertained strong political beliefs of a selfless and idealistic kind. But the winnings from a political career tend to go towards people who approve of and par-ticipate in the current drift of public policy. Whatever someone’s original views, the case for joining the latest bandwagon is also the case to pay school fees and afford a large mortgage. As the EU has grown, it has proliferated jobs of all sorts. All too often the band-wagon for European integration has been financially rewarding for those who have joined it.
Indeed, people who have already jumped aboard the EU bandwagon do their best to make others jump aboard too. The 1992 Maastricht Treaty contained provisions for the deliberate encouragement of so-called ‘politi-cal parties at European level’, meaning structures that would include individuals from a number of member states and band them together to support the cause of greater European integration. The 1997 Amsterdam Treaty and the 2001 Nice Treaty went further, introduc-ing mechanisms whereby these ‘pan-European political parties’ (PEPPs) could be subsidized via the European Parliament. Those MEPs that decided to join a PEPP
How much does the European Union cost Britain?42
would receive increased expenses, while their party could set up a think-tank with state funding on the German model.27 A number of PEPPs now exist under the European Parliament’s umbrella, with all three of the UK’s so-called ‘main political parties’ belonging to one.28 (A PEPP is a brass-plate political entity, the only substantive function of which is to channel European Parliament money to MEPs. They have no meaningful identity in the political life of any EU member state. Ironically, modern Europe has a large number of sepa-ratist or autonomy-seeking parties in its member states – such as the Lega Nord, the Scottish National Party and the Convergencia Democratica de Catalunya – that are extremely meaningful in their national political debates.)
In 2008 the funding for pan-European political parties was €10.6 million. The last few years have been excep-tionally difficult ones for most European economies, with many national governments having to slash ex-penditure by over 5% and in some cases by more than 10%. However, PEPPs are part of the EU bandwagon and, within Europhile circles, the budget for PEPPs is seen as a priority in the larger cause of ‘European construction’. (Let me reiterate that we in Britain must not be ‘holier than thou’ about this matter. The UK MEPs representing the Conservative, Labour and Liberal Democrat parties have all taken the money associated with a PEPP affiliation.) So by 2011 the funding for pan-European political parties had increased to €28.8 million! In three years the cost had jumped by over 150%. Europe’s economies had undergone the worst economic down-turn since the 1930s, a veritable ‘Great Recession’, but expenditure for the purpose of greater interaction between EU politicos, for freebies, jaunts, jollies and the like, had carried on booming.
In short, the emergence of a European political elite in the last 50 years has been accompanied by seri-ous corruption. The growth of corruption validates the insights of the Virginia School of Political Economy, or ‘the economics of politics’, first developed by James Buchanan and Gordon Tullock in the 1960s and 1970s. Buchanan and Tullock’s central point was that the tools of economic analysis could be applied to topics such as politics, bureaucracy, law, constitutions and so on, as well as to economists’ more familiar concerns like the determination of the prices and quantities of goods and services. In other words, political decision-taking can be studied as if politicians resemble the average mortal, and are often greedy and selfish.
Before Buchanan and Tullock’s work an implicit as-sumption of most policy debates was that government existed to serve the public interest. With the govern-ment focused on the public interest, the purpose of political action was taken to be Benthamite, to achieve the greatest good of the greatest number. This chapter has shown that within the EU many decisions are taken with a view to the aggrandizement – including the financial aggrandizement – of political cliques. Politics is about the greatest good of oneself and one’s chums. The
idea of pan-European political parties is an egregious example. It was conceived by the supranational EU bureaucracy so that politicians would align themselves with like-minded Europeans in other countries and hence approve further integration. The bandwagon had to be kept rolling, regardless of the costs and waste involved.
The best system money can buy?
Dysfunctional structures of government have encour-aged cynicism and selfishness in the European political elite, and the result has been widespread and large-scale waste, fraud and corruption. As Carolyn Warner remarked in the penultimate chapter of her 2007 book on contemporary Europe,
…the institutions of the EU have a limited role in reducing corruption in member states. Compounding the EU’s feeble influence within the states are the new opportunities for creative funding and outright graft that the EU provides…. [T]he EU is a thick tangle of negotiated rules and regulations, most of which govern economic transactions. In an elaborate process, states and others promulgate these European Union rules and regulations, which they then leave to the states and their national and subnational government agencies to implement and enforce. State interests may lie in deliberately tolerating fraud in certain economic sectors, and behaviours that were thought to be culture or state specific may be universalized through the new institutional context. 29
How much does all the misgovernment cost the UK? It needs to be remembered that chapter 1 dealt with the direct fiscal costs of UK membership and chapter 3 with the costs of regulation. Although many of the developments discussed in the current chapter are deplorable, we must avoid double-counting. The water industry is an interesting borderline case. The loss from over-investment in water purification could be viewed as a cost of regulation or as an example of waste, and there is nothing sacrosanct about the treatment adopt-ed here. At any rate, the fish discard is clearly waste, indeed – as we have said – waste on an industrial scale. That justified including the Common Fisheries Policy in the present chapter. Although the fishing industry is small, the CFP undoubtedly makes the UK several hundreds of millions of pounds a year worse-off than it would have been if, like Norway, it had stayed out of the EU and kept control of its territorial waters.
Britain could also lose out from its apparent subsidiza-tion of foreign EU students at its universities, and the corruption that marks the extravagant expansion of the EU’s bureaucracy and associated political hanging-on. Although the costs of the EU to the UK from waste, fraud and corruption are small relative to its GDP, they are costs. Precise quantification is elusive, but another ¼% of GDP looks more valid than saying that there are no costs at all.30

43How much does the European Union cost Britain?
1 See the alarming accounts in Marta Andreasen Brussels Laid Bare (Yelverton, Devon: St. Edward’s Press, 2009) and David Craig and Matthew Elliott The Great European Rip-off (London: Random House, 2009). The EU’s Budget is subject to a quality test (‘a declaration of assurance’) by the European Court of Auditors. The EU’s annual accounts have not been certified in this sense by the external auditor since 1994. In its annual report on the implementation of the 2009 EU Budget, the Court of Auditors found that the two biggest areas of the EU budget, agriculture and regional spending, had not been signed off on and remained ‘materially affected by error.’ 2 On 7th June 2012 Angela Merkel, the German chancellor, said on the ARD German television channel ahead of the next summit of EU leaders on 28th June, ‘We need political union first and foremost. Step by step we must from now on give up more competences to Europe, and allow Europe more powers of control…I don’t believe that there will be one single summit that will decide on a big bang. But what we have been doing for some time, and on which a working plan will certainly be presented in June, is to say we need more Europe’. Merkel was undoubtedly ‘in the driving seat’ at the summit itself. 3 The British government has on more than one occasion asked for the full repatriation of spending of regional development money, saying that it would save a few hundred millions of pounds of administrative costs. 4 But note that this is not an extra cost to the UK, over and above that already discussed. The money is already included in the direct fiscal cost to us, which was discussed in the first chapter.5 The story of the UK’s virtual abandonment to other European nations of its control of a major national resource is told on pp. 152 – 55 of Christopher Booker and Richard North The Great Deception: a Secret History of the European Union (London: Continuum, 2003). Norway was also an applicant for EU entry at the time, but – when the fisheries minister realized the implications of the equal access provision for Norway’s industry – he resigned in protest. When the Norwegian people were asked in a referendum in late 1972 for their view on EEC membership, they voted against by 52.7% to 47.3%. 6 The seminal article is Garrett Hardin ‘The tragedy of the commons’, Science, vol. 162, 13th December 1968, pp. 1243 – 8. For a discussion of the larger issues raised by this problem in social organization, the fifth chapter of Roger Scruton’s recent book on Green Philosophy is excellent. (Roger Scruton Green Philosophy [London: Atlantic Books, 2012], pp. 137 – 82. 7 Elinor Ostrom Managing the Commons: the Evolution of Institutions for Common Action (Cambridge: Cambridge University Press, 1990). 8 Facts and Figures on the Common Fisheries Policy (Brussels: European Commission, 2012 edition), p. 20. 9 ‘Campaigners hail deal to ban discards across Europe’, Fish2fork website (www.fish2fork.com), 13th June, 2012. The estimate of 1.3 million tonnes seems originally to have made by the United Nations Food and Agricultural Organization, but I have not been able to verify the exact source. 10 ‘Scottish fishermen landed catches worth more than £500 million last year – a 10-year high – according to provisional figures posted by the Scottish Government. The figures show a 15 per cent increase in the value of landings valued at £435 million in 2010. Price per tonne landed for herring rose from £280 in 2010 to £450 last year, and mackerel from £839 a tonne to £1,118.’ Business section of Scottish Daily Record website (www.business7.co.uk), ‘Value of Scottish fishing landings at 10-year high’, by Scott McCulloch, 17th April 2012. 11 The net present value of £500 billion over 20 years discounted at 7% is £5.3 billion or discounted at 3% £7.4 billion. As far as I am aware, this is the first comprehensive estimate of the cost of fish discards to the UK, although the subject has received extensive media coverage in other respects. Let me emphasize that, as noted in the text, much depends on fish prices and species composition. 12 Fishing is split between offshore, or ‘pelagic’, fishing and aquaculture. The CFP applies almost entirely to pelagic fishing. It should be noticed that aquaculture – mostly fish farming in inshore or inland waters – is also a huge industry, with UK output of over £500 million. The UK has the EU’s second largest aquatic production. For the most part the industry is outside the ambit of the CFP. 13 Facts and Figures of the CFP, p. 21. 14 Roughly speaking, the value of the UK’s pelagic fish catch is about £1 billion a year, with much depending on prices, species composition and so on. If it were twice the size, obviously output would be higher by another £1 billion, but that would mean less production of other goods and services. Assuming that the same resources were one third less productive in other branches of production, the loss to the UK because of the CFP – in terms of a smaller fishing fleet and catch than would be outside the EU – comes to £330 million a year. This estimate is rough and ready, but gives a sense of magnitudes. Another difficulty is to allow for the possible reduction in the size of the UK’s fish processing sector because we have a lower catch by our own fleet. But, since the UK fish processing sector can buy from other EU fisheries, it is not clear to me that any allowance should be made for this point. 15 In the event the reputation of the water industry was rescued by the British weather! The spring of 2012 was one of the wettest on record.16 Ian Little and James Mirrlees Manual of Industrial Project Analysis for Developing Countries (Paris: OECD, 1969) is the key reference here. 17 Deloitte Consulting Support to Fitness Check Water Quality (Project for European Commission – General Directorate Environment), 14th June 2011. 18 Water Quality Division, Department of the Environment, Transport and the Regions Regulatory Impact Assessment of the Water Framework Directive (DETR: London, 1999). 19 Giorgos Kallis and David Butler ‘The EU water framework directive: measures and implications’, Water Policy (London: World Water Council), no. 3, 2001, pp. 125 - 42 20 Christopher Booker ‘£65 billion of water budget poured down the drain’, The Sunday Telegraph, 29th July 2007. In the 20 years to 1997 the investment required to conform to EU directives is said to have totalled £48 billion.21 Ian Byatt Water: Supply, Price, Scarcity and Regulation (London: Institute of Economic Affairs, August 2012), Current Controversies Paper no. 37, p. 6. The saga has been followed by Christopher Booker in his Sunday Telegraph column. In December 2011 the Department of the Environment, Food and Rural Affairs produced a White Paper on Water for Life,
How much does the European Union cost Britain?44
ostensibly to help in the public discussion of water management. As Booker acidly commented, ‘not once…is there any mention of a need to build new reservoirs’. (Christopher Booker ‘Keeping us short of water is now government – and EU – policy’, The Sunday Telegraph 13th May 2012.) UK officialdom apparently believes that global warming may affect UK rainfall and hence that attempts to combat global warming are vital to prevent what it terms ‘water stress’. A quick check on the UK’s Met Office website at the time of writing (summer 2012) found the following statement. ‘The UK annual average rainfall has increased by a relatively small amount - around 2% –0 when comparing 1981–2010 with 1971–2000. This is a similar increase to that from 1961–1990 to 1971–2000.’ There is no evidence whatsoever that such ‘global warming’ as has occurred in the last 30 or 40 years has reduced the UK’s rainfall. 22 Carolyn M. Warner The Best System Money Can Buy (Ithaca and London: Cornell University Press, 2007). 23 The source is Nils Ringer ‘The Santer Commission resignation crisis’, University of Pittsburgh research papers (February 2003), cited in the Wikipedia entry on the Santer Commission.24 The material in this paragraph has appeared in several Eurosceptic blogs and it is not clear to me which is the original source. An article in Der Spiegel of 28th July 2007 may be the beginning of the story. 25 Laura Clark ‘Half of EU students failing to repay loans’ The Daily Mail, 10th August 2012. 26 Simon McGee ‘Revealed: How the Kinnocks have enjoyed an astonishing £10m. ride on the EU gravy train’. 27 The state funding of think tanks is an established feature of the German political system. 28 In 2011 the UK Independence Party had an active internal debate on whether its MEP group should join a PEPP. The party membership voted by a majority of two to one against UKIP’s MEPs becoming affiliated to a PEPP.29 Warner Best System, p. 159.30 The number may be ad hoc, but that is better than nothing. The treatment in this chapter has been far from exhaustive. For example, the EU’s emission trading scheme turns out – to use that so-often-repeated phrase again – to ‘have been riddled with fraud’. To quote from a story in The Guardian (23rd January, 2011), ‘Hopes that a key tool in the fight against climate change can be brought back into full operation on Wednesday were fading as national governments struggled to beef up security after a huge carbon fraud was uncovered in Europe’s pioneering emissions trading scheme (ETS). The European Commission stepped in to ban “spot” trading in carbon on any local exchanges last Wednesday after a £28m cyber-attack on the Czech, Austrian and other national markets and was hoping to lift the restriction this week, but there are growing fears that new security will not be in place on time in all locations. Market experts are now calling for victims of carbon trading fraud to be compensated by the European Union to prevent the latest in a series of scandals turning traders off the ETS, which was meant to provide a blueprint for national carbon reduction schemes to be introduced in America and further afield.’ Similarly, nothing has been said about the effect of the Working Time Directive on the hours worked by junior doctors and the waste attributable to their longer training period. Numerous other examples of EU-related misgovernment and consequent waste, often a by-product of fraud, could be cited.
45How much does the European Union cost Britain?
The institutions of the single-currency area, the Euro-zone, are to a degree distinct from the institutions of the EU more broadly understood. In particular, because the UK has not adopted the euro as its currency, its relationship with such entities as the European Central Bank and the European Stability Mechanism is one of semi-detachment. Nevertheless, the UK does have some potential exposure to financial failures in EU institutions and its government must be alert to the possible ramifications of the Eurozone’s breakdown. Even larger worries relate to the EU’s attempts to encroach on the UK’s social security and pension structures. Although the area is a legal and conceptual minefield, the possible costs to the UK from various ‘contingent liabilities’ could be enormous and must be included in this study.
Alphabet soup: ECB, ESM and EIB
Many silly decisions have been taken over the last 40 years by successive British governments in order to maintain our position as an EEC/EU member state. A happy exception is that the UK decided not to replace the pound by the euro as its national currency, even though in the initial phase of discussions most people in Britain thought that its adoption of the euro was inevitable, sooner or later. Because it has retained its own currency, the UK would not be involved in the potentially heavy costs of recapitalizing the ECB if, for example, the ECB’s loans to Irish and Greek banks were not repaid in full. Further, it has no involvement in the proposed European Stability Mechanism.
The capital of the ECB is determined by contributions from the central banks of EU member states. The Bank of England does make a capital contribution to the European Central Bank, but it is very limited and must be interpreted with care. In reading the relevant documents, a vital distinction between ‘subscribed’ and ‘paid-up’ capital must be understood. The ECB’s ‘subscribed’ capital is a notional amount, dating back to the Maastricht Treaty of 1992, which is the full amount that would be paid up by a country’s central bank if that country adopted the euro. In the Bank of England’s case this would be 14.5% of the ECB’s paid-up capital, corresponding to the UK’s weight in EU gross domestic product. At the end of 2011 that would have been no less than €1,319 million (i.e., a bit more than £1 billion).1
But the UK has not adopted the euro. The Bank of England – like the central banks of other non-euro EU member states (of which there are currently nine, including the Swedish central bank, the Sveriges Riksbank) – does participate actively in European monetary and banking affairs. Conferences are held on the latest macroeco-nomic research, meetings are organized to discuss the latest inter-bank settlement technology, and so on. The Bank of England is therefore expected, with the other nine, to chip in a few tens of millions to reflect the costs associated with the various activities. But that is all. At the end of 2011 the Bank of England had paid-up
capital with the ECB of only €58.6 million. Further, it is clear that the net profits and losses of the ECB are to be allocated ‘among the euro area [national central banks]’.2 The Bank of England is not a national central bank in the euro area. It is therefore not exposed to ECB losses, if and when there are any.3
As far as the UK is concerned, the situation with the proposed European Stability Mechanism would be even simpler, as and when it has been established. (The ESM is an evolution of the European Financial Stability Fund, which already exists, but there is no space to go into details here. An important although very hypothetical argument – which is discussed in a footnote – can be made that the UK has a large contingent liability if the ESM proposal does not go ahead.4) The ESM, which creates a fund to lend to Eurozone members in financial difficulty, has not yet been created and the relevant treaty still needs ratification from several member states’ legislatures. Its paid-in capital is planned to be €80 billion, supporting total assets (i.e., loans to Greece, Ireland and so on) of €700 billion. But the UK is not a member of the Eurozone and its government has declined participation in the ESM. So the UK has no exposure to the ESM’s possible losses. What happens if the ESM goes bust and seeks help from the EU as such? The treaty founding the ESM does in fact state clearly, in Clause 5, Article 9, ‘The liability of each ESM member shall be limited, in all circumstances, to its portion of the authorised capital stock at its issue price.’ If ESM members’ liability is limited in this way, it is difficult to see how non-members could be asked to cover a deficiency. (The UK’s banks would suffer significant although manageable losses, over and above those already recognised, on their Eurozone assets if the single currency area broke up. But so would American, Swiss and Japanese banks, and the USA, Switzerland and Japan are not EU members. The losses – if and when they eventuate – should be attributed to banks’ asset selection decisions and the global financial crisis, not to the UK’s membership of the EU.)
In a recent pamphlet Bob Lyddon, a banker with exten-sive experience of European payments arrangements, has argued that the UK has a large contingent liability to the European Investment Bank. The EIB has been in the headlines much less than the ECB and the ESM in the last few years of crisis, but is an older institution with a considerable quantity of risky assets. Like the World Bank, it is a supranational financial institution well-known to global capital markets and heavily depending on its AAA credit rating for its ability to fund these assets. As a full member of the EU, the UK government is a shareholder in the EIB. According to Lyddon in The UK’s risks and exposure to the European Investment Bank and other European financial mechanisms (published by the Bruges Group in April 2012), the EIB has loans of €332 billion, with almost 30% of these to organizations in countries rated BBB+ or worse. Given the apparent weakness of its loan portfolio, the preser-vation of its AAA-rating relies on its ability to recapitalize in the event of large losses. Its ability to recapitalize
6. The potential costs from contingent liabilities
How much does the European Union cost Britain?46
depends, in turn, on the attitude of the EU governments that are its shareholders. For this purpose the British government matters considerably, since it is one of only two EU states that still have a AAA sovereign rating. (The other is Germany.) Lyddon believes that, although the UK’s paid-in capital is currently only €1.9 billion, it could be presented with a bill for €35.7 billion at any time to meet a demand for the full subscription of its capital share.5
The validity of these concerns is to some extent a matter of conjecture. Whatever the true position, it is impor-tant for the UK to limit its contingent liabilities to EU institutions, particularly now that EU membership now has the support of only a minority of the British public. Disentanglement from loss-making EU-related suprana-tional banks and financial institutions could be tiresome and protracted.
Pensions, social security and fines
People’s freedom of movement in a fully-integrated European state – a Europe without borders – has always been an attractive aspect of the vision of ‘ever closer union’. Unfortunately, certain practicalities come in the way. In their respective nation states citizens have entitlement to social security benefits and state pensions, often – as in the UK’s case – because of many years of contributions to a fund of some sort.6 Suppose the citizens of other EU countries come to live and ostensibly to work in the UK. Suppose also that, for whatever reason, they suffer misfortune, lose their jobs and need social security benefits to survive. Should they receive such benefits or not? In many cases they may not have contributed to the UK’s national insurance system or indeed paid any meaningful tax in the UK whatsoever. But, as fellow citizens of EU member states, a case could be argued that they deserve benefits just as much as long-term British citizens and residents. As several newspapers have commented, if anyone from the EU can claim benefits in any member state, people are likely to migrate to wherever benefits are highest. People in the poorer EU states may indulge in a form of ‘benefits tourism’.
Perhaps surprisingly, the European Commission is tak-ing an active line on this question. The British govern-ment is opposed to making the UK’s social security net available to immigrants from the rest of the EU, and it has the support of many other EU governments. But the Commission is taking our government, and the other governments, to the European Court of Justice on the grounds of breaking freedom of movement legislation. The dispute is therefore between EU-based legislation and national social security rules. The precedents are not encouraging for the UK’s stance, since the ECJ has a track-record of favouring the cause of EU integration. As reported in The Daily Express on 12th July 2012, Chris Grayling, the UK employment minister has become anxious that, in his words, ‘The EU institutions seem to be taking us to a position where the members states are obliged to open their benefit systems to people
coming from other countries – and that is not what any government wants at a time when budgets are tight. The European Court of Justice is consistently finding in favour of Europe over the right of the nation state. We’ve got a monumental clash between freedom of movement rules and social security rules.’
This is evidently a vast subject. British civil servants worry that the Commission may even try to extend, to everyone from an EU member state living in the UK, eligibility for the UK state pension. The Department of Work and Pensions is reported as having been angry about the Commission’s ‘underhand tactics’.7 The DWP has been reluctant to quantify how much is at stake, but an analysis was released in January 2012 showing that – from a total of 5.5 million welfare recipients – 371,000 were foreign-born claimants and 258,000 of these came from outside the European Economic Area.8 By implication, 113,000 came from the EEA and the great bulk of these (probably over 98%) would have been from the EU as such. If we assume that 110,000 out of the UK’s 5.5 million welfare recipients came from the rest of the EU, and that the average amount received by this group of 110,000 people was two-thirds that of the typical claimant, then the cost to the UK taxpayer of handing out benefits to citizens of other EU countries was running earlier this year at an annual rate of rather more than £2 billion (which is a bit more than 0.1% of GDP).9 Ultimately, the cost to UK-born British citizens of opening up our social security and pension arrange-ments to all-comers from the rest of the EU could run into many billions of pounds each year and the capitalized loss would amount to tens of billions.
No doubt most people in Britain would be furious if the Commission were to win its cases at the ECJ and the UK government then felt obliged to implement the ECJ rulings. There is an obvious injustice here. British citizens are forced to pay taxes, but are happy enough to do so if these taxes go to help them and other British citizens when they retire late in life or when they fall on hard times. But they resent being forced to pay taxes to finance benefits – particularly pension benefits – for foreigners that have only lived in the UK for a year or two, and may indeed have caused people of British birth to lose their jobs. (See chapter 4 of this study for more on the cost of lost UK jobs arising from EU membership.) But – if the UK government were to ignore the ECJ verdicts and restrict benefit payments to long-term contributors or according to a citizen-ship criterion – it would be in breach of European law. It would then become subject to fines, also potentially running into billions of pounds! (If this sounds far-fetched, note that fines have been levied on UK public sector bodies for not flying the EU flag or mentioning money received from, for example, the European Regional Development Fund. Doncaster Council has had to pay £5,250 for ‘failure to advertise ERDF support during a radio’ announcement. In recent years the Commission is reported as having ‘punished dozens of British organizations for failing to display the EU’s branding [flag, logo and so on]’.)10

47How much does the European Union cost Britain?
UK to face € billions of fines?
The notion of a supposedly sovereign state being fined for events within its own borders by a foreign judiciary would be funny if it were not true. Undoubtedly many people in Britain find the whole thing peculiar or even farcical. Britain has an army, the Royal Navy, the Royal Air Force, a so-called ‘independent’ nuclear deterrent, and a national anthem, and it wins gold medals at the Olympics. How on earth can it be fined by ‘euro-crat’ officials, acting at the behest of a court decision reached in another country? However, according to a story in The Daily Telegraph on 19th January 2011 the National Audit Office had at that stage identified £398 million of fines already paid and another £601 million of money set aside for future payments of fines. (Hence the story’s headline, which was ‘Britain faces £1 billion of EU fines’.) These fines related to misspending by the Treasury, that is, by British central government. On top of that the Local Government Association expressed concern at the same time that local councils ‘could face
fines of up to £1 billion a year under’ plans put forward by the Coalition government. The association raised the issue, because it feared that the government’s Localism Bill broke EU rules (i.e., the acquis communautaire). Finally, as already noted the EU could fine the UK because it did not pay welfare benefits to citizens from other EU countries that had come to live and work in the UK.11
It is time to bring this chapter to an end. The emergence of large contingent liabilities for the UK state reflects the tensions and misunderstandings that arise from having two ‘governments’ (i.e., a government in the national capital, and a separate and to a significant degree competing government in Brussels) for one ‘sovereign’ country. At times the resulting confusion has led to situations that are bizarre almost to the point of absurdity. A reasonable view is that the UK needs to set aside another ¼% of GDP each year for the potential costs of contingent liabilities arising from its EU membership.
1 This is the author’s calculation, based on the pages in the ECB’s latest Annual Report dealing with the ‘Capital subscription’ of the Eurosystem. 2 European Central Bank Annual Report for 2011 (Frankfurt: ECB), p. 191. 3 Note also that, in relation to its holdings of Eurozone sovereign debt (i.e., the government securities of Greece, Ireland and so on), a decision of the European Council has declared the ECB a ‘preferred creditor’. In other words, the ECB’s claims must be satisfied in full before any other creditor’s claims come into play. This makes it difficult, although not impossible, for the ECB to have losses on government securities. See ECB Annual Report for 2011, p.171.4 When the negotiations ‘to help’ Greece, Portugal and others started in spring 2010, all members of the EU – including the UK – participated in those negotiations and blessed the establishment of a facility to raise funds and channel them to the troubled economies. The fund – the European Financial Stabilisation Mechanism – did raise about €60 billion, and lent this money to Ireland and Portugal. The money was raised by the EU, with a joint and several liability for repayment falling on all its member states, including the UK. In the event that no other EU member state covered this organization’s debts and that all its loans were not repaid, the UK’s liability would therefore be €60 billion. The UK was in this position only because of the Lisbon Treaty. The Lisbon Treaty gave the EU ‘legal personality’ (and hence the ability to incur debts) and determined that decisions on such matters were by accepting liability for itself (and after all was not a member of the Eurozone), it had to accept the liability because most EU members voted in the Council of Ministers in favour of the proposal. (In other words, the UK had no blocking veto and the proposal could readily command a majority by QMV.) The UK’s assumption of the liability – to repeat, theoretically of €60 billion in the extreme – occurred in the final hours of the Gordon Brown Labour government and very much against its opposition. The Chancellor of the Exchequer, Alistair Darling, waved a copy of The Sunday Telegraph –which had somehow been alerted to the UK’s potential exposure – at his fellow EU finance ministers, to tell them that parts of the British media did not like what was going on. (Bob Lyddon The UK’s risks and exposure to the European Investment Bank and other European financial mechanisms: amounts, safeguards and breaches in the dyke [London: Bruges Group, 2012], pp. 38 – 9.) There is little doubt that most British politicians – and evidently including Gordon Brown and Alistair Darling – had not understood the potentially drastic implications of the Lisbon Treaty, when they accepted it in 2007. They had not seen how the granting of legal personality to the EU (i.e., so that it could borrow in its own name) and the further extension of QMV to financial matters could interact, and would involve the UK in the surrender of its core fiscal prerogatives. It is clear that the Lisbon Treaty has put in place an institutional structure which would allow the EU to incur debts on behalf of the British government (and indeed all other EU governments). The larger lessons are that the small print of international treaties does matter and that politicians must not trust civil servants to give them accurate guidance at all times, even on subjects where vital aspects of ‘the national interest’ are at stake. However, for the time being all this does seem to me rather theoretical. 5 Bob Lyddon The UK’s risks and exposure, p. 4. Lyddon estimates that, ‘The UK has a Maximum Possible Loss of €149.2 billion, on current capital and commitments, to the institutions involved in the financing of the EU and the euro. This does not include any exposure through the International Monetary Fund.’ I find Lyddon’s overall estimate difficult to accept, although it should not be dismissed as impossible. The UK has no treaty obligation to maintain the solvency of the ECB or the ESM, and possible losses under these heads explain most of the €149.2 billion figure. The trouble arises, essentially, in only two areas. First, the UK may have a sizeable contingent liability if the EIB – an institution of the EU rather than of the Eurozone – suffers heavy losses which wipe out its capital. Secondly, the UK could theoretically be caught by the liabilities of the European Financial Stabilisation Mechanism if the treaty establishing ESM does not proceed. (See footnote 4.) Incidentally, the Eurozone member states – which include Germany, France and Italy –

How much does the European Union cost Britain?48
certainly have treaty obligations, even if only implicit, to maintain the solvency of the ECB and could in the extreme lose everything they commit to the ESM. It follows that the contingent liabilities to Germany, France and so on from the failure (or failures) of Eurozone institutions do indeed run into hundreds of billions of euros. These matters were not thought through properly when the single European currency was ‘on the drawing board’ in the early and mid-1990s. For a detailed early warning by the author, see pp. 196 – 200 in Tim Congdon ‘EMU: Europe’s “Maoist leap forward”’, pp. 187 – 203, in Paul Temperton (ed.) The euro (Chichester and New York: John Wiley & Sons, 2nd edition, 1998, 1st edition published in 1997). 6 In the UK national insurance contributions are in form contributions to the National Insurance Fund, with legislation prescribing that the fund should be run on an actuarially sound basis. The reality nowadays is somewhat different, but books on the subject still refer to ‘the contributory principle’ of the original Beveridge welfare state.7 Martyn Brown ‘All migrants to get a British pension’, The Daily Mail, 7th May 2012. 8 Robert Winnett ‘370,000 migrants on the dole’, The Daily Telegraph, 19th January 2012. 9 The author calculated this number before seeing (by means of a Google search) a story by Macer Hall in The Daily Express on 6th December 2011 which referred to a £2.5 billion cost to the UK of ‘benefits tourism’. See also foot note 11 below. 10 Glen Owen ‘Brussels orders EU flag must fly over Whitehall’, The Daily Mail, 28th April 2012. 11 See the story by Macer Hall mentioned above in footnote 9. The Daily Express story says that the EU directive being interpreted by the ECJ accepts that eligibility for benefits does not extend to those areas of the welfare system where such benefits arise from a contributions record at the national level (i.e., from the UK’s National Insurance so-called ‘system’). Excellent, but ‘the contributory principle’ has now been diluted in the UK almost to meaninglessness. (See footnote 6, and the related discussion in the main text, above.) The ECJ seems to believe that the EU directive applies to Child Benefit, Child Tax Credit, State Pension Credit, Income-based Jobseekers’ Allowance, and Income-based Employment and Support Allowance! Evidently, if the UK accepts the ECJ verdict (and as a member of the EU it has no choice, unless Her Majesty’s Government is prepared to break ‘the law’, i.e., the law contained in the acquis communautaire, refuse the pay the EU fines and so on), the UK taxpayer could every year be paying billions of pounds of year to people who are not British by birth or citizenship, but happen to comply with a UK residence criterion of some sort.

49How much does the European Union cost Britain?
It is now time to bring the strands of the analysis together. The cost to the UK of its EU membership has several aspects, at least two of which – the costs of regulation and the costs of resource misallocation – are complex in conception and difficult to calculate. How-ever, the complexities must not allow the Europhiles to sweep the subject aside as impossible to measure and therefore unimportant. There is no single, exact number for the cost of the wreckage inflicted by a large hurricane, but a large hurricane undoubtedly does inflict massive harm. There is no single, exact number for the damage that EU membership does the UK, but vast damage has been done.
Chapter 1 established that, reasonably interpreted, the direct fiscal cost of the UK’s EU membership is now 1% of gross domestic product each year; chapter 2 compared broad-brush estimates of the costs of EU regulation, two from pro-EU sources, with more nitty-gritty and detailed analyses of specific regulatory interventions, and arrived at a number of 5% of GDP each year; chapter 3 borrowed from sophisticated modelling work by the OECD and Minford to reach an estimate that resource misallocation due to the EU’s trade regime costs the UK over 3% of its GDP each year; chapter 4 argued that, because the UK labour market had been too open to immigration from Eastern Europe due to our EU mem-bership, over 100,000 UK-born people had been without jobs over a significant length of time, with a cost that may be difficult to quantify precisely, but might be ¼% of GDP for the relevant period; chapter 5 surveyed the
costs of waste, fraud and corruption, and argued that fish discard under the Common Fisheries Policy led to waste (‘to EU humanity’, in effect) of £1 billion a year and that the CFP more generally had a cost to the UK (relative to restoring control over our territorial waters) of about £800 million each year (which is about half of 0.1% of GDP), but that in total waste, fraud and corrup-tion might involve losses of another ¼% of GDP; and chapter 6 looked at the potential losses from various growing ‘contingent liabilities’, some related to the Eurozone banking crisis, but perhaps at least as impor-tant others attributable to ‘benefits tourism’ (with a probable cost of 0.1% of GDP each year at present and potentially rising over time) and the propensity of EU institutions to fine the British government for alleged misdemeanours. Another ¼% of GDP was added.
So we can now add up the numbers and reach our answer. It is 10% of GDP. The precision of the figure should not be pressed too far, but – as a ballpark number – this is about right. Roughly speaking, the UK is worse-off each year by a tenth of its national output because it is a member of the EU. It would be appreci-ably better-off if it left the EU and became, like most of the world’s countries, independent and sovereign except for the obligations involved in belonging to the World Trade Organization, the IMF and so on. The vital role of these institutions needs to be remembered. The proposal to leave the EU is emphatically not an exer-cise in ‘little England-ism’. On the contrary, it recognises that the supranational and multilateral institutions set
7. The total cost: roughly 10% of national output
Table 7.1: Summary of the costs to the UK of its EU membership
Nature of cost % of GDP Rationale (In all cases, see relevant chapter for detailed argument).
Direct fiscal cost 1 Relatively easy to quantify from official publications and balance-of-payments data; concept is of gross payments to EU institutions over which UK government has no further control.
Costs of regulation 5 Mandelson 2004 to CBI conference 4% of GDP, but many other sources confirm approximate estimate of this size; many subsequent directives etc. have increased costs.
Costs of resource 3¼ CAP long recognised to cause large resource misallocation. misallocation This may now be only ½% of GDP, but other EU protectionism estimated by Minford et al 2005 to cost further 3% of GDP.
Cost of lost jobs ¼ Open UK labour market from 2004 allowed 700,000 Eastern Europeans into the UK, taking away jobs of over 100,000 UK-born people; labour market is still open.
Costs of waste, ¼ CFP involves fish discard and effective ‘gift’ to other nations of fishing fraud and corruption rights in UK territorial waters, but cost under 0.1% of GDP; waste of over-prescriptive water standards; abuse of UK student loan system.
Contingent liabilities ¼ Costs of ‘benefits tourism’, plus some allowance for possible recapitalization of EIB and other EU institutions.
Total 10 Conclusion: the UK is about 10% of GDP, or about £150 billion worse-off because of its membership of the EU.

How much does the European Union cost Britain?50
up in the mid-1940s have been vital to global peace and prosperity in the last few decades.
Understanding the 10% figure: a flow relative to GDP
In one of the paragraphs above the phrase ‘each year’ followed the cost estimate. This was necessary, so that the cost could be compared with the UK’s annual GDP. The word ‘cost’ does need to be qualified and pinned down in this way, as it is sometimes used without suffi-cient care. What kinds of misuse are we thinking about?
First, the ‘cost’ may be a one-off hit of some sort. A particular interpretation of an EU regulation may cause harm in a particular year, but not be on-going;1 or the demand for the capitalization or recapitalization of an EU institution may be a once-for-all event; or the UK may be asked to contribute to an EU-sponsored emer-gency foreign aid package to a country devastated by civil war or famine, where the civil war or famine are not expected to go on for ever; and so on. One-off hits are not included in the 10% number, because it is difficult to allow for them. Arguably, the annual figure should include an allowance for the expected probability in any one-year period of one-off hits.
Secondly, the cost is an annual number (i.e., the flow in a one-year period), not a capital value (i.e., a number – like a net present value of discounted costs – which attempts to calculate one number for the stock of disadvantages to the UK of EU membership, in effect, a number that expresses the cost ‘for all time’). Estimates of the capital value raise many uncertainties. Policies may change at a later date, while the discount rate applied to costs in future years is contentious. In some of the footnotes to these pages crude attempts have been made at capitalization, particularly where the damaging effect of regulations is cumulative and the current year understates the cost to the UK.2 The pref-erence has been for a high rate of discount, because of all the imponderables. Nevertheless, there can be little doubt that the UK’s membership of the EU – which is now defensible, if at all, only on political grounds (see below) – has an economic cost, in capital terms, running into the trillions of pounds.3
Understanding the 10% figure: the problem of the counterfactual
A fundamental criticism of the analysis here, and par-ticularly of the analyses in chapters 2 and 3, is that the costs are overstated because the counterfactual – the situation in which the UK has left the EU – has not been adequately spelt out and explained. Specifically, as regards the costs of regulation, UK departure from the EU would not mean that the UK’s industries were totally unregulated and estimates of the cost of EU mem-bership depend on the assumptions made about the severity of the UK’s domestic regulatory regimes if we
were outside the EU. Cynics might suggest that the UK would have ferociously tight regulation, which would hurt British industry and finance even more than EU regulation. The same kind of objection can be made to this study’s estimate of the costs of resource misalloca-tion. The UK’s departure from the EU would allow us to adopt unilateral free trade, which economists tend to regard as the best policy, but in the hurly-burly of practical politics there is no guarantee that – outside the EU – the UK would in fact be a free-trade nation. (It was not before 1973.) So the estimates of the cost of resource misallocation made in this study can be attacked for falsely taking for granted that the alterna-tive to EU membership would be free trade.
The problem of the counterfactual is basic not only to any discussion of the UK’s membership of the EU, but also to the yet more fundamental debates on the right governing ‘philosophy’ for the UK as a nation and its general geo-political stance. Implicitly in this study it is assumed that Britain is, above all, a nation with an enduring ‘public philosophy’ that upholds the freedom of the individual and the non-discriminatory rule of law.4 Further understood commitments are to the free market economy and, hence, to the defence of private property rights. Given that, the implicit counterfactual in the cost estimates in this study is that, outside the EU, the UK would be a free-trade nation with light regu-lations and low taxes. Of course that counterfactual is open to review and criticism.
A further clarification must also be emphasized here. To say that the cost to the UK of EU membership is about 10% of GDP is not to claim that, within hours of our exit from the EU, everyone in our country would better-off – visibly and without further ado – by that amount. It is not that incomes would be higher at the next pay date by 10%, while prices would be the same. That is not what is being said. By exiting the EU, the UK would indeed be moving – within relatively short order – to saving almost 1% of GDP, because it would not have to pay the direct fiscal cost discussed in chapter 1.5 Within a year or two we would gain from avoiding benefits tourism and some Eurozone contingent liabilities, we would stop the fish discards, we would adopt more sensible water standards and so on, and we would chuck the ECJ fine notices in the bin. Altogether we are talking about perhaps another 1% of GDP quite quickly. But the savings from unravelling the acquis (and discarding it with the debris of the dead fish in the North Sea, where many of the regulations belong) would take several years to emerge, while the welfare improvements from improved resource allocation would never appear in a pay cheque or a profit-and-loss statement. The gains from improved resource allocation would nevertheless be real enough and would be evident in, for example, a sharp fall in the relative price of food and increased purchas-ing power. Over five or ten years the British people would see a material improvement in their living standards from leaving the EU, and their economy would move onto a higher growth path.
51How much does the European Union cost Britain?
Benefits of EU membership?
Enthusiasts for the UK’s continued membership of the EU may counter that our answer is one-sided, because no benefits have been identified and the benefits have not been balanced against the costs. But that begs the question, ‘what economic benefits does the UK receive from EU membership?’. (The politics are another matter and are mentioned briefly in the final section.)
The only serious answer that the Europhiles give – indeed, the only meaningful and substantive benefit that the UK could be said to receive from EU membership – is that British companies enjoy free trade in industrial products with their most immediate neighbours. Industrial free trade is undoubtedly a major blessing for the UK, as for other EU members. (It is not an unmixed blessing, as – for example – the discussion in chapter 3 on the Tate & Lyle sugar refinery demonstrates.) To the extent that the EEC/EU has promoted industrial free trade since its founding in 1957, the citizens of Britain and the rest of European should be grateful to it. When in his 2004 speech to the CBI, Mandelson wanted to identify something to offset the cost of EU regulations to business, it was entirely understandable that he should point to the benefits of the single European market.
It was true that in the early 1970s, when the UK sought Common Market membership, the full opening of the EEC area to British companies would prove advan- tageous to the UK.6 But that was 40 years ago, when international trade was still hampered by high tariff barriers and other restrictions. Today the situation is utterly different, because of radical trade liberalization across the globe. Before the Tokyo Round of trade liberalization under GATT auspices, which ran from 1973 to 1979, many tariffs on industrial products were in the 10% - 20% area, with effective rates of protec-tion sometimes being well over 30%.7 The Tokyo Round brought tariffs down to under 5% in principle. The next round – known as ‘the Uruguay Round’ – lowered tariffs further and also extended the key principles of the GATT to trade in services.8
But another trend was perhaps yet more important than the GATT trade rounds. From the 1980s onwards the governing elites of many developing countries, includ-ing such formerly (or nominally) communist countries as China, realized that unilateral trade liberalization was of enormous economic benefit. The result has been a dramatic transformation of the international business environment. In the early 1970s the European Common Market was an oasis of (relatively) free trade in a world where virtually entire continents, including most of Asia and Latin America, were deserts of protectionism. Today the EU’s single market may be larger and more attractive for British companies than the Common Market was in the late 1970s and early 1980s, but the difference is hardly revolutionary. Much more important, countries that were virtually closed to British exporters in the early 1970s, such as China, Russia and Brazil, are now quite open to our products. The European single
market, with its free-trade arena in our backyard, is not the only ‘game in town’. In effect, industrial free trade has become available globally.
Free trade with the EU, but outside it
This is not to deny that, if the UK’s exit from the EU led to the end of industrial free trade with existing EU mem-ber states, the UK would lose valuable gains from trade. The logic is straightforward, and we can appeal again – as in chapter 3 – to Adam Smith’s exposition in The Wealth of Nations. If late-18th -century Scotland had slapped 1,000% tariffs on imports of wine, grapes might have been grown in ‘glasses, hotbeds and hot walls’, to recall Smith’s words, and wine might be made from the grapes and a prodigious application of labour. But Scotland would have been far poorer than if it had imported wine from Spain and Portugal, and paid for the imports of wine with exports of whisky. In general, nations benefit from specializing ‘according to compar-ative advantage’.9 Whether the UK is inside or outside the EU, we should want free trade with our European neighbours.
Europhiles sometimes talk as if the UK’s exit from the EU would leave us ‘isolated’, and hence in some sense marginalized and poorer.10 The severing of trade ties would indeed be a calamity, for both the UK and the rest of Europe, if that were to accompany our leaving the EU. But no diminution of trade is necessary or to be expected. First, the EU has industrial free trade with Norway, Switzerland and Turkey, and none of these three countries is an EU member. As the trade regime with the EU varies for each of the countries, and as the variations are complex and idiosyncratic, there is no space to go into detail here. But their prosperity dem-onstrates that EU membership is not a condition for close and extensive trade interaction with EU members, even for nations that are geographically in the European orbit. (Norway, Switzerland Turkey have all enjoyed substantial increases in income per head, at current prices and exchange rates, relative to the EU in the last 10 to 15 years.)
Secondly, and much more fundamentally, the EU has reached free trade agreements with nations that are distant from Europe, in terms of both geography and culture. Two salient such agreements are those with Israel, signed in 1995, but taking effect in 2000, and Mexico, agreed in 2000. In both cases industrial free trade is the heart of the FTA. At present negotiations are under way with Japan over a FTA, but the European side has reservations about the extent of the trade lib-eralisation on Japan’s part. In a speech to the European Parliament in June 2012 Karel de Gucht, the EU’s trade commissioner, said that the EU had ‘an upfront agree-ment with Japan on what both sides expect from the negotiations’. However, many of the MEPs expressed reservations, with a common view being that Japan has not liberalized its car market sufficiently. De Gucht accepted that ‘Europe will not commit to disman-tling tariffs before Japan delivers concrete results

How much does the European Union cost Britain?52
on regulatory barriers, including for the car sector’.11
The point here is that ample precedent has been set for the negotiation of a FTA between the UK and the continuing members of the EU, once the UK had left. If the EU is interested in free trade with Norway, Switzerland and Turkey, and even in free trade with Japan, Mexico and Israel, then it should be interested in free trade with the UK. Indeed, if the EU were not in-terested in a FTA with the UK once the UK had regained its independence, the whole basis of international cooperation since the 1950s would be challenged. There have been many lapses, by a large number of nations, from the free-trading ideal since the GATT be-gan its work in the late 1940s. Nevertheless, on balance nations have eliminated tariff and non-tariff barriers to trade, trade has expanded faster than output, and living standards have increased everywhere as nations specialize according to comparative advantage. Surely, it would be bizarre for the EU to maintain FTAs with such nations as Mexico and Israel, and yet to refuse to contemplate a FTA with the UK. Further, one vital consideration suggests that the EU would be foolish to disdain a FTA with us. Indeed, this consideration argues that open EU discrimination against goods and services exported from a fully independent UK would be so counter-productive as to be crazy.
Importance of EU trade surplus with UK
The UK is a massive exporter of goods and services to
the rest of the EU. In 2011 these exports totalled almost £234 billion. However, it is an even larger importer. In 2011 imports from other EU member states came to over £261 billion. So other EU member states had a sur-plus on their transactions with us of almost £28 billion, not much less than 2% of what we produce as a nation. Of course, relative to the economies of the other mem-ber states, £28 billion is much smaller, less than ½% of their combined GDPs. Nevertheless, a trade surplus of ½% or so is worth having, particularly in the current global context when the financing of external deficits has become far more problematic than it was before the Great Recession.
Suppose that the UK has left the EU. Suppose also that the UK has indicated to the other member states that it has every wish to maintain friendly and close trade relations. The aim would be that European exporters can sell as easily to British customers, and British ex-porters can sell as easily to European customers, as at present. Would the other EU member states (‘the 26’) be inclined to turn us down? The answer must be ‘of course not’. Precisely because they have a surplus on their trade with us, they have more to lose from ‘a trade war’ than we have. (And heaven forbid that the phrase ‘trade war’ has to be much repeated in this context.) The existence of a surplus on their trade with us must bias the 26 to want the retention of industrial free trade with the UK. In other words, outside the EU, the one as-pect of our interaction with the EU membership that is genuinely beneficial – free trade in goods and services
Exports to rest of EUImports from rest of EU
0
50
150
100
250
200
300
350
The UK’s trade deficit with the rest of the EU Chart shows annual trade totals,in £b., with rest of the EU
1997 1999 2001 2003 2005 2007 2009 2011
The UK has a consistent trade deficit with the rest of the EU, running at about £25 billion to £30 billion a year

53How much does the European Union cost Britain?
(outside the contentious areas of farming and fisheries) – would still be available to us. In his 2004 speech to the CBI Mandelson said the single market was worth about 2% of GDP to the UK and contended that this benefit of EU membership had to be weighed in the balance against the cost of regulation, which was 4% of GDP. But his argument does not stand up. The benefit of industrial free trade with our European neighbours can be enjoyed outside the EU, just as readily as it can be enjoyed inside it.
Rising cost of EU membership
So the UK can escape the heavy costs of the EU’s regulatory apparatus and other EU-related burdens by leaving the EU, and it can still secure the free trade with its neighbours that it has always wanted. If the Europhiles deny this proposition, can they perhaps explain the willingness – indeed the apparent keenness – of the EU bureaucracy to negotiate free trade arrangements with a variety of countries (i.e., Mexico, Israel and Japan) which are more remote from the EU than the UK and have far less trade with it?
But this hints at a puzzle. Why do any nations belong to the EU? The same kind of calculations done in this study for the UK can be done for all the member states. Given the force of the analysis, in most cases the eco-nomic case for withdrawal is likely to be clear-cut.12 No doubt much of the explanation is to be sought in institutional inertia and popular apathy in virtually all the member states, and – for Germany and the East European countries – EU membership can perhaps be justified by geopolitics and history. (‘They are “too close” to Russia’, ‘Germany must atone for its past’, etc.) But also relevant is that the cost of EU member-ship has been rising over the decades. This trend has been slow and unobtrusive, and commentators have taken time to appreciate the damage being done. Only in the last few years has the EU’s image and reputation deteriorated significantly.
In the early years of the ‘European construction’ the move towards industrial free trade conferred sub-stantial benefits on the original six members, causing widespread anxiety in the UK about relative economic decline. The British people ‘joined the Common Market’ because they were afraid that their country was becoming ‘the poor man of Europe’. In the 1970s and early 1980s the economic pluses and minuses of EU membership were indeed relatively balanced. The UK participated in and gained from the free trade area, while paying less in its fiscal contribution (relative to GDP) than today and postponing the implementation of such iniquities as the Common Fisheries Policy. If this study had been carried out in, say, 1983, it would not have reached such a negative verdict about EU mem-bership. Here we come to a key point: the costs have increased since the late 1980s, mostly because the proliferation of regulations at the EU level of European ‘government’ has competed with and gained ground from existing regulations at the national level.
The wave of over-regulation is hardly secret. To quote from a recent press statement by John Longworth, the director-general of the British Chambers of Com-merce, ‘British firms seem to feel that the balance of advantage of EU membership is lessening…[O]ne third of firms think that the negatives associated with… regulation outweigh the benefits of the single market’.13 Indeed, British business regards some new EU directives as downright nutty. At the time of writing a directive is under consideration in the European Parliament, which would require companies to meas-ure employee happiness before and after a layoff. According to The Daily Telegraph (16th August, 2012), ‘The rules, drafted by Spanish MEP Alejandro Cercas, would make it mandatory for workplaces across the Union to assess mental health after redundancy. The results of such tests would then be used to determine if an employer should provide retraining, interview coaching and general job-seeking counsel to former employees.’ A representative from the Engineering Employers Federation described the idea as ‘ridiculous’.
The proliferation of regulations began with the 1986 Single European Act. The Single European Act was the first major transfer of competences to EU institutions since the founding treaties, as the then president of the Commission, Jacques Delors, was fully aware. The transfer of competences, and the proliferation of regu-lations, received further momentum in a sequence of further treaties, notably the Maastricht Treaty of 1992, the Amsterdam Treaty of 1997 and the Nice Treaty of 2000, with the process culminating in the Lisbon Treaty of 2007. In the early 1980s, the era of so-called ‘eurosclerosis’, most key government decisions on the European continent were taken in national capitals, and the different nations had distinctive legal and regulatory structures. Today the situation has been transformed. So many competences are now in the hands of EU institutions that most top policy decisions in the ‘domestic’ area (i.e., apart from foreign policy, diplomatic and military decisions) are taken in Brussels. Meanwhile the EU purports to have in the acquis communautaire a regulatory and legal framework for virtually the entire continent, with no regard for national boundaries.
This study has identified the heavy cost of the regula-tory acquis as the biggest single cost to the UK of its EU membership. That message emerged in chapter 2 and is clear from Table 7.1. By implication, the drift of power to the Brussels bureaucracy since 1986 has been a dis-aster. Clearly, if it has been a disaster for the UK, it is likely also to have been a disaster for other EU member states. The chart on page 54 shows the ‘trend’ rate of economic growth in the three largest original mem-bers of ‘the European construction’ (i.e., Germany, France and Italy) since 1985. (The ‘trend’ is taken – for simplicity – as the five-year moving average of the annual % rates of change. More sophisticated methods of de-trending would no doubt have led to smoother lines, but the direction of the lines would certainly still have been downwards.) Many other forces have been at

How much does the European Union cost Britain?54
work to depress economic growth in this period. Even so, if the transfer of competences to EU institutions is supposed to have been an answer to ‘eurosclerosis’, some hard thinking now needs to be done. Economic growth in the original six members of the Common Market has come almost to a complete halt. (Growth continues in Eastern Europe, as the nations there have much catching-up still to do relative to Western Europe.) The truth is that the cost of EU membership has been rising for all of the member states and not just the UK.
What about the politics of exit?
Britain’s membership of the EU has a heavy econom-ic cost. A large number of criticisms can of course be levelled against the analysis in this study, and some of the particular lines of argument and methods of calculation may be wrong. Nevertheless, the main features of the analysis are robust, in that they have been put together from a range of sources that both Europhiles and Europhobes recognize in discussing these topics. The conclusion has been that EU member-ship costs the UK about a tenth of its annual output. But – even if that number were halved – it would still be too high and unacceptable. The economic case for leaving the EU is overwhelming. Admittedly, the cost estimate made in this publication is at the high end of quite a wide spectrum.14 But it is consistent with an official study conducted in Switzerland in 2006, at the behest of the Swiss federal government. That work showed
that full EU membership would cost six times more than its existing trading arrangements with the EU.15
The focus here has been on economics, not politics. Enthusiasts for the UK’s membership of the EU might counter that the case for staying in is essentially political in character. They might contend that Euro-pean integration under the EEC/EU ‘brand’ has kept the continent at peace for over 50 years. They might further claim that the facts of geography dictate that the UK’s most enduring geopolitical commitments must be to the rest of Europe. This sort of rhetoric is often accompanied by claims that the UK must ‘sit at the top table’ and that it would lose international influ-ence if it were ‘by itself’, out of the EU. As the present study is long enough already, this is not the place to put forward the political argument for withdrawal. The political argument for withdrawal may in fact be stronger than the economic. An imperative of the UK debate on ‘our place in the world’ must be to recall the distinctive constitutional and legal arrangements that until 1973 had served our country so well for centu-ries. Those arrangements (such as habeas corpus and trial by jury) are now being sidelined and forgotten in a European super-state.
The political case for leaving the EU is for another time and a separate piece of work. It cannot be emphasized too strongly that, when the UK joined ‘the Common Market’ in 1973, the benefits for the British people were sold as being predominantly economic in nature.
FranceGermanyItaly
-2
-1
1
0
3
2
4
5
1985 1987 1989 1991 1993 1995 1997 1999 2001 2003 2005 2011
‘Trend’ economic growth in the three largest economies of the original Common Market ‘Six’ Chart shows five-year moving average of annual % GDP rates of change
2007 2009

55How much does the European Union cost Britain?
Advocates of entry insisted, on numerous occasions, that national independence and sovereignty would be safeguarded. Events have shown that national independence and sovereignty were at risk, while the economic costs have exceeded the benefits by an ever-widening margin. As more people suffer from EU regulations, with jobs lost and livelihoods shattered, disillusionment and hostility are growing. Sooner or later a referendum on the UK’s membership of the EU will have to be held. A huge debate on the UK’s position in Europe is certain to precede the referen-dum. This study has established that, from an economic standpoint, the case for withdrawal is overwhelming. In the 2010 edition of this study Gerard Batten put down a challenge. To quote, ‘If the Coalition government believe that membership of the EU is financially and
economically beneficial to Britain, then let them commission an independent cost-benefit analysis to prove it.’16 Quite so. Let all the facts and figures relevant to the UK’s EU membership be compiled and assessed by a group of well-qualified and unbiased experts, and let us see their verdict.
For over 40 years officialdom has lied to the British people about the UK’s membership of the EEC and the EU. They must be told the truth. The analysis in this document has at times been complex and technical, and may not always have been easy to follow. But its consistent purpose has been to tell the truth. To repeat its central conclusion, from an economic standpoint, the case for the UK’s withdrawal from the European Union is overwhelming.
1 ‘Rare algae halts £160m. dock plan’, The Daily Telegraph, 26th March 2011. ‘A £160 million dockside regeneration scheme that would create 800 jobs has been blocked by a EU ruling to protect algae on the seabed.’ The losses from this EU intervention may be deplorable, but they are one-off, not recurrent. 2 See footnote 16 to chapter 2 above. 3 Assume that EU membership is for a generation. The annual cost is 10% of GDP which, at the time of writing, is about £1,500 billion. The capitalized value of £150 billion over 25 years at a discount rate of 3% is £2,612 billion (or £2.6 trillion) or at a discount rate of 7% £1,748 billion (or almost £1¾ trillion). 4 Winston Churchill, almost invariably regarded as the greatest British statesmen of the 20th century, high lighted the freedom of the individual and the rule of law as hallmarks of the British contribution to progress. ‘The essential aspects of democracy are the freedom of the individual within the framework of laws passed by Parliament, to order his life as he pleases, and the uniform enforcement of tribunals independent of the Executive.’ This Churchill quote appears on the frontispiece of the 1946 abridged edition of F. A. Hayek The Road to Serfdom (London: George Routledge & Sons, 1946). 5 An awkward difficulty here is that the Lisbon Treaty provides for a two-year period of departure from the EU, with a national government having to confer with the Council of Ministers and agree to the modalities! There are limits to the range of topics this pamphlet can sensibly discuss. 6 Let it not be forgotten that some companies had difficulty standing up to the new competition from other European countries on EEC entry, and had to contract or close down operations. The car industry was the most conspicuous example. But overall economic efficiency improved because the UK concentrated its resources in activities where it was particularly productive.7 ‘GATT’ of course denotes ‘the General Agreement on Tariffs and Trade’. The ‘effective’ rates of protection for a particular industry can be much higher than the apparent published rate, because tariffs are also levied on imports that are raw materials or other inputs to that industry’s and competing industries’ production. 8 The key principles of the GATT, and nowadays of the World Trade Organization, are non-discrimination between trade partners, and avoidance of artificial state support for exporting and import-competing industries.9 ‘Comparative advantage’ is a difficult and far from intuitive idea. A country is said to have a comparative advantage in a particular line of production if the opportunity cost of that production is lower than in another country (or in the world as a whole). The key point is that a nation may be more inefficient relative to its trading partners, in absolute terms of the inputs required, in the production of everything. Nevertheless, it makes sense for that nation to specialize in its area ‘of comparative advantage’, to sell to its more efficient partner(s) and to buy other things from it/them. For example, Sir James Goldsmith would almost certainly have been a first-rate personal secretary. That is, he would have been good at taking shorthand, organizing filing systems, putting together Christmas card lists and so on. But the more time he had spent on shorthand, Christmas cards and so on, the less time he would have had for negotiating business deals. He therefore hired a personal secretary and bought her services, and specialized on corporate finance. No doubt the lady (or ladies) who performed Goldsmith’s secretarial job (or jobs) was/were very competent, but in truth they could do nothing as well as Goldsmith. The idea is a commonplace of microeconomics textbooks, but is not widely understood. (It was not understood – for all his abilities – by Goldsmith himself. See James Goldsmith The Trap [London: Carrol & Graf, 1994]. For a defence of free trade, see the author’s 1981 pamphlet for the Centre of Policy Studies on Against Import Controls.)10 For example, Nicholas Clegg, leader of the Liberal Democrats, said on the BBC’s Today radio programme on 31st October 2011 that, ‘I’m in favour of reform, yes; isolation, no. Why? Because isolation costs jobs, costs growth, costs people’s livelihoods. That is why people need to be careful for what they wish for because if you wilfully move to the margins of Europe before you know it you’ll find it’s hitting people where it hurts most in terms of

How much does the European Union cost Britain?56
their jobs and their livelihoods and that’s not something I think anyone should seriously want.’11 Ulrika Lomas ‘MEPs Voice Concerns On Possible EU-Japan FTA’, Tax News (Brussels: Tax-News.com), 14th June 2012. 12 See the discussion below of Switzerland. An official study there in 2006 found that the cost of EU membership would be six times that of staying out. If the benefit of membership were put at 1½% of GDP, which sounds sensible enough, then the cost would have been 9% of GDP. The number is in line with the estimates here for the UK. 13 Kathryn Hopkins ‘Companies seek escape from red tape in Europe’, The Times, 6th August 2012. 14 The main alternative with a similar ballpark estimate is Craig and Elliott’s 2009 book on The Great European Rip-Off for the Taxpayers Alliance, which arrived at an estimate of £118 billion for the UK. They said that the real cost of EU membership is many times the net direct fiscal cost, a judgement with which the present study strongly agrees. They also proposed that the heaviest price to us is paid by British businesses complying with European regulations and the taxes needed to cover the government bureaucracy to administer all the rules. Again, this seems right and accords with the analysis in chapter 2 above. The Treasury issued a rebuttal of their book, saying that they had overlooked the benefits of EU membership. But – apart from the single market – there are in fact no such benefits, while the present chapter has argued that the equivalent of the single market (i.e., industrial free trade without European neighbours) would be available to the UK outside the EU. 15 Gerard Batten How much does the European Union cost Britain? (London: UK Independence Party, 2011), p. 35. 16 Batten How much does the European Union cost Britain?, p. 36.
Some basic arithmetic….continued
In 2011 the UK had 26.3 million households. So the total cost of EU membership to the average household was over £5,000 a year. (Yes, seriously.)
Notice that this is much higher than the estimate of £750 a year per household for the direct fiscal cost, which is on page 15 and is explained in chapter 1.
The £5,000-a-year per household number reflects all the additional costs of EU membership, reviewed in chapters 2 to 6, meaning the costs of regulation, the costs of resource misallocation, the costs of waste, fraud and corruption, the cost of lost jobs, and the cost of the contingent liabilities for which provision should be made. The average British household pays higher taxes because of EU membership, but it also has higher food bills, and it has to pay more for electricity, water and a range of items, as a result of that membership.
British workers are also less likely to find employment in their own country, because the UK labour market is open to immigration from the rest of the EU, and because employment prospects are reduced by unnecessary restrictions and regulations.
Moreover, in the last 15 to 20 years the growth of personal incomes has been held back by the directives and regulations in the so-called acquis communautaire. Thousands of small businesses no longer exist, as they cannot meet the costs of complying with the acquis. The EU’s directives and regulations have in fact reduced growth all over Europe and the economies of Western Europe have stagnated in the last few years, with virtually no economic growth whatsoever.


How much does the European Union cost Britain?
Does Britain win or lose economically from its membership of the European Union? And how do any benefits compare with the costs? Is there in fact a net cost to us from belonging to the so-called ‘European club’? And, if there is a net cost, how large is it and what does that mean for the UK’s membership of the EU in future?
In this study Tim Congdon, the economics spokesman for the UK Independence Party and runner-up in UKIP’s 2010 leadership election, reviews the costs of EU membership to our country. These include the direct fiscal cost, the costs of regulation, the costs of resource misallocation, the cost in lost jobs, the costs of waste, fraud and corruption, and the potential costs from the possible failure of EU institutions and ‘benefits tourism’. His verdict is that the costs total 10% of our national output.
Are there any offsetting benefits? While the UK does gain from free trade in industrial products with our European neighbours, the EU has free trade agreements with Mexico and Israel, and is seeking one with Japan. As the UK runs a trade deficit with other EU member states, a free trade agreement between the UK and the EU would almost certainly be available to us outside the EU. The benefits of European industrial free trade would therefore continue. So – Congdon argues – the net cost to the UK of its EU membership is the full 10% of gross domestic product that he has identified.
In other words, Britain is today about a tenth worse-off than if, like Norway and Switzerland, it had never joined ‘the European project’. We need to become again an independent and sovereign nation, fully in control of our destiny. If we left the EU, we would fairly quickly save about 2% of GDP by reducing fiscal and other payments arising from our EU membership. Over time living standards would benefit from lower regulatory costs, lower food bills, lower electricity prices, lower water charges and so on. The economy would also move to a higher growth path.
This study is the fifth in a series started by Gerard Batten MEP in 2006. Tim Congdon is a well-known and influential economist, who was a member of the Treasury Panel of Independent Forecasters (‘the wise men’) between 1992 and 1997, and advised the then Conservative government in a successful period for economic policy-making. Gerard – who supported Tim in his 2010 UKIP leadership bid – was first elected to the European Parliament as MEP for London in 2004 and was re-elected in 2009. He uses his position as an MEP to campaign for Britain’s unconditional withdrawal from the EU.
First Published in Great Britain by Tim Congdon September 2012.Copyright © Tim Congdon 2012. All rights reserved. Printed and bound by Caxton Press Ltd.Unit 16, Midas Business Centre, Wantz Road, Dagenham, Essex RM10 8PS.
First edition August 2006, second edition August 2007, third edition November 2008, fourth edition March 2011.Fifth edition 2012.
Contact
Tim Congdon Economic spokesman for the UK Independence Party
01452 830070 [email protected]