how is china’s energy security affected by exogenous
TRANSCRIPT
Vol.:(0123456789)
Discover Energy (2021) 1:2 | https://doi.org/10.1007/s43937-021-00002-6
1 3
Discover Energy
Research
How is China’s energy security affected by exogenous shocks? Evidence of China–US trade dispute and COVID‑19 pandemic
Shi Qiang Liu1 · Xin Huang1 · Xiangong Li2 · Mahmoud Masoud3 · Sai‑Ho Chung4 · Yong Yin5
Received: 8 April 2021 / Accepted: 30 June 2021
© The Author(s) 2021 OPEN
AbstractThe trade dispute between China and the United States (US) since 2018 and the global COVID-19 pandemic since 2020 has significantly impacted China’s economic development. As China’s energy sources heavily depend on imports, its economic viability is becoming more and more risky. This study proposes a novel conceptual framework, involving mac-roeconomic, industrial and geopolitical factors, to evaluate China’s energy security as a major player in the trade dispute. This study also provides a comprehensive strategy for policymakers to make better decisions on reforming renewable energy patterns to guarantee energy security and achieve geopolitical advantages. The PESTEL (political, economic, social, technical, environmental and legislative) and SWOT (strengths, weaknesses, opportunities and threats) analyti-cal methods are applied to evaluate the factors and attributes of China’s energy development and energy security in the current background. The China-US bipartite game reciprocity model and the QSPM (Quantitative Strategic Planning Matrix) analysis are conducted to assess which energy security strategy and policy are more suitable to deal with China-US trade dispute. To enhance energy security, China should diversify its energy supply chain, develop new sources of energy supply, advance the shale gas technology, popularise cleaner power-generation plants, increase nuclear-energy safety, introduce energy-conservation measures, promote alternative-energy vehicles, engage in international energy diplomacy, and rebuild international energy transaction and settlement systems.
Keywords China–US trade dispute · Energy security strategies · Renewable energy transition · Energy policy · Energy patterns
1 Introduction
Over the last two decades, China’s energy needs have skyrocketed because of industrialization and urbanization. China has become the largest importer of crude oil, natural gas and coal worldwide since 2018. Certainly, China is the No. 1 energy consumer in the world [1]. However, China’s total energy supply has been unable to meet true energy demand. In recent years, China’s rapid economic growth has produced the unprecedented energy vulnerability that could threaten its economic sustainability, social stability, and the foundation for its rising aspirations. Obviously, securing energy sup-plies is crucial to maintain China’s economic growth, social peace, and political stability [2].
* Shi Qiang Liu, [email protected] | 1School of Economics and Management, Fuzhou University, Fuzhou 350108, China. 2School of Mines, China University of Mining and Technology, Xuzhou 221116, China. 3Centre for Accident Research and Road Safety - Queensland, Queensland University of Technology, Brisbane, QLD 4059, Australia. 4Department of Industrial and Systems Engineering, Hong Kong Polytechnic University, Hong Kong, China. 5Graduate School of Business, Doshisha University, Kyoto 602-8580, Japan.
Vol:.(1234567890)
Research Discover Energy (2021) 1:2 | https://doi.org/10.1007/s43937-021-00002-6
1 3
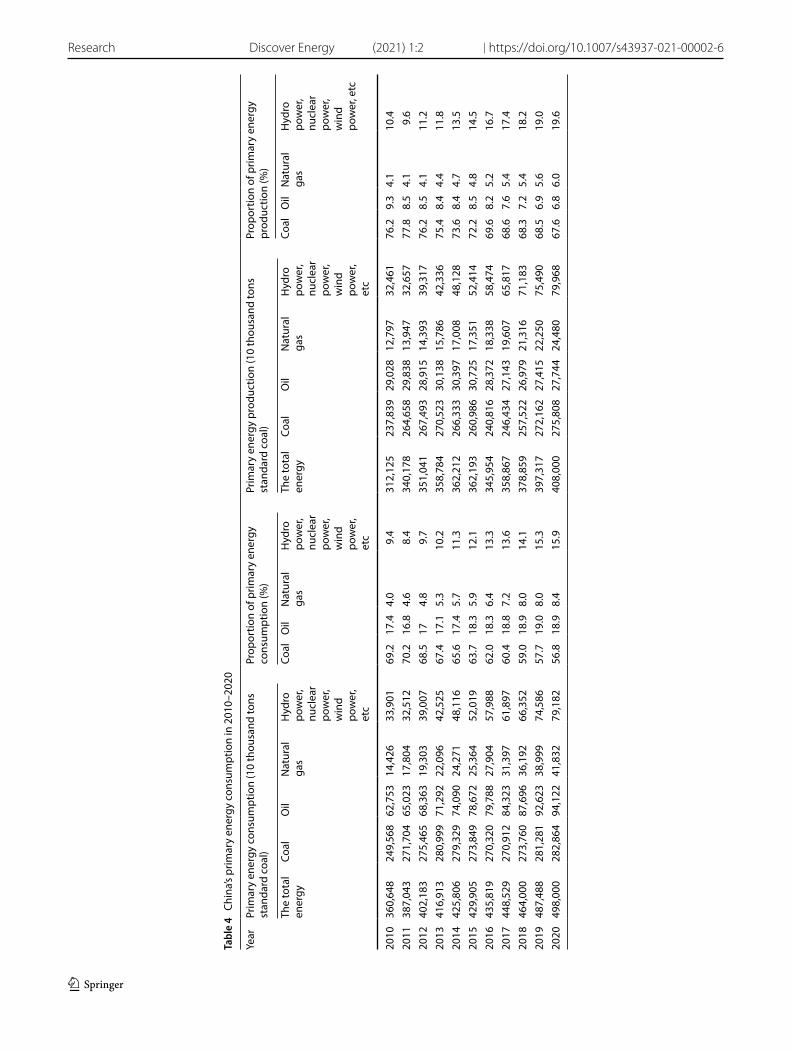
Energy is the lifeblood of the modern economy. Energy demand is closely associated with industrial development and consequent urbanization. In fact, the manufacturing industry is the largest energy-consuming sector. Since China took part in economic globalization with the deepening of the reform and opening-up, its coastal region has transformed into an economic heart of export-oriented manufacturing. Especially since being a member of the World Trade Organization (WTO) in 2001, China rose rapidly in the middle and bottom of the global value chain, taking most of the final assembly lines of manufacturing. The world energy consumption centre has shifted to China by the transfer of many industrial workshops from the West into China. Clearly, the distribution of energy consuming centres has already overlapped with that of the manufacturing industry hubs in large cities such as Beijing, Shanghai, Guangzhou, Shenzhen, and Chongqing. Overall, China’s economic structure and energy supply are highly dependent on international trade, while the supply chain system is fully integrated into the dollar-oil cycle [3]. Consequently, global commodity and energy prices have surged in the last two decades. In China, many export-oriented industries are labour-intensive and energy-intensive. Urbanization plays a key role in energy consumption. The urban industrial population has higher energy requirements than the agricultural population. Since the majority of people have moved from rural areas to cities, China’s energy demands have risen sharply. Evidently, electricity consumption is the primary energy consumption in the manufacturing industry. Industrial motors mainly drive China’s electricity consumption growth [4]. For example, China’s electric motors account for over 1/5 of worldwide electricity demand growth [5]. China has built over 100 million kilowatts of new power plants in the last 8 years. In the near future, it is expected that China’s level of electrification in end-use sectors will surge, and the electric energy ratio will increase, reaching 50% by 2030 [6]. In the mid-2020s, China’s industrial energy demand will reach its peak after tripling over the last two decades [7]. In addition, China’s primary energy consumption pattern will change as coal demand will fall from 60.4% in 2017 to 46.3% in 2030, whereas natural gas demand will increase from 6.6 to 13.2% [8]. As China’s major economic mode has been evolving into the third industry or the service sector, it should make sure a more sustainable supply of cleaner and safer energy.
The current trade dispute between China and the United States (US) indicates that their relationship has been changed from complementary to competitive. A trade dispute broke out when China’s “Made in China 2025” plan was released, because the West worried about that China’s growing strength is endangering the international trade status and hegem-ony of the US [9]. Trade interests and intellectual property rights do not stand alone in the clash between China and the West. As the US and China are competing for hegemony, the trade dispute may last longer than expected [10]. Specifi-cally, China would lose more because non-tariff barriers in the trade dispute will intensify its underlying negative effects. A long-term trade dispute will impede China’s globalization, particularly harming its trading system; and decouple its political, economic and cultural ties, such as cargo shipments, capital flows, technology transfer, international students, and immigration [11].
Energy security is mainly about ensuring the national supply of energy. The long-term security of the energy economy is critical to meet citizens’ needs for end-use energy services [12]. When the trade dispute will progress to a certain extent, energy resources are not solely determined by economic factors. Because China’s economy heavily depends on crude oil and natural gas imports, the China-US decoupling will cause the restriction of China’s balance of payments and energy imports. Specifically, China’s strategical-level crude oil reserves are less than 60 days, far below the threshold of a 180-day security reserve. Although China has the largest oil storage tank cluster in the world, it is still impossible to maintain a sustainable energy supply, particularly in an emergency. Undoubtedly, China will need plenty of low-carbon energy to sustain its economic growth in the coming decades. Under the background of the China-US trade dispute and COVID-19 pandemic, China’s energy needs will probably decrease but the vulnerability of energy supply will increase at the same time. Therefore, China should initiatively reform energy patterns and seek more energy security space to hold out in (and after) the trade dispute and the COVID-19 pandemic.
The contributions of this paper are highlighted as follows. In this study, we analyze China’s energy security from an interdisciplinary but not a solitary-discipline perspective. We are pioneering to explore the context of China’s energy security from the US’s tariff barriers and political confrontation, geopolitics and energy superpower, industrialization and urbanization, foreign exchange reserve security, shale oil technology, etc. Based on characteristics analysis of the explored context, the transformation of energy patterns on Chinese governmental agenda is summarized. Subsequently, we develop qualitative and quantitative analysis methods based on PESTEL (political, economic, social, technical, envi-ronmental and legislative), SWOT (strengths, weaknesses, opportunities and threats), and QSPM (Quantitative Strategic Planning Matrix) to assess the implications of China’s energy security strategies and policies. Finally, we propose insightful suggestions on the reform of energy policies and patterns.
Vol.:(0123456789)
Discover Energy (2021) 1:2 | https://doi.org/10.1007/s43937-021-00002-6 Research
1 3
2 Literature review
In this section, a comprehensive and up-to-date literature review on energy security factors is presented in a specific classification.
2.1 Definition of energy security
Energy security is a multi-faceted concept with economic, political, environmental, social, and technical implications. Basically, an extensive energy security framework includes availability, affordability, accessibility, and acceptability [13]. The concept of energy security is contextual and dynamic, encompassing multiple dimensions like energy affordability and environmental sustainability [14]. Energy security research should transfer from a solitary-discipline topic to an inter-disciplinary research area with a combination of more magnitudes, like energy efficiency, energy policies, energy patterns, energy crisis, energy prices, economic globalization, accessibility of energy services, climate change, mitigation of greenhouse gas emissions, sustainability, and geopolitics [15]. Finally, a systematic theory of energy security involves both logical speculation and system analysis, as well as consideration of both short-term and long-term interests.
2.2 Energy vulnerability and risk management
The energy security concept covers all potential risks with a significant impact on the vulnerability of vital energy systems [16]. Specifically, energy security is concerned about the risks caused by the energy supply chain, ranging from avoiding supply disruptions to mitigating the sudden economic, environmental, and political impacts on the global oil and gas trade. The energy security assessment is a type of risk management problem by referring to the low vulnerability of Vital Energy Systems (VES) [17]. Furthermore, energy vulnerability is regarded as a combination of exposure to risks and resilience to risks [18]. In a sense, some researchers described different types of energy risks in a qualitative way while some researchers believe that quantitative indicators are critical for understanding energy risks [19]. A three-dimensional event-related stress definition (i.e., availability, affordability, and acceptability) describes how an energy system responds when it experiences unexpected events [20]. Traditional energy security theories emphasize reliable and affordable supplies of fossil fuels at affordable prices [21], while the low-carbon electricity pathway faces a fundamental problem of inadequately flexible and responsive supply [22].
2.3 Energy security evaluation
In the literature, several researchers incorporated physical availability, technology development, economic afford-ability, social accessibility, governance, unconventional threats, and environmental acceptability to create energy security indices [23]. A recent study analyzed the trend of 24 Asian countries from 1990 to 2014 using a compre-hensive energy insecurity index based on 12 selected variables [24]. A type of assessment of energy security, using its external and internal dimensions, foreign energy supply security and the security of national energy infrastruc-tures, was applied to trace the changing geopolitical landscape [25]. A holistic approach was proposed to evaluate energy security performance in 18 countries, including five-dimensional measures related to availability, affordability, technology development, sustainability and regulation [26]. China’s energy security was analysed from a country-wide and region-specific perspective to develop an energy system based on China’s merits [27]. An integrated order relation and entropy method was applied to evaluate China’s provincial energy security from 2010 to 2016 with three-dimensional weights (i.e., availability and stability of energy supply, sustainability and acceptability of energy use, and external influences of energy markets) [28]. A regression model with the Data Envelopment Analysis (DEA) approach was developed to evaluate energy conservation policies across 30 provinces in China [29]. A four-dimensional evaluation indexing system (i.e., resource availability, resource affordability, economic efficiency, and environmental impacts) was proposed to evaluate China’s energy security from 1953 to 2015 [30]. A so-called Chinese Energy Security Index (CESI) method was introduced to compromise three themes (i.e., energy supply dimension, economic-technical dimension, and environmental dimension) of energy security [31].
Vol:.(1234567890)
Research Discover Energy (2021) 1:2 | https://doi.org/10.1007/s43937-021-00002-6
1 3
2.4 Energy security strategies and policies
Energy strategy planning involves a persistent process of re-evaluating energy strategies. In the trade dispute, China has to seek a new energy security strategy for prevention or mitigation of incoming energy threats [32]. Energy sover-eignty emphasizes the decision-making on energy systems that foster greater reliance on renewable energy to reduce multiple externalities of the fossil-fuel energy system [33]. The classical approach to energy security ensures a sufficient, uninterrupted energy supply while reducing dependence on foreign resources [34]. With the vulnerable dependence on foreign oil and gas, China’s confidence in energy self-sufficiency relies heavily on coal mining resources, because the widely distributed coal mineral deposits and railroad networks facilitate coal production and transportation [35]. The extraction of gas and oil from previously inaccessible reservoirs has been an energy game changer [36]. The shale-gas boom has made the US a globally significant producer of crude oil and natural gas with an acceptable low well-head cost [37]. Envisioning societal futures for a low-carbon systemic transition is crucial for the new configurations of the energy system [38]. China’s investment in nuclear-power generation projects has reached ¥43.7 billion in 2018 and ¥33.5 billion in 2019 [39]. The renewable power sector also showed greater resilience than fossil fuel during the COVID-19 pandemic, as renewable electricity was the only source of power generation to grow in 2020. Economies with limited fossil fuel reserves will be more affordable as more capital-intensive power generation technologies are necessary [40]. Increasingly, more industrialized economies are shifting away from fossil fuels to renewable sources (biofuels, geother-mal, hydro, solar, and wind power) in their energy mixes [41]. In addition, aggregated policies such as fiscal incentives, market-based instruments, grants and research deployment are important to improve the renewable energy industry [42]. For proposing better climate policies, a stochastic decision model is developed to assess the competitive dynamics of renewable energy and fossil fuels globally [43].
2.5 Energy security and geopolitics
The energy security game among major countries is both the confrontation of energy technology level and the cogni-tion of national geopolitics level. Since the twentieth century, energy security has been intimately linked to geopolitics. Fossil fuel security focuses on supply disruption because of oil price volatility, the political instability of suppliers, and carbon emission reduction policies [44]. Crude oil is an indispensable strategic commodity for economic development and national defence [45]. An integrated quantitative assessment framework identifies the effects of crude oil import disruptions from a supply chain perspective, with southwestern and eastern China vulnerable to potential disruptions in oil supply. As most of China’s energy importation is through sea lanes, which are mainly under the control of the US and allies, China has diversified its importation of oil to avoid cutting off the energy supply in case of potential conflicts with the US [46]. Taking the historical lesson of World War II (e.g., the US–Japan relationship in 1941), the US would block the passage of its enemy’s energy trade. Nowadays, the US and its allies would consider to cut China’s offshore oil lines as a strategic option [47]. It is of vulnerability that China’s energy transportation line is under the control of the US Navy, resulting in the risk of cutting off oil and gas supply [48]. In particular, oil and gas are now economic and security concerns for China’s regime and key international stakeholders: (i) despite China’s increasing investments in overseas oil fields, only 10% of the import demand of oil is safe so far; (ii) the bulk of oil and natural gas supplies will mainly come from politically unstable countries and regions; and (iii) the territorial disputes with neighbouring countries regarding gas and oil reserves are ongoing [49].
Based on the above literature review, there are some studies from the perspective of energy geopolitics, energy con-sumption, energy import and export, energy investment, energy transportation, energy structure, low-carbon policy, etc. However, there are rare publications on energy security from the outlook of the current China-US trade dispute and the COVID-19 pandemic. To the best of our knowledge, few scholars have focused on the latest features of China’s energy security and systematically analysed how to enhance energy security to maintain economic sustainability based on real-world data. In the literature, academic research on energy security frameworks has seldom evaluated the impacts of the current crisis on China’s geopolitical and economic characteristics like foreign exchange reserves, national debt, profits from industrial enterprises, and energy trade settlement. To fill this research gap, we specifically investigate China’s energy policies and patterns based on the analysis of public data from China’s National Bureau of Statistics (http:// www. stats. gov. cn/ engli sh), State Administration of Foreign Exchange (https:// www. safe. gov. cn/ en/), General Administration of Customs (http:// engli sh. custo ms. gov. cn), the People’s Bank of China (http:// www. pbc. gov. cn/ en/ 36880 06/ index. html), and Ministry of Finance (http:// www. mof. gov. cn/ en/).
Vol.:(0123456789)
Discover Energy (2021) 1:2 | https://doi.org/10.1007/s43937-021-00002-6 Research
1 3
3 Analysis methods for China’s energy security
The PESTEL (political, economic, social, technical, environmental and legislative) model is a popular business analytical model that considers six critical business factors (i.e., political, economic, socio-cultural, technological, environmental, and legal). The PESTEL model also enables companies to monitor their operating environment in order to launch a new project. With the PESTEL model, we examine China’s geopolitical energy engagement in global energy markets, increasingly active energy diplomacy, and concrete efforts to maintain national exchange reserves. Specifically, we illustrate why China’s economy cannot afford the high price of oil and gas in the long term. The SWOT (Strength, Weaknesses, Opportunities, and Threats) analysis is another useful tool to evaluate a company’s competitive posi-tion and strategic planning. The traditional SWOT analysis has been applied in many organizations with a descriptive list of strengths, weaknesses, opportunities, and threats [50]. In this study, the PESTEL and SWOT are integrated to diagnose critical factors of China’s current and future energy security status.
3.1 PESTEL and SWOT analysis
3.1.1 Political factors
Foreign policy (Threat) China’s foreign policy has been rigid at the expense of geopolitical interests. China has aban-doned the isolated foreign policy to receive a larger share of economic and diplomatic engagements worldwide. In contrast, a series of changes in the “America First” strategy have not received due attention from China. An illusion that the American capitalist elite will halt the trade dispute for the sake of negotiating tempting tokens after US president election is still remaining. However, we should not ignore the possibility of bipartisan unity in the US and a cold-war reaction to an emerging opponent. In the context of the trade dispute, injurious foreign relation between China and US will be a serious threat to Chin’s energy security.
Geopolitical relations (threat) Volatile geopolitics have made China’s energy supply system more vulnerable. In Asia, China and US provoked competition between the US “Trans-Pacific Partnership” (TPP) strategy and China’s “One-Belt One-Road” initiative [51]. In 2019, the US Department of Defense officially released the Indo-Pacific strategy report and thus Japan recently created a special department for Indo-Pacific strategic affairs following in the footsteps of US. Because of India-China border clashes, India regards military deterrence and tactical harassment in southern Tibet as a stepping stone to joining the American military and economy. Central Asia is China’s important oil and gas exporter, through China-Kazakhstan oil and gas pipelines. In 2019, the Central Asian Gas Pipeline delivered over 47.9 billion cubic meters of natural gas to China, mainly from Turkmenistan, and in part from Uzbekistan, Kazakhstan, etc. The overland energy network, supplied primarily by these Central Asian countries, is part of the Shanghai Coopera-tion Organization (SCO) and the “One-Belt One-Road” initiative [52]. In the Middle East, the geopolitical landscape is also in a fragile balance. Whichever pathway the energy system follows, the world still relies on oil supply from the Middle East [4]. The Gulf countries possess 65% of the world’s crude oil reserves. In contrast, China lacks adequate reserves of crude oil and natural gas to satisfy its energy demand and sustain its economic development. Taking a geopolitical approach, China pursues its interests in trade, investment, and energy, while the United States protects its allies and tries to maintain regional leadership in the Middle East [53]. Because of the atheist ideology, China cannot establish reliable strategic alliances with Middle East countries. In Africa, Angola is China’s second-largest oil exporter. China has put its hands in the provision of infrastructure support for Angolan oil production by using oil resources as international debt repayment. In South America, Venezuela has the largest proven oil reserves in the world and has great potential as a supplement to Middle East oil. However, the extremely precarious social and political situation in Venezuela affects the stability of its oil production and exports. China’s voracious appetite for Brazilian oil, iron ore, and agricultural exports is booming. In Oceania, Australia has long been China’s largest coal supplier. However, Australia has imposed tariffs on many commodities and raised the price of coal and iron ore to China to keep pace with the US. In Europe, Russia is an energy superpower with a robust political agenda that uses energy weapons to engage in policy with China and other energy-hungry countries like Japan and Germany. Rus-sia’s resurgence depends on energy resources, with an aspiration to become an energy superpower to augment its global influence [54]. Russia uses energy resources and pipeline monopolies as a political instrument to enforce its economic and geopolitical interests [55]. Russia will play a geopolitical role in maximizing its interests when China
Vol:.(1234567890)
Research Discover Energy (2021) 1:2 | https://doi.org/10.1007/s43937-021-00002-6
1 3
confronts the US. As the US continues to impose investment restrictions on China, the EU occupies a prominent place with the rapid growth of the outward foreign direct investment (OFDI) scheme in China [56].
Trade policy (threat) In retrospect, after imposing sanctions on ZTE and Huawei, the US imposed sanctions on entire chips and semiconductors, before joining the EU ban on China’s high-end chip manufacturing technology and equip-ment. Gradually, virtually all major state-owned enterprises and related companies in China are subject to sanctions listed behind closed doors. The decoupling of chips, semiconductors, and precision machine tools from the supply chain is already on the table.
Stability of political system (strength) In comparison, China bears a stabler government that will keep on track with the energy turnaround. China’s stable political conditions may take the initiative to ease tensions and overcome difficulties in the energy transition process.
Fiscal and financial incentives (strength) It has been a long-standing practice in China to promote renewable energy. High initial investment costs of hydro, nuclear, solar and wind power plants require fiscal incentives through grants, tax credits, and rebates. For instance, China provides subsidies for using on-site renewables to reduce energy poverty and provide fair access to energy services.
Governmental regulation (strength) If China’s government is likely to make all-encompassing reforms on regulations for renewable energy, carbon tax, and tariff of renewable energy equipment and technology. For example, Shanghai has implemented the so-called low-emission vehicle zones (LEZs) where the EV charger mandates for new buildings have become more commonplace. Since 2020, the annual report of the Chinese central government has announced the BAAS (battery as a service) model and decisively supported the infrastructure construction of switch-battery stations.
Level of bureaucracy (weakness) Bureaucracy in China would make it difficult to scale up renewable energy in some places. The legal and regulatory framework for producing, transmitting and distributing renewable energy still lacks clar-ity. Construction permits for solar and wind farms take a long time to be obtained due to complex approval processes. There would be a monopoly in grid connectivity equipment supply with increased costs and risks but without standards or specifications.
3.1.2 Economic factors
Economic growth recovers (strength) Before the COVID-19 pandemic, China was a prime role model of emerging econo-mies, both overall and in economic growth. Particularly, China is the largest industrial power user in the entire industrial category of the planet. After the COVID-19 pandemic, the global recession is one of the biggest challenges facing the G20 economies. Because of China’s economic recovery in the first quarter of 2021, domestic power generation has remained at a high level.
Disposable income of consumers (weakness) Disposable income in urban areas gets close links to energy consumption and investment. As the global economy has gravely struggled in the last two years because of the COVID-19 pandemic, consumer incomes did not rise substantially in a recession. The business also needs to save money and spend less, particularly on unnecessary energy products. Many vacant houses will eliminate new subdivisions and will reduce the demand for associated construction materials like rebar, cement, glass, aluminium, and copper. These chain effects will lead to a significant decline of energy and commodity demand in the coming years.
Mass unemployment (weakness) Because of the trade dispute and COVID-19 pandemic, the whole world will experi-ence a great depression and mass unemployment. To face the potential crisis, China should turn this challenge into an opportunity by pre-transforming its energy policies and patterns.
Global energy transition (opportunity) The global energy transition to a new energy order unfolds the gradual shifts toward low-carbon energy sources. Moreover, achieving the goal of inclusive net-zero emissions will require an unprec-edented energy transition. If China continuously increases the renewable mix to 90%, it would invest up to $15 trillion for the massive shift in the next 30 years. Above all, China’s power sector is the largest contributor to the total economic investment. The emergence of enormous benefits will also speed up the establishment of a financial system for green energy. China has accelerated its considerable investment in hydroelectric (e.g., “Three Gorges Dam” project), solar, wind and nuclear power plants, making the renewable energy sector grow faster than fossil fuel plants. In addition, China’s tremendous domestic market provides a sufficient motive for the transition of energy.
Renewable-energy cost reduction (opportunity) Renewable energy business has obtained the benefits from decreasing the battery costs. For instance, wind and solar power have become increasingly cost-competitive in comparison to fossil fuel power plants. Additionally, the development of manufacturing facilities for solar and wind energy grows rapidly.
Vol.:(0123456789)
Discover Energy (2021) 1:2 | https://doi.org/10.1007/s43937-021-00002-6 Research
1 3
In this situation. Prices of photovoltaic cells across the globe have declined significantly because of the increased avail-ability of silicon.
Battery technology advancement (opportunity) Since advanced batteries have left the specialized markets and have entered mainstream markets, they represent a tipping point for technologies such as electric vehicles and rooftop solar boosters. Significantly, battery and micro-processing innovations have reduced the costs of other electric vehicle com-ponents. Because of the decline of battery costs, new business models for batteries emerge will provide new functions from ancillary services to on-demand services.
Manufacturing industry outflows (threat) China competes with some developing countries (e.g., Mexico, India, Viet-nam, Indonesia, Turkey and Brazil) as rivals in low-end manufacturing. China’s industrial overcapacity depends heavily on exports to the international market. Consequently, China relies increasingly on outside economic growth. US tariff sanctions and the tightening of customs clearance will significantly increase the risk of production halts and destruction of foreign trade relationships, or even lead to disruption of the overall supply chain. It has forced China’s labour-intensive export enterprises to transfer to some resource-rich neighbouring countries (e.g., India, Vietnam, and Burma) without tar-iff barriers. In addition, the limited population of young workers darkens the future of Chinese manufacturing. Moreover, the COVID-19 pandemic may suffer the world for a long time, affecting the global industrial chain. Fortunately, China’s social organization and mobilization capabilities give it a temporary competitive advantage in fighting the COVID-19 outbreak to minimize the impact on the manufacturing sector.
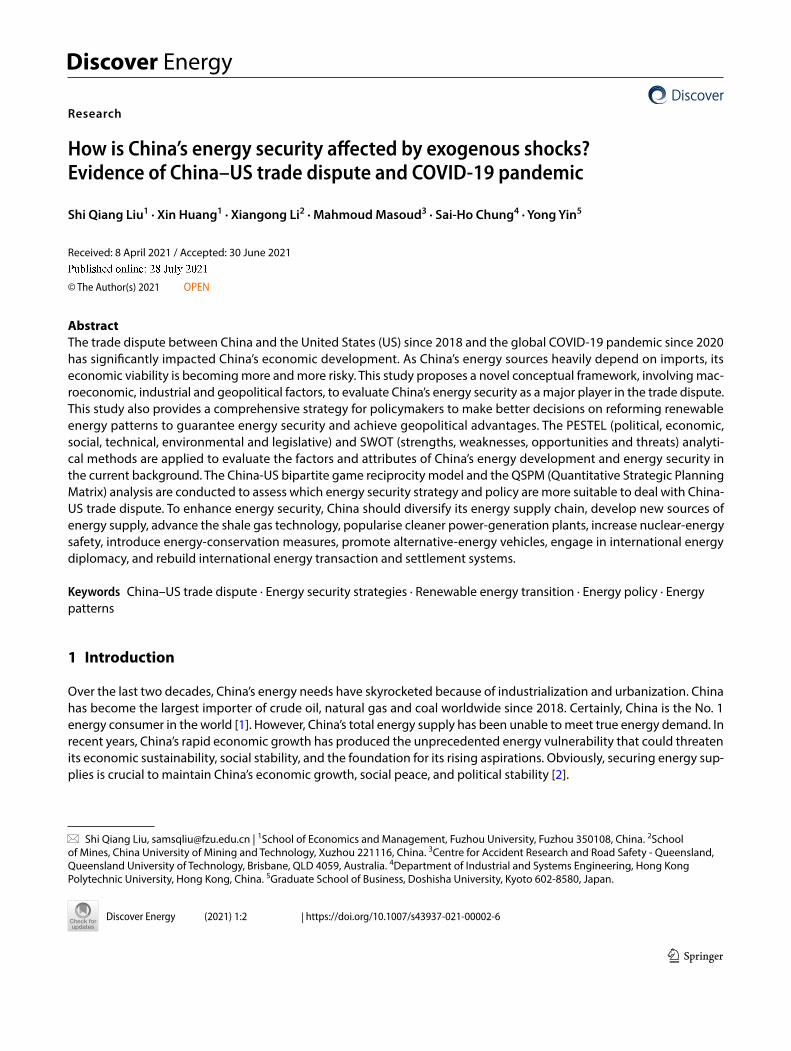
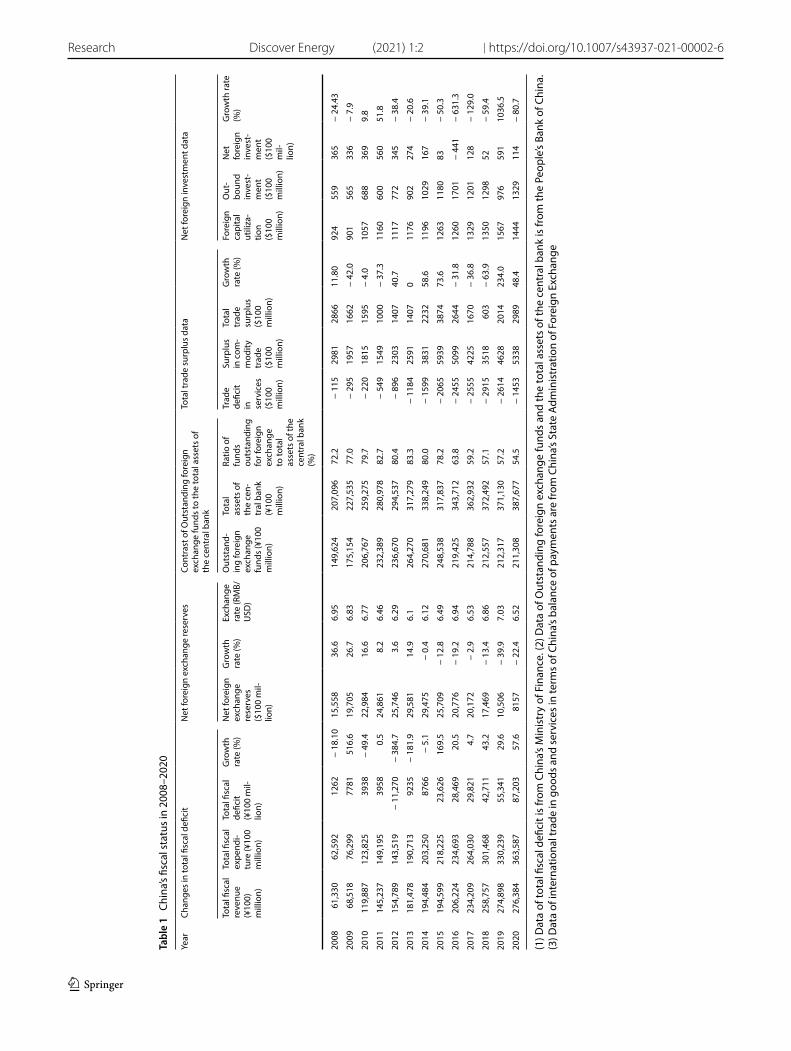
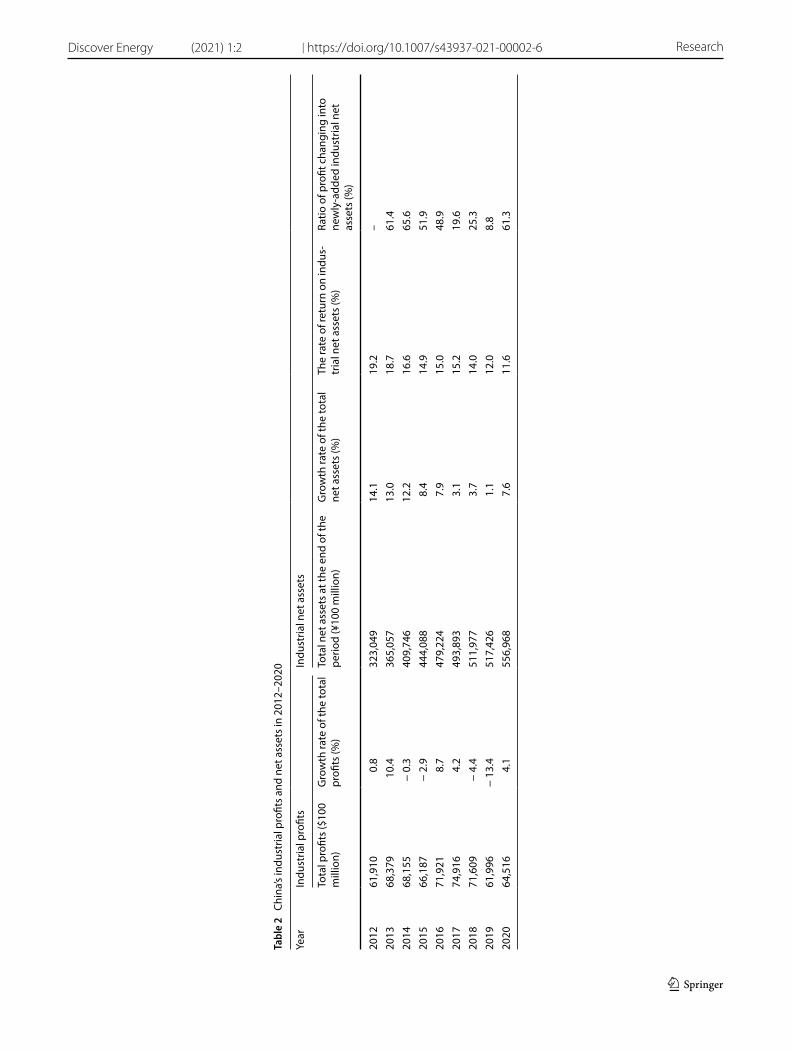
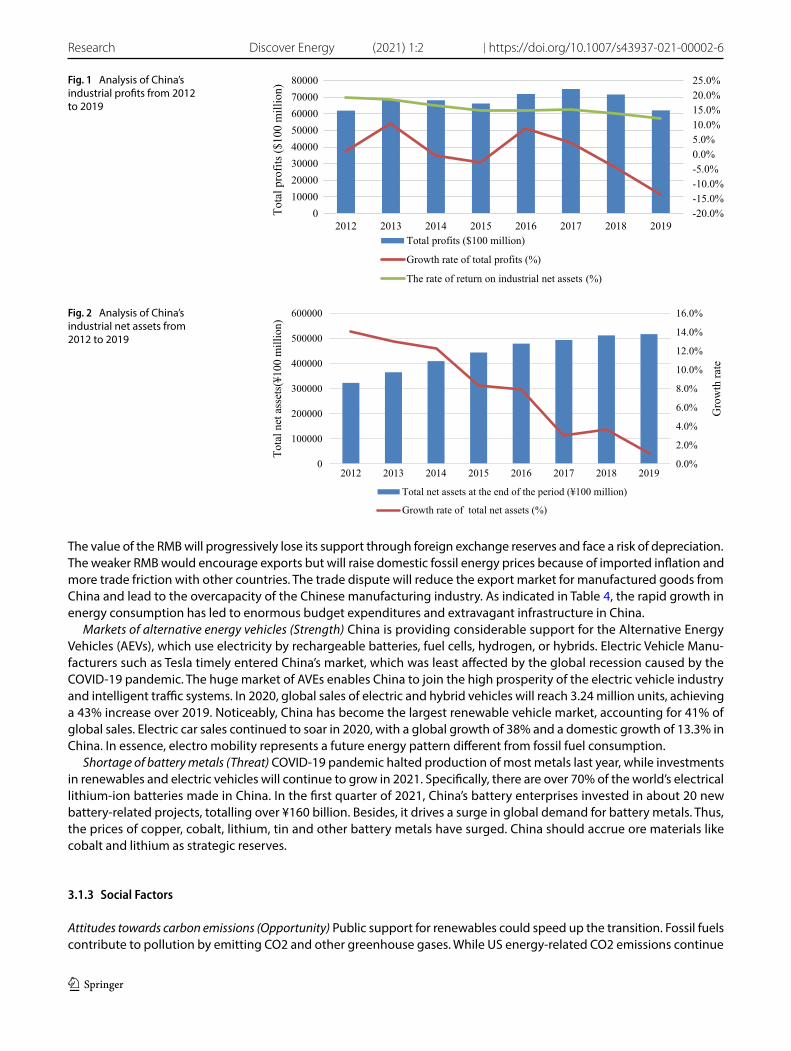
As shown in Table 1, China is encouraging companies to resume production and increase investment in industrial fixed through a significant increase in fiscal stimulus and the release of low-cost loans. The resulting effect is also remarkable, as China’s trade surplus clearly stands at $298.9 billion in 2020. As shown in Table 2, although the Return on Equity (ROE) of industrial enterprises continues to decrease to 11.6% in 2020, the total profit of industrial enterprises increases by 4.1%. Furthermore, the newly added industrial net asset ratio reached its highest level up to 61.3% since 2015. However, the COVID-19 pandemic will force more corporations to develop onshore supply chain strategies to handle supply chain disruptions. Obviously, supply chain transfer will go hand in hand with the energy demand transfer. As an emerging manufacturing rival with a considerable population and a territory similar to China, India’s energy supply and consump-tion will soon reach the same magnitude as that of China.
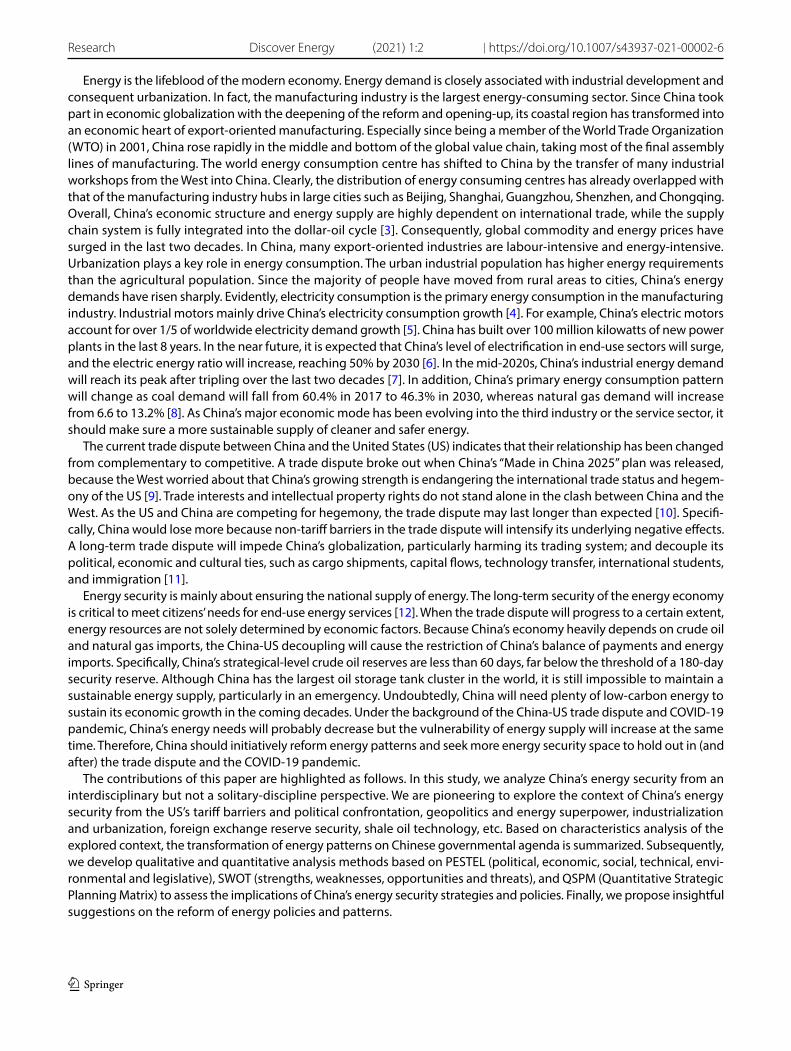
China would no longer provide cheap goods after this trade dispute and undercut its industrial competitiveness, based on the data analysis of Figs. 1, 2. Losing the “World Factory” will directly reduce China’s energy requirements for factories and logistics. In additionon, the trade conflict will also hinder China’s high-tech sectors (e.g., Huawei’s 5G pro-ject). As analysed in Fig. 1, the profits of Chinese industrial companies have steadily declined over 4 years since 2016. As analysed in Fig. 2, the growth rate of net assets of industrial enterprises has virtually come to a standstill after this trade dispute, and the return rate of industrial net assets has dropped from 19.2% in 2012 to 12% in 2019. As observed in Tables 3, 4, there has been a significant impact on both China’s industrial input and output since 2018 because of the trade dispute. Many multinational companies have diversified their supply chains to find tariff-friendly sources outside China, launched or announced new manufacturing plants in the US. If the trade dispute is continuing, China’s industrial enterprises cannot afford the high price of imported fossil fuels any more.
Inflation rates and property bubble (Threat) Over the last 30 years, a thriving local real estate industry has anchored China’s government revenues. The Chinese central bank kept interest rates low to stimulate economic growth during the recession. However, these low-interest loans have sunk into housing securities, particularly for mortgages. In particular, it has already amplified the wealth gaps, raised labor costs, crushed domestic demands, and exposed investments in risky loans.
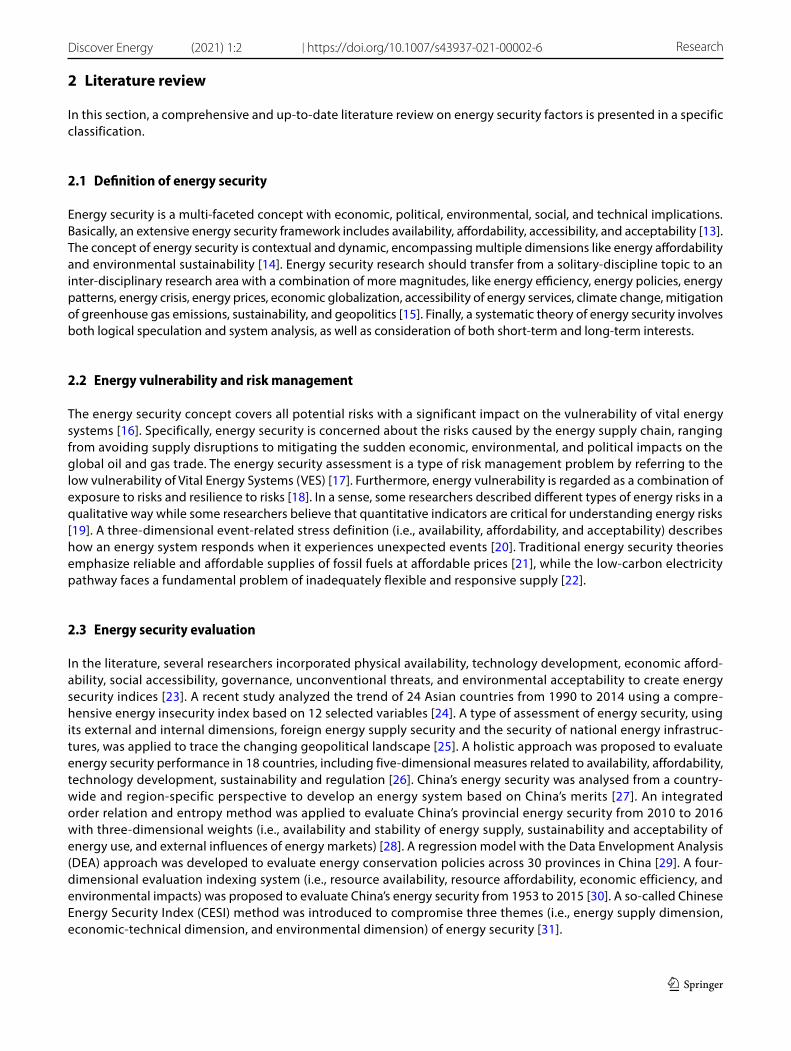
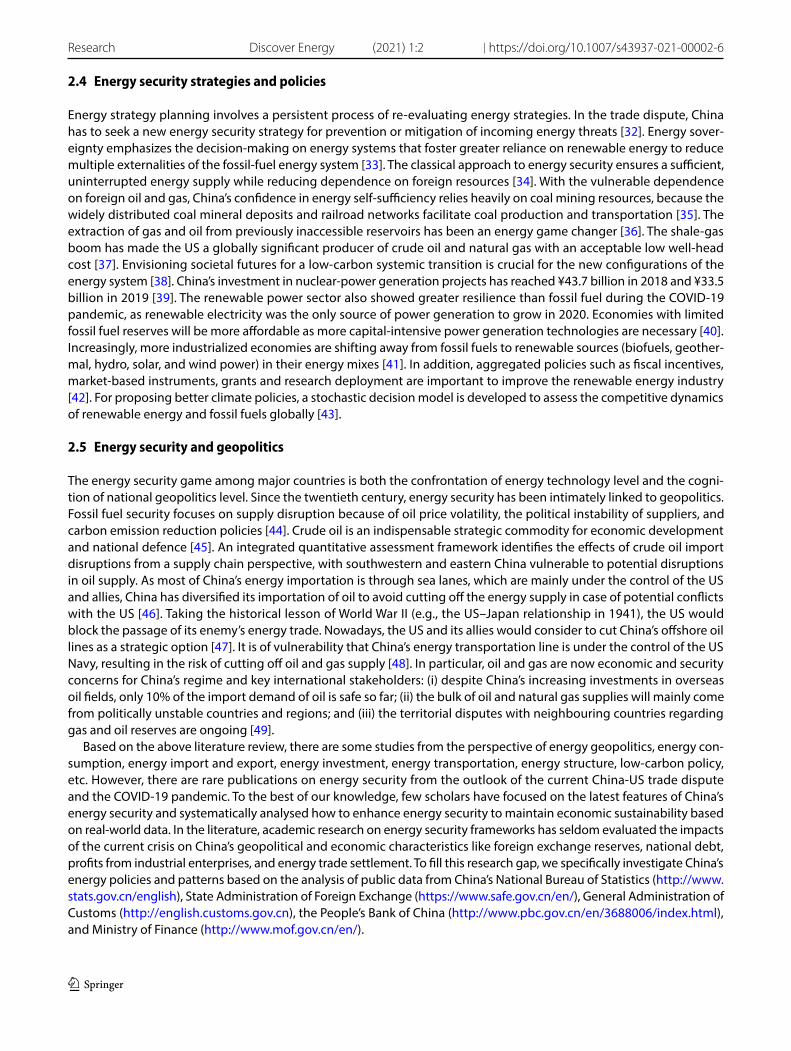
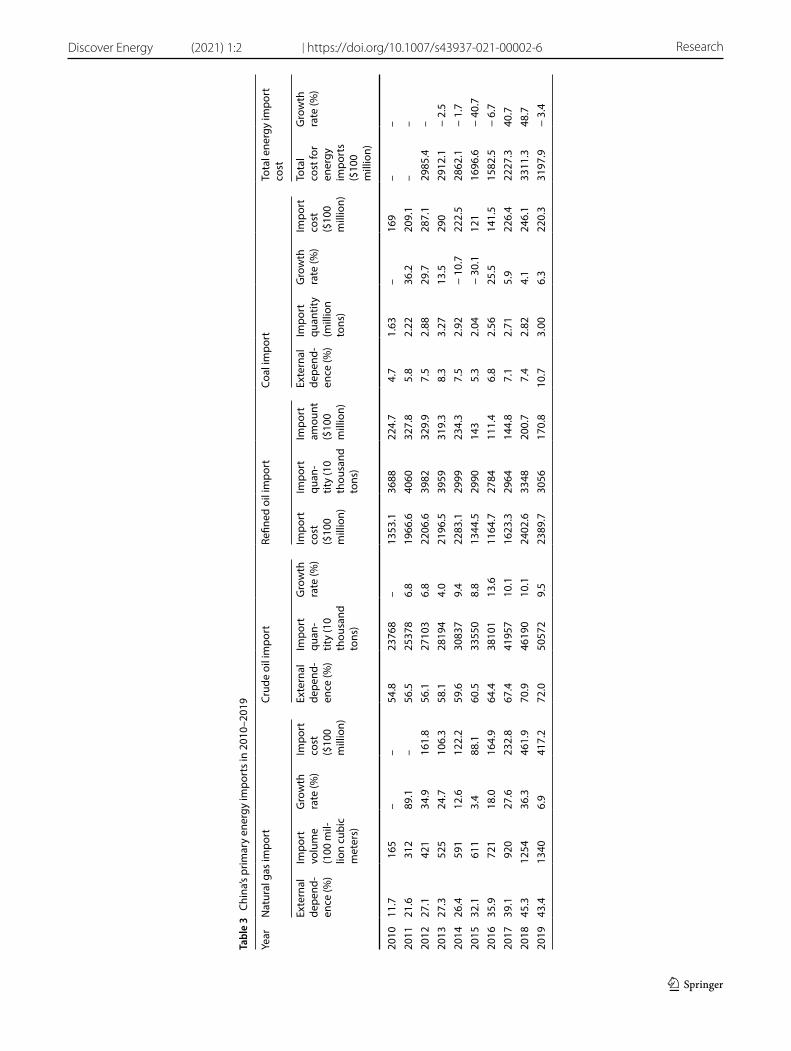
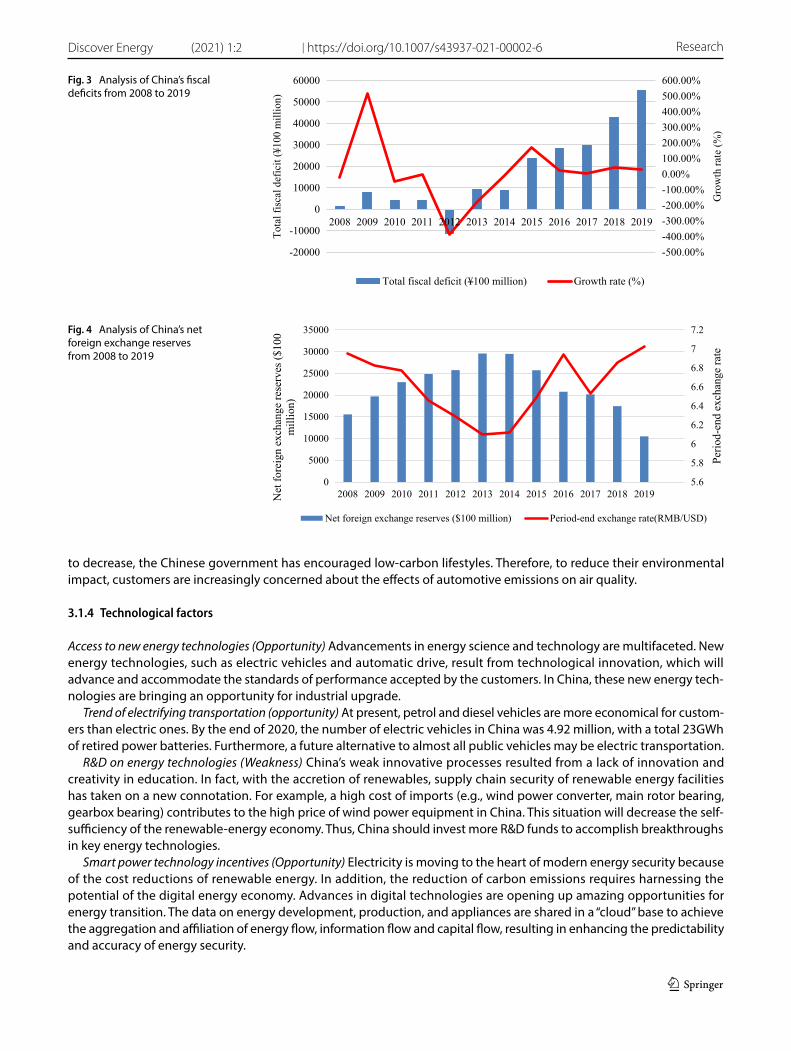
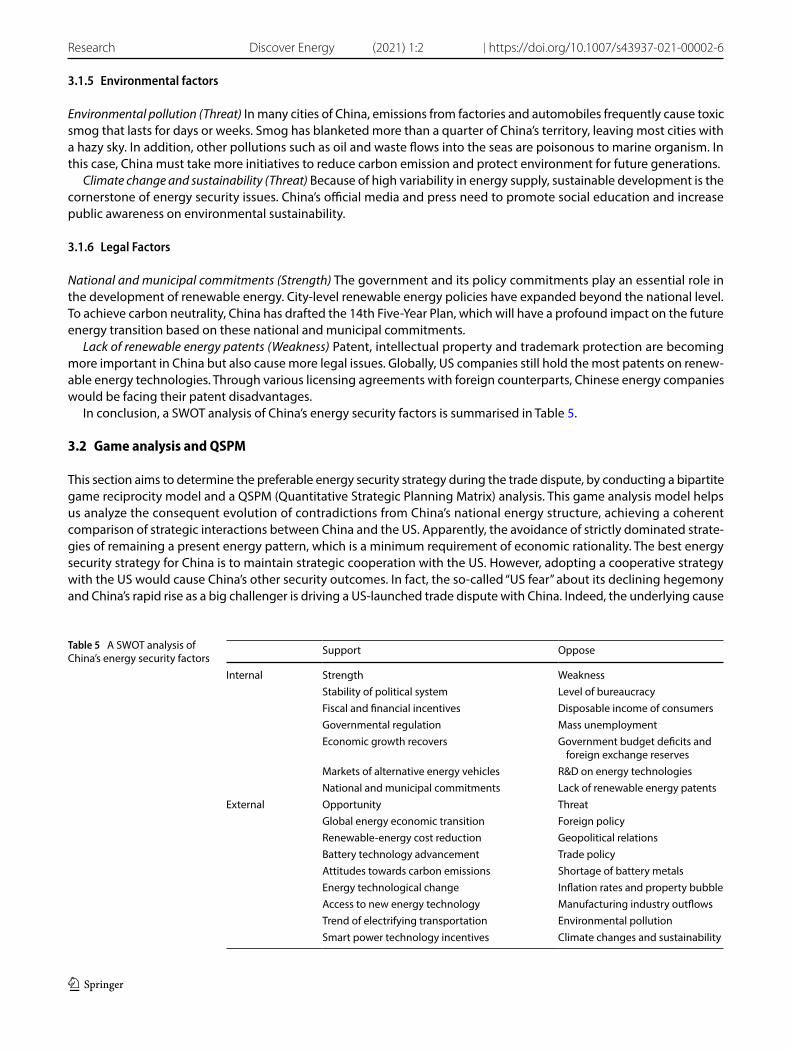
Government budget deficits and foreign exchange reserves (Weakness) China is facing challenges in government rev-enues, foreign exchange reserves, and budget allocation when it seeks to invest in renewable energy. As shown in Table 3, China spent over $300 billion on oil, gas, and coal purchases annually from 2018. According to the analysis in Fig. 3, China must maintain an annual trade surplus of over $650 billion, because it requires about $300 billion for energy imports, over $300 billion for chips, and over $50 billion for agricultural products annually. Otherwise, China will confront the dilemma of constantly depleting foreign exchange reserves. Because of the decline of both industrial profits and net foreign exchange reserves, as analysed in Fig. 4, China will not bear high energy prices and more oil and gas imports. China’s net foreign investment has decreased, because China has launched various infrastructure projects to initiate the “One-Belt, One-Road” since 2013. In the Q1 of 2021, China’s external debt outstanding amounted to $2,526.6 billion, while the foreign reserve balance was $3,170 billion. As a result, China’s net reserves fell to $643.4 billion. Table 3 shows China’s heavy dependence on foreign exchange reserves for energy security, which is indirectly linked to international trade and foreign capital inflow. If the RMB continues to be appreciated, China’s export earnings will suffer significantly.
Vol:.(1234567890)
Research Discover Energy (2021) 1:2 | https://doi.org/10.1007/s43937-021-00002-6
1 3
Tabl
e 1
Chi
na’s
fisca
l sta
tus
in 2
008–
2020
(1) D
ata
of to
tal fi
scal
defi
cit i
s fr
om C
hina
’s M
inis
try
of F
inan
ce. (
2) D
ata
of O
utst
andi
ng fo
reig
n ex
chan
ge fu
nds
and
the
tota
l ass
ets
of th
e ce
ntra
l ban
k is
from
the
Peop
le’s
Bank
of C
hina
. (3
) Dat
a of
inte
rnat
iona
l tra
de in
goo
ds a
nd s
ervi
ces
in te
rms
of C
hina
’s ba
lanc
e of
pay
men
ts a
re fr
om C
hina
’s St
ate
Adm
inis
trat
ion
of F
orei
gn E
xcha
nge
Year
Chan
ges
in to
tal fi
scal
defi
cit
Net
fore
ign
exch
ange
rese
rves
Cont
rast
of O
utst
andi
ng fo
reig
n ex
chan
ge fu
nds
to th
e to
tal a
sset
s of
th
e ce
ntra
l ban
k
Tota
l tra
de s
urpl
us d
ata
Net
fore
ign
inve
stm
ent d
ata
Tota
l fisc
al
reve
nue
(¥10
0)
mill
ion)
Tota
l fisc
al
expe
ndi-
ture
(¥10
0 m
illio
n)
Tota
l fisc
al
defic
it (¥
100
mil-
lion)
Gro
wth
ra
te (%
)N
et fo
reig
n ex
chan
ge
rese
rves
($
100
mil-
lion)
Gro
wth
ra
te (%
)Ex
chan
ge
rate
(RM
B/U
SD)
Out
stan
d-in
g fo
reig
n ex
chan
ge
fund
s (¥
100
mill
ion)
Tota
l as
sets
of
the
cen-
tral
ban
k (¥
100
mill
ion)
Ratio
of
fund
s ou
tsta
ndin
g fo
r for
eign
ex
chan
ge
to to
tal
asse
ts o
f the
ce
ntra
l ban
k (%
)
Trad
e de
ficit
in
serv
ices
($
100
mill
ion)
Surp
lus
in c
om-
mod
ity
trad
e ($
100
mill
ion)
Tota
l tr
ade
surp
lus
($10
0 m
illio
n)
Gro
wth
ra
te (%
)Fo
reig
n ca
pita
l ut
iliza
-tio
n ($
100
mill
ion)
Out
-bo
und
inve
st-
men
t ($
100
mill
ion)
Net
fo
reig
n in
vest
-m
ent
($10
0 m
il-lio
n)
Gro
wth
rate
(%
)
2008
61,3
3062
,592
1262
− 18
.10
15,5
5836
.66.
9514
9,62
420
7,09
672
.2−
115
2981
2866
11.8
092
455
936
5−
24.4
3
2009
68,5
1876
,299
7781
516.
619
,705
26.7
6.83
175,
154
227,
535
77.0
− 29
519
5716
62−
42.0
901
565
336
− 7.
9
2010
119,
887
123,
825
3938
− 49
.422
,984
16.6
6.77
206,
767
259,
275
79.7
− 22
018
1515
95−
4.0
1057
688
369
9.8
2011
145,
237
149,
195
3958
0.5
24,8
618.
26.
4623
2,38
928
0,97
882
.7−
549
1549
1000
− 37
.311
6060
056
051
.8
2012
154,
789
143,
519
− 11
,270
− 38
4.7
25,7
463.
66.
2923
6,67
029
4,53
780
.4−
896
2303
1407
40.7
1117
772
345
− 38
.4
2013
181,
478
190,
713
9235
− 18
1.9
29,5
8114
.96.
126
4,27
031
7,27
983
.3−
1184
2591
1407
011
7690
227
4−
20.6
2014
194,
484
203,
250
8766
− 5.
129
,475
− 0.
46.
1227
0,68
133
8,24
980
.0−
1599
3831
2232
58.6
1196
1029
167
− 39
.1
2015
194,
599
218,
225
23,6
2616
9.5
25,7
09−
12.8
6.49
248,
538
317,
837
78.2
− 20
6559
3938
7473
.612
6311
8083
− 50
.3
2016
206,
224
234,
693
28,4
6920
.520
,776
− 19
.26.
9421
9,42
534
3,71
263
.8−
2455
5099
2644
− 31
.812
6017
01−
441
− 63
1.3
2017
234,
209
264,
030
29,8
214.
720
,172
− 2.
96.
5321
4,78
836
2,93
259
.2−
2555
4225
1670
− 36
.813
2912
0112
8−
129.
0
2018
258,
757
301,
468
42,7
1143
.217
,469
− 13
.46.
8621
2,55
737
2,49
257
.1−
2915
3518
603
− 63
.913
5012
9852
− 59
.4
2019
274,
898
330,
239
55,3
4129
.610
,506
− 39
.97.
0321
2,31
737
1,13
057
.2−
2614
4628
2014
234.
015
6797
659
110
36.5
2020
276,
384
363,
587
87,2
0357
.681
57−
22.4
6.52
211,
308
387,
677
54.5
− 14
5353
3829
8948
.414
4413
2911
4−
80.7
Vol.:(0123456789)
Discover Energy (2021) 1:2 | https://doi.org/10.1007/s43937-021-00002-6 Research
1 3
Tabl
e 2
Chi
na’s
indu
stria
l pro
fits
and
net a
sset
s in
201
2–20
20
Year
Indu
stria
l pro
fits
Indu
stria
l net
ass
ets
Tota
l pro
fits
($10
0 m
illio
n)G
row
th ra
te o
f the
tota
l pr
ofits
(%)
Tota
l net
ass
ets
at th
e en
d of
the
perio
d (¥
100
mill
ion)
Gro
wth
rate
of t
he to
tal
net a
sset
s (%
)Th
e ra
te o
f ret
urn
on in
dus-
tria
l net
ass
ets
(%)
Ratio
of p
rofit
cha
ngin
g in
to
new
ly-a
dded
indu
stria
l net
as
sets
(%)
2012
61,9
100.
832
3,04
914
.119
.2–
2013
68,3
7910
.436
5,05
713
.018
.761
.420
1468
,155
− 0.
340
9,74
612
.216
.665
.620
1566
,187
− 2.
944
4,08
88.
414
.951
.920
1671
,921
8.7
479,
224
7.9
15.0
48.9
2017
74,9
164.
249
3,89
33.
115
.219
.620
1871
,609
− 4.
451
1,97
73.
714
.025
.320
1961
,996
− 13
.451
7,42
61.
112
.08.
820
2064
,516
4.1
556,
968
7.6
11.6
61.3
Vol:.(1234567890)
Research Discover Energy (2021) 1:2 | https://doi.org/10.1007/s43937-021-00002-6
1 3
The value of the RMB will progressively lose its support through foreign exchange reserves and face a risk of depreciation. The weaker RMB would encourage exports but will raise domestic fossil energy prices because of imported inflation and more trade friction with other countries. The trade dispute will reduce the export market for manufactured goods from China and lead to the overcapacity of the Chinese manufacturing industry. As indicated in Table 4, the rapid growth in energy consumption has led to enormous budget expenditures and extravagant infrastructure in China.
Markets of alternative energy vehicles (Strength) China is providing considerable support for the Alternative Energy Vehicles (AEVs), which use electricity by rechargeable batteries, fuel cells, hydrogen, or hybrids. Electric Vehicle Manu-facturers such as Tesla timely entered China’s market, which was least affected by the global recession caused by the COVID-19 pandemic. The huge market of AVEs enables China to join the high prosperity of the electric vehicle industry and intelligent traffic systems. In 2020, global sales of electric and hybrid vehicles will reach 3.24 million units, achieving a 43% increase over 2019. Noticeably, China has become the largest renewable vehicle market, accounting for 41% of global sales. Electric car sales continued to soar in 2020, with a global growth of 38% and a domestic growth of 13.3% in China. In essence, electro mobility represents a future energy pattern different from fossil fuel consumption.
Shortage of battery metals (Threat) COVID-19 pandemic halted production of most metals last year, while investments in renewables and electric vehicles will continue to grow in 2021. Specifically, there are over 70% of the world’s electrical lithium-ion batteries made in China. In the first quarter of 2021, China’s battery enterprises invested in about 20 new battery-related projects, totalling over ¥160 billion. Besides, it drives a surge in global demand for battery metals. Thus, the prices of copper, cobalt, lithium, tin and other battery metals have surged. China should accrue ore materials like cobalt and lithium as strategic reserves.
3.1.3 Social Factors
Attitudes towards carbon emissions (Opportunity) Public support for renewables could speed up the transition. Fossil fuels contribute to pollution by emitting CO2 and other greenhouse gases. While US energy-related CO2 emissions continue
Fig. 1 Analysis of China’s industrial profits from 2012 to 2019
-20.0%-15.0%-10.0%-5.0%0.0%5.0%10.0%15.0%20.0%25.0%
01000020000300004000050000600007000080000
2012 2013 2014 2015 2016 2017 2018 2019
)noillim 001$( stiforp latoT
Total profits ($100 million)
Growth rate of total profits (%)
The rate of return on industrial net assets (%)
Fig. 2 Analysis of China’s industrial net assets from 2012 to 2019
0.0%
2.0%
4.0%
6.0%
8.0%
10.0%
12.0%
14.0%
16.0%
0
100000
200000
300000
400000
500000
600000
2012 2013 2014 2015 2016 2017 2018 2019
Gro
wth
rate
)noillim 001¥(stessa ten latoT
Total net assets at the end of the period (¥100 million)
Growth rate of total net assets (%)
Vol.:(0123456789)
Discover Energy (2021) 1:2 | https://doi.org/10.1007/s43937-021-00002-6 Research
1 3
Tabl
e 3
Chi
na’s
prim
ary
ener
gy im
port
s in
201
0–20
19
Year
Nat
ural
gas
impo
rtCr
ude
oil i
mpo
rtRe
fined
oil
impo
rtCo
al im
port
Tota
l ene
rgy
impo
rt
cost
Exte
rnal
de
pend
-en
ce (%
)
Impo
rt
volu
me
(100
mil-
lion
cubi
c m
eter
s)
Gro
wth
ra
te (%
)Im
port
co
st
($10
0 m
illio
n)
Exte
rnal
de
pend
-en
ce (%
)
Impo
rt
quan
-tit
y (1
0 th
ousa
nd
tons
)
Gro
wth
ra
te (%
)Im
port
co
st
($10
0 m
illio
n)
Impo
rt
quan
-tit
y (1
0 th
ousa
nd
tons
)
Impo
rt
amou
nt
($10
0 m
illio
n)
Exte
rnal
de
pend
-en
ce (%
)
Impo
rt
quan
tity
(mill
ion
tons
)
Gro
wth
ra
te (%
)Im
port
co
st
($10
0 m
illio
n)
Tota
l co
st fo
r en
ergy
im
port
s ($
100
mill
ion)
Gro
wth
ra
te (%
)
2010
11.7
165
––
54.8
2376
8–
1353
.136
8822
4.7
4.7
1.63
–16
9–
–20
1121
.631
289
.1–
56.5
2537
86.
819
66.6
4060
327.
85.
82.
2236
.220
9.1
––
2012
27.1
421
34.9
161.
856
.127
103
6.8
2206
.639
8232
9.9
7.5
2.88
29.7
287.
129
85.4
–20
1327
.352
524
.710
6.3
58.1
2819
44.
021
96.5
3959
319.
38.
33.
2713
.529
029
12.1
− 2.
520
1426
.459
112
.612
2.2
59.6
3083
79.
422
83.1
2999
234.
37.
52.
92−
10.7
222.
528
62.1
− 1.
720
1532
.161
13.
488
.160
.533
550
8.8
1344
.529
9014
35.
32.
04−
30.1
121
1696
.6−
40.7
2016
35.9
721
18.0
164.
964
.438
101
13.6
1164
.727
8411
1.4
6.8
2.56
25.5
141.
515
82.5
− 6.
720
1739
.192
027
.623
2.8
67.4
4195
710
.116
23.3
2964
144.
87.
12.
715.
922
6.4
2227
.340
.720
1845
.312
5436
.346
1.9
70.9
4619
010
.124
02.6
3348
200.
77.
42.
824.
124
6.1
3311
.348
.720
1943
.413
406.
941
7.2
72.0
5057
29.
523
89.7
3056
170.
810
.73.
006.
322
0.3
3197
.9−
3.4
Vol:.(1234567890)
Research Discover Energy (2021) 1:2 | https://doi.org/10.1007/s43937-021-00002-6
1 3
Tabl
e 4
Chi
na’s
prim
ary
ener
gy c
onsu
mpt
ion
in 2
010–
2020
Year
Prim
ary
ener
gy c
onsu
mpt
ion
(10
thou
sand
tons
st
anda
rd c
oal)
Prop
ortio
n of
prim
ary
ener
gy
cons
umpt
ion
(%)
Prim
ary
ener
gy p
rodu
ctio
n (1
0 th
ousa
nd to
ns
stan
dard
coa
l)Pr
opor
tion
of p
rimar
y en
ergy
pr
oduc
tion
(%)
The
tota
l en
ergy
Coal
Oil
Nat
ural
ga
sH
ydro
po
wer
, nu
clea
r po
wer
, w
ind
pow
er,
etc
Coal
Oil
Nat
ural
ga
sH
ydro
po
wer
, nu
clea
r po
wer
, w
ind
pow
er,
etc
The
tota
l en
ergy
Coal
Oil
Nat
ural
ga
sH
ydro
po
wer
, nu
clea
r po
wer
, w
ind
pow
er,
etc
Coal
Oil
Nat
ural
ga
sH
ydro
po
wer
, nu
clea
r po
wer
, w
ind
pow
er, e
tc
2010
360,
648
249,
568
62,7
5314
,426
33,9
0169
.217
.44.
09.
431
2,12
523
7,83
929
,028
12,7
9732
,461
76.2
9.3
4.1
10.4
2011
387,
043
271,
704
65,0
2317
,804
32,5
1270
.216
.84.
68.
434
0,17
826
4,65
829
,838
13,9
4732
,657
77.8
8.5
4.1
9.6
2012
402,
183
275,
465
68,3
6319
,303
39,0
0768
.517
4.8
9.7
351,
041
267,
493
28,9
1514
,393
39,3
1776
.28.
54.
111
.220
1341
6,91
328
0,99
971
,292
22,0
9642
,525
67.4
17.1
5.3
10.2
358,
784
270,
523
30,1
3815
,786
42,3
3675
.48.
44.
411
.820
1442
5,80
627
9,32
974
,090
24,2
7148
,116
65.6
17.4
5.7
11.3
362,
212
266,
333
30,3
9717
,008
48,1
2873
.68.
44.
713
.520
1542
9,90
527
3,84
978
,672
25,3
6452
,019
63.7
18.3
5.9
12.1
362,
193
260,
986
30,7
2517
,351
52,4
1472
.28.
54.
814
.520
1643
5,81
927
0,32
079
,788
27,9
0457
,988
62.0
18.3
6.4
13.3
345,
954
240,
816
28,3
7218
,338
58,4
7469
.68.
25.
216
.720
1744
8,52
927
0,91
284
,323
31,3
9761
,897
60.4
18.8
7.2
13.6
358,
867
246,
434
27,1
4319
,607
65,8
1768
.67.
65.
417
.420
1846
4,00
027
3,76
087
,696
36,1
9266
,352
59.0
18.9
8.0
14.1
378,
859
257,
522
26,9
7921
,316
71,1
8368
.37.
25.
418
.220
1948
7,48
828
1,28
192
,623
38,9
9974
,586
57.7
19.0
8.0
15.3
397,
317
272,
162
27,4
1522
,250
75,4
9068
.56.
95.
619
.020
2049
8,00
028
2,86
494
,122
41,8
3279
,182
56.8
18.9
8.4
15.9
408,
000
275,
808
27,7
4424
,480
79,9
6867
.66.
86.
019
.6
Vol.:(0123456789)
Discover Energy (2021) 1:2 | https://doi.org/10.1007/s43937-021-00002-6 Research
1 3
to decrease, the Chinese government has encouraged low-carbon lifestyles. Therefore, to reduce their environmental impact, customers are increasingly concerned about the effects of automotive emissions on air quality.
3.1.4 Technological factors
Access to new energy technologies (Opportunity) Advancements in energy science and technology are multifaceted. New energy technologies, such as electric vehicles and automatic drive, result from technological innovation, which will advance and accommodate the standards of performance accepted by the customers. In China, these new energy tech-nologies are bringing an opportunity for industrial upgrade.
Trend of electrifying transportation (opportunity) At present, petrol and diesel vehicles are more economical for custom-ers than electric ones. By the end of 2020, the number of electric vehicles in China was 4.92 million, with a total 23GWh of retired power batteries. Furthermore, a future alternative to almost all public vehicles may be electric transportation.
R&D on energy technologies (Weakness) China’s weak innovative processes resulted from a lack of innovation and creativity in education. In fact, with the accretion of renewables, supply chain security of renewable energy facilities has taken on a new connotation. For example, a high cost of imports (e.g., wind power converter, main rotor bearing, gearbox bearing) contributes to the high price of wind power equipment in China. This situation will decrease the self-sufficiency of the renewable-energy economy. Thus, China should invest more R&D funds to accomplish breakthroughs in key energy technologies.
Smart power technology incentives (Opportunity) Electricity is moving to the heart of modern energy security because of the cost reductions of renewable energy. In addition, the reduction of carbon emissions requires harnessing the potential of the digital energy economy. Advances in digital technologies are opening up amazing opportunities for energy transition. The data on energy development, production, and appliances are shared in a “cloud” base to achieve the aggregation and affiliation of energy flow, information flow and capital flow, resulting in enhancing the predictability and accuracy of energy security.
Fig. 3 Analysis of China’s fiscal deficits from 2008 to 2019
-500.00%-400.00%-300.00%-200.00%-100.00%0.00%100.00%200.00%300.00%400.00%500.00%600.00%
-20000
-10000
0
10000
20000
30000
40000
50000
60000
2008 2009 2010 2011 2012 2013 2014 2015 2016 2017 2018 2019
Gro
wth
rate
(%)
)noillim 001¥( ticifed lacsif latoT
Total fiscal deficit (¥100 million) Growth rate (%)
Fig. 4 Analysis of China’s net foreign exchange reserves from 2008 to 2019
5.6
5.8
6
6.2
6.4
6.6
6.8
7
7.2
0
5000
10000
15000
20000
25000
30000
35000
2008 2009 2010 2011 2012 2013 2014 2015 2016 2017 2018 2019
Perio
d-en
d ex
chan
ge ra
te
001$(sevreseregnahcxe
ngierofteN
mill
ion)
Net foreign exchange reserves ($100 million) Period-end exchange rate(RMB/USD)
Vol:.(1234567890)
Research Discover Energy (2021) 1:2 | https://doi.org/10.1007/s43937-021-00002-6
1 3
3.1.5 Environmental factors
Environmental pollution (Threat) In many cities of China, emissions from factories and automobiles frequently cause toxic smog that lasts for days or weeks. Smog has blanketed more than a quarter of China’s territory, leaving most cities with a hazy sky. In addition, other pollutions such as oil and waste flows into the seas are poisonous to marine organism. In this case, China must take more initiatives to reduce carbon emission and protect environment for future generations.
Climate change and sustainability (Threat) Because of high variability in energy supply, sustainable development is the cornerstone of energy security issues. China’s official media and press need to promote social education and increase public awareness on environmental sustainability.
3.1.6 Legal Factors
National and municipal commitments (Strength) The government and its policy commitments play an essential role in the development of renewable energy. City-level renewable energy policies have expanded beyond the national level. To achieve carbon neutrality, China has drafted the 14th Five-Year Plan, which will have a profound impact on the future energy transition based on these national and municipal commitments.
Lack of renewable energy patents (Weakness) Patent, intellectual property and trademark protection are becoming more important in China but also cause more legal issues. Globally, US companies still hold the most patents on renew-able energy technologies. Through various licensing agreements with foreign counterparts, Chinese energy companies would be facing their patent disadvantages.
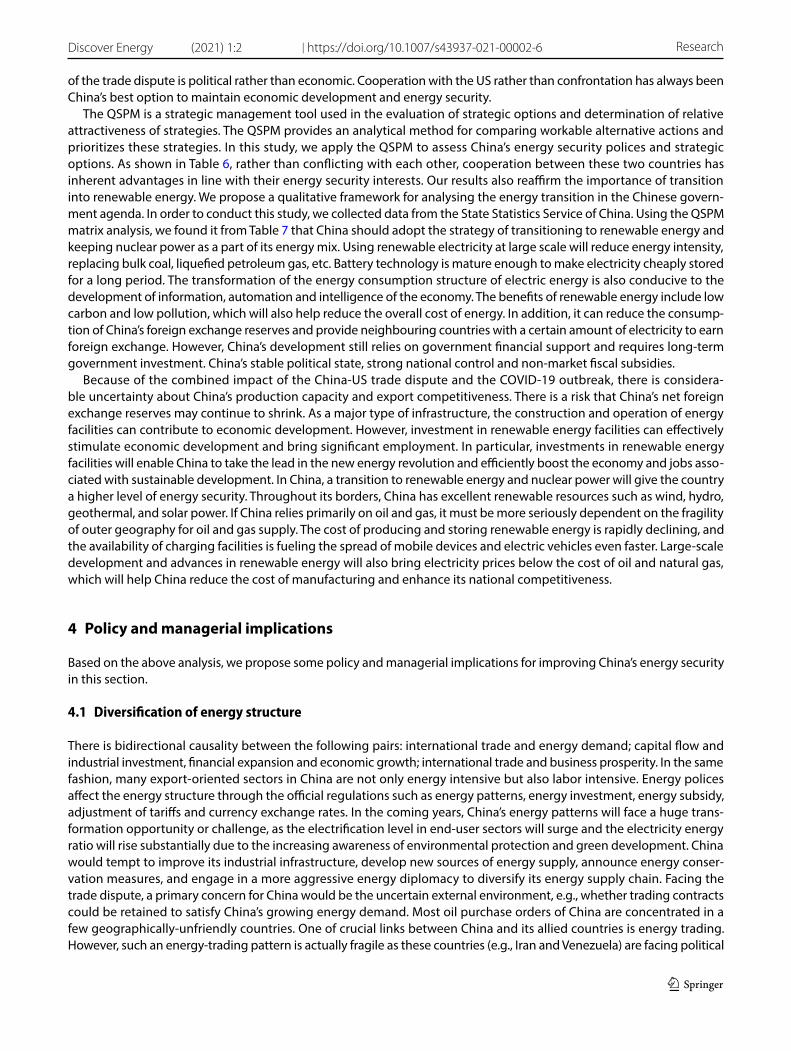
In conclusion, a SWOT analysis of China’s energy security factors is summarised in Table 5.
3.2 Game analysis and QSPM
This section aims to determine the preferable energy security strategy during the trade dispute, by conducting a bipartite game reciprocity model and a QSPM (Quantitative Strategic Planning Matrix) analysis. This game analysis model helps us analyze the consequent evolution of contradictions from China’s national energy structure, achieving a coherent comparison of strategic interactions between China and the US. Apparently, the avoidance of strictly dominated strate-gies of remaining a present energy pattern, which is a minimum requirement of economic rationality. The best energy security strategy for China is to maintain strategic cooperation with the US. However, adopting a cooperative strategy with the US would cause China’s other security outcomes. In fact, the so-called “US fear” about its declining hegemony and China’s rapid rise as a big challenger is driving a US-launched trade dispute with China. Indeed, the underlying cause
Table 5 A SWOT analysis of China’s energy security factors
Support Oppose
Internal Strength WeaknessStability of political system Level of bureaucracyFiscal and financial incentives Disposable income of consumersGovernmental regulation Mass unemploymentEconomic growth recovers Government budget deficits and
foreign exchange reservesMarkets of alternative energy vehicles R&D on energy technologiesNational and municipal commitments Lack of renewable energy patents
External Opportunity ThreatGlobal energy economic transition Foreign policyRenewable-energy cost reduction Geopolitical relationsBattery technology advancement Trade policyAttitudes towards carbon emissions Shortage of battery metalsEnergy technological change Inflation rates and property bubbleAccess to new energy technology Manufacturing industry outflowsTrend of electrifying transportation Environmental pollutionSmart power technology incentives Climate changes and sustainability
Vol.:(0123456789)
Discover Energy (2021) 1:2 | https://doi.org/10.1007/s43937-021-00002-6 Research
1 3
of the trade dispute is political rather than economic. Cooperation with the US rather than confrontation has always been China’s best option to maintain economic development and energy security.
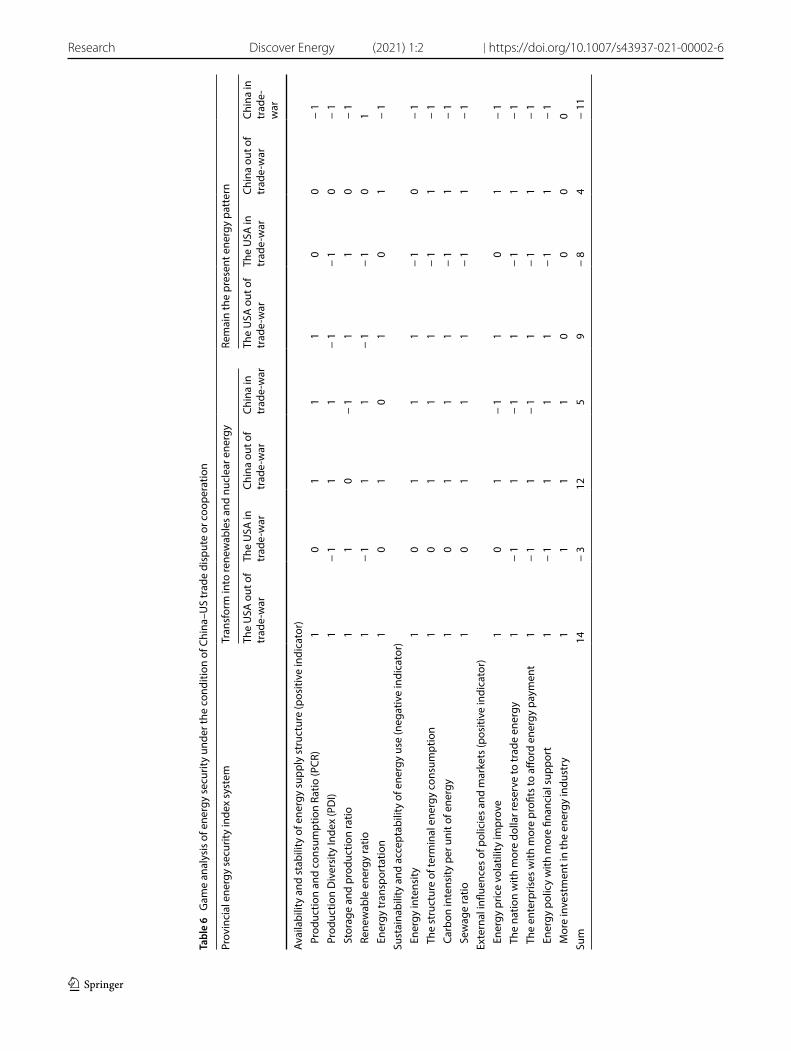
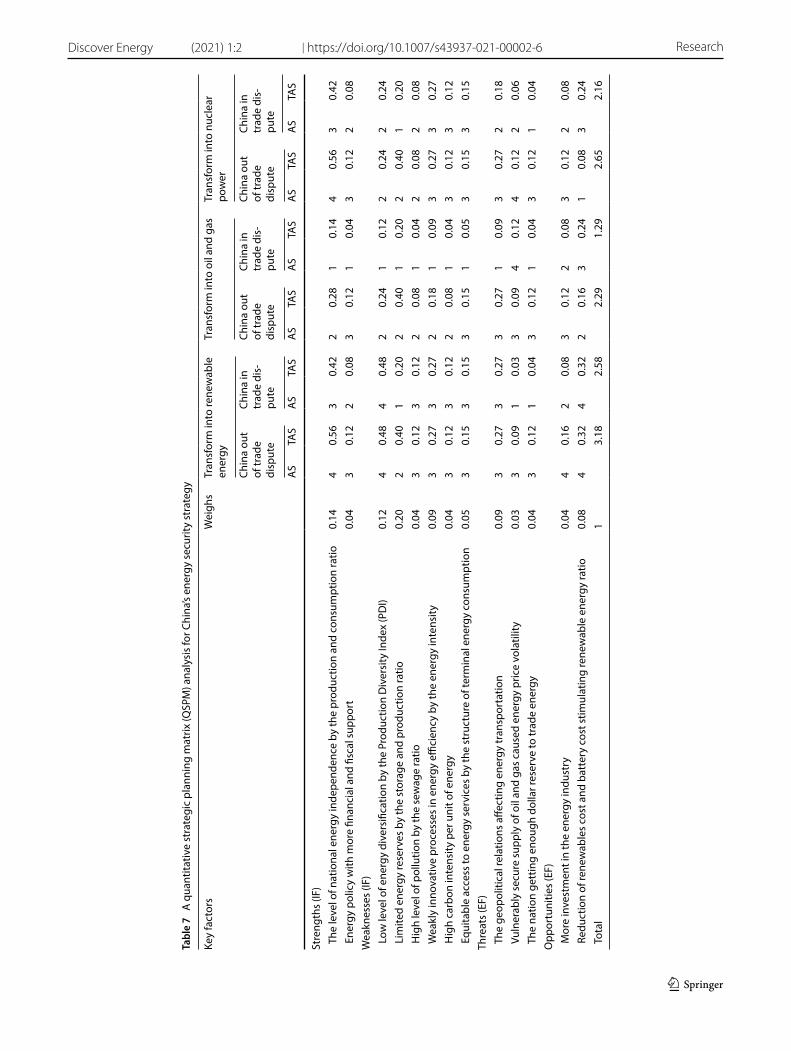
The QSPM is a strategic management tool used in the evaluation of strategic options and determination of relative attractiveness of strategies. The QSPM provides an analytical method for comparing workable alternative actions and prioritizes these strategies. In this study, we apply the QSPM to assess China’s energy security polices and strategic options. As shown in Table 6, rather than conflicting with each other, cooperation between these two countries has inherent advantages in line with their energy security interests. Our results also reaffirm the importance of transition into renewable energy. We propose a qualitative framework for analysing the energy transition in the Chinese govern-ment agenda. In order to conduct this study, we collected data from the State Statistics Service of China. Using the QSPM matrix analysis, we found it from Table 7 that China should adopt the strategy of transitioning to renewable energy and keeping nuclear power as a part of its energy mix. Using renewable electricity at large scale will reduce energy intensity, replacing bulk coal, liquefied petroleum gas, etc. Battery technology is mature enough to make electricity cheaply stored for a long period. The transformation of the energy consumption structure of electric energy is also conducive to the development of information, automation and intelligence of the economy. The benefits of renewable energy include low carbon and low pollution, which will also help reduce the overall cost of energy. In addition, it can reduce the consump-tion of China’s foreign exchange reserves and provide neighbouring countries with a certain amount of electricity to earn foreign exchange. However, China’s development still relies on government financial support and requires long-term government investment. China’s stable political state, strong national control and non-market fiscal subsidies.
Because of the combined impact of the China-US trade dispute and the COVID-19 outbreak, there is considera-ble uncertainty about China’s production capacity and export competitiveness. There is a risk that China’s net foreign exchange reserves may continue to shrink. As a major type of infrastructure, the construction and operation of energy facilities can contribute to economic development. However, investment in renewable energy facilities can effectively stimulate economic development and bring significant employment. In particular, investments in renewable energy facilities will enable China to take the lead in the new energy revolution and efficiently boost the economy and jobs asso-ciated with sustainable development. In China, a transition to renewable energy and nuclear power will give the country a higher level of energy security. Throughout its borders, China has excellent renewable resources such as wind, hydro, geothermal, and solar power. If China relies primarily on oil and gas, it must be more seriously dependent on the fragility of outer geography for oil and gas supply. The cost of producing and storing renewable energy is rapidly declining, and the availability of charging facilities is fueling the spread of mobile devices and electric vehicles even faster. Large-scale development and advances in renewable energy will also bring electricity prices below the cost of oil and natural gas, which will help China reduce the cost of manufacturing and enhance its national competitiveness.
4 Policy and managerial implications
Based on the above analysis, we propose some policy and managerial implications for improving China’s energy security in this section.
4.1 Diversification of energy structure
There is bidirectional causality between the following pairs: international trade and energy demand; capital flow and industrial investment, financial expansion and economic growth; international trade and business prosperity. In the same fashion, many export-oriented sectors in China are not only energy intensive but also labor intensive. Energy polices affect the energy structure through the official regulations such as energy patterns, energy investment, energy subsidy, adjustment of tariffs and currency exchange rates. In the coming years, China’s energy patterns will face a huge trans-formation opportunity or challenge, as the electrification level in end-user sectors will surge and the electricity energy ratio will rise substantially due to the increasing awareness of environmental protection and green development. China would tempt to improve its industrial infrastructure, develop new sources of energy supply, announce energy conser-vation measures, and engage in a more aggressive energy diplomacy to diversify its energy supply chain. Facing the trade dispute, a primary concern for China would be the uncertain external environment, e.g., whether trading contracts could be retained to satisfy China’s growing energy demand. Most oil purchase orders of China are concentrated in a few geographically-unfriendly countries. One of crucial links between China and its allied countries is energy trading. However, such an energy-trading pattern is actually fragile as these countries (e.g., Iran and Venezuela) are facing political
Vol:.(1234567890)
Research Discover Energy (2021) 1:2 | https://doi.org/10.1007/s43937-021-00002-6
1 3
Tabl
e 6
Gam
e an
alys
is o
f ene
rgy
secu
rity
unde
r the
con
ditio
n of
Chi
na–U
S tr
ade
disp
ute
or c
oope
ratio
n
Prov
inci
al e
nerg
y se
curit
y in
dex
syst
emTr
ansf
orm
into
rene
wab
les
and
nucl
ear e
nerg
yRe
mai
n th
e pr
esen
t ene
rgy
patt
ern
The
USA
out
of
trad
e-w
arTh
e U
SA in
tr
ade-
war
Chin
a ou
t of
trad
e-w
arCh
ina
in
trad
e-w
arTh
e U
SA o
ut o
f tr
ade-
war
The
USA
in
trad
e-w
arCh
ina
out o
f tr
ade-
war
Chin
a in
tr
ade-
war
Avai
labi
lity
and
stab
ility
of e
nerg
y su
pply
str
uctu
re (p
ositi
ve in
dica
tor)
Pro
duct
ion
and
cons
umpt
ion
Ratio
(PCR
)1
01
11
00
− 1
Pro
duct
ion
Div
ersi
ty In
dex
(PD
I)1
− 1
11
− 1
− 1
0−
1 S
tora
ge a
nd p
rodu
ctio
n ra
tio1
10
− 1
11
0−
1 R
enew
able
ene
rgy
ratio
1−
11
1−
1−
10
1 E
nerg
y tr
ansp
orta
tion
10
10
10
1−
1Su
stai
nabi
lity
and
acce
ptab
ility
of e
nerg
y us
e (n
egat
ive
indi
cato
r) E
nerg
y in
tens
ity1
01
11
− 1
0−
1 T
he s
truc
ture
of t
erm
inal
ene
rgy
cons
umpt
ion
10
11
1−
11
− 1
Car
bon
inte
nsity
per
uni
t of e
nerg
y1
01
11
− 1
1−
1 S
ewag
e ra
tio1
01
11
− 1
1−
1Ex
tern
al in
fluen
ces
of p
olic
ies
and
mar
kets
(pos
itive
indi
cato
r) E
nerg
y pr
ice
vola
tility
impr
ove
10
1−
11
01
− 1
The
nat
ion
with
mor
e do
llar r
eser
ve to
trad
e en
ergy
1−
11
− 1
1−
11
− 1
The
ent
erpr
ises
with
mor
e pr
ofits
to a
fford
ene
rgy
paym
ent
1−
11
− 1
1−
11
− 1
Ene
rgy
polic
y w
ith m
ore
finan
cial
sup
port
1−
11
11
− 1
1−
1 M
ore
inve
stm
ent i
n th
e en
ergy
indu
stry
11
11
00
00
Sum
14−
312
59
− 8
4−
11
Vol.:(0123456789)
Discover Energy (2021) 1:2 | https://doi.org/10.1007/s43937-021-00002-6 Research
1 3
Tabl
e 7
A q
uant
itativ
e st
rate
gic
plan
ning
mat
rix (Q
SPM
) ana
lysi
s fo
r Chi
na’s
ener
gy s
ecur
ity s
trat
egy
Key
fact
ors
Wei
ghs
Tran
sfor
m in
to re
new
able
en
ergy
Tran
sfor
m in
to o
il an
d ga
sTr
ansf
orm
into
nuc
lear
po
wer
Chin
a ou
t of
trad
e di
sput
e
Chin
a in
tr
ade
dis-
pute
Chin
a ou
t of
trad
e di
sput
e
Chin
a in
tr
ade
dis-
pute
Chin
a ou
t of
trad
e di
sput
e
Chin
a in
tr
ade
dis-
pute
AS
TAS
AS
TAS
AS
TAS
AS
TAS
AS
TAS
AS
TAS
Stre
ngth
s (IF
) T
he le
vel o
f nat
iona
l ene
rgy
inde
pend
ence
by
the
prod
uctio
n an
d co
nsum
ptio
n ra
tio0.
144
0.56
30.
422
0.28
10.
144
0.56
30.
42 E
nerg
y po
licy
with
mor
e fin
anci
al a
nd fi
scal
sup
port
0.04
30.
122
0.08
30.
121
0.04
30.
122
0.08
Wea
knes
ses
(IF)
Low
leve
l of e
nerg
y di
vers
ifica
tion
by th
e Pr
oduc
tion
Div
ersi
ty In
dex
(PD
I)0.
124
0.48
40.
482
0.24
10.
122
0.24
20.
24 L
imite
d en
ergy
rese
rves
by
the
stor
age
and
prod
uctio
n ra
tio0.
202
0.40
10.
202
0.40
10.
202
0.40
10.
20 H
igh
leve
l of p
ollu
tion
by th
e se
wag
e ra
tio0.
043
0.12
30.
122
0.08
10.
042
0.08
20.
08 W
eakl
y in
nova
tive
proc
esse
s in
ene
rgy
effici
ency
by
the
ener
gy in
tens
ity0.
093
0.27
30.
272
0.18
10.
093
0.27
30.
27 H
igh
carb
on in
tens
ity p
er u
nit o
f ene
rgy
0.04
30.
123
0.12
20.
081
0.04
30.
123
0.12
Equ
itabl
e ac
cess
to e
nerg
y se
rvic
es b
y th
e st
ruct
ure
of te
rmin
al e
nerg
y co
nsum
ptio
n0.
053
0.15
30.
153
0.15
10.
053
0.15
30.
15Th
reat
s (E
F) T
he g
eopo
litic
al re
latio
ns a
ffect
ing
ener
gy tr
ansp
orta
tion
0.09
30.
273
0.27
30.
271
0.09
30.
272
0.18
Vul
nera
bly
secu
re s
uppl
y of
oil
and
gas
caus
ed e
nerg
y pr
ice
vola
tility
0.03
30.
091
0.03
30.
094
0.12
40.
122
0.06
The
nat
ion
gett
ing
enou
gh d
olla
r res
erve
to tr
ade
ener
gy0.
043
0.12
10.
043
0.12
10.
043
0.12
10.
04O
ppor
tuni
ties
(EF)
Mor
e in
vest
men
t in
the
ener
gy in
dust
ry0.
044
0.16
20.
083
0.12
20.
083
0.12
20.
08 R
educ
tion
of re
new
able
s co
st a
nd b
atte
ry c
ost s
timul
atin
g re
new
able
ene
rgy
ratio
0.08
40.
324
0.32
20.
163
0.24
10.
083
0.24
Tota
l1
3.18
2.58
2.29
1.29
2.65
2.16
Vol:.(1234567890)
Research Discover Energy (2021) 1:2 | https://doi.org/10.1007/s43937-021-00002-6
1 3
and economic instability because of trade and financial sanctions from the USA. It is of great significance for China’s manufacturing industry to maintain energy-trading contracts with these oil-producing countries. One main purpose of the well-known “One-Belt and One-Road” initiative is to strengthen cooperation with energy-rich nations (e.g., Central Asia such as Kazakhstan and the Middle East countries such as Iran), mainly for establishing a more secure and more sustainable overland/oceanic energy supply chain network.
4.2 Exploitation of other energy sources
China’s tremendous domestic market provides sufficient motives for transformation of energy patterns. The Gulf countries possess 65 per cent of the world’s crude oil reserves. In comparison, China lacks enough reserves of crude oil and natural gas to satisfy its energy demand and sustain its economic development. China’s shale gas technology is developing but is still fallen behind due to its inefficient energy patterns. Moreover, over three-fifths of shale oil and gas resources locate in water-deficient areas and seismic zones. With the vulnerable dependence on foreign oil and gas, China’s confidence of energy self-sufficiency heavily relies on coal mining resources, as the widely-distributed coal mineral deposits and accessible railway networks can facilitate production and transportation of coal. In addition to coal energy, hydro-power, solar-power and nuclear-power plants will form the backbone of China’s energy security in the future. In comparison to the hydro-power capacity that has reached a limit, there is more room for the growth of solar-power and nuclear-power plants. At present, China is one of the largest nuclear-power-user countries and contributes to around three quarters of the total global growth of nuclear-power generation. In the long-term cooperation with vendors of nuclear technology such as Areva and Westinghouse that are respectively French and American multinational companies specializing in nuclear power, Chinese engineers have mastered the safer and lower-cost technology for construction of new nuclear-power plants. At the same time, China’s state-holding enterprises have invested in uranium-rich countries such as Namibia to hold several large-scale uranium mines. However, nuclear waste disposal and nuclear leakage by accident are the potential hazards that must be seriously measured in China’s current energy pattern transformation. To meet the energy demands, more efforts should be made to transform national energy patterns.
4.3 Increase of natural gas supply
Since 2008, China’s economy was overheated mainly owing to the so-called “4 trillion Infrastructure Investment Plan”. As a result, the total amount of domestic energy supplies was unable to meet the actual energy demand. China had to purchase more crude oil, natural gas and coal from the international energy market. One of main driving forces of inter-national oil price comes from the fast-growing energy demand of China. As shown in Table 3, more than $280 billion US dollars was consumed for buying oil, gas and coal per year on average from 2013 to 2015. At the same time, coal mining investment continuously declined in 5 years from 2013 to 2017. In contrast, the sharp increase of natural gas demand in China pushed the rise in the supply of global natural gas. There was a shortage of natural gas even in port cities such as Shanghai due to the limitation of shipment capacity so that no excess natural gas can be shared with and transported to inland cities. The production capacity of natural gas in the western cities of China is still so low that the amount of gas transmitted to the middle and the eastern cities of China is insufficient to meet the demand. Due to the regulation of environmental protection, many factories were closed down for stopping the use of coal-fired boilers since 2015. In some cities, residents can only consume natural gas instead of coal to meet their daily energy needs such as cooking or heating. In this case, it is nearly impossible for China to ensure energy self-sufficiency and has to rely on the international energy market to fulfil energy gaps, especially for natural gas. If the capability of earning foreign exchanges through exports is abated, the imbalance between insufficient gas supply and growing energy demand would create an ongoing threat to China’s energy security, environmental protection, economic development and social welfare.
4.4 Energy infrastructure upgrade for manufacturing industry
In the context of the trade dispute, China should enhance crisis consciousness because the possible shortage of energy imports will result in a serious energy crisis. As China’s export-oriented manufacturing industry is sensitive to the energy price, the rise in energy cost will weaken its competitiveness, reduce its export capacity and squeeze its international market share. Therefore, it is essential for China to find the feasible solution to guarantee security and sustainability of energy supply. China should maintain reasonable diplomatic relations with major energy suppliers. China makes the competition with some rival developing countries (e.g., Mexico, India, Vietnam, Indonesia and Brazil) in the low-end
Vol.:(0123456789)
Discover Energy (2021) 1:2 | https://doi.org/10.1007/s43937-021-00002-6 Research
1 3
manufacturing industry. Insufficient energy supply will increase the manufacturing cost and then lead to disruption of the overall supply chain. The expansion of the manufacturing industry is always followed by the inflow of capital, employment and urbanization in China and these rival developing countries, which will boost the energy needs rapidly. Due to tariff sanctions by the USA, a large number of labor-intensive manufacturing enterprises have already moved or are moving to burgeoning resource-rich Asian countries such as India, Vietnam, Indonesia and Burma. India has a larger population of young labors in comparison to China and is accelerating the improvement of industrial infrastructure in order to replace China as the next world factory. If the trade dispute is continuing, China would undercut its industrial competitiveness and lose the title of “World Factory” presumably. To face these challenges, the national energy infrastructure such as the coal/gas supply chain networks, smart high-voltage power grid system and public charging facilities should be upgraded and supported by more national energy funds.
4.5 Advancement of electrical power system
Due to the high variability in supplies, sustainability is the cornerstone of future energy security issues. It is estimated that the energy source of almost all public transportation vehicles will come from electrical power. A digital internet-of-things (IOTs) economy will connect nearly all consumers’ devices and appliances. To achieve this aim for China, it will require more reforms to improve the overall energy patterns, more investments to upgrade national electricity grid systems, more promotion to advance battery storage and charging technologies. In China, the power sector accounts for the most important proportion of the total energy investment. The power network is foreseeable to serve the digital economy and the smart economy in the near future, especially the ultra-fast storage and instant charging network of various smart devices. However, the switch from the classical petroleum energy system to the new electricity energy system still needs enormous investment, practically for advancing technological innovations (e.g., electric-power vehicles, autonomous trucks, driverless metros, fabrication robots, next-generation mobile communication systems) as well as management progression (e.g., big-data-driven AI and optimization software).
4.6 Integration with global energy market
In the trade dispute, the restriction of energy imports would result in the decline of energy demand for China. The increase in tariffs and the stricter customs clearance significantly increase the risk of production halts and foreign trade contract breaches. It has forced a large number of factories to move from China to non-tariff or low-tariff countries such as Vietnam. As a result, China’s manufacturing industry will lose its horsepower and slide into the contraction of energy demands, industrial investment and employment. As indicated in Tables 3, 4, the statistical data show that there is a significant impact of the trade dispute on both China’s industrial input and output since 2018. The transfer of the sup-ply chain will be accompanied by the transfer of energy demand. Because of the trade dispute, China’s labor-intensive export enterprises have been transferred to some neighboring countries (e.g., India, Vietnam and Burma) without tariff barriers. At the same time, the demand for transportation tools will be decreased, resulting in a sharp decline of sales in the automotive industry which is the largest industrial sector in China. The income of residents is closely related to energy consumption, and the energy demand of industrial population is greater than that of agricultural population. Consequently, the climbing of China’s unemployment rate caused will further lead to a decline in resident income and energy demand. The unemployed workers, who have registered in rural areas with no adequate social security in the cities, will have to return to the countryside with less energy demand. These chain-effect factors will lead to a significant decline of energy demand in the coming years. To face the potential crisis, Chinese energy companies should actively penetrate the global energy market and become a major member of the energy supply chain, e.g., procuring some reli-able offshore energy companies with indirect holdings or multi-layer holdings.
4.7 Establishment of a new energy trading platform
The trading platform for renewable energy suppliers represents a great opportunity for China. Currently, China’s inter-national energy trade depends on the US dollar as a major settlement currency. China has an unavoidable dollar reserve to guarantee the security of energy trade. Because the US dollar is a dominant trading currency for oil, this petrol-dollar recycling has brought significant energy transaction costs to China. Thus, China should distribute energy trading risks across multiple currency types with financial instruments to hedge certain currency exposures. Despite Iran’s institutional isolation, Iran agreed to settle the oil trade in RMB, including China’s latest digital currency. This could protect China
Vol:.(1234567890)
Research Discover Energy (2021) 1:2 | https://doi.org/10.1007/s43937-021-00002-6
1 3
from devaluing the US dollar by using RMB to pay oil suppliers. Leverage decentralization and powerful encryption of block-chain technology can improve energy security and resilience. By unifying energy trading standards, China should consider to build a novel and interconnected energy trading platform with the use of multiple currency types.
5 Conclusion and suggestion
In summary, this study focuses on how to protect China’s energy security in the wake of the recent China-US trade dis-pute and the COVID-19 pandemic. As China’s merchandise surplus and international trade have decreased since 2018, its foreign exchange reserves for energy trade will be insufficient. In China, an energy shortage will lead to higher prices and even a crisis if energy imports appear to dry up. Because China’s export-driven manufacturing industry is sensitive to energy prices, rising energy costs will raise manufacturing costs and weaken its competitiveness. China’s energy requirements will decrease; however, its energy supply vulnerability will increase. In addition, the long-term trade dispute would lead to a serious decline in China’s total external trade, reduced trade surplus and pressure on energy imports. As a result, overdue loans, real estate collapses, a food crisis and an energy crisis would occur because of the trade dispute and COVID-19 pandemic. To face these challenges, China should actively adopt a less externally dependent energy policy to ensure the security and sustainability of energy supply and maintain reasonable diplomatic relationships with major energy suppliers. Based on these, we recommend the following measures.
I. Construct cleaner power generation systems to meet environmental protection and emission requirements. China should increase investments in product innovation in renewable energy production systems to meet environ-mental and emissions requirements. Its transition to “carbon neutrality” calls for a comprehensive and systemic transformation of the economy. The promotion of the use of natural gas, solar, wind and other low-carbon power plants with the help of government rebates and subsidies is conducive to reducing energy supply risks.
II. Speed up advances in shale gas and oil technology with better use of China’s abundant coal gas resources. Devel-oping shale gas and oil will be of significant benefits to China in the regions of the South China Sea, the East China Sea, the Sichuan Basin, and the Tarim Basin. Basically, China wants to make sure domestic pipelines are within its dominant application scope. China should speed up the development of unconventional natural gas technology, including downhole water separation, hydrogen sulphide removal, and deep-water robots.
III. Sponsor renewable energy vehicles and relevant energy-efficient and energy-cleaner technology. The completely electric vehicles, represented by Tesla, have expanded on family cars and freight trucks, covering a complete category of automobiles. Transport and charging networks for electric vehicles, as well as energy storage facili-ties with ultra-fast storage and instant charging devices, would become the standard energy infrastructure. The breakthrough of new energy storage technologies like the graphene battery and the ultra-capacitor will speed up the process.
IV. Update energy transactions and regulations through block-chain digital currency. Shortly, China will have to establish virtual currency and digital wallets at the national level. Some of China’s foreign exchange reserves and exported-oriented industrial capitals may be used as the endorsement for virtual currency for energy transactions and settlements. Eventually, the aim is to establish a faster, safer, and more distributed energy trading financial system, jumping out of the cycle of the “Dollar-Oil” financial system. These new decentralized energy deals and agreements are essential to China’s future energy security.
V. Engage in more aggressive energy diplomacy. China should continue to seek strategic energy partners as new suppliers via the “One-belt One-road” initiative, by increasing its investment in Russia, Central Asian countries (e.g., Kazakhstan), Middle Eastern countries (e.g., Iran, Iraq, UAE and Saudi Arabia) and South American countries (e.g., Brazil) to enhance its economic outlook and energy security. To develop a safer and more sustainable energy supply network, China should continuously provide financial aid and business cooperation in these resource-rich countries.
Regarding future research directions, we will extend this work to consider the iron ore supply chain, especially using the public data of the Australian mining industry [57]. Besides, we will implement operations research (i.e., Mixed Inte-ger Programming), machine learning and game theory techniques as analytical tools to deal with quantitative energy security management problems [58–61].
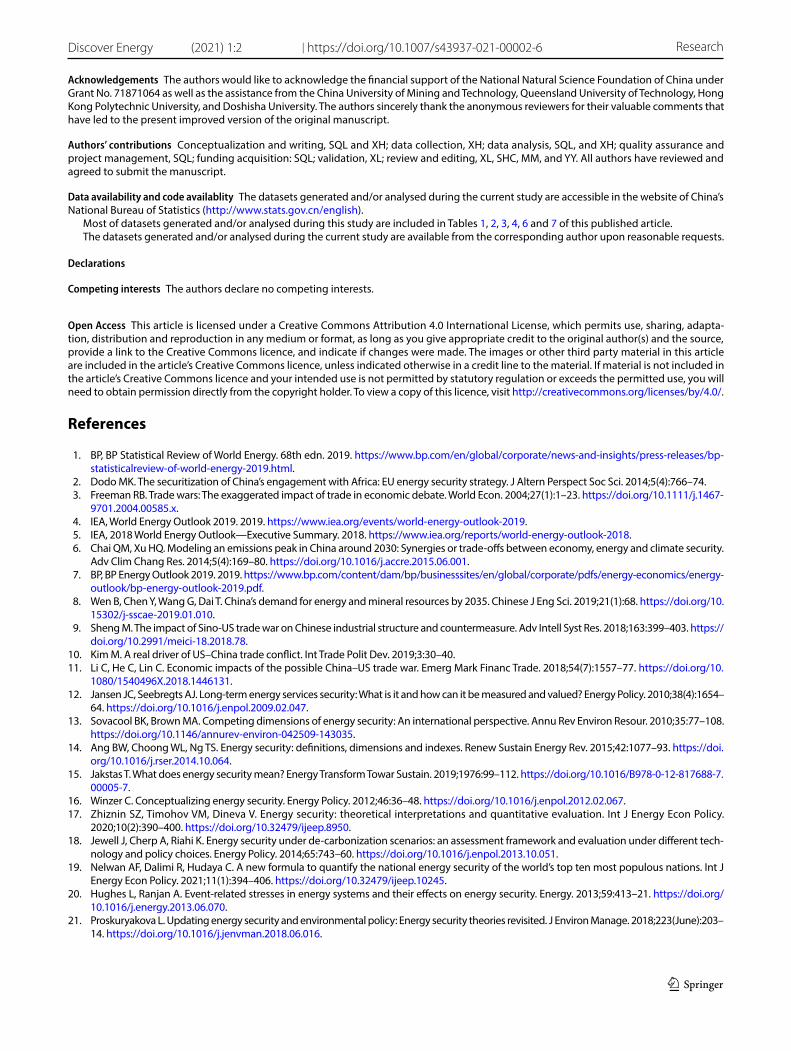
Vol.:(0123456789)
Discover Energy (2021) 1:2 | https://doi.org/10.1007/s43937-021-00002-6 Research
1 3
Acknowledgements The authors would like to acknowledge the financial support of the National Natural Science Foundation of China under Grant No. 71871064 as well as the assistance from the China University of Mining and Technology, Queensland University of Technology, Hong Kong Polytechnic University, and Doshisha University. The authors sincerely thank the anonymous reviewers for their valuable comments that have led to the present improved version of the original manuscript.
Authors’ contributions Conceptualization and writing, SQL and XH; data collection, XH; data analysis, SQL, and XH; quality assurance and project management, SQL; funding acquisition: SQL; validation, XL; review and editing, XL, SHC, MM, and YY. All authors have reviewed and agreed to submit the manuscript.
Data availability and code availablity The datasets generated and/or analysed during the current study are accessible in the website of China’s National Bureau of Statistics (http:// www. stats. gov. cn/ engli sh).
Most of datasets generated and/or analysed during this study are included in Tables 1, 2, 3, 4, 6 and 7 of this published article.The datasets generated and/or analysed during the current study are available from the corresponding author upon reasonable requests.
Declarations
Competing interests The authors declare no competing interests.
Open Access This article is licensed under a Creative Commons Attribution 4.0 International License, which permits use, sharing, adapta-tion, distribution and reproduction in any medium or format, as long as you give appropriate credit to the original author(s) and the source, provide a link to the Creative Commons licence, and indicate if changes were made. The images or other third party material in this article are included in the article’s Creative Commons licence, unless indicated otherwise in a credit line to the material. If material is not included in the article’s Creative Commons licence and your intended use is not permitted by statutory regulation or exceeds the permitted use, you will need to obtain permission directly from the copyright holder. To view a copy of this licence, visit http:// creat iveco mmons. org/ licen ses/ by/4. 0/.
References
1. BP, BP Statistical Review of World Energy. 68th edn. 2019. https:// www. bp. com/ en/ global/ corpo rate/ news- and- insig hts/ press- relea ses/ bp- stati stica lrevi ew- of- world- energy- 2019. html.
2. Dodo MK. The securitization of China’s engagement with Africa: EU energy security strategy. J Altern Perspect Soc Sci. 2014;5(4):766–74. 3. Freeman RB. Trade wars: The exaggerated impact of trade in economic debate. World Econ. 2004;27(1):1–23. https:// doi. org/ 10. 1111/j. 1467-
9701. 2004. 00585.x. 4. IEA, World Energy Outlook 2019. 2019. https:// www. iea. org/ events/ world- energy- outlo ok- 2019. 5. IEA, 2018 World Energy Outlook—Executive Summary. 2018. https:// www. iea. org/ repor ts/ world- energy- outlo ok- 2018. 6. Chai QM, Xu HQ. Modeling an emissions peak in China around 2030: Synergies or trade-offs between economy, energy and climate security.
Adv Clim Chang Res. 2014;5(4):169–80. https:// doi. org/ 10. 1016/j. accre. 2015. 06. 001. 7. BP, BP Energy Outlook 2019. 2019. https:// www. bp. com/ conte nt/ dam/ bp/ busin esssi tes/ en/ global/ corpo rate/ pdfs/ energy- econo mics/ energy-
outlo ok/ bp- energy- outlo ok- 2019. pdf. 8. Wen B, Chen Y, Wang G, Dai T. China’s demand for energy and mineral resources by 2035. Chinese J Eng Sci. 2019;21(1):68. https:// doi. org/ 10.
15302/j- sscae- 2019. 01. 010. 9. Sheng M. The impact of Sino-US trade war on Chinese industrial structure and countermeasure. Adv Intell Syst Res. 2018;163:399–403. https://
doi. org/ 10. 2991/ meici- 18. 2018. 78. 10. Kim M. A real driver of US–China trade conflict. Int Trade Polit Dev. 2019;3:30–40. 11. Li C, He C, Lin C. Economic impacts of the possible China–US trade war. Emerg Mark Financ Trade. 2018;54(7):1557–77. https:// doi. org/ 10.
1080/ 15404 96X. 2018. 14461 31. 12. Jansen JC, Seebregts AJ. Long-term energy services security: What is it and how can it be measured and valued? Energy Policy. 2010;38(4):1654–
64. https:// doi. org/ 10. 1016/j. enpol. 2009. 02. 047. 13. Sovacool BK, Brown MA. Competing dimensions of energy security: An international perspective. Annu Rev Environ Resour. 2010;35:77–108.
https:// doi. org/ 10. 1146/ annur ev- envir on- 042509- 143035. 14. Ang BW, Choong WL, Ng TS. Energy security: definitions, dimensions and indexes. Renew Sustain Energy Rev. 2015;42:1077–93. https:// doi.
org/ 10. 1016/j. rser. 2014. 10. 064. 15. Jakstas T. What does energy security mean? Energy Transform Towar Sustain. 2019;1976:99–112. https:// doi. org/ 10. 1016/ B978-0- 12- 817688- 7.
00005-7. 16. Winzer C. Conceptualizing energy security. Energy Policy. 2012;46:36–48. https:// doi. org/ 10. 1016/j. enpol. 2012. 02. 067. 17. Zhiznin SZ, Timohov VM, Dineva V. Energy security: theoretical interpretations and quantitative evaluation. Int J Energy Econ Policy.
2020;10(2):390–400. https:// doi. org/ 10. 32479/ ijeep. 8950. 18. Jewell J, Cherp A, Riahi K. Energy security under de-carbonization scenarios: an assessment framework and evaluation under different tech-
nology and policy choices. Energy Policy. 2014;65:743–60. https:// doi. org/ 10. 1016/j. enpol. 2013. 10. 051. 19. Nelwan AF, Dalimi R, Hudaya C. A new formula to quantify the national energy security of the world’s top ten most populous nations. Int J
Energy Econ Policy. 2021;11(1):394–406. https:// doi. org/ 10. 32479/ ijeep. 10245. 20. Hughes L, Ranjan A. Event-related stresses in energy systems and their effects on energy security. Energy. 2013;59:413–21. https:// doi. org/
10. 1016/j. energy. 2013. 06. 070. 21. Proskuryakova L. Updating energy security and environmental policy: Energy security theories revisited. J Environ Manage. 2018;223(June):203–
14. https:// doi. org/ 10. 1016/j. jenvm an. 2018. 06. 016.
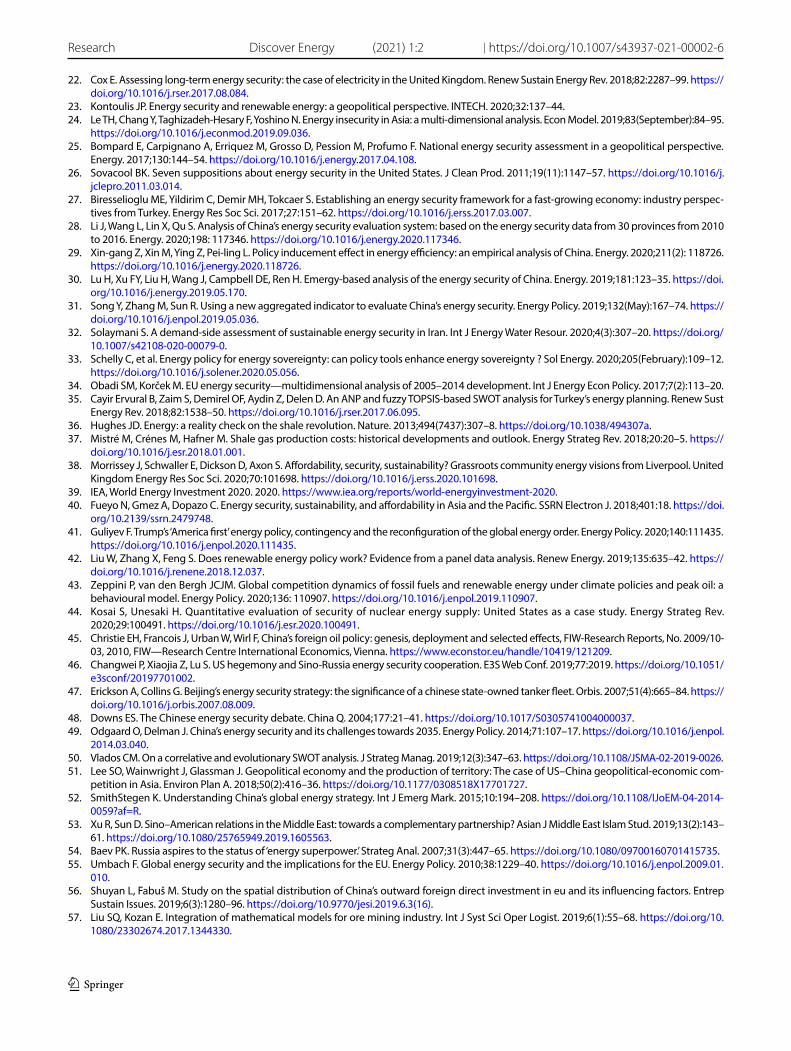
Vol:.(1234567890)
Research Discover Energy (2021) 1:2 | https://doi.org/10.1007/s43937-021-00002-6
1 3
22. Cox E. Assessing long-term energy security: the case of electricity in the United Kingdom. Renew Sustain Energy Rev. 2018;82:2287–99. https:// doi. org/ 10. 1016/j. rser. 2017. 08. 084.
23. Kontoulis JP. Energy security and renewable energy: a geopolitical perspective. INTECH. 2020;32:137–44. 24. Le TH, Chang Y, Taghizadeh-Hesary F, Yoshino N. Energy insecurity in Asia: a multi-dimensional analysis. Econ Model. 2019;83(September):84–95.
https:// doi. org/ 10. 1016/j. econm od. 2019. 09. 036. 25. Bompard E, Carpignano A, Erriquez M, Grosso D, Pession M, Profumo F. National energy security assessment in a geopolitical perspective.
Energy. 2017;130:144–54. https:// doi. org/ 10. 1016/j. energy. 2017. 04. 108. 26. Sovacool BK. Seven suppositions about energy security in the United States. J Clean Prod. 2011;19(11):1147–57. https:// doi. org/ 10. 1016/j.
jclep ro. 2011. 03. 014. 27. Biresselioglu ME, Yildirim C, Demir MH, Tokcaer S. Establishing an energy security framework for a fast-growing economy: industry perspec-
tives from Turkey. Energy Res Soc Sci. 2017;27:151–62. https:// doi. org/ 10. 1016/j. erss. 2017. 03. 007. 28. Li J, Wang L, Lin X, Qu S. Analysis of China’s energy security evaluation system: based on the energy security data from 30 provinces from 2010
to 2016. Energy. 2020;198: 117346. https:// doi. org/ 10. 1016/j. energy. 2020. 117346. 29. Xin-gang Z, Xin M, Ying Z, Pei-ling L. Policy inducement effect in energy efficiency: an empirical analysis of China. Energy. 2020;211(2): 118726.
https:// doi. org/ 10. 1016/j. energy. 2020. 118726. 30. Lu H, Xu FY, Liu H, Wang J, Campbell DE, Ren H. Emergy-based analysis of the energy security of China. Energy. 2019;181:123–35. https:// doi.
org/ 10. 1016/j. energy. 2019. 05. 170. 31. Song Y, Zhang M, Sun R. Using a new aggregated indicator to evaluate China’s energy security. Energy Policy. 2019;132(May):167–74. https://
doi. org/ 10. 1016/j. enpol. 2019. 05. 036. 32. Solaymani S. A demand-side assessment of sustainable energy security in Iran. Int J Energy Water Resour. 2020;4(3):307–20. https:// doi. org/
10. 1007/ s42108- 020- 00079-0. 33. Schelly C, et al. Energy policy for energy sovereignty: can policy tools enhance energy sovereignty ? Sol Energy. 2020;205(February):109–12.
https:// doi. org/ 10. 1016/j. solen er. 2020. 05. 056. 34. Obadi SM, Korček M. EU energy security—multidimensional analysis of 2005–2014 development. Int J Energy Econ Policy. 2017;7(2):113–20. 35. Cayir Ervural B, Zaim S, Demirel OF, Aydin Z, Delen D. An ANP and fuzzy TOPSIS-based SWOT analysis for Turkey’s energy planning. Renew Sust
Energy Rev. 2018;82:1538–50. https:// doi. org/ 10. 1016/j. rser. 2017. 06. 095. 36. Hughes JD. Energy: a reality check on the shale revolution. Nature. 2013;494(7437):307–8. https:// doi. org/ 10. 1038/ 49430 7a. 37. Mistré M, Crénes M, Hafner M. Shale gas production costs: historical developments and outlook. Energy Strateg Rev. 2018;20:20–5. https://
doi. org/ 10. 1016/j. esr. 2018. 01. 001. 38. Morrissey J, Schwaller E, Dickson D, Axon S. Affordability, security, sustainability? Grassroots community energy visions from Liverpool. United
Kingdom Energy Res Soc Sci. 2020;70:101698. https:// doi. org/ 10. 1016/j. erss. 2020. 101698. 39. IEA, World Energy Investment 2020. 2020. https:// www. iea. org/ repor ts/ world- energ yinve stment- 2020. 40. Fueyo N, Gmez A, Dopazo C. Energy security, sustainability, and affordability in Asia and the Pacific. SSRN Electron J. 2018;401:18. https:// doi.
org/ 10. 2139/ ssrn. 24797 48. 41. Guliyev F. Trump’s ‘America first’ energy policy, contingency and the reconfiguration of the global energy order. Energy Policy. 2020;140:111435.
https:// doi. org/ 10. 1016/j. enpol. 2020. 111435. 42. Liu W, Zhang X, Feng S. Does renewable energy policy work? Evidence from a panel data analysis. Renew Energy. 2019;135:635–42. https://
doi. org/ 10. 1016/j. renene. 2018. 12. 037. 43. Zeppini P, van den Bergh JCJM. Global competition dynamics of fossil fuels and renewable energy under climate policies and peak oil: a
behavioural model. Energy Policy. 2020;136: 110907. https:// doi. org/ 10. 1016/j. enpol. 2019. 110907. 44. Kosai S, Unesaki H. Quantitative evaluation of security of nuclear energy supply: United States as a case study. Energy Strateg Rev.
2020;29:100491. https:// doi. org/ 10. 1016/j. esr. 2020. 100491. 45. Christie EH, Francois J, Urban W, Wirl F, China’s foreign oil policy: genesis, deployment and selected effects, FIW-Research Reports, No. 2009/10-
03, 2010, FIW—Research Centre International Economics, Vienna. https:// www. econs tor. eu/ handle/ 10419/ 121209. 46. Changwei P, Xiaojia Z, Lu S. US hegemony and Sino-Russia energy security cooperation. E3S Web Conf. 2019;77:2019. https:// doi. org/ 10. 1051/
e3sco nf/ 20197 701002. 47. Erickson A, Collins G. Beijing’s energy security strategy: the significance of a chinese state-owned tanker fleet. Orbis. 2007;51(4):665–84. https://
doi. org/ 10. 1016/j. orbis. 2007. 08. 009. 48. Downs ES. The Chinese energy security debate. China Q. 2004;177:21–41. https:// doi. org/ 10. 1017/ S0305 74100 40000 37. 49. Odgaard O, Delman J. China’s energy security and its challenges towards 2035. Energy Policy. 2014;71:107–17. https:// doi. org/ 10. 1016/j. enpol.
2014. 03. 040. 50. Vlados CM. On a correlative and evolutionary SWOT analysis. J Strateg Manag. 2019;12(3):347–63. https:// doi. org/ 10. 1108/ JSMA- 02- 2019- 0026. 51. Lee SO, Wainwright J, Glassman J. Geopolitical economy and the production of territory: The case of US–China geopolitical-economic com-
petition in Asia. Environ Plan A. 2018;50(2):416–36. https:// doi. org/ 10. 1177/ 03085 18X17 701727. 52. SmithStegen K. Understanding China’s global energy strategy. Int J Emerg Mark. 2015;10:194–208. https:// doi. org/ 10. 1108/ IJoEM- 04- 2014-
0059? af=R. 53. Xu R, Sun D. Sino–American relations in the Middle East: towards a complementary partnership? Asian J Middle East Islam Stud. 2019;13(2):143–
61. https:// doi. org/ 10. 1080/ 25765 949. 2019. 16055 63. 54. Baev PK. Russia aspires to the status of ‘energy superpower.’ Strateg Anal. 2007;31(3):447–65. https:// doi. org/ 10. 1080/ 09700 16070 14157 35. 55. Umbach F. Global energy security and the implications for the EU. Energy Policy. 2010;38:1229–40. https:// doi. org/ 10. 1016/j. enpol. 2009. 01.
010. 56. Shuyan L, Fabuš M. Study on the spatial distribution of China’s outward foreign direct investment in eu and its influencing factors. Entrep
Sustain Issues. 2019;6(3):1280–96. https:// doi. org/ 10. 9770/ jesi. 2019.6. 3(16). 57. Liu SQ, Kozan E. Integration of mathematical models for ore mining industry. Int J Syst Sci Oper Logist. 2019;6(1):55–68. https:// doi. org/ 10.
1080/ 23302 674. 2017. 13443 30.

Vol.:(0123456789)
Discover Energy (2021) 1:2 | https://doi.org/10.1007/s43937-021-00002-6 Research
1 3
58. Li W, Xi Y, Wu F, Masoud M, Liu SQ. Green development performance of water resources and its economic-related determinants. J Clean Prod. 2019;239: 118048. https:// doi. org/ 10. 1016/j. jclep ro. 2019. 118048.
59. Khan WA, Chung SH, Ma HL, Liu SQ, Chan CY. A novel self-organizing constructive neural network for estimating aircraft trip fuel consumption. Transp Res Part E. 2019;132:72–96. https:// doi. org/ 10. 1016/j. tre. 2019. 10. 005.
60. Li W, et al. An improved evaluation framework for industrial green development: considering the underlying conditions. Ecol Indic. 2020;112:58. https:// doi. org/ 10. 1016/j. ecoli nd. 2019. 106044.
61. Zhang Q, Liu SQ, Masoud M. A traffic congestion analysis by user equilibrium and system optimum with incomplete information. J Comb Optim. 2020;1:1. https:// doi. org/ 10. 1007/ s10878- 020- 00663-4.
Publisher’s Note Springer Nature remains neutral with regard to jurisdictional claims in published maps and institutional affiliations.