how human brain works during financial investment decisions? annual meetings/2014-… · how human...
TRANSCRIPT

How Human Brain Works During Financial Investment Decisions?
João Paulo Vieito1, Armando F. Rocha
2 and F. T. Rocha
3,
Abstract
This investigation is among the first to analyze the patterns of brain activity associated
with financial decision making in male and female. We try to identify brain areas
associated with risk evaluations of stock investments. Based on EEG technology and
Low Resolution Brain Tomography we find something very new in the area: men and
women use different neural circuits to make financial investment decisions. We also
find that, on average, female trade less stock in each investment decision and make
more decisions to sell than men, what is congruent with literature that describes that
normally male have more optimistic aspirations in negotiations than female (Babcock ,
2003 and Riley & Babcock, 2002) and female try to make investments decision that
produce financial return in short-term period (Overman et al., 2004). More interesting,
the final portfolio value were not quite different for males and females what implies that
although using different neural circuits to make decisions, both genders are equally
efficient in their decisions, even using different part of the brain to make the same kind
of investment decisions.
Keynwords: Financial Investment Decisions; Brain Neural Activity; Low Resolution
Brain Tomography
1 Dean and Professor of Finance, School of Business Studies, and Polytechnic Institute of Viana do
Castelo, Portugal. Address: Avenida Miguel Dantas, 4930 Valença, Portugal. Email: [email protected]
2 Neuroscience Researcher at RANI and Prof. from Medical School of São Paulo, Brazil. Address: Rua Tenente Ary Aps, 172, 13207-110 Jundiaí, Brazil. Email: [email protected]
3 Neuroscience Researcher at IPTI and RANI – Research on Artificial and Natural Intelligence. Address: Rua Tenente Ary Aps, 172, 13207-110 Jundiaí, Brazil. Email: [email protected]
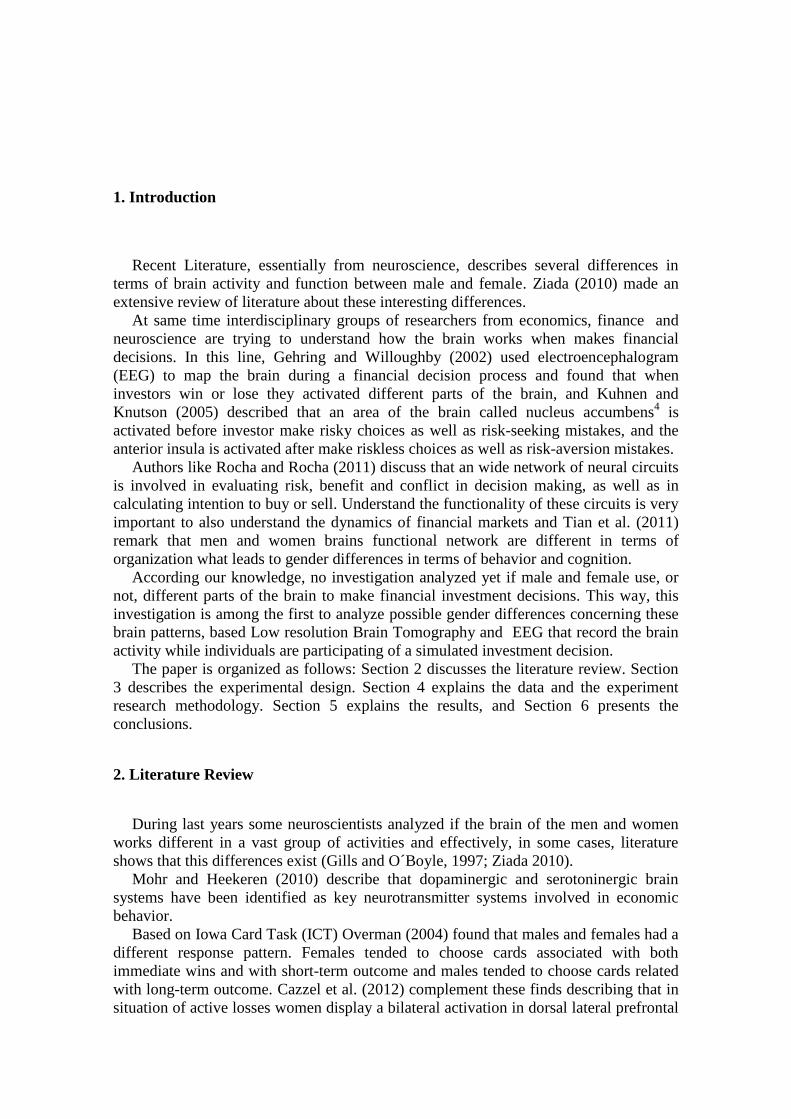
1. Introduction
Recent Literature, essentially from neuroscience, describes several differences in
terms of brain activity and function between male and female. Ziada (2010) made an
extensive review of literature about these interesting differences.
At same time interdisciplinary groups of researchers from economics, finance and
neuroscience are trying to understand how the brain works when makes financial
decisions. In this line, Gehring and Willoughby (2002) used electroencephalogram
(EEG) to map the brain during a financial decision process and found that when
investors win or lose they activated different parts of the brain, and Kuhnen and
Knutson (2005) described that an area of the brain called nucleus accumbens4 is
activated before investor make risky choices as well as risk-seeking mistakes, and the
anterior insula is activated after make riskless choices as well as risk-aversion mistakes.
Authors like Rocha and Rocha (2011) discuss that an wide network of neural circuits
is involved in evaluating risk, benefit and conflict in decision making, as well as in
calculating intention to buy or sell. Understand the functionality of these circuits is very
important to also understand the dynamics of financial markets and Tian et al. (2011)
remark that men and women brains functional network are different in terms of
organization what leads to gender differences in terms of behavior and cognition.
According our knowledge, no investigation analyzed yet if male and female use, or
not, different parts of the brain to make financial investment decisions. This way, this
investigation is among the first to analyze possible gender differences concerning these
brain patterns, based Low resolution Brain Tomography and EEG that record the brain
activity while individuals are participating of a simulated investment decision.
The paper is organized as follows: Section 2 discusses the literature review. Section
3 describes the experimental design. Section 4 explains the data and the experiment
research methodology. Section 5 explains the results, and Section 6 presents the
conclusions.
2. Literature Review
During last years some neuroscientists analyzed if the brain of the men and women
works different in a vast group of activities and effectively, in some cases, literature
shows that this differences exist (Gills and O´Boyle, 1997; Ziada 2010).
Mohr and Heekeren (2010) describe that dopaminergic and serotoninergic brain
systems have been identified as key neurotransmitter systems involved in economic
behavior.
Based on Iowa Card Task (ICT) Overman (2004) found that males and females had a
different response pattern. Females tended to choose cards associated with both
immediate wins and with short-term outcome and males tended to choose cards related
with long-term outcome. Cazzel et al. (2012) complement these finds describing that in
situation of active losses women display a bilateral activation in dorsal lateral prefrontal

cortex higher than males but in the case of wins they don´t find significant difference
between men and women.
Xue et al. (2010) found that insula is activated by past experiences of risk that
influences on future decisions and Lee et al. (2009) analyzed gender effects on the
process of risk-taking and found a activation in the right insula and bilateral
orbitofrontal cortex in Risky-Gains task that is stronger in female than in male. When
taking the same level of risk, relative to men, women tend to engage in more neural
processing involving the insula and the bilateral orbitofrontal cortex to update and
valuate possible uncertainty associated with risk-taking decision making. Becker et al.
(2012) complement this information describing that males are more likely than females
to engage in risky behaviors, meaning that women normally are more risk averse than
men.
A vast literature in economics and finance also shows that, on average, women are
more risk averse than men when making financial decision investment (e.g., Vandegrift
& Brown, 2005, among several others) but investigating how the brain works in risky
financial decision making is very recent.
Davis (2010) debates in what way using neuroscience technologies in economic will
help to transform economics. In other words, what advances in economics, finances and
other areas will be supported by neurosciences? We believe this approach is at same
time extremely promising and innovative. Is the case of Roy et al. (2011) that analyzed
the neural correlates of risk avoidance and found that precuneus and striatal are
activated in decision-making under uncertainty representing putative neural markers of
risk avoidance both in laboratory experiments as well as in a real world activity. Also
Gehring and Willoughby (2002) found that brain activity is related with final game
results and Kuhnen and Knutson (2005) showed that nucleus accumbens4 activation
preceded risky choices as well as risk-seeking mistakes, while anterior insula activation
preceded riskless choices as well as risk-aversion mistakes. The authors also describe
that a positive emotional state induces people to take risk and be confident to evaluate
investment options and negative emotions like anxiety reduce the propensity to take risk
(Kuhnen and Knutson, 2011) report that financial decision process change across the
life and old adults made more suboptimal choices than younger adults when choose risk
assets.
Jones et al. (2012) analyzed what they call the “shopping brain” using event-related
potential (ERP). They investigated the gender brain response during consumer choices
of products having or not a price discount (15%) and found that the conceptual
processes interact with anxiety and gender to modulate brain responses during this type
of consumer choices. Finaly, Tian et al. (2011), report that the men and women brains
functional networks are different in terms of organization and this leads to gender
differences in terms of behavior and cognition.
In terms of gender differences in investments authors like Buchan et al. (2008) and
Croson and Buchan (1999) described that women normally obtain an higher investment
proportion, than men, of the amount they invested in a game but and Babcock et al.
(2003) and Riley and Babcock (2002) found that males normally have more optimistic
aspirations in negotiation than females and that aspirations partially mediate gender
differences in negotiation performance. In other words, men may trust more (send, or
invest, more money) because they expect to receive more in return in the future than
women.
Supported by this literature we use EEG analysis and Low Resolution Brain
Tomography to analyze whether gender differences exist or not stock market investment
decisions.

3. Experimental Design
EEG is recorded while the volunteer play a stock make investment game. The
electrodes are placed according to the 10/20 protocol (see Figure 1); adjusted to have
impedance below 10 Kohm; low-pass filter 50Hz, sampling frequency of 256 Hz and 10
bits of resolution.
Figure 1- EEG electrodes location and name
The letters F, T, C, P and O are related with Frontal, Temporal, Central, Parietal, and
Occipital lobes, respectively. Is important to describe that there exists no central lobe.
The "C" letter is used only for identification purposes. A "z" (zero) refers to an
electrode placed on the midline. In the case of the numbers (2,4,6,8) refer to electrode
positions on the right hemisphere. This way, odd numbers (1,3,5,7) refer to those on the
left hemisphere. In addition, the letter codes A, Pg and Fp identify the earlobes,
nasopharyngeal and frontal polar locations respectively.
The investigation is done based on a sample composed by 40 undergraduate students
of the School of Business Studies from Polytechnic Institute of Viana do Castelo,
Portugal. The sample is composed by 20 women and 20 men from age 20 to 45 years.
This will guarantee that students are homogenous in term of financial knowledge.
We use the EEG technology, and not fMRI, because this will allow volunteers to
take the time they need to make decisions during the trading simulation of selling,
buying or maintaining stock portfolio (Rocha et al, 2011). Each volunteer played the
investment game describe below, with a portfolio composed by 200 stocks of 7 different
companies trade at the Portuguese Sock Market (Banif, Portugal Telecom, Energias de
Portugal; Banco Comercial Portugues; BRISA, Cimentos de Portugal and Futebol Clube
do Porto).
They made a total of 100 investment decisions (50 decisions in series 1 (S1) and 50
decisions in series 2 (S2)) and they can buy, sell or hold these stocks. Volunteers were
restricted to 50.000 euros to trade on each session. Is also important to say that none of
the volunteer has any information about the way each of the stock will behave across
the investment simulation process. During all this decisions we use EEG technology to
record the brain electrical activity trying to identify what areas of the brain are activated
when they make each investment decision.

Half volunteers (10 females and 10 males) made 50 trading decisions on a bull
market m1 in session 1 and another 50 trading decisions on bear market m2 in session
2. The other half of volunteers traded initially on the bear market m2 and on the bull
market m1 during session 2. Relative stock prices were used to calculate stock price, by
multiplying it by the value of the stocks at Portuguese Stock Market on February, 1,
2012 and information about this relative index was available to the volunteers.
Figure 2 – The initial portfolios for markets m1 (above) and m2 (bellow). Indice -the
relative bourse index
IND– the relative stock price; VAR –difference between actual and previous
relative stock price, Valor – actual real stock price, QT – quantity of owned stocks,
Total – total invested in each stock; D-QT – proposed number of stocks to trade; D-
Valor – proposed transaction price; V – selling option; C – buying option; OK – to
finish proposal. TI – actual total investment; RE – amount of money spent to buy
the stocks; R – revenue (gain or loss) and A – available money for new buyings.
Trading simulation progressed as follows. While the EGG was being recorded, the
volunteer digitized number and price of stock to trade for one and just one company and
selected trading option V or C and pressed OK in order to sell or buy the chosen stock,
respectively; or just pressed OK to maintain portfolio unaltered ( see figure 2).
If price offer was within 5% variation of the next stock price, offer was accepted and
the corresponding number of stock adjusted; otherwise, offer was rejected and the
corresponding number of stock was maintained unaltered.
After OK was pressed a new screen was presented for another trading simulation.
This new screen showed updated information of the experimental variables.
EEG samples (called here, EEG epochs) were selected for the 2 seconds preceding
decision making (OK button pressing) were used for analysis.
4. Experimental Results

In this part we describe some financial results related we our experiment.
4.1 Financial Results
In table 1 and figure 3 we display information about the value of the investment,
realized and final value of the portfolio. From table 1 is possible to see that, on average,
female invest less than male, but realize more money across the experiment. More
interesting, in the end of experiment the average value of the men and women portfolio
is practically the same (the difference is not statistically significant). The results are
congruent with literature that women are more risk averse then men (Vandergrift &
Brown, 2005), prefer to get returns of your investment in short term periods (Overman
et al., 2004) and also with Babcock et al (2003) and Riley & Babock (2002) that
normally male have more optimistic aspirations in negotiations than female. From treh
table is also possible to see that, even existing differences in stock market investment
attitude between male and female the final result of the portfolio is practically the same
(the difference is not statistically significant), what is also congruent with Haier et al.
(2005) that describes that human evolution created two different brains but with equally
intelligence.
Table 1: Investment, Realized Value and Final Result of the Portfolio
Gender Investment Realized Final Result
Male 36298,79 7112,959 43411,75
Female 31590,15 11700,956 43283,77
Mean Difference 4708,64*** -4587,997*** 127,98
Significant at (***) 1% level, (**) 5% level and (*) 10% level.
The figure 3, describe not the average values, but all the absolute values across the
experiment.

Figure 3: Male and Female Investment value, Realized and Portfolio Final Value
Table 2 complement all this information, describing the average value of stock traded
by investment decisions and the average value of each. On average, male trade more
stocks in each investment decisions but with less value. The results are also congruent
with literature that describe male like more optimistic than female in negotiation process
(Babcock et al, 2003 and Riley and Babcock, 2002).
Table 2: Average Quantity of Stock by Transaction ana Value
QTDE VALOR
Male 137,348 28,812
Female 79,362 32,754
Mean Diference 57,986*** -3,942
Significant at (***) 1% level, (**) 5% level and (*) 10% level.
Figure 4 describes the same information but in absolute values across all the experiment
( 100 investment decisions).
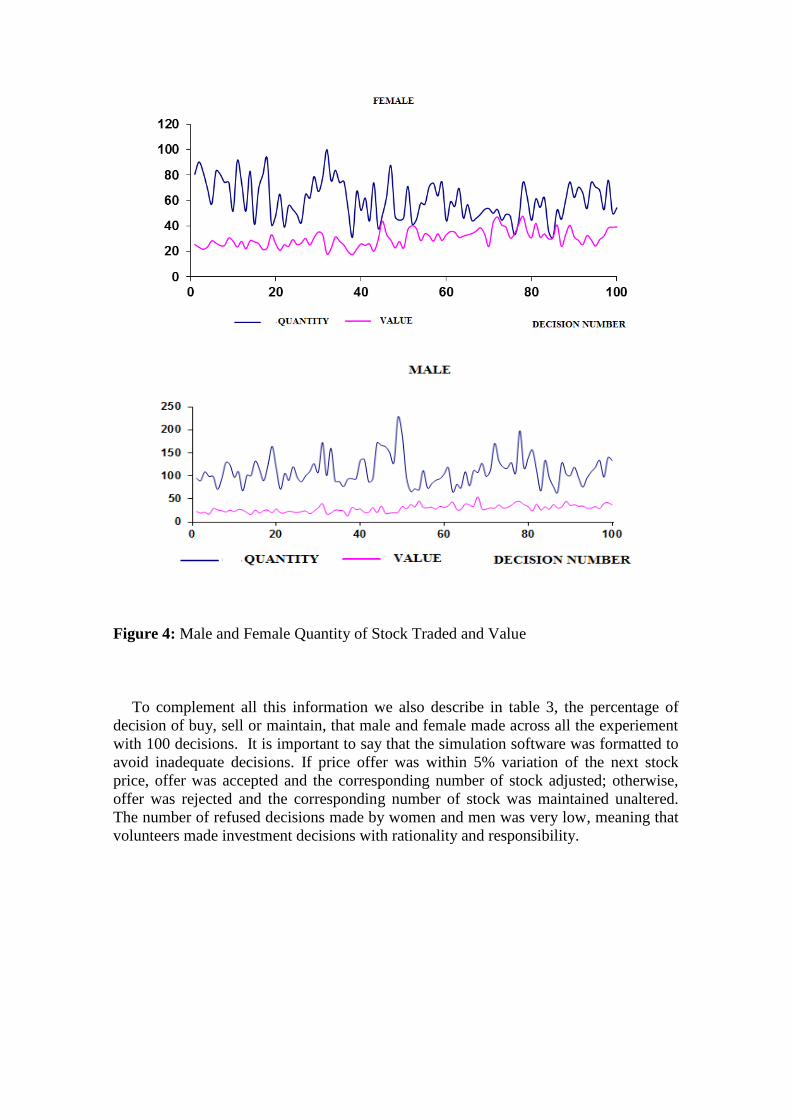
Figure 4: Male and Female Quantity of Stock Traded and Value
To complement all this information we also describe in table 3, the percentage of
decision of buy, sell or maintain, that male and female made across all the experiement
with 100 decisions. It is important to say that the simulation software was formatted to
avoid inadequate decisions. If price offer was within 5% variation of the next stock
price, offer was accepted and the corresponding number of stock adjusted; otherwise,
offer was rejected and the corresponding number of stock was maintained unaltered.
The number of refused decisions made by women and men was very low, meaning that
volunteers made investment decisions with rationality and responsibility.

Table 3 – Percentage of Investment decisions by Gender
Decison Female Male
Rejected 0.40% 0.39%
Mantain 28.15% 24.26%
Sell 45.49% 37.15%
Buy 25.96% 38.20%
Total 100% 100%
On average, female made more sell decisions and male more decisions of buy.
The results are congruent with Overman et al. (2004) finds that females tended to
choose cards associated with immediate wins and males tended to choose cards related
with long-term outcome. In other words, it seems that women tend to sell faster than
men trying to have short-term financial returns.
4.2 EEG results
Two different technologies were used for EEG analysis: Low Resolution Brain
Tomography (LORETA)4 and EEG entropy ( ieH ) Principal Component Analysis
( ieH 5. These technologies are described bellow.
4.2.1 Low Resolution Brain Tomography (LORETA)
The activity tVie recorded by a set of electrodes ie (EEG) is a weighted sum
)(*1
tsw j
r
j
j
of the electric currents generated by sets is neurons that are activated at
different cortical areas by a given cognitive task, for example financial decision making.
LORETA is a technique aimed to calculate the location of these sources using the
EEG recorded activity. Two different calculations are used for this purpose: Event
Related Activity (ERA) and Time Varying Cross Spectra (TVCS).
4 For more information please visit http://www.uzh.ch/keyinst/loreta.htm
5 For more information related how to apply PCA to EEG data information please visit
http://www.eina.com.br/eeg.php
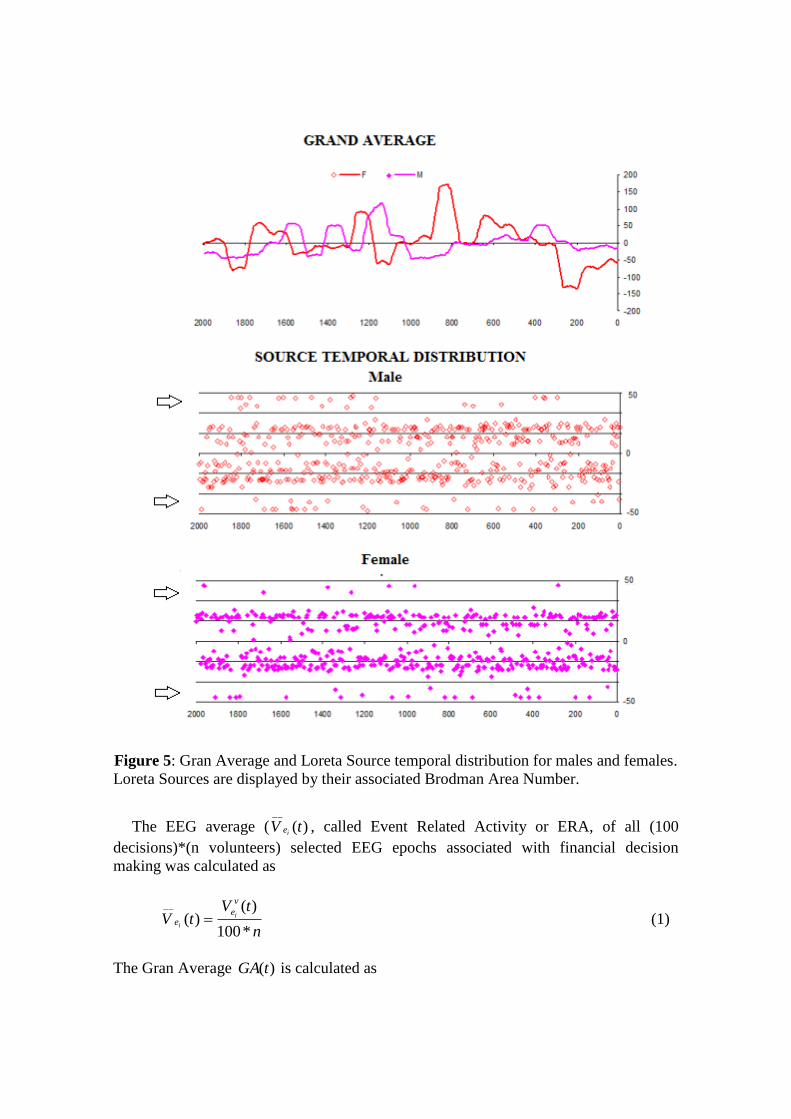
Figure 5: Gran Average and Loreta Source temporal distribution for males and females.
Loreta Sources are displayed by their associated Brodman Area Number.
The EEG average ( )(__
tVie , called Event Related Activity or ERA, of all (100
decisions)*(n volunteers) selected EEG epochs associated with financial decision
making was calculated as
n
tVtV
v
ee
i
i
*100
)()(
__
(1)
The Gran Average )(tGA is calculated as

20
)(
)(
20
1
__
i
e tV
tGA
i
(2)
and it is used to facilitate ERA comparison between experimental groups or cognitive
tasks.
Figure 5 clearly shows that )(tGA calculated for male and females are different.
Therefore, it may be assumed that ERA calculated for these two experimental groups
are different.
ERA ( )(__
tVie ) was one of the EEG signals used for LORETA source identification
(Figure 5, 6 and 8).
A total of 377 and 399 possible sources ls of ERA calculated for male and females
were identified in 41 and 49 different cortical locations ( ll ), respectively, because their
calculated Z score was greater than 2.
The frequencies which ls were identified at these locations are shown in Figure 5.
We find that 3 location of the brain were identified as unique and distinctive sources for
males and 11 as unique for females. In other words, men and women used several
similar areas to make financial decision but we found that men use 3 locations that
women did not use, and women use 11 locations that men did not use.
Brodmann6 areas (BA) 18 ( Cuneus; Middle Occipital Gyrus) was the most frequent
sites for both male and female, followed by BAs 19, 11, 10, 7 and 8 in male case, and
BAs 19, 7, 10, 11 and 8 in female case. Inferior Frontal Gyrus in BA 27 is also a
frequent site of source location for both male and females.
Temporal distributions of the above identified ls as encoded by their Brodman Area
number are shown in Figure 4. These distributions for male and female were quite
different since their Pearson’s Determination Coefficient (PDC) was equal to -0.04.
Female distribution is wider than male distribution. This confirms that ERA calculated
for male and female are different.
Fast Fourrier Transform converts time to frequency and is used here to convert ERA
( )(__
wVie ) calculated for time window of size w (e.g., 100 ms as used here) into a family
of components of different frequencies )(__
wV
f
ei. The components for frequencies 1 to 15
Hz were used here as other EEG signals for LORETA source identification (Figures 5
and 6).
LORETA calculate the possible sources generating each studied frequency by
moving the span window w all over the studied ERA. This procedure generates a family
of set of sources ls some of them common to all studied frequency and some other
specific of a given frequency.
A total of 423 sources ls for each TVCS frequency were identified for male and
females in 50 different cortical locations ( ll ), because their calculated Z score was
greater than 2. The frequencies which ls were identified at these locations are shown in
Figure 6. Of the identified locations, 16 were identified as unique and distinctive
sources for males and 4 as unique for females. Brodmann areas (BA) 18 was the most
6 Brodmann K. Vergleichende Lokalisationslehre der Grosshirnrinde. Leipzig : Johann Ambrosius Bart,
1909

frequent sites for both male and female, followed by BAs 7, 19, 11, 10 and 8 in male
case 10, 7, 11, 19 and 8 in female case.
Figure 6 – Identified LORETA sources for ERA

Figura 7 –LORETA source identification for TVCS
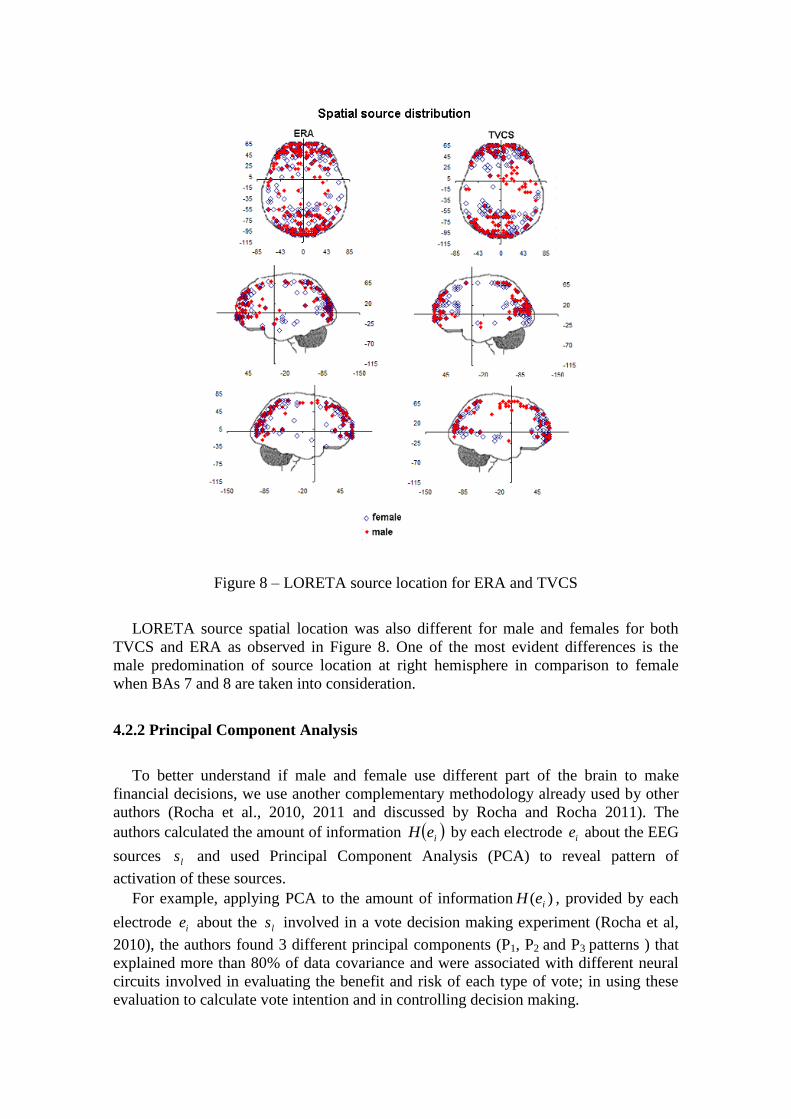
Figure 8 – LORETA source location for ERA and TVCS
LORETA source spatial location was also different for male and females for both
TVCS and ERA as observed in Figure 8. One of the most evident differences is the
male predomination of source location at right hemisphere in comparison to female
when BAs 7 and 8 are taken into consideration.
4.2.2 Principal Component Analysis
To better understand if male and female use different part of the brain to make
financial decisions, we use another complementary methodology already used by other
authors (Rocha et al., 2010, 2011 and discussed by Rocha and Rocha 2011). The
authors calculated the amount of information ieH by each electrode ie about the EEG
sources ls and used Principal Component Analysis (PCA) to reveal pattern of
activation of these sources.
For example, applying PCA to the amount of information )( ieH , provided by each
electrode ie about the ls involved in a vote decision making experiment (Rocha et al,
2010), the authors found 3 different principal components (P1, P2 and P3 patterns ) that
explained more than 80% of data covariance and were associated with different neural
circuits involved in evaluating the benefit and risk of each type of vote; in using these
evaluation to calculate vote intention and in controlling decision making.

Figure 7 – Principal Component Analysis mappings for Females (F) and Males (M)
calculated from the results on table 1. Values on table I were normalized and color
encoded such that loading factor greater than .6 are colored from green (.65) to dark
blue (1).
Table 4– Principal Component Analysis (PCA) Results
Female Male
F1 F2 F3 F1 F2 F3
C3 0.86 0.10 0.18 0.79 0.15 0.21
C4 0.56 0.21 0.66 0.25 0.09 0.89
CZ 0.71 0.21 0.30 0.76 0.28 0.30
F3 0.73 0.45 0.03 0.83 0.24 0.23
F4 0.86 -0.07 0.12 0.82 -0.11 0.34
F7 0.71 0.41 0.24 0.23 0.27 0.83
F8 0.58 0.47 0.00 0.80 0.34 0.30
FP1 0.72 0.52 -0.02 0.85 0.29 0.19
FP2 0.62 0.51 0.03 0.86 0.26 0.21
FZ 0.38 0.69 0.19 0.83 0.24 0.23
O1 0.23 0.52 -0.47 0.09 0.7 0.32
O2 0.09 0.83 0.18 0.33 0.82 0.11
OZ 0.10 0.88 0.05 0.38 0.72 0.16
P3 0.29 0.39 0.52 0.26 0.44 0.38
P4 0.55 0.37 0.44 0.31 0.2 0.80
PZ 0.36 0.62 0.33 0.35 0.35 0.60
T3 0.21 0.47 0.58 0.29 0.22 0.82
T4 0.66 0.01 0.53 0.36 -0.15 0.81
T5 0.14 0.49 0.46 0.08 0.42 0.76
T6 0.19 0.75 0.23 0.38 0.73 0.22
Expl.Var 5.82 5.12 2.33 6.40 3.39 5.23
Prp.Totl 0.29 0.26 0.12 0.32 0.17 0.26

Here, PCA also revealed 3 different patterns of brain activity explaining more than
80% of )( ieH covariance (Figure 7).
The first principal component for female (F1) is composed by electrodes C3, C4, CZ,
F3, F4, F8, FP1 and T4, whereas male F1 mapping is composed by electrodes C3, CZ, F3,
F4, F8, FP1, FP2 and FZ. To better understand the location of each electrodes please see
figure 1.
Female F2 mapping is composed by electrodes FZ, O2, OZ and T6, whereas male F2
mapping is composed by electrodes O1, O2, OZ and T6. Finally, female F3 mapping is
composed only by C4 whereas male F3 mapping is composed by electrodes F7, P4, T3,
T4 and T5. This way, we can conclude that patterns F1 and F3 clearly distinguishes
male from female.
4.2.3 Combining LORETA and Principal Component Analysis
In this part we join the information from all the past analysis (ERA, TVCS and PCA)
to identify the areas of the brain activated by men and women when the make financial
investment decisions.
Because the electrical activity recorded by each electrode is determined by the sum
of the electrical currents generated by each ls , Figures 9, 10 and 11 show those ls at the
nearest location ll to the electrodes composing each PCA mapping F1, F2 and F3,
respectively. Figures 12 and 13 shows the cortical areas and frequency at which those
ls associated with F1, F2 and F3 were located.
Figures 8 to 10 show that 3 different sets of sources ls can be distinguished by the
proximity of their location to the recording electrodes defining factors F1, F2 and F3,
respectively. The cortical location of the sources ls composing these different sets with
the respective frequency, are shown in Figures 12 and 13 for ERA and TVCS,
respectively.
Sources ls located at BAs 8, 10, 11, 45, 46 and 47 are predominately associated with
F1 whereas ls located at BAs 20, 21, 23, 37, 38, 39 and 40 are predominately associated
with F2. Finally, ls located at BAs 18 and 19 are predominately associated with F3. It
can be observed in all figures, that ls composition, as well as their temporal and spatial
distributions are different when ERA, TVCS or gender is considered.
The most important differences between male and female it is observed for F1 and F3
when TVCS sources ls are considered. The most distinctive difference t is characterized
by a clearly frequency predominance of ls located at the right BAs 3, 6, 7 and 8 and in
males compared to females for F1 (Figures 11 and 12). Locations at these areas
predominated for man and right hemisphere. Another difference consists on frequency
predominance of ls located at the BAs 45, 46 and 47 in females compared to males
(Figures 11 and 12) for both F1 and F3. A predominance of ls frequency is also
observed for BAs 3, 5, 6 and 40 in males compared to females concerning sources
associated with ERA F3 (Figures 12 and 13).

Figure 9 – Spatial distribution of ERA and TVCS sources ls associated with PCA factor F1 for male and female. At right spatial plotting of
those ls nearest to the electrodes composing F1, at left superposition these sources of over the factorial mapping F1.
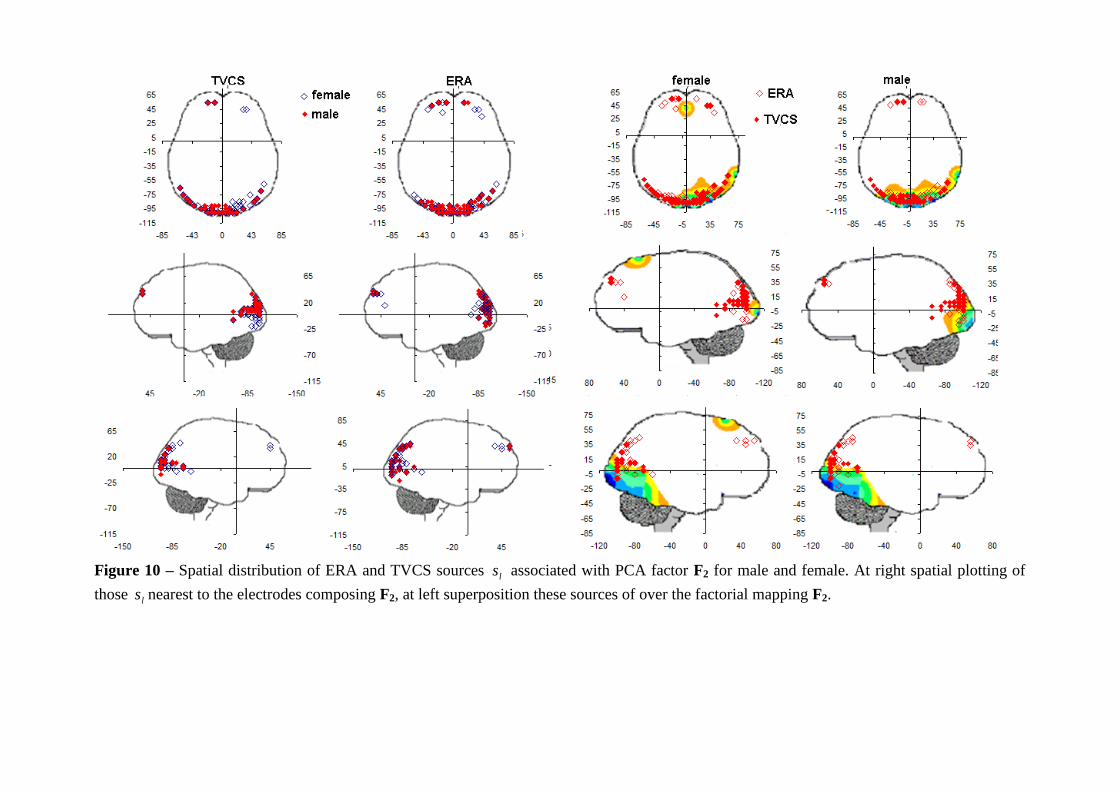
Figure 10 – Spatial distribution of ERA and TVCS sources ls associated with PCA factor F2 for male and female. At right spatial plotting of
those ls nearest to the electrodes composing F2, at left superposition these sources of over the factorial mapping F2.

Figure 11 – Spatial distribution of ERA and TVCS sources ls associated with PCA factor F2 for male and female. At right spatial plotting of
those ls nearest to the electrodes composing F3, at left superposition these sources of over the factorial mapping F3.

Figure 12 – Cortical areas at which those ERA ls associated with the PCA mappings F1, F2 and F3 were located. Blue bars show the frequencies
at which ls were identified at the left cortical areas and red bars show the location frequency at the right cortical areas.

Figure 13 – Cortical areas at which those TVCS ls associated with the PCA mappings F1, F2 and F3 were located. Blue bars show the
frequencies at which ls were identified at the left cortical areas and red bars show the location frequency at the right cortical areas.

22
Clear different patterns of ls location for male and female in F1 case are
observed (Figure 9). Sources located (see locations between X=45 and X=65 in
Figure 9) at Superior Frontal Gyrus (BA 9) and Middle Frontal Gyrus (BA 10)
tend to be more clustered for females in comparison to males. In contrast, a clear
cluster is observed for male compared to female in case of Precentral, Middel
Frontal and Superior Frontal Gyri and Paracentral Lobule, all of them in BA 6
(see region around axe intersection in Figure 9). Finally, locations at Poscentral
Gyrus (BA 1, 2, 3 and 5) predominated for females (see locations between X=-35
and X=-55). These findings support the proposition that neural activity of two
different neural circuits is disclosed by F1 and they differentiate financial
reasoning used by males and females.
Clear different patterns of ls location for male and female are also observed in
F3 case (Figure 11). Female F3 is due to the activity of neurons located at
Postcentral Gyrus (BA 1 and 2), Middle Temporal Gyrus (BA 20), Inferior
Temporal Gyrus (BA 21) and Middle Temporal Gyrus (BA 21) at the right
hemisphere. In contrast, male F3 is due to the activity of neurons located at
Paracentral lobule (BA 5), Middle Frontal Gyrus (BA 6), Fusiform Gyrus (BA
19), Inferior Occipital Gyrus (BA 19), Inferior Temporal Girus (BA 21) and
Middle Frontal Gyrus (BA 21) at both hemispheres. These findings support the
proposition that neural activity of two different neural circuits is also disclosed by
F3 and they differentiate financial reasoning used by males and females.
5. Conclusion
Based on stock investment simulation with 100 decisions, this investigation is
among the first to analyze the patterns of brain activity associated with financial
decision making in women and men.
The investigation was done based on a sample composed by 40 undergraduate
students (20 men and 20 women), with no past experience in real stock trading.
This will guarantee that students are homogenous in term of financial knowledge.
During all the decision process we use the EEG technology to record the brain
electrical activity trying to identify what areas of the brain are activated when they
make each investment decision.
We find that men and women use different neural circuits to make finical
investment decisions but the average value of male and female portfolio is similar,
what is congruent Haier et al. (2005) finds that that human evolution created two
different brains but with equally intelligence.
Male activate neurons that are specifically located at Precentral, Middel Frontal
and Superior Frontal Gyri and Paracentral Lobule in BA 6 (pattern F1), as well as
located at Paracentral lobule (BA 5), Middle Frontal Gyrus (BA 6), Fusiform
Gyrus (BA 19), Inferior Occipital Gyrus (BA 19), Inferior Temporal Girus (BA
21) and Middle Frontal Gyrus (BA 21) at both hemispheres (pattern F3). Female
activate neurons that are specifically located at (pattern F1) Superior Frontal
Gyrus (BA 9), Middle Frontal Gyrus (BA 10) and Poscentral Gyrus (BA 1, 2, 3
and 5) as well as located (pattern F3) at Postcentral Gyrus (BA 1 and 2).
23
References
Becker, J., Perry, A, Westenbroek, C., 2012. Sex Differences in the Neural
Mechanisms Mediating Addiction: A New Synthesis and Hypothesis. Biology
Sex Differences 3(14), 3-35.
Babcock, L., Laschever, S., Gelfand, M., Small, D., 2003. Nice girls don’t ask:
women negotiate less than men—and everyone pays the price. Harvard
Business Review 81, 14–17.
Buchan, N., Croson, R., Solnick, Sara, J., 2008. Trust and gender: an examination
of behavior and beliefs in the investment game. Journal of Economic Behavior
& Organization 68, 466–476.
Cazzell, M., Li, L., Lin, Z, Patel, S., Liu, H., 2012. Comparison of Neural
Correlates of Risk Decision Making Between Genders: An Exploratory fNIRS
Study of the Balloon Analogue Risk Task (BART). Neuroimage 62(3), 1896-
1911.
Croson, R., Buchan, N., 1999. Gender and culture: international experimental
evidence from trust games. American Economic Review 89, 386–391.
Davis, J., 2010. Neuroeconomics: Constructing Identity. Journal of Economic
Behavior & Organization 76 , 574–583.
Gehring, W, Willoughby, J. (2002).The Medial Frontal Cortex and the Rapid
Processing of Monetary Gains and Losses. Science, 295, 2279 – 2282.
Gill, H., O´, Boyle, M. 1997. Sex Differences in Matching Circles and Arcs: A
Preliminary EEG Investigation. Laterality 2(1), 33-48.
Haier, R., Jung, R. yeo, R., Head, K., Alkire, M. (2005). The neuroanatomy of
General Intelligence: Sex Matters. Neuroimage, 25 (1), 320-327.
Jones, W., Childers, T., Jiang, Y., 2012. The Shopping Brain: Math Anxiety
Modulates Brain Responses to Buying Decisions. Biological Psychology 89(1),
201-213.
Kuhnen, C., Knuston, B. (2005). The Neural Basis of Financial Risk Taking.
Neuron 47,763-770.
Kuhnen, C. Knutson, B. (2011). The Influence of Affect on Beliefs, Preferences,
and Financial Decisions. Journal of Financial Quantitative Analysis, 46, 605–
626.
Lee, T., Chan, C., Leung, A., Fox, P., Gao, J., 2009. Sex-Related Differences in
Neural Activity During Risk Taking: An fMRI Study. Cerebral Cortex 19(6),
1303-12.
Mohr, P., Li, S., Heekeren, H., 2010. Neuroeconomics and Aging:
Neuromodulation of Economic Decision Making in Old Age. Neuroscience
and Biobehavioral Reviews 34, 678–688.
Overman, W., Frassrand, K., Ansel, S., Trawalter, S., Bies, B., Redmond, A.
(2004). Performance on the IOWA Card Task by Adolescents and Adults.
Neuropsychologia 42(13), 1838-51.
Rocha, A. F. Rocha, F. T. Rocha And E. Massad (2011) The Brain as a
Distributed Intelligent Processing System: An EEG study. PLoS ONE 6(3):
e17355. doi:10.1371/journal.pone.0017355

24
Roy, A., Gotimer, K., Kelly, A., Castellanos, F., Milham, M., Ernst, M., 2011.
Uncovering Putative Neural Markers of Risk Avoidance. Neuropsgychologia
49(5), 937-944.
Riley, H., Babcock, L., 2002. Gender as a Situational Phenomenon in Negotiation.
KSGWorking Paper Number RWP02-037, Harvard University.
Tian, L., Wang, J., Yan, C., He, Y., 2011. Hemisphere-and gender-related
differences in small-world brain networks: A resting-state functional MRI
study. NeuroImage 54, 191–202.
Vandegrift, D., Brown, P. (2005). Gender Differences in the Use of High-
Variance Strategies in Tournament Competition. Journal of Socio-Economics,
34(6), 834-849
Xue, G., Lu, Z., Levin, I., Bechara, A., 2010. The Impact of Prior Risk
Experiences on Subsequent Risky Decision-Making: The Role of the Insula.
NeuroImage 50, 709–716.
Zaidi, Z. (2010). Gender Differences in Human Brain: A Review. The Open
Anatomy Journal 2 , 37-55.