how different types of restaurants behaved differently
TRANSCRIPT

Graduate Theses and Dissertations Iowa State University Capstones, Theses andDissertations
2012
How different types of restaurants behaveddifferently through the recent recession an analysisof stock market and financial ratiosXiaofan WangIowa State University
Follow this and additional works at: https://lib.dr.iastate.edu/etd
Part of the Economics Commons
This Thesis is brought to you for free and open access by the Iowa State University Capstones, Theses and Dissertations at Iowa State University DigitalRepository. It has been accepted for inclusion in Graduate Theses and Dissertations by an authorized administrator of Iowa State University DigitalRepository. For more information, please contact [email protected].
Recommended CitationWang, Xiaofan, "How different types of restaurants behaved differently through the recent recession an analysis of stock market andfinancial ratios" (2012). Graduate Theses and Dissertations. 12820.https://lib.dr.iastate.edu/etd/12820

How different types of restaurants behaved differently through the recent recession an analysis of stock market and financial ratios
by
Xiaofan Wang
A thesis submitted to the graduate faculty
in partial fulfillment of the requirements for the degree of
MASTER OF SCIENCE
Major: Hospitality Management
Program of Study Committee: Tianshu Zheng, Major Professor
Thomas Schrier Frederick O. Lorenz
Iowa State University
Ames, Iowa
2012
Copyright © Xiaofan Wang, 2012. All rights reserved.

ii
TABLE OF CONTENTS
LIST OF TABLES v
ACKNOWLEDGEMENTS vi
CHAPTER 1. INTRODUCTION 1
Background 1
Purpose of Study 3
CHAPTER 2. LITERATURE REVIEW 5
The Impact of the Recent Recession 5
Differences among Different Types of Restaurants 9
Stock Index 10
Financial Ratio Analysis 11
Overview 11
Summary of ratios 14
Studies used financial ratio analysis 27
CHAPTER 3. DATA AND METHODS 32
Study Design 32
Impact of Recession on U.S. Restaurants Stock Market 32
Restaurant classification 32
Data collection 33
ARIMA with Intervention Analysis 34
Financial Differences between Two Types of Restaurants 46
Financial ratios data 46

iii
Independent samples t-test 47
Impact of the Recession on Financial Conditions and Performances 49
Data 49
Paired-samples t-test 50
The Wilcoxon signed rank test 53
CHAPTER 4. RESULTS AND DISCUSSION 54
Findings of U.S. Restaurant Stock Market 54
The impact and recovery of the recession on U.S. restaurant stock market 54
Discussion of the recession’s impact on limited service restaurants 55
Discussion of the recession’s impact on full service restaurants 58
Findings for Ratios Comparisons of Restaurants 59
Liquidity 59
Leverage 60
Profitability 62
Asset management 62
Market-based 63
Discussion of financial differences between two types of restaurants 64
Findings of the Impact of the Recession on Financial Conditions and Performances 66
Findings of the recession’s impact on full service restaurants 66
Findings of the recession’s impact on limited service 68
Discussion of restaurant industry before and after the recession 69
CHAPTER 5. CONCLUSIONS 72
Implications 72

iv
Limitation 77
APPENDIX 1. A LIST OF SAMPLE RESTAURANT FIRMS 78
APPENDIX 2. DAILY TREASURY REAL YIELD CURVE RATES 80
REFERENCES 81

v
LIST OF TABLES
Table 1. SAS/ETS Time Series Forecasting System output of the parametric estimation
and the diagnose check an ARIMA (4, 2, 0) without constant model on limited
service restaurant data 40
Table 2. SAS/ETS Time Series Forecasting System output of the parametric estimation
and the diagnose check an ARIMA (4, 2, 0) without constant model on full service
restaurant data 40
Table 3. SAS/ETS Time Series Forecasting System output of the parametric estimation
and the diagnose check an ARIMA (4, 2, 0) without constant model on overall
restaurant data 40
Table 4. SAS/ETS Time Series Forecasting System output of the parametric estimation
and the diagnose check an ARIMA (4, 2, 0) without constant model on S&P 500 data 41
Table 5. Summary of statistics of ARIMA with intervention analyses (impact) 44
Table 6. Summary of statistics of ARIMA with intervention analyses (recovery) 45
Table 7. Dates of impact and recovery 46
Table 8. Summary of financial ratios 47
Table 9. Financial ratios comparisons of restaurants 49
Table 10. Summary of ratio statistics for full service restaurants 51
Table 11. Summary of ratio statistics for limited service restaurants 52
Table 12. Summary of ratio statistics for limited service restaurants: Wilcoxon signed
rank test 53

vi
ACKNOWLEDGEMENTS
I would like to express my most sincere gratitude and appreciation to many people
who have helped me throughout my studies.
I extend my heartfelt thanks to my committee chair, Dr. Tianshu Zheng, without your
guidance, patience, and constant encouragement this work would not have been possible.
Furthermore, I wish to thank my committee members, Dr. Thomas Schrier and Dr.
Frederick Lorenz, for their unflagging devotion to facilitating the achievement of my
academic objectives. Thanks very much for their time, patience, and assistance.
In addition, I would like to thank my family and friends, and especially my father for
supporting me through all my life’s endeavors.

1
CHAPTER 1. INTRODUCTION
Background
There were approximately 970,000 restaurants in the United States with the estimated
sales of $ 632 billion in 2012 (National Restaurant Association, 2012). The restaurant
industry is one of the largest private sector employers in the United States with about 12.9
million employees in 2012 (National Restaurant Association, 2012). As the foundation of
U.S. economy, the restaurant industry suffered during the recent recession (CBS News, 2009).
The cause-and-effect relationship was straightforward, after watching the deterioration of the
housing market, consumer confidence declined; as a result consumers started cutting back on
discretionary spending such as eating out (Barbardo, & Uchitelle, 2008). Sales and profits of
restaurant industry first began to slide in late 2007, the drop in sales and profits leading to
bankruptcy filings of restaurant chains such as Bennigan’s and closure of more than 600
Starbucks locations in 2008 (CBS News, 2009).
The restaurant industry was already suffered from the recent recession, the ever-rising
gas price definitely made it more challenging. According to Stensson (2012), the increase in
gas price had negatively effect on restaurant operations either on sales or operation side. In
general, restaurants has a relatively large proportion of customers on the lower end of income
scale, the rising gas price means less disposable income that could be spent in discretionary
areas like restaurants (Stensson, 2012). The corresponding impact was lower sales. On
operational sides, operators says due to fuel surcharges, supplier prices are higher, in average,
their sales were off 5% due to the elevated level of gas and energy prices (Stensson, 2012).

2
The Dow Jones U.S. Restaurants & Bars Index dropped about 13% in 2008 (CBS
News, 2009). This index includes 12 full service restaurants and limited service restaurants
such as McDonald’s, Starbuck, Olive Garden, Red Lobster and Ruby Tuesday (CBS News,
2009).
Some full service restaurants were negatively affected by the recent recession. For
example, the shares of Ruby Tuesday sink 85% due to high remodeling costs and falling
sales, the shares of Cheesecake Factory fell 60% in 2008 (CBS News, 2009). Even worse, the
private owned parent company of the Bennigan’s and Steak & Ale chains were forced to file
bankruptcy in 2008 due to the drop in sales and profits (CBS News, 2009). Full service
restaurants typically require customers to pay a tip, and their sale prices are higher.
Customers are frequently encouraged to purchase expensive add-ons such as drinks and
desserts. During the recession, people were extra sensitive to the high priced items; this
probably was the reason of sluggish sales of full service restaurants.
On the contrary, limited service restaurants are reported fared better due to lower
prices. For instance, shares of McDonald’s jumped about 5% due to the big increases in sales
of 2008, Darden’s shares rose about 1%, its Olive Garden chain was popular among diners
for being a good deal and offers all the salad that customers can eat (CBS News, 2009).
Is that true that different types of restaurants performed differently through the recent
recession? To come up to an answer to the question, one must first examine the impact of the
recession to the restaurant industry. To be more specific, how different types of restaurant
firms’ stock performance reacted to the recession differently through and after the most
recent recession? Did full service restaurants and limited service restaurants differ financially?
Were there any changes in financial conditions and performances of full service and limited

3
service restaurants before and after the recent recession? This study endeavors to find out
these differences between full service restaurants and limited service restaurants, therefore
find out the corresponding ways to improve their performances during a recession or similar
market downturn.
Purpose of Study
The first purpose of this study was to understand how different types of restaurant
firms reacted differently to the recession by examining their stock performances through and
after the most recent recession and the time it took for restaurants to recover. This is a two-
stage study. First of all, this study attempted to quantify the differences, if any, among the
impact of the recession had on different types of restaurant firms. Secondly, this study
attempted to identify the differences, if any, among the lengths of time between when the
recession ended and when their stock performance started showing significant recover. The
finding of this study is expected to help practitioners understand how different types of
restaurant firms behave through a recession or similar economic condition and cope with the
impact of such market condition. It will also help restaurant investors make more scientific
and informed decision in their investing activities through a recession.
Furthermore, full service restaurants and limited service restaurants represent
different market sectors of the food service industry, these restaurants are different in many
ways such as product line, service style, organization, structure and so forth, might they also
differ financially? To answer this question the author performs a financial ratio analysis
between full service restaurants and limited service restaurants to examine if their financial
conditions and performances were different. To be specific, thirteen ratios of pre-recession

4
period (2005 and 2006) were examined; the thirteen ratios were classified into five groups:
liquidity ratios, leverage ratios, profitability ratios, asset management ratios and market-
based ratios. This analysis will not only contribute to an in-depth understanding of financial
characteristics of full service and limited service restaurants, but also help the management
with possible solutions to their existing financial problems.
Lastly, in order to identify the changes in financial conditions and performances of
full service and limited service restaurants before and after the recent recession, the author
compared the aggregate ratios of restaurants in 2005 and 2006 (the years prior to the recent
recession) to the ratios of restaurants in 2010 and 2011 (the years after the recent recession).
Such analysis not only empirically examines the impact of the recent recession on U.S.
restaurants’ financial performances, but also provides some crucial managerial implications
for the U.S. restaurant industry.

5
CHAPTER 2. LITERATURE REVIEW
The Impact of the Recent Recession
According to the National Bureau of Economic Research (NBER), the United States
experienced an economic recession from December 2007 through June 2009 (The National
Bureau of Economic Research, 2010). It is believed that the recession was the worst one
since the Great Depression in terms of its duration and impact (Sum, Khatiwada, McLaughlin
& Palma, 2009). In the first 18 months of the recession, gross domestic product (GDP)
shrank by about 5.1% (Bureau of Economic Analysis, 2011). 10.6 million people became
unemployed and the unemployment rate reached 6.9% in the fourth quarter of 2008 (Borbely,
2009). In the autumn of 2008, months of trouble in housing, credit and financial markets
resulted in a stunning decline in stocks (Shinkle, 2008). The Dow Jones Industrial Average
tumbled by nearly 2,400 points, including a sharp 18% decline on a single week in late
September of 2008 (Shinkle, 2008). During the This Week interview by George
Stephanopoulos (2009), President Obama summarized the recession as “whether it’s retail
sales, manufacturing, all of the indicators show that we are in the worst recession since the
Great Depression.”
Recent history shows that recession depresses stock price (Lim, 2008). According to
Gitman, Joehnk & Smart, the intrinsic value of stocks is the present value of the future cash
flow of expected earnings discounted by a risk adjusted rate of return (2010). During the
economic recessions, the intrinsic value of stocks reduces since the ability of corporations to
generate future earnings diminished (Franz, 2010). Stock prices, measured by stock index
such as Standard & Poor 500 Stock Index or Dow Jones Industrial Average, experienced a

6
reduction during 2008 due to the concern that the earnings of corporations were going to
reduce because of the recession (Mulligan, 2009). In 2008, the S&P 500 experienced its
worst year since 1937 with 38.49% reduction in its value (Solin, 2011). The percentage loss
in the Dow industrial and Nasdaq Composite Index in 2008 is 33.84% (worst since 1937) and
40.54% (worst in history), respectively (Gaffen, 2009). The slumps of stock prices due to
recession further reduced business profit, which forced firms to slow production and lay off
employees.
According to Harvey (1989), reduction in earnings is the most common consequence
for most equities during the recession since the decease of the companies’ stock prices. The
recent recession had forced many corporations to cut or suspend payments to shareholders as
profits dropped. Howard Silverblatt, the senior index analyst at S&P, said that overall,
dividend cuts cost investors $58 billion in 2009 (Norris, 2010). In the first quarter of 2009,
64% of dividend announcements were negative (Norris, 2010). Decreased dividends lowered
shareholder’s confidence in the profitability of the companies; they chose to sell their shares,
this further lowered the stock price and depressed the stock market as a whole. Analysts at
Ned Davis Research describe the steep declines in early October of 2008 resemble the "type
of waterfall decline that occurs at the end of bear markets when fear feeds on itself" (Shinkle,
2008). In addition, stock volatility increases during recessions (Schwert, 1990). During the
recent recession, investment risk increased while returns decreased with higher market
volatility, therefore many investors were withdrew their investments on stock market and
migrated to less risky financial products, such as bonds. As the investment in stock market
declined, the overall stock market value declined.

7
The restaurant industry is vulnerable to economic downturns (Gu, 1993). For example,
eating and drinking places, the principal portion of the restaurant industry, which provides
about three fourths of the total employment opportunities in the restaurant industry, posted
17,600 job losses in November 2008, which was the fifth consecutive month of job losses in
the industry (National Restaurant Association, 2008). According to the statistics released by
Bureau of Labor Statistics, prior to the recession, eating and drinking places had not posted
job losses for five consecutive months since 1958 (National Restaurant Association, 2008).
The restaurant industry has low profit margins ranges between 2% and 6%, compared
to 20.4% of the most profitable industry such as network and other communications
equipment industry (Skidelsky, 2009; Anonymous, 2009). Rising food, commodity and gas
prices and increases in minimum wages placed increasing pressure on menu prices and profit
margins (Trowbridge, 2011). In addition, as the food and labor costs rose rapidly, the recent
economic recession also created major cash-flow problems for these restaurateurs who have
problems with get enough credit lines to cover investment and operating costs (Caplan, 2008).
Under these circumstances, some high profile restaurants filed for bankruptcy in 2008, such
as Bennigan's, Steak and Ale, and Metromedia Steakhouse, Buffets Holdings Inc., VICORP
Restaurants Inc., and Black Angus Steakhouse (Sheel, 2008). In addition, the decrease of
market demand made the environment more challenging for the restaurant industry. Korkki
(2008) found that during the recession, in order to prevent personal financial ruin, people
simply choose not to dine out to reduce expenses. According to 2008 annual report on eating
patterns in America, 72% of all meals were homemade, the average American had a meal at a
restaurant 79 times, a history new low (The NDP Group, 2009). In 2008, the $550 billion U.S.
restaurant industry suffered from the sluggish sales for the first time in nearly two decades

8
(Caplan, 2008). According to Warren Solochek, the vice president of NPD Group, the
industry had lost 2 billion visits due to the recent recession (Ruggless, 2010).
In addition, a research done by United States Department of Agriculture showed that
food prices increased substantially during the early stage of the recession (Kumcu &
Kaufman, 2011). In 2008, the annual rate of food price inflation was 5.5 percent when the
food prices peaked. The average annual growth rate of food prices between 2007 and 2009
was almost 3.8 percent; this is undoubtedly a double squeeze of lower incomes and higher
food prices for customers to reduce food spending (Kumcu & Kaufman, 2011). According to
the Economic research service of USDA, during the recent recession, the food away from
home spending, such as at fast food restaurants or full service restaurants, declined 11.5
percent while the spending in grocery aisle increased as a result of consumers replaced
restaurant meals with at home eating (Kumcu & Kaufman, 2011).
As the unemployment rate had soared and consumers curtailed spending, the National
Restaurant Association’s performance index shows that the industry had been shrinking for
23 months in a row ending November of 2009 (Newman, 2009). In November of 2008, the
Dow Jones U.S. Restaurant & Bars Index, which includes 12 leading restaurant firms,
slipped about 12% (Rosenberg, 2009).
The recent recession adversely affected the stocks of restaurant industry. In February
of 2009, the stock price of the top 26 restaurant companies lost an average 49.3% of their
value from their highest points over the past 52 weeks (Krantz, 2009). Some individual
restaurants and their investors even suffered more— Ruth’s Hospitality (RUTH), which runs
the Ruth’s Chris Steak Houses; DineEquity (DIN), operator of International House of

9
Pancakes (IHOP) and Applebee’s; and Ruby Tuesday (RT) have all seen their stock fall
nearly 90% (Krantz, 2009).
Differences among Different Types of Restaurants
Even though all types of restaurants share the common characteristics such as require
a large amount of labor to produce products and services, seasonal fluctuation in sales,
different restaurant segments tend to perform differently through the recession since they
have different styles of operation, target customers and financial characteristics (Gu, 1996).
For example, full service restaurants generally rely on high profit margin, the sales of full
service restaurant are mainly from customers’ discretionary expenditure, when recession
comes, customer sentiment and household income are lower, full service restaurants are the
first to feel the effects (Youn & Gu, 2010). Fast food restaurants, on the other hand, rely on
the large sale volume to compensate the low profit margin; their sales are primarily from
consumers’ necessity expenditure therefore they have more steady revenues (Youn & Gu,
2010). As another example, the second highest cost in restaurant industry-labor costs, are
24.2% and 29.8% of sales for limited service restaurants and full service restaurants,
respectively (Nelson, 2001). The 5.5% difference represents more routine activities are
executed in the limited service restaurant industry (Nelson, 2001). Consider the labor-
intensive nature, full service restaurants are more vulnerable to change in labor and benefit
costs. These differences may have eventually resulted in the different performances of full
service and limited service restaurants during the recession. For instance, limited service
restaurants may fare better than full service restaurants due to their lower menu price and
labor costs.

10
Stock Index
A stock index is a list of stocks put together to measure the composite value and to
track performance of its components of the stock market (U.S. Securities and Exchange
Commission, 2007). It is a tool used to represent the common characteristics of its
component stocks, such as trading on the same stock market exchange, belonging to the same
industry, or having same market capitalization (U.S. Securities and Exchange Commission,
2007). News and financial service firms use stock indices as benchmarks to evaluate the
performance of investment portfolios while investors use stock indices to assist them in their
investment decisions (U.S. Securities and Exchange Commission, 2007). Stock indices are
highly convenient tools to assess general trends in the stock market.
The major stock indices in the U.S. include Dow Jones Industrial Average (DJIA),
New York Stock Exchange (NYSE) Composite Index, National Association of Securities
Dealers Automated Quotations (NASDAQ) Composite Index, American Stock Exchange
(AMEX) Composite Index and Standard & Poor’s 500 Index (S&P 500). Stock indices use
various methods to determine their value. Dow Jones Industrial Average adopted the price-
weighted method. In a price-weighted index, the price of each component stock is the only
consideration when determining the value of the index (Dow Jones Indexes, 2011). The
calculations are simply adding the price of each stock, and then divide this by the total
number of stocks. Regardless of the actual size or numbers of shares outstanding of the
companies, stocks with higher quoted price received greater proportions of weighting in the
index therefore have a greater impact on the performance of the index. In contrast, NASDAQ
Composite Index, NYSE and S&P 500 Index employed a market-value weighted, also known
as the capitalization-weighted method (S&P Indices, 2011). This method factors in the size

11
of the company. Market capitalization means the value of a corporation determined by
multiplying the stock price of a share by number of total outstanding shares (U.S. Securities
and Exchange Commission, 2007). A relatively small shift in the price of a large company
therefore will heavily influence the value of the index (Standard & Poor’s, 2011).
A weighting based on the market cap is thought to be more effective than price
weighting on tracking stocks’ performance (Handley, 2011). For instance, in price-based
weighting system, a stock split changes the weight of a company in the index, even there is
no fundamental change in the business. Under market-value or capitalization-weighting
system, there is no need to adjust for the stock splits. Morningstar analyst Paul Justice
summarized the twofold advantages of market-value weighted index, “it was really reflective
of the overall stock market, and two, that it minimized the turnover costs,” he added,
“basically, a stock would reweight itself just as its price appreciated, you don’t have to
rebalance that index” (Handley, 2011).
Financial Ratio Analysis
Overview
Introduction
Like most of other industries, Generally Accepted Accounting Principles (GAAP)
requires hospitality industry issues financial statements to provide basic information of a
company on a periodic basis (Raymond, 2007). When it comes to effective financial
management or scientific investment, the figures on the financial statements is not enough
since the figures cannot be compared against standard or expected criteria (Schmidgall,
Hayes, & Ninemeier, 2002). However, these figures can be more useful and meaningful

12
when they converted into ratios. Ratios are computed by dividing a number by another, they
express the direct relationship between two items for the same accounting period (Schmidgall,
Hayes, & Ninemeier, 2002). A ratio can be expressed in different ways such as percentage,
decimals, times, dollars, or on a per-unit basis.
Ratios can be used to trend or time-series analysis to assess a company’s performance
over time, they are also can be used to cross-sectional analysis, for example, they can be used
as a measurement to compare with different firms at the same point in time, benchmarks of
previous years, industry standards or management goals (Jagels, & Coltman, 2004). Jagels, &
Coltman summed up ratio analysis as a tool people used to compare related information such
as two figures, quantity values or numerical dollar values by conduct a quantitative
evaluation of information from a corporation’s financial statements such as balance sheet, the
statement of cash flows and income statement (2004). Thus, with the help of financial ratio
analysis, financial statement readers can evaluate the financial position or performance of a
company or detect trends over a longer period more easily.
Users
Ratio analysis is a major tool used by financial managers and analysts, it involves the
methods of calculating and interpreting financial ratios to evaluate a company’s financial
condition and performance. Ratio analysis is an accounting tool to present accounting
variables in a simple, concise, intelligible and understandable form. The main objectives of
ratio analysis include examine earning capacity, financial soundness and operating efficiency
of a company (Chatfield, & Dalbor, 2005). Most of financial statements users find ratio
analysis helpful. Generally speaking, there are three groups of people are interested in ratios:

13
managers, current and potential creditors, and the company’s owners or stockholders
(Chatfield, & Dalbor, 2005).
The main responsibilities of managers include profit maximization, controlling cost,
and safeguarding assets (Coltman, 1979). By analyzing ratios, mangers could monitor the
company’s performance against pre-set goals, industry average, or benchmark of prior years
to determine if the operating objectives are being achieved, to evaluate the effectiveness and
financial viability of the operation, to assess current liquidity position and other economic
positions to satisfy owners and creditors (Jagels, & Coltman, 2004).
Creditors, by definition, are the entities (organization or person) that extend credit or
loan money to a company (Jagels, & Coltman, 2004). Therefore, naturally, they pay attention
to the ratios that served as indicators of the safe level of their loaned money or trade credit.
Current and potential creditors also interested in certain ratios that they could use to estimate
the risk of future loans that the company may need (Jagels, & Coltman, 2004).
For owners or shareholders, they particularly interested in the ratios that they could
adopt to measure the return on investment, to estimate the risk level of the investment, and to
assess the probability of success of future operations (Coltman, 1979). Shareholders can use
certain ratios to assess the ability of a company to pay dividends, to help them make
informed investment decisions such as whether they should buy shares from a particular
company, and the timing to sell or hold on to the shares they already own (Coltman, 1979).
Advantages & disadvantages
There are various advantages of ratio analysis. First of all, ratios are user friendly and
they can be easily calculated. An analysis of ratios highlights the crucial information in a
simple form. Users do not have to read the whole financial statements; they can get the

14
information they want by looking few numbers in ratio analysis. Secondly, ratio analysis
helps the company in comparing the benchmark established by management and industry
standard (Jagels, & Coltman, 2004). In the other words, ratio analysis helps management in
assessing the operating efficiency of the company. Thirdly, ratios can pinpoint the problem
areas (Jagels, & Coltman, 2004). By locating the weak spots, managers can then pay
attention to the weakness and take remedial actions. Last, ratios help in trend analysis,
business planning, and forecasting (Jagels, & Coltman, 2004).
Despite its usefulness, ratio analysis also has limitations. Some key disadvantages
include the following. First of all, financial statements contain estimates and assumptions.
Accounting standard allow different accounting methods (such as depreciation and inventory
valuation methods); under this situation, ratio analysis is less useful due to the impaired
comparability (Raymond, 2007). Second, ratios highlight the problems but cannot solve them
(Raymond, 2007). Third, ratios can be misleading if they are not properly interpreted
(Raymond, 2007). Last, ratio analysis by its nature explains the relationships between past
information, but users are more interested in current and future information (Raymond, 2007).
Summary of ratios
Liquidity
Liquidity ratios are the category of ratios that reveal a company’s ability to meet its
approaching obligations without difficulty (Moyer, McGuigan, & Kretlow, 2001). A
company may be profitable in its income statement, but lacks of cash to pay its bill on time;
this can lead to financial difficulties even bankruptcy. Liquidity ratios measure a company’s
ability to remain liquid —in other words, a company’s ability to provide adequate cash to

15
conduct business in a reasonable period of time (Raymond, 2007). Creditors and investors
are typically interested in this category of ratios; with the knowledge of whether a company
can pay its bill without borrowing money can help assess the risks of investment (Jagels, &
Coltman, 2004).
The two most frequently adopted ratios in assessing liquidity are the current ratio and
the quick ratio. The current ratio indicates the relationship between current assets and current
liabilities (Moyer et al., 2001). It is also called the working capital ratio. The equation is,
Current ratio= !"##$%& !""#$"!"##$%& !"#$"!"%"&'
Liquidity ratios assume that the current assets are the major source of funds to pay
current obligations. Current assets consist of cash on hand or in the bank, and any other
assets that can be converted to cash within an operating period of 12 months, for instance,
marketable securities, account receivable, notes receivable, inventories, and prepayments.
Included in current liabilities are accounts payable, notes payable, the current portion of
long-term debt due, other payables, taxes, and wages due (Moyer et al., 2001).
Calculations can be easily done by use of the formula below, however how to
interpret the ratios is the thing really matters to the users of ratio analysis. The interpretation
of this ratio is illustrated in the following example. Suppose that the current ratio calculated
for a company in a given year is 1.4, the interpretation of the current ratio is 1.4 to 1; this
result means that for every dollar of current liabilities, there is $1.4 of current assets. Another
way to state this result is the current assets are 1.4 times larger than the current liabilities.
In general business, the rule of thumb developed for organizations with large amounts
of inventories is to use a ratio of 2.0 (Schmidgall, Hayes, & Ninemeier, 2002). Since food,
beverage and supplies are the only current inventories for restaurant industry, the thumb of

16
rule for restaurants is less than 1 to 1 (Schmidgall, Hayes, & Ninemeier, 2002). It means with
a current ratio less than 1 to 1, restaurants can operate without difficulties in paying its
current liabilities.
Generally speaking, the larger the current ratio, the less difficulty a firm should
encounter in paying its bill. Financial institutions like banks often have the term stated that
the borrower to maintain a specific current ratio, a violation of the loan agreement could lead
the lender to demand immediate full payment (Schmidgall, Hayes, & Ninemeier, 2002).
Potential and current creditors like to see a high current ratio, since too low a ratio leads to
difficulties in paying bills, however, owners prefer a low current ratio, too high a ratio
sacrifices profitability, as the money tied up in working capital (current assets minus current
liabilities) is not earn income (Jagels, & Coltman, 2004). Therefore, management of a
company must try to maintain an acceptable current ratio for both creditors and owners, that
is, a current ratio that does not create problems to pay short-term liabilities or sacrifice
profitability.
The interpretation of the current ratio needs more than industry standards and
comparison with other ratios (Jagels, & Coltman, 2004). For instance, two companies may
have the same current ratio, however, one company may be in a better liquidity position
suppose it has large amounts of cash and short-term investments compared to the other
company that may have large amounts of account receivable and inventories. To overcome
the limitations of the current ratio, the acid test ratio (also known as quick ratio) was
developed to exclude the less liquid current assets such as inventories and prepaid expenses.
The formula of quick ratio is,
Quick ratio=!"#$! !""#$%&' !"#"$%&'("! !"#$%&"'(% !"#$%&'&"!!"##$%& !"#$"!"%"&'

17
It is also can be expressed as following,
Quick ratio=!"##$%& !""#$"! !"#$"%&'!$(! !"#!$%& !"#!$%!%!"##$%& !"#$"!"%"&'
Quick assets referred to the part of current assets that can be readily converted to cash
readily. The less liquid current assets, such as inventories and prepaid expenses, are
subtracted from current assets (Moyer et al., 2001). The quick ratio is a stringent version of
current ratio. There is an important assumption behind the quick ratio is that a company’s
account receivable may be converted into cash within a normal collection period and with a
little shrinkage, or within a period of time for which credit initially was granted (Moyer et al.,
2001).
Leverage
Total assets in any business could be financed mostly by either equity such as shares
and retained earnings or debt (Moyer et al., 2001). Financial leverage management ratios
show the balance between these two finance methods (Moyer et al., 2001). Financial leverage
is a term that refers to a firm using debt rather than equity to finance its assets to increase the
return on equity. Financial leverage management ratios indicate the degree of financial
leverage employed by a company and the ability of a company to repay its financial
obligations when the due date is approaching (Moyer et al., 2001).
Ratios under this category typically are of interest to lenders and owners (Schmidgall,
Hayes, & Ninemeier, 2002). Both long-term and short-term lenders are concerned with the
degree of leverage a company used since it indicate the risk they may be taking if they lend
money to the company. Lenders prefer companies with light to medium use of debt since
there is less protection and more risk involved with a company that is heavily financed by

18
debt in the event of bankruptcy (Schmidgall, Hayes, & Ninemeier, 2002). Lenders want to be
assured that they will be repaid. An example is illustrated as following. Suppose that 80% of
a company’s assets are financed by debt, the lender’s funds are in a danger if the value of the
assets shrink by only 20%. In contrast, if a company’s assets are financed with only 20
percent debt, the assets value can decline 80% before putting lenders at risk.
Owners are interested in financial leverage, but for a different reason. Owners often
want the firm to use more debt to increase the rate of return on their investment of capital
(Schmidgall, Hayes, & Ninemeier, 2002). It makes sense if the company can earn more than
the cost of the borrowed funds, however, if earnings are less than the cost, the company is
better off not borrowing. For instance, if a company can borrow money at 8% and use it at
12%, then the earning is the 4% difference that will increase the rate of return to the owners.
On the contrary, if the company can earn only 3%, then the 5% difference are unfavorable to
the owners.
Both income statement and balance sheet data can be used to calculate a company’s
use of leverage. The balance sheet approach is more static since it measures leverage at a
specific point in time and focuses on total debt. The income statement approach is rather
dynamic (Schmidgall, Hayes, & Ninemeier, 2002). Both approaches are used widely in
practice.
It is quite common to use debt in the hospitality industry. Another advantage in
addition to increasing returns is that the interest expense is tax deductible under American
system of taxation (Coltman, 1979)). However, companies must use debt cautiously since the
more use of debt, the more risk and chance for bankruptcy.

19
Ratios under this category include debt ratio, the debt-to-equity ratio, the time interest
earned ratio.
The formula for debt ratio is as follows,
Debt ratio= !"#$% !"#$!"#$% !""#$"
The term ‘debt’ used here refers to all short-term liabilities and long-term borrowing.
From the formula, it is obvious that the debt ratio calculates the percentage of a company’s
assets financed by lenders (Moyer et al., 2001).
Bondholders and other long-term lenders are typically interested in debt ratio of a
company (Schmidgall, & DeFranco, 2004). A low debt ratio is favorable to them because the
company offers more protection in the event of liquidation or other major financial problems
(Chatfield, & Dalbor, 2005). A company’s fixed-interest charges increase as debt ratio
increases. A high debt ratio may encounter problems such as insufficient cash flow needed to
pay interest during an economic recession (Chatfield, & Dalbor, 2005). As debt financing
reaches a certain level, it is harder and harder to raise new funds by debt since the implied
high risks perceived by investors (Chatfield, & Dalbor, 2005).
Proportionate equity base refers to the percentage of assets financed with equity
(Moyer et al., 2001). Therefore, a high debt ratio implies a low proportionate equity base.
Traditionally, the hospitality industry has a range between 60% to 90% of debt and 10% to
40% of equity (Schmidgall, Hayes, & Ninemeier, 2002).
One thing the debt ratio users should pay attention to is that this ratio is based on
assets at their book value. In hospitality industry, if a hotel or restaurant owns its land or
buildings, the debt ratio could be misleading since in this calculation the book value was used
(Schmidgall, Hayes, & Ninemeier, 2002). Land and buildings usually appreciate over time, if

20
fair market or replacement value of assets were used, then this ratio would decline and
probably more precise to the true situation (Schmidgall, Hayes, & Ninemeier, 2002).
The definition of debt-to-equity ratio is,
Debt-to-equity= !"#$% !"#$!"#$% !"#$%&
Actually, the debt-to-equity ratio is not really a new ratio, it is a different format of
the debt ratio. The similarity of debt ratio and the debt-to-equity ratio is that both ratios
examined the amount of a company’s financing with debt and equity. This ratio also is stated
in percentage.
Lenders are interested in this ratio, too. Suppose that a company’s debt-to-equity ratio
for a given year is 1.9, which means for each dollar invested by stockholder, the lenders have
invested 1.9 dollar. The higher the lenders’ investment for each dollar of stockholder’s
investment, the higher the risk for lenders (Coltman, 1979). Under such circumstances, debt
financing would be more difficult and the interest rates would be higher. To the owners of
companies, the higher the debt-to-equity ratio, the more profit so they want it as high as
possible (Coltman, 1979). A high debt-to-equity ratio is also known as having high leverage.
The formula for time interest earned ratio is stated as follows,
Times interest earned= !"#$%$&' !"#$%" !"#$%$&# !"# !"#$% (!"#$)!"#$%$&# !"#$%&'
This ratio is also called the interest coverage ratio. Used the data from income
statement, this ratio measures a company’s use of leverage. This ratio adopts EBIT figures
since a company pays interests out of operating income, that is, EBIT. EBIT used in this ratio
is rarely expressed as such on the income statement; a simple way to calculate EBIT is add
back income taxes and interest charges to net income (Moyer et al., 2001). This ratio

21
indicates how many times that the interest expenses could be paid given the company’s
operating income and interest charges for a specific period (Moyer et al., 2001).
All parties including lenders, owners, and management are concern with a company’s
ability to meet interest payments (Coltman, 1979). All parties like to see this ratio as high as
possible. From lenders’ perspective, a high number suggests there are low risks involved and
that the company will be able to pay its interest charges on time (Coltman, 1979). A high
number is also desirable, particularly if a company has a high debt-to-equity ratio. To
management, high ratio is preferred since it pleased both lenders and owners (Schmidgall,
Hayes, & Ninemeier, 2002). However, an extremely high interest coverage ratio might
indicate that financial leverage is not being maximized (Schmidgall, Hayes, & Ninemeier,
2002). When this ratio falls below 1, it indicates the possibilities of failing in paying interest
charges when due, thus it threatens a company’s continued viability, even lead to bankruptcy.
Profitability
The main purpose of most corporation operation is to generate a profit. In an
incorporated corporation, the profit can be paid as dividends or be retained to expand
business to increase the profits further (Moyer et al., 2001). In a partnership or proprietorship,
the owners can withdraw the profit to increase their personal net worth or can left the profit
in the business to expand it. Creditors also value the profitability of a company, because the
higher the profits, the less the risk to lend their money to the company. Therefore, one of the
major tasks of management is to ensure an increasing stream of earnings. Profitability ratios
are often used to measure how effectively a company’s management is generating profits on
sales, total assets, and stockholders’ investments (Moyer et al., 2001).

22
Anyone whose economic interests are tied to the long-run survival of a company will
be interested in profitability ratios (Schmidgall, Hayes, & Ninemeier, 2002). However, one
must be cautious using the word “profitability”. For example, a firm may have a net income
on its income statement, and this net income, expressed as a percentage of revenue, may
seem acceptable. However, the relationship between this net income and other items, such as
the amount of money invested by stockholders, may not be acceptable (Schmidgall, Hayes, &
Ninemeier, 2002).
The most frequently used profitability ratios include gross profit margin ratio, the net
profit margin ratio, the return on investment ratio, and the return on stockholder’s equity ratio.
The formula for the gross profit margin ratio can be expressed as following,
Gross profit margin= !"#$%! !"#$ !" !"#$!!"#$! (!"#"$%")
It measures the relative profitability of the difference between a company’s sales and
cost of sales, the purpose this ratio is to reveal how efficiently the company’s management is
making decisions regarding pricing and the control of production costs (Moyer et al., 2001).
Differences in inventory accounting methods, or, to be more specific, depreciation methods
used by a company will influence the cost of sales, therefore influence the gross profit
margin (Moyer et al., 2001).
The formula for net profit margin ratio can be written as,
Net profit margin=!"#$%$&' !"#$% !"#$% (!"#)!"#$!
It measures the overall effectiveness in generating sales and controlling of costs of a
company’s management (Moyer et al., 2001). Say if a company’s net profit margin ratio is
5%, it means that the company is earning 5 cents of net income out of each $1.00 of sales

23
revenue. This margin vary widely in the hospitality industry, the management usually
compares this ratio to industry average (Jagels, & Coltman, 2004). If it is below the industry
average, it indicates that the company might be having difficulties in controlling total
expenses or prices of its products. Additionally, although the net profit margin ratio may
seems somewhat low, it may translate to a large amount of dollars in absolute terms (Jagels,
& Coltman, 2004).
The return on investment ratio (ROI) is calculated as follows,
Return on investment=!"#$%$&' !"#$% !"#$% (!"#)!"#$% !""#$"
It is also called the return on assets ratio. This ratio compares a company’s net income
to the total asset investment for a given period of time (Moyer et al., 2001). It indicates the
effectiveness of management have employed asset to generate profits for owners (Moyer et
al., 2001). Noted that if the total assets changed significantly during the period, it is more
appropriate to use an average figure to calculate this ratio. A significant new investment in
total assets could make the ratio much lower. Another factor should be considered is that the
mount of depreciated fixed assets will affect this ratio. The denominator will be lower if there
is a large amount of depreciated assets and therefore make this ratio appears higher.
The definition of return on stockholder’s equity ratio is as follows,
Return on stockholder’s equity= !"#$%$&' !"#$% !"#$% (!"#)!"#$%!"#$%&'’ !"#$%&
This profitability ratio indicates the rate of return that a company earned on
stockholder’s equity during the period, it shows how well the management use equity funds
to generate profits (Moyer et al., 2001). Similar to the ROI ratio, the denominator in this ratio
can be an average for the period. Investors value and analyze this ratio when they considering

24
an investment. Because of the denominator only includes stockholders’ equity, this ratio is
directly affect by the amount of financial leverage used to finance assets. The more financial
leverage is used, the higher the expected return for shareholders, the high risks associated
with the investment (Moyer et al., 2001).
Asset management
Asset management ratios, as indicates in its name, show how efficiently management
uses its resources, sometimes referred as activity ratios or turnover ratios (Moyer et al., 2001).
They are indicators of the amount of investment in particular type of asset related to the
profit the asset is generating. One main objective of management is to allocate resources
properly among various asset accounts such as cash, account receivable, inventories, property,
equipment and so forth (Moyer et al., 2001). A company can be more effective in generating
profits if the company’s asset structure is proper. Financial analysts compare the asset
management ratios for various accounts of a company with industry norms to determine how
well the management is distribute its resources. Asset management ratios are also used by
managers to make plans.
Asset management ratios discussed in this section includes the inventory turnover
ratio, the fixed-asset turnover ratio, and the total asset turnover ratio.
The formula for the inventory turnover ratio is as follows,
Inventory turnover= !"#$ !" !"#$!!"#$%&# !"#$"%&'(
The cost of sales is usually can be found on a company’s income statement, while
average inventory can be calculated in various ways. It can be calculated by adding the
figures for the beginning and ending inventories for the year and dividing by 2, this is

25
typically applied to the situation that a company has continuing growth in sales (Moyer et al.,
2001). It also can be computed by taking more periods into account if the data is available,
and it is a more precise method for companies that have seasonal or fluctuating sales. Some
analysts calculate inventory turnover using the inventory of end of the year (Moyer et al.,
2001).
The inventory turnover ratio is be used to compare with previous periods or industry
average (Moyer et al., 2001). In restaurant industry, a low inventory turnover ratio is an
indicator of unpopular items or an investment that purchase too much inventory (Raymond,
2007). On the contrary, a high inventory turnover ratio may be facing out of stock of certain
items wanted by customers frequently and this may results lose sales to competitors
(Raymond, 2007). In hospitality industry, management must manage inventory carefully and
try to maintain a balanced range of this ratio due to the expenses of storing it.
The definition of total turnover ratio is as follows,
Total asset turnover= !"#$%!"#$% !""#$"
This ratio indicates the effectiveness of management uses it total resources to
generate sales, it suggests the changes, if any, in the use of total assets (Moyer et al., 2001).
In the United States, this ratio indicates how many dollars of sales are generated for every
dollar of assets. All parties, such as owners, lenders and management, are like to see a
relatively high total asset turnover ratio, are like to produce revenue as high as possible from
the asset base.
Market-based ratios
This group of ratios indicates a company’s financial market’s assessment of
performance (Moyer et al., 2001). Typically analysts and investors are interested in this

26
group of ratios. Market-based ratios are related to the ratios discussed in the previous
paragraphs, they should parallel these ratios. For instance, if the accounting ratios indicate
that a company has more risks than the average of the industry and lower profit prospects,
this information should be reflected in a lower marker price of that company’s stock. Two
ratios are under this category are price-to-earnings (P/E) ratio and market (price)-to-book
(value) (P/BV) ratio.
The formula for price-to-earnings ratio is as follows,
P/E= !"#$%& !"#$% !"# !"#$%!"##$%& !"#$%$&' !"# !"#$%
Some analysts use next year’s expected earnings per share in the denominator, but
this is an alternative definition. Comparisons be done on the same basis (Moyer et al., 2001).
Generally, the lower the company’s risks, the higher the P/E ratio should be. In addition,
companies with high P/E ratios are usually considered to have good prospects for strong
growth in future earnings, but companies with low P/E ratios are considered to have poor
prospect for future earnings growth.
Investors are typically interested in P/E ratio because it allows them to easily compare
this ratio with the return they can receive from other alternative investments (Raymond,
2007). In public companies, investors always have the options to withdraw their investment
by selling their shares back to the stock market if they are unsatisfied with their return, they
can always reinvest their money to some more ‘profitable’ companies.
Management should note that if many investors with large shareholdings withdraw
their investment, the market price of the shares would be further depressed (Jagels, &
Coltman, 2004). In turn, raising money when needed in future would be more difficult, since

27
potential buyers are reluctant to invest their money. The P/E ratio is greatly affected by how
buyers and sellers of those shares perceive the risks involved in the investment, the potential
growth of the earnings, and the trend of earnings. Therefore, management should try to
maintain the P/E ratio as high as possible to satisfy investors and owners.
The definition of market (price)-to-book (value) (P/BV) ratio is as follows,
P/BV= !"#$%& !"#$% !"# !"#$%!""# !"#$% !"# !"#$%
The book value per share is calculated by dividing the total common stockholders’
equity of a company (total assets minus total liabilities) by the number of shares outstanding
(Moyer et al., 2001). Noted that stockholders’ equity is affected by the accounting methods
employed by a company such as inventory valuation and depreciation, thus comparisons
between companies could be misleading.
In general, the higher the rate of return on stockholders’ equity to the cost of common
equity, in the other words, investors’ required return, the higher the P/BV ratio (Moyer et al.,
2001).
Studies used financial ratio analysis
Financial ratios used in non-hospitality industries
At the very beginning of the finance as a discipline, analysts have used ratios to
evaluate firms’ financial health (Lawder, 1989). Many studies use financial ratios as the
warning signals to predict potential bankruptcy. The implied logic is that most bankruptcies
happened in a foreseeable manner, that is, the factors that triggered the bankruptcy may
appear much earlier than the actual time of bankruptcy (Gu, 2002). Van Horne (1998)
suggests that ratios can be used to detect the financial “illness” of a firm; therefore the

28
probability of bankruptcy can be accessed through financial ratio analysis. In the literature,
ratios are widely used as predictors of bankruptcy or failure. In 1966, Beaver studied the
predictive power of 30 financial ratios separately to predict financial failure 5 years prior to
the ultimate failure. According to his finding, the five best predictive ratios are cash flow/
total debt, net income/ total assets, total debt/ total assets, working capital/ total assets and
current ratio (Beaver, 1966). After Beaver’s study, many studies adopted multivariate
approaches to predict business failure (Deakin, 1972; Blum, 1974; Dambolena, & Khoury,
1980; Taffler, & Tisshaw, 1977; Taffler, 1982). For instance, Altman (1968) paired a
bankrupt group of 33 manufactures with a group of 33 non-bankrupt firms. The five ratios he
used were working capital/ total assets, retained earnings/ total assets, earnings before
interest and taxes/ total assets, market value of equity/ par value of debt, and sales/ total
assets. By using multivariate bankruptcy model, using ratios 1 year prior to the failure, the
predictive accuracy was 95% and 79% for the within samples firms and holdout sample firms,
respectively (Altman, 1968).
Financial ratios used in hospitality industries
Financial ratio analysis is also commonly used in hospitality industry. Schmidgall
(1989) focused on identifying the most important financial ratios as perceived by general
managers, executives, bankers and lodging industry owners, finding that different groups of
financial users perceived different degrees of importance to the various financial ratios. For
instance, operating and activity ratios are the most important ratios used by general managers.
Owners, by their very nature, value profitability ratios the most. Executives give liquidity
ratios more importance while bankers considered solvency ratios more important.
Profitability and activity ratios were the most important tools for financial executes.

29
In 2002, Singh, & Schmidgall further studied the rating of ratios used by US lodging
financial executives. Importance and frequency of various ratios were measured by a six-
point scale from 0-5 where 0 indicates “no opinion”, 1 indicates “unimportant” and 5
indicates “crucial”. Their analysis revealed that financial executives in lodging industry are
very interested in activity and profitability ratios.
Schmidgall, & DeFanco (2004) focused on the club segment of hospitality
management industry. They reviewed the financial history of the club industry, found the
most frequently adopted and most important ratios used in club industry, set up the
benchmarks for the industry. The data were collected by distributing questionnaires to 500
randomly chosen club managers. The respondents were asked to provide information for
balances of accounts in the balance sheet, the statement of activities, and the statement of
cash flows, and then the authors used the above information to calculate ratios. The
respondents were also asked to rank 10 most important financial ratios used in their club. The
most often used ratios were payroll cost percentage, cost of food sold percentage, cost of
beverage sold percentage, current ratio, and inventory turnover. The five most important
ratios chosen to determine the success of a private club were gross profit percentage, cost of
food and beverage sold percentage, cost of food sold percentage, cash flow to debt, and mix
of sales. At last, the authors suggested that ratio analysis can be an efficient financial and
diagnostic tool if the users choose appropriate ratios and set realistic standards for the
operations, fully comprehend the numbers behind the ratios, are able to take corrective
actions after the problems were detected and lastly, review the ratios on a monthly or yearly
basis.

30
Upneja, Kim, & Singh (2000) studied the casino industry. This study examined the
differences in financial characteristics between small and large casinos by examining the
financial ratios from 50 publicly traded casino firms listed on the New York Stock Exchange,
the American Stock Exchange, and NASDAQ. Using data retrieved from COMPUSTAT for
the fiscal year 1995, eleven financial ratios measuring liquidity, solvency, efficiency, and
profitability were examined to determine if there were differences between small and large
firms. Using median split, 50 casinos were classified into large firms and small firms. Sharp
differences were found between small and large casino firms, for instance, small casinos had
a higher liquidity ratio while lager casinos have higher percentage of long term and total debt.
Large casinos have lower efficiency ratios, however, they are also more profitable.
Gu (1993) specifically examined the impact of the use of debt on profitability of the
restaurant industry by first examining the capital structure and profitability of the restaurant
industry. According to the ranking of their debt uses calculated by long-term debt to total
capitalization ratio (LTDTC), the author divided 63 publicly traded restaurant firms into
three equal sized groups: light-debt group, medium-debt group and heavy-debt group. The
author further divided the 63 restaurant firms based on their services to study the capital
structure and profitability of different types of restaurants. These three types are full service
fine dining restaurants, economy/ family restaurants and fast food chains. Three profitability
ratios were analyzed on comparison basis: profit margin (PM), return on assets (ROA), and
return on equity (ROE). Through analyses, the author suggests that in restaurant industry,
which is sensitive to economic downturns and subject to seasonality, light use of debt, as
adopted by fine dining restaurants may be optimum. Moderate use of debt, as adopted by fast
food chains, usually brings higher return with substantial risks to investors. Heavy debt use,

31
which is common for the economy/ family restaurants’ capitalization, is disadvantageous to
the profitability.

32
CHAPTER 3. DATA AND METHODS
Study Design
This study designs to answer three sets of questions related to the restaurant industry
in U.S. during and after the recent recession. The first set of questions are: (1) how the recent
recession affect the stock market of restaurant industry in U.S., (2) how different types of
restaurants behave differently through and after the recent recession, and (3) if there is lag
time between the recession ended and the stock market showed significant recover, what is
the differences in the length of the lag time between these two types of restaurants.
To gain an in-depth perspective, the author raised a second sets of questions. It is
known that different types of restaurants have different characteristics, such as different
production lines, different target customers, different styles of service and so forth. Might
they also financially different from each other? If so, which areas are different?
Lastly, what had changed in financial conditions and performances of each type of
restaurants after the recent recession? Are there any deteriorations or improvements?
Answer these three sets of questions required three different sets of data and methods.
To give the readers a clear view of how each set of data are collected and the analysis process,
the author organized the following section by steps involves to solve each set of questions.
Impact of Recession on U.S. Restaurants Stock Market
Restaurant classification
In this study the author used the North American Industry Classification System
(NAICS) to classify the sample companies. The North American Industry Classification
System (NAICS) was adopted by Federal statistical agencies in 1997, replaced the 1987

33
Standard Industrial Classification System (SIC) (NAICS main page, 2011). It is a unique
North American industry classification system for classifying business establishments; it was
developed in purpose of promoting uniformity and comparability of data collection, analysis,
and publication (NAICS main page, 2011).
To understand how different segments of restaurant firms behave differently through
the recession, the author divided the sample restaurant companies into full service restaurant
segment and limited service restaurant segment. Full service restaurant segment comprises
companies primarily engaged in providing food services to customers who order and are
served while seated (i.e. table service), and pay the tab after eating (2007 NAICS Definition,
2011). For limited service restaurant segment, customers usually order and pay before eating
(2007 NAICS Definition, 2011). Most of this kind of restaurants does not have waiter or
waitress; some provide limited service. The limited services included cook to the orders,
bring food to seated customers and provide off-site delivery.
Data collection
Restaurant companies that were publicly traded in the U.S. stock market between
January 2005 and December 2010, a total of 313 weeks, were included in this study. All
companies with a North American Industry Classification System (NAICS) code of 722110
which represents full service restaurant and 722211 which represents limited service
restaurant were searched in the Mergent Online database. The search came back with 70
companies, which composed the sample of this study. Weekly stock prices of all listed
companies were obtained from the COMPUSTAT database. This study was carried out based
on the stock prices of 49 full service restaurants, and 20 limited service restaurants. Each

34
segment was analyzed separately for comparisons purposes. Appendix lists the restaurant
companies included in this study.
Due to the advantages describe in Chapter 2, this study used market-value weighted
index calculation method to derive the indices for full service restaurant segment, limited
service restaurant segment and overall restaurant industry based on the weekly stock prices
of the restaurant firms included in the segment. The indices developed for restaurant
segments reflect the market values of all the stocks of the restaurant firms in that segment
relative to its base period, which is January 2nd, 2005. For comparison purposes, the base
values for both restaurant stock indices were set as 1,186.19, the same as that of the S&P 500
index in the week of January 2nd, 2005. The fluctuations of the indices show the impact of
the recession and how each of the restaurant segments behaved through the recession. In this
study, the data set begins January 2005 and ends December 2010, with a total of 313 weeks,
the most recent recession occurred during week 153 through week 235 of the time series.
ARIMA with Intervention Analysis
ARIMA with Intervention Analysis is considered as an efficient model for evaluating
an event’s influence on a time series (Enders, Sandler, & Cauley, 1990). For instance,
Campbell and Ross (1968) examined the effects of new traffic law initiated in Connecticut to
reduce the highway fatalities. Box and Tiao (1975) applied intervention analysis to economic
and environmental problems, to be more specific; they measured the impact of air pollution
control laws. With the importance of assessing impact on legal areas, intervention analysis
also been used to examine the impact of policy changes, natural disasters, strikes and
advertising promotions. Montgomery and Weatherby (1980) studied the impacts of Arabic

35
oil embargo on sales of electricity in United States. Fox (1996) assessed the impact of natural
disaster hurricane Hugo on a Charleston, South Carolina hospital visits. In the literature of
hospitality industry, Oh and Ditton (2006) analyzed the impacts an outbreak of harmful algal
blooms on recreational fishing activity. Lee, Oh, & O’Leary (2005) analyzed the impact of
the Sep. 11 terrorist attacks on the U.S. air transport passenger demand. Min, Lim & Kung
(2010) evaluated the effect of SARS outbreak on inbound tourism from Japan to Taiwan.
Bonham & Gangnes (1996) estimated the impact of hotel revenues of the Hawaii room tax.
This study used the Autoregressive Interactive Moving Average (ARIMA) with
intervention analysis to examine the magnitude of the impacts of the recent recession had on
the stock performance of the restaurant industry
McDowall, McCleary, Meidinger, & Hay (1980) presented ARIMA with Intervention
analysis using the equation
Y!=N!+I!
Where
N! denotes the ARIMA model, or a “noise” component;
I!represents an “intervention” component; and
Y!is the entire time series that consists of the noise and the intervention.
This was a two-stage study. The first stage was fitting ARIMA models that represent
the pre-intervention periods and the second stage was identifying the interventions to test the
effect of exogenous event, which in our case, is the recent economic recession.
Autoregressive Interactive Moving Average (ARIMA)
According to McDowall, McCleary, Meidinger, & Hay (1980), “an ARIMA model is
a model of the stochastic process which generated the observed time series”. ARIMA is a

36
popular time series model that provides numerous advantages (Ismail, Suhartono, Yahaya, &
Efendi, 2009). It is used more often to analyze time series data than ordinary least squares
regression since the adjacent error terms are often correlated in time series data. When the
covariance of error terms do not equal to 0, the standard errors of ordinary least squares
parameter estimates are biased. As a result, t statistics can be vastly overstated and lead to
unfounded conclusions (McDowall, McCleary, Meidinger, & Hay, 1980). In the ARIMA
model, serial dependence is statistically controlled. The second important advantage of
ARIMA is it can describe various non-stationary time series. By taking a proper degree of
differencing, it can reduce a homogeneous non stationary time series to a stationary time
series (Ismail, Suhartono, Yahaya, & Efendi, 2009). Thirdly, random error, plus systematic
trend and seasonality, which usually involved in time series data, tend to obscure any
intervention. ARIMA modeling takes account of all three types of “noise” (McDowall,
McCleary, Meidinger, & Hay, 1980).
An ARIMA model has three structural parameters. ARIMA (p, d, q) stands for
autoregressive integrated moving average model developed by George E. P. Box and
Gwilym M. Jenkins (Box & Jenkins, 1976). In this notation, the parameter p inside of the
parentheses stands for the order of autoregression (that is the number of past observations
used to predict the current observation), d represents differencing, and q is for the number of
moving average structure in this model. The model can be written as
𝐹𝑡=∅!𝑋𝑡!!+∅!𝑋𝑡!!+…+∅𝑝𝑋𝑡!𝑝+𝜀𝑡-𝜃!𝜀𝑡!!-𝜃!𝜀𝑡!!-…-𝜃𝑞𝜀𝑡!𝑞
Where
𝐹𝑡 is the forecast value for period t
∅𝑡 is the tth autoregression parameter;

37
𝜀𝑡 is the error term at time t; and
𝜃𝑡is the tth moving average parameter.
The author analyzed the weekly stock index time series of full service and limited
service restaurant segments, the overall restaurant industry and the S&P 500 to (1) identify
the points that each of the two segments, overall restaurant industry and S&P 500 started to
recover, if the indices showed significant growth; and (2) quantify the significant impact that
the recession had on each of the stock indices and the magnitude of recovery after the
recession, if any.
Box-Jenkins methodology includes a three-step iterative procedure as following:
tentative identification, estimation and diagnostic checking (Bowerman, Connell, & Koehler,
2005). In the tentative identification stage, the data are transformed to stationary time series
first if they are nonstationary. Stationary means that the statistical properties such as the
mean and the variance of the time series data are constant through time (Bowerman et al.,
2005). Regular differencing and seasonal differencing can be performed to remove trend and
seasonality to transform the time series data into a stationary time series values. Then by
examining the behavior of Sample Autocorrelation Function (SAC) and the Sample Partial
Autocorrelation Function (SPAC), a suitable model can be identified. SAC measures the
linear relationship between the observations separated by a lag of k units while SPAC
measures the sample correlation of observations separated by a lag of k without the effect of
intervening (Bowerman et al., 2005). Based on the output of SAC and SPAC of the pre-
intervention time series, a tentative model can be moving average (MA), autoregressive (AR)
or mixed model.

38
The estimation of model parameters including the calculation of the coefficients,
ensures that all the coefficients are significant and within the bound of stationarity for the AR
coefficients and invertibility for MA coefficients, and the use of t-value and p-value to judge
the importance of model parameters. A more overall fit measure of a time series model is the
standard error. The smaller the standard error, the better the overall fit of the model.
After parameter estimation, diagnostic checking is used to examine the residuals to
check if the model is adequate. The author used Ljung-Box Q-statistic to test the adequacy of
a model, the formula is expressed as:
Q∗= n′(n′ + 2) (n′ − l)!!!!!! r!!(ȃ)
Where
n′=n-d, d is the number of observations in the original time series, d is the degree of
nonseasonal differencing used to transform the original time series values into stationary time
series values.
r!!(ȃ) is the square of r!(ȃ), the sample autocorrelation of the residuals at lag l-that is,
the sample autocorrelation of residuals separated by a lag of l time unit.
Based on the time series data before the recession started (week 1 though week 152),
an ARIMA model was identified for the limited service restaurants segment, the full service
restaurant segment, over all restaurant stock performance index and S&P 500 Index. No
seasonal components were added, since no seasonality was observed (Figure 1). Furthermore,
since stationarity was achieved by 2nd order differencing, no further data transformation was
performed beyond differencing. The ARIMA models identified for the four time series data
are the same, which is ARIMA (4, 2, 0) without constant.

39
Figure 1. Plot of stock indices

40
SAS/ETS Time Series Forecasting System output of the parametric estimation and
the diagnose check for the models can be seen in table 1 through 4.
Table 1. SAS/ETS Time Series Forecasting System output of the parametric estimation and the diagnose check an ARIMA (4, 2, 0) without constant model on limited service restaurant
data
Final Estimates of Parameters Type Coef SE Coef T P AR 1 -0.9569 0.0798 -11.99 0.000 AR 2 -0.7795 0.1024 -7.61 0.000 AR 3 -0.5838 0.1035 -5.64 0.000 AR 4 -0.2771 0.0810 -3.42 0.001 Differencing: 2 regular differences Number of observations: Original series 151, after differencing 149 Residuals: SS = 213811 (backforecasts excluded) MS = 1475 DF = 145 Modified Box-Pierce (Ljung-Box) Chi-Square statistic Lag 12 24 36 48 Chi-Square 10.0 27.8 32.6 40.1 DF 8 20 32 44 P-Value 0.265 0.113 0.439 .637
Table 2. SAS/ETS Time Series Forecasting System output of the parametric estimation and the diagnose check an ARIMA (4, 2, 0) without constant model on full service restaurant
data
Final Estimates of Parameters Type Coef SE Coef T P AR 1 -0.8318 0.0805 -10.34 0.000 AR 2 -0.6465 0.0990 -6.53 0.000 AR 3 -0.4576 0.0992 -4.61 0.000 AR 4 -0.2517 0.0810 -3.11 0.002 Differencing: 2 regular differences Number of observations: Original series 151, after differencing 149 Residuals: SS = 156221 (backforecasts excluded) MS = 1077 DF = 145 Modified Box-Pierce (Ljung-Box) Chi-Square statistic Lag 12 24 36 48 Chi-Square 14.1 28.0 41.0 57.5 DF 8 20 32 44 P-Value 0.078 0.110 0.133 0.083
Table 3. SAS/ETS Time Series Forecasting System output of the parametric estimation and the diagnose check an ARIMA (4, 2, 0) without constant model on overall restaurant data

41
Final Estimates of Parameters Type Coef SE Coef T P AR 1 -0.8545 0.0806 -10.60 0.000 AR 2 -0.7192 0.0988 -7.28 0.000 AR 3 -0.5187 0.0997 -5.20 0.000 AR 4 -0.2395 0.0815 -2.94 0.004 Differencing: 2 regular differences Number of observations: Original series 151, after differencing 149 Residuals: SS = 149314 (backforecasts excluded) MS = 1030 DF = 145 Modified Box-Pierce (Ljung-Box) Chi-Square statistic Lag 12 24 36 48 Chi-Square 9.8 27.8 34.6 42.1 DF 8 20 32 44 P-Value 0.280 0.115 0.343 0.553
Table 4. SAS/ETS Time Series Forecasting System output of the parametric estimation and the diagnose check an ARIMA (4, 2, 0) without constant model on S&P 500 data
Final Estimates of Parameters Type Coef SE Coef T P AR 1 -0.9231 0.0816 -11.31 0.000 AR 2 -0.7429 0.1055 -7.04 0.000 AR 3 -0.4598 0.1072 -4.29 0.000 AR 4 -0.1916 0.0844 -2.27 0.025 Differencing: 2 regular differences Number of observations: Original series 151, after differencing 149 Residuals: SS = 77269.6 (backforecasts excluded) MS = 532.9 DF = 145 Modified Box-Pierce (Ljung-Box) Chi-Square statistic Lag 12 24 36 48 Chi-Square 13.0 24.4 33.1 45.0 DF 8 20 32 44 P-Value 0.111 0.225 0.415 0.431

42
The Intervention component ��
ARIMA with intervention analysis is an extension of ARIMA (Box & Tiao, 1975).
Once successfully identified an ARIMA model, an intervention component can be added to
estimate the effect of the event, this process is often called intervention analysis. Assuming
the effect of intervention was included in a time series, the process of time series can be
written as:
𝑌𝑡=f (I𝑡) +N𝑡
Where
𝑌𝑡is a response variable at time t;
𝐼𝑡is an intervention variable; and,
N𝑡is a noise model from the ARIMA (p, d, q) model
In a time series, an intervention is regime or structural change due to external or
internal factors that changed in mean of a time series data; it breaks the time series into a pre-
intervention segment and a post-intervention segment (McDowall, McCleary, Meidinger, &
Hay, 1980). ARIMA with intervention analysis focuses on a test of did the intervention have
an impact on the time series. It is tested by comparing the pre and post intervention segments
of the time series. If the impact is significant, the intervention analysis can further to be used
to estimate the magnitude and form of the impact. Interventions are summarized by
McCleary and Hay as “binary variables which indicate the absence of the state prior to the
event and the presence of the state during and after the event” (1980). Thus, by introducing
dummy variables into the ARIMA model, the statistical significance of an event can be
assessed by comparing the level of post intervention segment to that of pre intervention
segment.

43
There are three types of interventions commonly used to control the indicator variable
to describe the intervention effect in the ARIMA model: point, step, and ramp (SAS/ETS®
9.22 User’s Guide, 2010). A point intervention usually is used to model an event that occurs
only one time, such as September 11 terrorist attack, or a strike shut down the production line
for a short time of period. In the model, dummy variables can represent the event as a change
agent; the value of the intervention’s indicator variable is zero prior to the intervention, one
at the moment of intervention, and zero again thereafter. A step effect indicates that the event
is continuing and changes the level of the time series. For instance, the increase on tax rate
will cause a step effect. The value of the intervention’s indicator variable is zero before the
date specified and then steps to a constant level one thereafter. The last type of intervention is
ramp, also suggests a continuing effect but with the trend that increase linearly after the
intervention time, the value of the intervention’s indicator variable is zero before the date
specified and increases linearly with time thereafter (SAS/ETS® 9.22 User’s Guide, 2010).
Given the nature of a recession, this study used the ramp effect to conduct the ARIMA with
Intervention analyses.
Based on the weekly stock indices time series prior to the recession (week 1 to week
151), Autoregressive Integrated Moving Average (ARIMA) models were identified for each
of four stock indices. Two ARIMA with intervention analyses were performed for each of
the four stock indices to identify the impact week (the week that the stock indices started
showing a significant decrease) and recovery week (the week that the stock indices started
showing significant recovery). In the other words, this study used ARIMA with intervention
analyses to identify the lag time each of the stock indices recovered after the recession ended.

44
The analysis for each of the four stock indices is a two-step process. A step-by-step
illustration is provided here using the full service restaurant as an example. The first step is to
perform ARIMA with intervention analysis to identify the impact week by using the
Intervention function of the Time Series Forecasting System provided by SAS 9.2. ARIMA
with intervention analysis was performed on the weekly stock indices time series from week
1 to week 235 (Jan 2005 to Jun 2009) to identify the week that the stock index of the full
service restaurant segment was statistically significantly affected by the recession. This is a
repeating process that tested weeks from the 153rd week (the week after recession started)
through the week that had the lowest value (for full restaurant, 218th week). A total of 66
tests were performed. ARIMA (4, 2, 0) without constant was used. The result suggests that
the stock index of full service segment was statistically significantly impacted by the
recession right after the recession started which was the week of Dec 9, 2007 (Table 5).
Table 5. Summary of statistics of ARIMA with intervention analyses (impact)
Model Parameters
Estimate t-statistic p value
Overall Restaurant industry
AR(1) AR(2) AR(3) AR(4) week of Dec 9, 2007
-0.75963 -0.54605 -0.46647 -0.25657 -59.10428
-11.4309 -6.9730 -5.9404 -3.8484 -2.3203
< .0001 < .0001 < .0001 0.0002 0.0213
Full Service Restaurants S&P 500
AR(1) AR(2) AR(3) AR(4) week of Dec 9, 2007 AR(1) AR(2) AR(3) AR(4) week of Sept 7,2008
-0.78174 -0.60145 -0.47249 -0.23549 -57.89853 -0.90615 -0.64130 -0.55621 -0.31220 -55.89321
-11.2492 -7.1521 -5.6248 -3.3462 -2.2619 -13.8599 -7.8289 -6.7582 -4.7076 -2.7161
< .0001 < .0001 < .0001 0.0010 0.0248 < .0001 < .0001 < .0001 < .0001 0.0072

45
For step two, the author identified the recovery week based on the finding of the first
step. A new weekly stock index time series started from a week after impact week, Dec. 7,
2007 (the 153rd week of the original time series) and ended at the week of Dec. 31, 2010 was
developed for the analysis. The same SAS functions and same ARIMA model were used for
repeating tests with weekly increments starting from July 2, 2009, which is the week after the
recession ended. A total of 79 interventions were performed and the week of recovery was
identified as the week of Jan. 3, 2010 (Table 6), the 262nd week of the original time series
data. In the other words, although the recession started December 2007 and ended June 2009
(a 83-week period), the stock index of the full service restaurant segment in United States
was affected by the recession from November 2007 through January 2010, a total of 111
weeks, which is longer than the recent recession.
Table 6. Summary of statistics of ARIMA with intervention analyses (recovery)
Model Parameters
Estimate t-statistic p value
Full Service Restaurants
AR(1) AR(2) AR(3) AR(4) week of Jan 3, 2010
-0.64142 -0.50531 -0.35685 -0.20233 68.44682
-7.7949 -5.4614 -3.8705 -2.5271 1.9230
< .0001 < .0001 0.0002 0.0125 0.0563
Identical analyses were performed for limited-service restaurant segment, overall
restaurant industry, and S&P 500 stock index to identify their impact and recovery weeks.
For the limited service restaurant segment, no significant impact was identified. This study
further attempted to identify whether there is a significant increase after the recession ended;
therefore, the authors used the dataset starting from the week after the recession ended, in
which the first intervention was the week of 235, July 2, 2009. Still, no significant increase

46
was identified (Table 7). These findings suggest that different restaurant segments behaved
differently during the recession in terms of the starting and ending time of the impact,
magnitudes of the impact, and the length of the impact.
Table 7. Dates of impact and recovery
Impact Recovery Overall Restaurant industry
week of Dec 9, 2007
Not recovered until 2010
Limited service Restaurants
No significant impact was identified
No significant recovery was identified
Full Service Restaurants S&P 500
week of Dec 9, 2007 week of Sept 7,2008
week of Jan 3, 2010 Not recovered until 2010
Financial Differences between Two Types of Restaurants
Financial ratios data
All the financial data needed for the calculations of ratios were retrieved from the
COMPUSTAT database, and annual data from financial statements of 2005 and 2006, which
represent the pre-recession period, were used in this part of study. Thirteen ratios across five
categories that have been widely adopted in previous studies for restaurant firms were
selected for this study. All the ratios and their formulas are presents in Table 8. As the data
retrieved from COMPUSTAT are based on the 10Q and 10K reported to the Security
Exchange Committee, all the data were audited. 49 full service restaurants and 20 limited
services restaurants comprised of the sample of this study (see Appendix). The data, in their
nature, are aggregated chain data rather than data of individual restaurants.

47
Table 8. Summary of financial ratios
Category Ratio Formula Liquidity Current ratio
(working capital ratio) Quick ratio (acid test ratio)
Current ratio= !"##$%& !""#$"!"##$%& !"#$"!"%"&'
Quick ratio=!"#$! !""#$%&' !"#"$%&'("! !"#$%&"'(% !"#$%&'&"!
!"##$%& !"#$"!"%"&'
Or Quick ratio=!"##$%& !""#$"! !"#$"%&'!$(! !"#!$%& !"#!$%!%
!"##$%& !"#$"!"%"&'
Leverage Debt ratio Debt-to-equity ratio Times interest earned ratio
Debt ratio= Total debt/ Total assets Debt-to-equity= Total debt/ Total equity Times interest earned= Earnings before interest and taxes (EBIT)/ Interest charges
Profitability Gross profit margin ratio Net profit margin ratio Return on investment (total asset) ratio Return on stockholder’s equity ratio
Gross profit margin= Sales- Cost of sales/ sales (revenue) Net profit margin= Earnings after taxes (EAT)/sales Return on investment= Earnings after taxes (EAT)/ Total assets
Return on stockholder’s equity= Earnings after taxes (EAT)/ Stockholders’ equity
Asset management
Inventory turnover ratio Total asset turnover
Inventory turnover= Cost of sales/ Average inventory Total asset turnover= Sales/ Total assets
Market-based
Price-to-earnings (P/E) ratio Market (price)-to-book (value) (P/BV) ratio
P/E= Market price per share/ Current earnings per share P/BV= Market price per share/ Book value per share
Independent samples t-test
Independent samples t-tests were conducted to compare the means of financial ratios
before the recent recession of full service and limited service restaurants. The independent
samples t-test is a statistical method to compare the mean scores of two different groups of
subjects; it tests whether there is a statistically significant difference in the mean scores for

48
the two groups. In statistical terms, it tests the probability that the two sets of scores came
from the same population (Mendenhall, & Sincich, 2003). The three assumptions underlying
the use of independent samples t-tests are: independence of observations, the normal
distribution of dependent variable, and the homogeneity of variance of dependent variable
(Sprinthall, 1997). After careful examination, the author confirmed that each observation of
measurement was not influenced by any other observation of measurement; therefore the
assumption of independence of observations was not violated. Regarding the second
assumption, the normal distribution of dependent variables, there is a cutoff point as 30, with
large enough sample sizes; the violations of this assumption should not cause any major
problems. This study has a sample size of 70; therefore the author concludes that the
independent samples t test is reasonably robust. To test the homogeneity of variance, the
author performed the Levene test on SPSS, with a significant level greater than 0.05; this
suggests the two groups have equal variance, otherwise the variances for the two groups are
not equal. SPSS provides two sets of results for independent samples t-tests, for the situation
where the assumption is not violated and for it is violated, and the author adopted the
appropriate results for the data (see Table 9).

49
Table 9. Financial ratios comparisons of restaurants
Category Ratio Average for limited service
Average for full service restaurants
t-value Sig. (2-tailed)
Liquidity Current ratio (df=63)
1.2584 1.0462 .987 .327
Quick ratio (df=62)
.9132 .7284 .831 .409
Leverage Debt ratio (df=21.771)
.6976 .4571 1.739 .096
Debt-to-equity (df=15.171)
2.7825 .9444 1.078 .298
Times interest earned (df=56)
147.6913 63.2174 .557 .579
Profitability Gross profit margin (df=63)
.2722 .2130 2.031 .046
Net profit margin (df=63)
.0711 -.0262 1.074 .287
Return on investment (df=50)
.1006 .1119 -.141 .888
Return on stockholder’s equity (df=53)
.1401 .13442 1.398 .168
Asset management
Inventory turnover (df=58)
72.6091 79.5977 -.407 .686
Total asset turnover (df=59)
1.7009 1.5623 .789 .434
Market-based P/E (df=63) 31.1338 .2202 1.705 .093 P/BV(df=19.261) 1.3981 2.5298 -.878 .391
Impact of the Recession on Financial Conditions and Performances
Data
All the financial data needed for the calculation of ratios were retrieved from the
COMPUSTAT database. Annnual data from financial statements of 2005 and 2006, which

50
represent the pre-recession period, and those of 2010 and 2011, which represent the post-
recession period, were used in this study.
Paired-samples t-test
In order to identify the changes in financial conditions and performances of full
service and limited service restaurants before and after the recent recession, the author used
the paired-samples t-test to compare the mean of aggregate ratios of two types of restaurants
in 2005 and 2006 (the years prior to the recent recession) to the ratios of restaurants in 2010
and 2011 (the years after the recent recession). The paired-samples t-test, also referred to as
repeated measures, is used when there is only one group of subjects; the data were collected
from them on two different occasions or under two different conditions (Mendenhall, &
Sincich, 2003). This technique is appropriate for this research since the author intend to study
if the two types of restaurants had statistically significant changes before and after the recent
recession. In this case, the two different conditions when collected the data were before the
recent recession and after the recent recession (see Table 10 and 11).

51
Table 10. Summary of ratio statistics for full service restaurants
Category Ratio Average before recession
Average after recession
t-value Sig.
Liquidity Current ratio (n=31)
1.1018 .9528 .944 .353
Quick ratio (n=31)
.7938 .6613 .811 .424
Leverage Debt ratio (n=31)
.4167 .5621 -3.757 .001
Debt-to-equity (n=30)
.8276 4.1277 -1.712 .098
Times interest earned (n=25)
81.4394 20.5291 1.324 .198
Profitability Gross profit margin (n=31)
.2316 .2170 1.685 .102
Net profit margin (n=31)
-.0433 .0242 -.834 .411
Return on investment (n=26)
.0758 .0554 1.515 .142
Return on stockholder’s equity (n=30)
.0915 -.0172 1.613 .118
Asset management
Inventory turnover (n=30)
81.0008 72.6084 .777 .443
Total asset turnover (n=31)
1.4845 1.6203 -1.524 .138
Market-based P/E (n=31) 19.2153 -2.8367 .686 .498 P/BV (n=31) 2.9048 3.7762 -.967 .341

52
Table 11. Summary of ratio statistics for limited service restaurants
Category Ratio Average before recession
Average after recession
t-value Sig. (2-tailed)
Liquidity Current ratio (n=15)
1.2964 1.2169 .389 .703
Quick ratio (n=15)
.9862 .8312 .847 .411
Leverage Debt ratio (n=14)
.8064 .8573 -.336 .742
Debt-to-equity (n=11)
3.7193 4.6282 -.357 .728
Times interest earned (n=15)
185.6669 -124.3671 1.266 .226
Profitability Gross profit margin (n=15)
.2865 .2831 .259 .800
Net profit margin (n=15)
.0761 .0447 .945 .361
Return on investment (n=12)
.0853 .0548 .881 .397
Return on stockholder’s equity (n=11)
.1470 .2060 -.363 .724
Asset management
Inventory turnover (n=15)
74.3498 73.4794 .236 .817
Total asset turnover (n=15)
1.7361 1.8559 -.692 .500
Market-based P/E (n=15) 33.6460 19.6422 .643 .531 P/BV (n=15) 1.1329 7.0399 -1.684 .114
The basic assumption for the paired-samples t-test is that the difference between the
two scores obtained for each subject should be normally distributed (Mendenhall, & Sincich,
2003). With a sample size larger than or equal to 30, violation of this assumption is unlikely
to cause any serious problems. Since the sample size for limited service restaurants in this
study is small, it is difficult to guarantee that this assumption is not violated. To overcome
the limitation of the paired-samples t-test, the author conducted a non-parametric Wilcoxon

53
signed rank test in parallel with the paired-samples t-test, since it did not require the
assumptions mentioned above.
The Wilcoxon signed rank test
The Wilcoxon signed rank test, sometimes also referred to as the Wilcoxon matched
pairs signed rank test, is designed for use with repeated measures (when the subjects are
measured under two different occasions or conditions). It is the non-parametric alternative to
the paired-samples t-test (Miller, & Miller, 2004). Instead of comparing means, the Wilcoxon
signed rank test converts scores to ranks and compares them at time1 and at time 2. It tests if
there is a significant change in score from time 1 to time 2 (see Table 12).
Table 12. Summary of ratio statistics for limited service restaurants: Wilcoxon signed rank test
Category Ratio z-value Asymp. Sig. (2-tailed) Liquidity Current ratio (n=15) -.220 .826
Quick ratio (n=15) -.157 .875 Leverage Debt ratio (n=14) -.594 .552
Debt-to-equity (n=11)
-1.274 .203
Times interest earned (n=15)
-.785 .433
Profitability Gross profit margin (n=15)
-.157 .875
Net profit margin (n=15) -.408 .683 Return on investment (n=12)
-.889 .374
Return on stockholder’s equity (n=11)
-.764 .445
Asset management
Inventory turnover (n=15) -.596 .551 Total asset turnover (n=15)
-.282 .778
Market-based P/E (n=15) -.785 .433 P/BV (n=15) -2.040 .041

54
CHAPTER 4. RESULTS AND DISCUSSION
Findings of U.S. Restaurant Stock Market
The impact and recovery of the recession on U.S. restaurant stock market
The results of ARIMA with Intervention analysis suggested that different restaurant
segments performed very differently through and after the recession. For the full service
restaurant segment, the mean of the weekly stock index dropped by about 57.9 after the week
of Dec. 9th, 2007. However, the weekly stock index of full service restaurants was fully
recovered by the week of Jan 3rd, 2010, 28 weeks after the recession ended (the 262nd week
of the weekly time series), the mean value of its weekly stock index recovered 68.45, actually
exceeded what it was before the recession.
On the other hand, the weekly stock index of the limited service restaurants segment
was not significantly affected by the recent recession. There is no significant recovery was
identified.
The author also examined the impact of the recession on the overall restaurant
industry, the mean value of the weekly stock index dropped about 59.10 after the week of
Dec. 9th, 2007. The impact was long lasting since there is no significant recovery was
identified till the end of 2010 (the end of the time series).
The S&P 500 weekly stock index was not significantly affected by the recession until
the 193rd week. After the week of Sep. 7th, 2008, the mean of the weekly stock index dropped
about 55.89, and it was not fully recovered till the end of 2010 (the end of the time series).
On September 15, 2008, Lehman Brothers declared bankruptcy (Sorkin, 2008). During the
week, panicky banks withdrew nearly 144 billion from money-market funds, which usually

55
to be considered as the safest investment next to cash and bank deposit (Mollenkamp, Craig,
Ng, & Lucchetti, 2008). The author believed that the sudden decrease of S&P 500 stock
index was a response to this event.
Discussion of the recession’s impact on limited service restaurants
This study aims to explain how the different restaurant segments behaved differently
through the recent recession by examining weekly stock indices of limited service restaurants
segment and full service restaurants segment. From Tables 5-7, the author concluded that
when recession hit, restaurant industry was its first victim, restaurant industry’s stock
performance was immediately affected. Limited service restaurants weathered better than full
service restaurants during the recession. There was no significant impact of the recession was
identified on limited service restaurants, on the other hand, the full service restaurants were
negatively affected by the recent recession.
The most important reason that limited service restaurants segment fared better was
their low menu prices compared to the full service restaurant segment. Their products are
considered as necessities while the products of full service restaurants are considered as
luxuries (Youn & Gu, 2010). Their comparably economic prices made fast food restaurants
more resistant to the recession, and recession-caused problems: higher unemployment and
lower disposable income (Youn & Gu, 2010).
Even people are reluctant to go out for dinner, Ron Paul, the founder and president of
Technomic, said customers are not get back to do pure cooking from an ingredient (Enis,
2009). During the recession, when the consumers are needed to cut their spending on eat-out,
cheap meals like Big Macs and Whoppers become more tempting. The logic of “trading

56
down” theory is that limited service restaurant firms take over the customers who could not
afford to eat at full service restaurants any longer, this theory was proved true for the recent
recession (The Econimist, 2010). For instance, the $ 5 foot-long sub of Subway, is quite a
value for consumers. In fact, Subway enjoyed more than $ 8 billion in sales in 2007 (Enis,
2009). Consumers were migrated to lower price menus such as Buffalo Wild Wings (BWLD),
where they can enjoy televised sports while enjoy beer and chicken wings. This chain had
grown rapidly and expanded nationally, opened 60 new restaurants, which equals to 15
percent more outlets in 2009. With the rapid expansion, the profits were up by 34% in 2009
(Newman, 2009). Similarly, McDonald’s (MCD), with its relatively low menu price, even
benefited from the recession. While other restaurants were slow in business, sales of
McDonald’s rose 5.4% in January 2009 (Krantz, 2009).
The limited service restaurants as a whole weathered the recent recession better than
their pricier competitors- full service restaurants. In 2009, the sales of full service restaurants
fell by more than 6 percent, while the total sales of limited service restaurants remained the
same (The Econimist, 2010). As mentioned above, some of the limited service restaurants are
reported enjoyed a increase in sales and profits during the recession due to lower price or
higher quality such as McDonald’s, Panera Bread, Buffalo Wild Wings. Some other limited
service restaurants suffered from the recession, therefore, in general, the limited service
restaurants segment remained the same in the total sales. This study reviewed both cases in
order to make suggestions that can improve the performances of limited service restaurants
during the recession or a similar market downturn.
Some of limited service restaurants’ sales have fell during the recession such as
Burger King, Jack in the Box and Carl’s Jr. One reason that these smaller chains were hit

57
particular hard during the recession is that the highly competitive environment of limited
service restaurants. For instance, McDonald’s, as a global powerhouse, spent 7% more on
advertisement in 2008 while others cut back (O’Brien, 2012).
Further more, improper marketing strategies applied to cope with the recession also
resulted decreases in profits. During the recession, some limited service restaurants set a low
menu price, hoping they could attract customers to come to eat and persuade them to order
more expensive items. For instance, Burger King sold its double cheeseburger for $ 1 when
the cost is $ 1.1 in 2008, which resulted a lawsuit sued by franchisees. The promotion
strategy was unsuccessful since its “value menu” accounted for 20% of its sales during the
recession, up from 12% before the recession started (The Econimist, 2010). The promotion
was designed to attract customers to spend more on more profitable items, when people just
order from the “value menu”; the traffic increased instead of profits. On the contrary,
McDonald’s menu changes led its increased sales and profits during the recession.
McDonald’s was tried to get more customers and sales by intruding its new drinks. They
started selling better coffee to compete with Starbucks. Its “McCafe” line accounted for
about 6% in the U.S. in 2009 (The Econimist, 2010). They also started offer frappe coffees
and smoothies during the recession. To keep prices down for customers without sacrificing
their own profit, McDonald’s replaced the dollar Double Cheeseburger with a new sandwich
McDouble in 2008. The McDouble is identical to the Double Cheeseburger except it has only
one slice of cheese, and the Double Cheeseburger was removed from the Dollar menu, but it
is still available with a price raise of 19 cents (Bury, 2008). The changes of Double
Cheeseburger/ McDouble boosted cash flow by 15,000 a year per restaurant (Bury, 2008).

58
Limited service restaurants were proved to be a recession-proof business since the
severity of the recession did not cause a significant effect on them.
Discussion of the recession’s impact on full service restaurants
Full service restaurant segment, however, was negatively affected by the recession.
As the unemployment rate soared during the recession, people lost jobs have less disposable
income and therefore were more sensitive to high menu price (Campbell, 2011). As
customers look to trim down their expenses, restaurants with highest tabs are the first to see
business drop off, says Jeff Farmer, an analyst from Jefferies (Krantz, 2009). For example,
customers might forgo brunches at Cheesecake Factory when they worried about their jobs.
The BLS Consumer Expenditure Survey (CE) revealed that during the 2007-2009
recession, middle-income households cut total food spending the most, their real food
expenditures decreased about 12.5% from 2007 to 2009, lowest-income household cut their
spending about 1.8%, and highest-income households reduced food spending about 5.7%
(Kumcu & Kaufman, 2011). According to the IBISWorld Industry Report 72211, full service
restaurants tend to draw their customers from higher income households, such as middle and
highest income households (Zwolak, 2010). The full service restaurants depend on the
discretionary expenditure of households, with their major target customers cut spending on
foods, it is not surprising that the full service restaurants adversely affected by the recent
recession (Zwolak, 2010). While guest traffic fell, customers who still frequent restaurants
were on a tighter budget, they ordered fewer courses and looked for value offerings, such as
discounted prices or three-course meal package with a two-course price (Zwolak, 2010).

59
Surviving from the recession was the main objective of full service restaurants during the
recession.
Besides higher menu prices, considering its high input and labor costs nature, full
service suffered the most during the recession. Full service restaurants are more labor
intensive than limited service restaurant segment (Walker, 2002). Also, the costs to sales
percentage is about 30% to 35% for the full service restaurant while it for the fast food
restaurants is 16% to 18% (Walker, 2002). A survey of operations in full service restaurant
industry done by the Nation Restaurant Association reported higher costs of purchases of
food and beverages, salaries and wages (Zwolak, 2010).
However, when the economy was recovering, people are less sensitive to higher menu
prices, and full service restaurants fully recovered in a short time after the recession’s end.
Findings for Ratios Comparisons of Restaurants
Liquidity
Liquidity ratios disclose a company’s ability to repay its short-term liabilities and
how quickly it can convert its assets into cash at their fair market price (Scott, Martin, Petty,
& Keown, 1999). Studies show that good liquidity management can improve operating
results and enhance company performance; on the contrary, poor liquidity management can
hurt company performance and lead to low profits (Moyer et al., 2001). In terms of the
restaurant industry, inadequate cash may lead to difficulties in repaying approaching
obligations; on the other hand, too much cash at hand would hurt the profitability
(Schmidgall, 2006). The goal of liquidity management is that to find the optimal point

60
between liquid and illiquid assets to minimize operating costs without hurting the company’s
performance.
Table 9 reports the means of financial ratios for each restaurant type prior to the
recent recession and the statistical significance of the independent samples t-test. As shown
in Table 9, the group means of both current ratio and quick ratio of limited service
restaurants are higher, indicating that limited service restaurants have better short-term
liquidity position than full service restaurants. The statistical significances of independent
samples t-tests on the differences in these two liquidity ratios are higher than the 0.10 level,
indicating that there is no significant difference between these two groups when it comes to
liquidity.
The thumb of rule of current ratio for the restaurant industry is less than 1 to 1, since
the only inventories for are food, beverage and supplies. As shown in Table 9, the average
current ratios for limited service and full service restaurants are 1.2584 and 1.0462,
respectively. Even though the t-test shows that there is no significant difference between
these two types of restaurants, these means indicate that even limited service restaurants are
in a “better” liquidity position. In fact, full service restaurants outperformed limited service
restaurant since they do not have problems in repaying their current obligations or sacrifice
profitability.
Leverage
Financial leverage ratios measure a company’s capital structure, specifically, debt
versus equity. These ratios reflect a company’s ability to meet with its long-term liabilities.
They are also indicators of potential risks. The optimal capital structure theory proposed by

61
Moyer, McGuigan, and Kretlow alleged there is an inverted U-shaped relationship between
debt usage and firm value as reflected in capital market (2001). When the cost of debt offsets
the benefits of debt, the optimal debt level is reached.
All the means for the three ratios under this category: debt ratio, debt-to-equity ratio,
and times interest earned ratio of limited service restaurants were substantially greater than
those of full service restaurants. The debt-to-equity ratio for limited service restaurants is
almost three times that of full service restaurants, indicating that limited service restaurants
are using three times more borrowed funds to finance its activities as compared with full
service restaurants. The times interest earned ratio for limited service restaurants is twice of it
for full service restaurants, this ratio is a further evidence that the limited service restaurants
make extensive use of creditors’ funds to finance their operations, however, the variability of
limited service restaurants is not threatened since their EBIT covered annual interest
payments in the average of 147.6913 times. Even the means seemed substantially different
with each other, after independent samples t-tests, only debt ratio is significant different on
the 0.10 level. The statistics provided strong evidence that the financial structure of full
service restaurants and limited service restaurants are different from each other. Limited
service restaurants seemed to use considerably more debt financing than full service
restaurants. This outcome might be partly explained by the expanding operations of limited
service restaurants. In response to the higher customers’ demand for good value and
convenient dining choices, many limited restaurant corporations have been expanding
operations, these expanding operations refer to not only the aggressive pursuit of new market
areas, but also the new service concepts such as Burger King’s Expressway concepts. Such
expansion could be a factor in the higher level of debt financing found through this analysis.

62
Profitability
Profitability ratios reflect all areas of management’s responsibilities, and sometimes
they can be used to assess the management’s operational ability. Three of four ratios, namely
gross profit margin, net profit margin, and return on stockholder’s equity for limited service
restaurants are higher than those of full service restaurants. Full service restaurants only
outperformed limited service restaurants on the return on investment ratio. On the basis of
these ratios, limited service restaurants outperformed full service restaurants; however, full
service restaurants are not far behind from limited service restaurants. The test on gross profit
margin ratios demonstrates there is a significant difference between limited service
restaurants and full service restaurants at the 0.05 level. The gross profit margin tells the
profit a company makes on its cost of sales, in the other words; it indicates how efficiently
management uses labor and supplies in the production process. However, the test on net
profit margin ratios shows that there is no significant different between these two types of
restaurants. The group mean of net profit margin for limited service restaurants is 0.2722
while it for full service restaurants is -0.0262, therefore there is still weak evidence that
limited service restaurants generate more profits than full service restaurants.
Asset management
Asset management ratios measures how well or poorly a company operates and how
efficient it is using its assets. Both the means of inventory turnover ratio and total asset
turnover ratio for limited service restaurants were slightly higher than those for full service
restaurants. None of the tests on the asset management ratios demonstrate a statistical value

63
even close to the 0.10 level of significance. Therefore, in terms of asset management, the two
different types of restaurants were not significantly different from each other.
Market-based
Last, a company’s profitability, risks, effectiveness of management, and many other
factors are reflected in its stock and security prices. Hence, market-based ratios indicate the
market’s evaluation of the company’s securities’ value. Price/ Earning ratio gives the insight
of how much the investors are willing to pay for each dollar of the company’s earnings per
share. The price-to-book value ratio measures the market’s valuation relative to balance sheet
equity. Higher ratios indicate that investors are more confident about the market value of a
company’s assets, its intangible assets and the management’s ability. The mean of P/E ratio
for limited service restaurants was 31.1338 while the mean for full service restaurants was
0.2202, in the other words; in average, limited service restaurants’ P/E ratio was 141.39 times
of it for full service restaurants. The statistical value of the test on P/E ratio, as reported in
Table 9, was 0.093, in the other words; there were significant differences between these two
types of restaurants in terms of the P/E ratio. The lower P/E ratio of full service restaurants
indicated that full service restaurants less impressed the investors. The investors are generally
considered limited service restaurants have good prospects for strong growth in future
earnings. On the other hand, the mean of P/BV ratio for the full service restaurants was
almost twice of it for limited service. The independent samples t-test showed there is no
significant difference between these two types of restaurants in terms of P/BV ratios.

64
Discussion of financial differences between two types of restaurants
To study if different types of restaurants also differ financially, the author examined 5
groups of 13 ratios of full service and limited services restaurants before the recession. While
the means of ratios seemed to differ substantially between these two types of restaurant
companies, the statistics showed that some of the leverage, profitability, and market-based
ratios were significantly different with each other. To be more specific, debt ratio, gross
profit margin ratio, and P/E ratio were statistically significantly different between full service
and limited service restaurants.
The limited service restaurants were heavily financed by debt. The possible
explanations may include: (1) their operational expansion plans to satisfy more customers’
needs (Gu & McCool, 1993), (2) easy access to debt since most of limited service restaurants
are large companies at corporation level (Gu, 1993), and (3) relatively stable revenues (Mao
& Gu, 2008).
According to Tuttle (2012), for limited service restaurants, dine-in customers tend to
spend more compared to drive-thru visits. To increase the likelihood that customers will dine
in, linger longer, and spend more on each visit, some of the limited service restaurants
employed a pricey strategy- remodel. Tuttle liken the remodel of limited service restaurants
as a mantra: make the restaurant looks nice inside and out, the customers will come, and
spend more (2012). Wendy’s “ image activation” plan was an example of attracting
customers by remodeling. The remodeled Wendy’s locations are almost loft-apartment-type
feel includes many features such as lounge seating, fireplaces, flat-screen televisions, wood
laminate floors, free Wi-fi (Tuttle, 2012). Many studies had showed that an inviting and
attractive restaurant atmosphere is good for sales (Fitzsimmons & Mauer, 1991). But how

65
good is it? Wendy’s have the equation to estimate the cost of remodeling and payoff in forms
of increased sales down to science. For example, a “Tier 1” investment, with the cost of
650,000-700,000, can boost the sales about 25%, a “Tier 2” investment with the cost of
500,000, will lift 15% of sales (Kelso, 2012). Many firms were used the strategy of remodels
to boost sales and profits such as McDonald’s, Starbucks, Panera Bread, Taco Bell (O’Brien,
2012).
The Restaurant Performance Index (RPI) is a monthly composite index that tracks the
health of and outlook for the U.S. restaurant industry (NRA, 2012). The index value above
100 indicates that a period of expansion, while index value below 100 suggests a contraction
period. The RPI of 2005-2007 suggests that the restaurant industry is in a period of expansion.
From 2005 through 2006, the limited service restaurants’ revenue was driven by strong
economic growth; operators competed ferociously in the domestic market and expanded
internationally in order to grow overall revenue and profits (Zwolak, 2010). Expansion plans
were launched by many limited service restaurants to meet with the consumers’ need and to
increase the revenue. For instance, in 2005, Yum brands opens 409 new restaurants in China.
KFC has opened more than 2,300 stores in 450 Chinese cities (Ding, 2008). These remodel
and expansion plans were a major reason that limited service restaurant have a higher debt
ratio since most operators chose to finance their expansion by debt.
Compare to full service restaurants, revenue volatility is low for limited service due to
the very high household penetration rate. Limited service restaurants’ relatively stable sales
revenue may boost their confidence in using debt financing since they are optimistic to cover
the interest charges on debt incurred, therefore induce them to use more financial leverage to
achieve higher returns. Not to mention many of them are large size companies may have

66
easier access to financial leverage. On the other hand, full service restaurants have volatile
sales, and their relatively small size may put them in a disadvantageous bargaining position
when considering debt financing.
The limited service restaurants also had significantly higher gross profit margin than
full service restaurants. By observing the formula used to calculate this ratio, a high gross
profit margin indicates a low cost of sales. It is not surprising that the limited service
restaurants have significantly lower cost of sales. Firstly, according to previous study,
Walker (2002) pointed that full services restaurants are more labor intensive than limited
service restaurants. While full service restaurants have the higher labor cost to sales
percentage about 30%-35%, in comparison with limited service restaurants’ 16%-18%.
Secondly, the inferior performance of full service restaurants may be attributable to the rising
operational costs associated with expansion and market penetration plans. The Weekly
Corporate Growth Report (Valuation of the restaurant industry, 1999) suggests that labor
costs were main operating expenses for lower profit margin particularly in the full service
restaurants in the fierce competition caused by market penetration. Labor costs have the
rising trend due to the mandated minimum wage Increases, training, and highly competitive
wage packages (Valuation of the restaurant industry, 1999).
Findings of the Impact of the Recession on Financial Conditions and Performances
Findings of the recession’s impact on full service restaurants
The group means of thirteen ratios for the full service restaurants and their paired
samples t-test statistic results are reported in Table 10. As shown in Table 10, the debt ratio
was significantly different before and after the recent recession at the 0.01 level, suggested

67
that full service restaurants had significantly increased their use of debt to operate their
activities during the recent recession. Before the recent recession, the average debt ratio for
full service restaurants was 0.4167; this means on average, the full service restaurant
companies were financed by 42% of debt and 58% of equity. After the recession, the debt
ratio increased to 0.5621, this means on average, the full service restaurant companies were
56% financed by debt and 44% by equity. The increased 15% suggested that full service
restaurant firms’ significantly higher use of debt financing. After the recent recession, these
restaurants were 15% more indebted than they were prior to the recession.
At the 0.10 level, one more ratio became significant, the debt-to-equity ratio. The
average mean of debt-to-equity ratio for full service restaurants before the recent recession
was 0.8276, suggested that for every dollar invested by stockholders, the creditors invested
83 cents. After the recession, this ratio increased to 4.13, means that the creditors invested
4.13 dollars for each dollar invested by stockholders. These statistics provided strong
evidence that the full service restaurants used considerably more debt financing during the
recession, particularly relative to their equity investments.
The statistical significant of tests on the differences in the other ratios were all greater
than the 0.10 level. However, the significant level of paired samples t-test on gross profit
margin is very close to the 0.10 level, 0.102. The empirical results indicated that there was at
least weak evidence that full service restaurants may have significantly lower gross profit
margin after the recent recession. The decrease of gross profit margin may suggest that the
increase of cost of sales. A reasonable explanation of the increased costs maybe related to the
increased interest charges due to increased debt. With further examination of the statistics,
the author found that even the times of interest earned ratio before and after recession has no
68
significantly changes, the mean of this ratio did drop from 81 before the recession to 20 after
the recession.
Put all the factors together, the author concluded that among the thirteen ratios
employed in this study, three of them changed significantly before and after the recent
recession. The ratios of after recession period showed considerable deterioration in financial
leverage and profitability, indicated that the severe negative impact of the recent recession.
The deterioration may have cause by (1) the low sales as a result of low customers’ demand
during the recession, (2) the increased using of debt financing, and accompanying high
interest charges.
Findings of the recession’s impact on limited service
The group means of thirteen ratios for the limited service restaurants and their paired
samples t-test statistic results are reported in Table 11. The parallel non parametric Wilcoxon
statistic results are reported in Table 12. The statistical significant of t-tests on the differences
for all the ratios were greater than the 0.10 level, indicated that there is no significant changes
for limited service restaurants during the recession. However, the significant level of paired
samples t-test on P/BV ratio is close to the 0.10 level, 0.114. As shown in Table 12, the
associated significant level with Wilcoxon signed rank test for this ratio is 0.041, less than
the 0.05 level. Therefore, this is the evidence that for limited service restaurants, there was a
statistically significant difference in terms of P/BV ratio. As shown in Table 11, although
there is no significant evidence of deteriorations before and after the recession, from the
means, the author believed there were deteriorations to some extent for all five groups of

69
ratios. However, unlike full service restaurants, limited service restaurant fared well through
the recent recession.
Discussion of restaurant industry before and after the recession
This study continues to investigate the impact of the recent recession by comparing
means of 13 ratios prior and after the recession. The findings indicate that full service
restaurants were negatively affected by the recession in three major areas, namely debt ratio,
debt-to-equity ratio and gross profit margin ratio. Limited service restaurants, on the other
hand, were not significant affect by the recent recession.
The full service restaurants industry depends on the discretionary expenditures of
household, during the recession, the unemployment risen rapidly, while the consumer
sentiment and household income declined, under this economy, full service restaurants were
the first to feel the effect (Zwolak, 2010). During the recession, most operators of full service
restaurants were focused on surviving the recession. Customers were cut their spending on
visiting full service restaurants, even for these who still frequent restaurants were on a tighter
budget, they were searched for discounts and ordered few items. In response to the recession-
caused effect and trying to lure customer’s visits, menu prices were reduced, and new lower-
cost menu items were being substituted.
The gross profit margin of full service restaurants was significantly affected by the
recession. The major reasons were: (1) the increasing food, commodity and gas prices from
mid-2008; (2) the increases in minimum wages; (3) the declines in industry revenue.
According to the U.S. Bureau of Labor Statistics, wholesale food prices jumped about
7.6 percent in 2007 and continued to rise at 8.5 percent in 2008, the wholesale food price

70
inflation was highest in 27 years (Hensley & Stensson, 2008). Several individual food
commodities central to the majority of restaurant industry have increased dramatically during
2008, for instance, flour has risen 87%, eggs jumped about 73%, and other increases include
fat and oil, 49%; cheese, 27%; milled rice, 25%; and milk, 20% (Hensley & Stensson, 2008).
With food and beverage costs being one of the most significant line items for restaurant,
accounting for about 33 cents on every sales dollar, the NRA suggested that the increased
costs of food and beverage have a dramatic impact on the restaurants’ bottom line, which
average 4% to 6% (Hensley & Stensson, 2008).
Limited service restaurants were often forced either to raise prices or shave profits
from already slim bottom lines, they were struggled to maintain sales and offset the rising
costs. For instance, McDonald’s raised prices to keep up with food inflation, their strategy
was absorb some of the initial costs by gradually raise prices to recoup the cost of food
increases (Melendez, 2011). Other fast food restaurant firms made similar moves include
YUM Brands-parent of KFC, Pizza Hut and Taco Bell, and Wendy’s. According to Peter
Bensen, the chief financial officer of McDonald’s, “the atmosphere was right because
previous rounds of pricing changes had not dissuaded clients” (Melendez, 2011).
As customers paid more attention to the value and were extra sensitive to the menu
price during the recession, the restaurateurs of full service restaurants were trying to not pass
these increased costs on to customers, they were working hard to avoid menu price increases
unless absolutely necessary (Hensley & Stensson, 2008). In fact, throughout the recession,
full service restaurants offered many fire-sale bargains to attract traffic. For instance, crowd
came to Chili’s when it offered a three-for-$20 two-person promotion featuring a shared
appetizer, two entrees, and a shared dessert (Shee, 2011).

71
According to a survey done by the National Restaurant Association, the highest costs
reported by operators in the full service restaurants are costs of food and beverages, salaries
and wages. Profit margin in this industry is relatively small; this makes the full service
restaurant industry extremely vulnerable to the increases of food and commodity prices and
utility prices, and the increases in labor and benefit costs, given its labor-intensive nature.
From 2007 to 2008, full service restaurants were adversely affected by the increased wages
costs due to labor shortages. Benefits cost included health insurance benefits were also
increasing therefore increased the operating costs. In January 2008, Buffet Holdings Inc.
filed bankruptcy; it was largely blamed by external economic factors, such as the decline of
disposable income and significant increased food and energy prices, as well as the increased
minimum wages.

72
CHAPTER 5. CONCLUSIONS
Implications
The author examined the weekly stock indices of the full service and limited-service
restaurants, the overall restaurant industry, and the S&P 500 stock index by using ARIMA
with Intervention Analysis and t-tests. The results showed that limited service restaurants
were immune to the recession, and outperformed than full service restaurants and S&P 500
stock index. On the other hand, the full service restaurants segment was sensitive to the
changes in the economic environment. When recession hit, it reacted to it immediately; the
stock prices and gross profit recovered fairly rapidly after the recession, but this recovery
was at the price of far greater debt. The purpose of this study is to help practitioners and
investors to understand how different restaurants behaved differently through and after the
recession by examining their stock indices performance, and provide helpful suggestions and
tips to help them to cope with a similar market downturn. Especially now the U.S. economy
is facing the risk of a double-dip recession, it is core for restaurant operators and investors to
strategically plan ahead to survive another challenge.
The findings of this study are informative for the restaurant industry for many reasons.
First of all, the recent recession was the most severe in U.S. since the Great Depression,
therefore limited service restaurants might be recession proof. For long-term or cautious
investors, the stocks of limited service restaurants are countable since they were not decline
in such a sharp economic downturn; they are more secure than the stocks of full service
restaurants. Recessions are always bad news for stocks since they are marked by prolonged
declines in economic activity. However, even in a recession some companies and their stocks

73
do well. For investors, picking stocks to avoid the downturn is the difficult. From the weekly
stock indices, the author suggested that there were some great buying opportunities when the
economy dragged down the stock price. For example, investors who bought a portfolio of full
service restaurants when the stock prices reached a zenith and who cashed out after the full
service restaurant segment was fully recovered from the recession received impressive
returns. On the contrary, panic investors who bought the same portfolio before the recession
but who chose to cash out when the recession started definitely suffered a loss of some
magnitude. Thus the stocks of full service restaurants might be good choice for short-term or
adventurous investors. An economic slowdown or recession does not necessarily means that
it is time to sell the remaining stocks and safely store the money. Instead, the recession
should be a time to re-evaluate the investment strategy.
Second, many evidence showed that U.S. economy, even not confirmed in a double-
dip recession, might be headed for it, or at least it is not expected to fully bound in the near
future (Barro, 2012). The Treasury Real Yield Curve Rates (the interest rates the U.S.
government pays on bonds that are indexed to inflation) supported the author’s viewpoint.
From Appendix 2, as of October 1, 2012, they were negative for all bonds of less than 20
years maturity (United States Department of the Treasury, 2012). The negative rates mean
that investors are paying the government to take their money. This fact strongly suggests that
the investors are pessimistic about the ability of U.S. economy to create significant gains in
the near future (Krugman, 2012). For practitioners of full service restaurants, this suggests a
pressing change in strategic thinking. As the recent recession started, the stock prices of full
service restaurants first reacted to it in December 2007. Full service restaurants purchased
continued profitability at the expense of ever-greater debt. As economy continues as

74
expected, this is not a sustainable course of action. The operators must adjust their strategies
to deal with the slow economy.
The author summarized some efficient strategies from the past to deal with a
recession; the operators might find those strategies helpful under the current situation.
Promotions, coupons and affordable menu price seemed to be an efficient way to tide over
the recession. According to Joe Lutrario of Restaurant magazine (Skidelsky, 2009), “The
logic is that it’s better to get bums on seats, and maybe make a tiny profit on each one, than
allow places to stand half empty”, he explained more, “Restaurants have always made most
of their money on things like wine and mineral water, so even if the food is cheaper, they can
still do OK.” A vivid example here is, Little Bay, a London restaurant. Throughout the
February of 2009, it allowed diners to pay exactly what they want for food while drinks are
priced normally. Not only the place was packed but also the restaurant found that 80% of
customers paid more than normal (Skidelsky, 2009). Since consumers are being tempted to
voucher schemes, 2-for-1 offers and cheap menu price, the full service restaurants better set
affordable menu price to tide over market downturns.
According to a research of the National Restaurant Association, guest loyalty
programs helped restaurants grow business during the recession. Hudson Riehle, the National
Restaurant Association’s senior vice president of research and knowledge, says, “Repeat
customers are an important demographic for restaurant operators. Loyalty programs can
provide strong incentive to increase visits from those individuals” (Stensson, 2010). 90% of
operators who engaged in this research agreed loyalty programs give them a competitive
advantage while 77% of operators said loyalty programs helped drive repeat traffic during
the recession (Stensson, 2010). For limited service restaurants, since the profit margin is

75
already low, the operators may continue to put out more products, and continue to advertise
and promote. Since what customers value most about limited service restaurants are
convenience, relative low pricing, consistency of food quality, and speed of service,
operators should pay attention to those qualities and strive to remain competitive during a
recession.
To determine whether different types of restaurants differed financially, the author
examined 5 groups of 13 ratios of full service and limited services restaurants before the
recession. While the means of ratios seemed to differ substantially between these two types
of restaurant companies, the statistics showed that some of the leverage, profitability, and
market-based ratios were significantly different. To be more specific, debt ratio, gross profit
margin ratio, and P/E ratio were statistically significantly different between full service and
limited service restaurants.
Compared to full service restaurants, revenue volatility is low for limited service due
to the very high household penetration rate, therefore limited service restaurants have
relatively stable sales revenues, and that may boost their confidence in using debt financing.
They are optimistic about being able to cover the interest charges on debt incurred, and are
therefore induced to use more financial leverage to achieve higher returns. In addition, many
of them are large companies that may have easier access to financial leverage. On the other
hand, full service restaurants have volatile sales, and their relatively small size may put them
in a disadvantageous bargaining position when considering debt financing.
This study continued to investigate the impact of the recent recession by comparing
the means of 13 ratios before and after the recession. The findings indicate that full service
restaurants have been negatively affected by the recession in three major areas, namely debt

76
ratio, debt-to-equity ratio and gross profit margin ratio. The possible explanations have been
already discussed in the previous part. Limited service restaurants, on the other hand, were
not significantly affected by the recent recession.
The findings of this study carried crucial management implications for the restaurant
industry. This study endeavored to identify the major financial differences between the two
types of restaurants and to look for the areas that were significantly negatively affected by
the recent recession. The findings may help restaurant practitioners find possible ways to
improve financial performances. Many studies have shown that financial leverage ratios have
a significant impact on the performance of a company, which is consistent with the results of
this study. Mao and Gu suggested leverage variable has a significant negative effect on
restaurant performance, since the heavy indebtedness has the tendency to decrease the
company’s value in the capital market (2008). Therefore, the managers of U.S. restaurants
should try to lower their debt leverage. This negative impact suggests that the costs of using
debt overweighed its benefits. Optimal capital structure theory states that when the use of
debt exceeds its optimal level, the firm’s value declines (Moyer et al., 2001). Therefore,
reducing the use of debt would be beneficial to the industry. During the recession, the
challenging market conditions led to greater business risks for restaurant industry; it is well
known that excessive debt leads to higher risks because of the high interest charges and
principal repayment burden. Therefore, lowering the debt ratio may help offset the high risks.
The results of this study have particular relevancy for full service restaurants that have less
stable sales; they should keep the debt ratio low to neutralize the high risks and to enhance
the financial performance in the capital market. When the economy is booming, sales are
high; use of debt financing can further increase the return to the owner since the interest costs

77
are fixed (Youn & Gu, 2007). On the contrary, when the recession hits, the sales are
negatively affected by the recession; the interest charges due to using debt will further
depress the profitability. The author suggests that the restaurant companies should take
urgent measures to avoid using debt financing. Instead, they should use more conservative
financing such as issuing new equity. It is recommended that the restaurants take advantage
of the recovery of stock market after the recession, raise additional equity to improve their
financial performances.
Secondly, the managers of restaurants should concentrate more on improving
operation efficiency. During a recession, raising sales revenue with existing assets is more
crucial than expansion (Moyer et al., 2001). Restaurants lost sales during the recent recession,
to improve their financial performances; they should make efforts to raise sales. Although the
impact of the recession is inevitable, the managers should come up with solutions to
minimize the down effects.
Limitation
In this study, only publicly held restaurant firms were surveyed. Privately owned
companies and these were not large enough to list their stocks on large exchanged which not
included in this study may have been affected differently. Future research opportunities
should include these other companies, as well as examining limited service restaurants more
closely to determine whether they are proof to recessions.
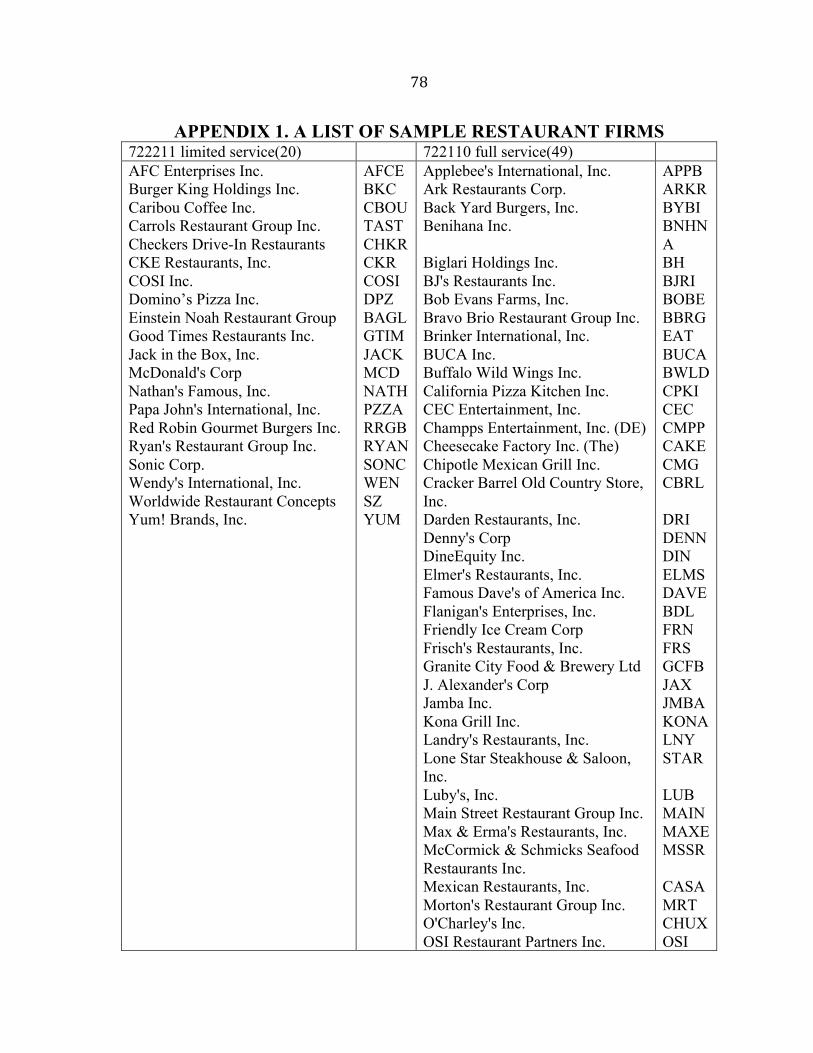
78
APPENDIX 1. A LIST OF SAMPLE RESTAURANT FIRMS 722211 limited service(20) 722110 full service(49) AFC Enterprises Inc. Burger King Holdings Inc. Caribou Coffee Inc. Carrols Restaurant Group Inc. Checkers Drive-In Restaurants CKE Restaurants, Inc. COSI Inc. Domino’s Pizza Inc. Einstein Noah Restaurant Group Good Times Restaurants Inc. Jack in the Box, Inc. McDonald's Corp Nathan's Famous, Inc. Papa John's International, Inc. Red Robin Gourmet Burgers Inc. Ryan's Restaurant Group Inc. Sonic Corp. Wendy's International, Inc. Worldwide Restaurant Concepts Yum! Brands, Inc.
AFCE BKC CBOU TAST CHKR CKR COSI DPZ BAGL GTIM JACK MCD NATH PZZA RRGB RYAN SONC WEN SZ YUM
Applebee's International, Inc. Ark Restaurants Corp. Back Yard Burgers, Inc. Benihana Inc. Biglari Holdings Inc. BJ's Restaurants Inc. Bob Evans Farms, Inc. Bravo Brio Restaurant Group Inc. Brinker International, Inc. BUCA Inc. Buffalo Wild Wings Inc. California Pizza Kitchen Inc. CEC Entertainment, Inc. Champps Entertainment, Inc. (DE) Cheesecake Factory Inc. (The) Chipotle Mexican Grill Inc. Cracker Barrel Old Country Store, Inc. Darden Restaurants, Inc. Denny's Corp DineEquity Inc. Elmer's Restaurants, Inc. Famous Dave's of America Inc. Flanigan's Enterprises, Inc. Friendly Ice Cream Corp Frisch's Restaurants, Inc. Granite City Food & Brewery Ltd J. Alexander's Corp Jamba Inc. Kona Grill Inc. Landry's Restaurants, Inc. Lone Star Steakhouse & Saloon, Inc. Luby's, Inc. Main Street Restaurant Group Inc. Max & Erma's Restaurants, Inc. McCormick & Schmicks Seafood Restaurants Inc. Mexican Restaurants, Inc. Morton's Restaurant Group Inc. O'Charley's Inc. OSI Restaurant Partners Inc.
APPB ARKR BYBI BNHN A BH BJRI BOBE BBRG EAT BUCA BWLD CPKI CEC CMPP CAKE CMG CBRL DRI DENN DIN ELMS DAVE BDL FRN FRS GCFB JAX JMBA KONA LNY STAR LUB MAIN MAXE MSSR CASA MRT CHUX OSI

79
722211 limited service(20) 722110 full service(49) P.F. Chang's China Bistro, Inc. Panera Bread Co. Quality Dining, Inc. RARE Hospitality International, Inc. Rubio's Restaurants, Inc. Ruby Tuesday, Inc. Ruth's Hospitality Group Inc. Star Buffet, Inc. Texas Roadhouse Inc. Western Sizzlin Corp (DE)
PFCB PNRA QDIN RARE RUBO RT RUTH STRZ TXRH WEST

80
APPENDIX 2. DAILY TREASURY REAL YIELD CURVE RATES Date 5 YR 7 YR 10 YR 20 YR 30 YR
10/01/12 -1.49 -1.22 -0.78 -0.02 0.42 10/02/12 -1.51 -1.22 -0.83 -0.07 0.37 10/03/12 -1.57 -1.28 -0.83 -0.08 0.35 10/04/12 -1.62 -1.33 -0.86 -0.09 0.34 10/05/12 -1.61 -1.29 -0.82 -0.05 0.38 10/09/12 -1.60 -1.29 -0.81 -0.05 0.37 10/10/12 -1.57 -1.27 -0.80 -0.04 0.38 10/11/12 -1.52 -1.22 -0.77 -0.02 0.39 10/12/12 -1.48 -1.18 -0.78 -0.02 0.39 10/15/12 -1.52 -1.22 -0.78 -0.03 0.40 10/16/12 -1.48 -1.17 -0.71 0.04 0.46 10/17/12 -1.44 -1.12 -0.65 0.09 0.49 10/18/12 -1.43 -1.12 -0.66 0.08 0.49 10/19/12 -1.42 -1.13 -0.71 0.01 0.42 10/22/12 -1.39 -1.11 -0.70 0.01 0.42 10/23/12 -1.38 -1.11 -0.71 -0.01 0.40 10/24/12 -1.37 -1.09 -0.69 0.01 0.42

81
REFERENCES
2007 NAICS Definition. (2011). Retrieved September 28, 2011 from
http://www.census.gov/cgi-bin/sssd/naics/naicsrch?code=722211&search=2007
NAICS Search
Altman, E.I. (1968). Financial ratios, discriminant analysis and the prediction of corporate
bankruptcy. Journal of Finance, 23, 589–607.
Anonymous. (2009). Fortune 500 2009: top performers-most profitable industries. CNN
Money. Retrieved January 30, 2012 from
http://money.cnn.com/magazines/fortune/fortune500/2009/performers/industries/profi
ts/
Barbaro, M., & Uchitelle, L. (2008). Americans cut back sharply on spending. U.S. News &
World Report. Retrieved November 17, 2011 from
http://www.nytimes.com/2008/01/14/business/14spend.html
Barro, R. (2012). Why This Slow Recovery is Like No Recovery. Wall Street Journal.
Beaver, W.G., 1966. Financial ratios as predictors of failure. Empirical Research in
Accounting:Selected Studies, 1967. Journal of Accounting Research 5 (Suppl.), 71–
102.
Blum, M. (1974). Failing company discriminant analysis. Journal of Accounting Research
12, 1–25.
Bonham, C., & Gangnes, B. (1996). Intervention analysis with cointegrated time series: the
case of the Hawaii hotel room tax. Applied Economics, 28, 1281-1293.
Borbely, J. M. (2009). U.S. labor market in 2008: economy in recession. Monthly Labor
Review, 132, 3-19.

82
Bowerman, B. L., Connell, R. T., & Koehler, A. B. (4th ed.). (2005), Forecasting, time series,
and regression: an applied approach. Belmont, CA: Brooks/ Cole.
Box, G. E. P., & Jenkins, G. M. (2nd ed.). (1976). Time series analysis forecasting and
control. San Francisco: Holden-Day.
Box, G. E. P., & Tiao, G. C. (1975). Intervention analysis with applications to economic and
environmental problem. Journal of the American Statistical Association, 70, 70–92.
Box, G.E.P, Jenkins, G.M., & Reinsel, G.C. (4th ed.). (1976). Time series analysis,
forecasting and control. Hoboken, NJ: Holden-Day.
Bureau of Economic Analysis. (2011). How did the recent GDP revisions change the picture
of the 2007-2009 recession and the recovery? Retrieved November 17, 2011 from
http://www.bea.gov/faq/index.cfm?faq_id=1004
Bury, C. (2008). Say goodbye to the $1 double cheeseburger. ABC News. Retrieved
November 17, 2011 from
http://abcnews.go.com/Business/story?id=5513875&page=1#.ULVi_dPjlSw
Campbell, D. T., & Ross, H. L. (1968). The Connecticut crackdown on speeding: time-series
data in quasi-experimental analysis. Journal of the law and society association, 3, 33-
54.
Campbell, K. (2011). How high unemployment hurts your investments. U.S. News & World
Report. Retrieved September 28, 2011 from
http://money.usnews.com/money/blogs/the-smarter-mutual-fund-
investor/2011/09/07/how-high-unemployment-hurts-your-investments

83
Caplan, J. (2008, October 10). Restaurants face lean times in the economic downturn. Time.
Retrieved January 15, 2011 from
http://www.time.com/time/nation/article/0,8599,1848402,00.html#ixzz1B8Ensx2K
CBS News. (2009). Recession took a bite of restaurant sales. Retrieved June 28, 2012 from
http://www.cbsnews.com/2100-500395_162-4693779.html
Chatfield, R. E., & Dalbor, M. C. (2005). Hospitality financial management. New Jersey:
Pearson Education, Inc.
Coltman, M. M. (1979). Financial management for the hospitality industry. Boston: CBI
Publishing Company, Inc.
Cote, R. (5th ed.). (2007). Accounting for hospitality managers. Lansing: American Hotel &
Lodging Educational Institute.
Dambolena, I.G., & Khoury, S.J. (1980). Ratio stability and corporate failure. Journal of
Finance, 35, 1017–1026.
Deakin, E.B. (1972). A discriminant analysis of predictors of business failure. Journal of
Accounting Research Spring, 10, 167–179.
Ding, Q. (2008). Fast food chains hungry for expansion. China Daily. Retrieved November
17, 2012 from http://www.chinadaily.com.cn/bizchina/2008-
12/30/content_7352215.htm
Dow Jones Indexes. (2011). Overview. Retrieved September 28, 2011 from
http://www.djaverages.com/?go=industrial-overview
Enders, W. (1995). Applied econometric time series. New York: Wiley.
Enders, W., & Sandler, T. (1990). Assessing the impact of terrorist-thwarting policies: An
intervention time series approach. Defense Economics, 2, 1–18.

84
Enis, M. (2009). Recession worsens restaurant outlook. Supermarket News. Retrieved
September 28, 2011 from http://subscribers.supermarketnews.com/In-
Store_Bakery_Deli_Meals/recession-worsens-restaurant-0209/
Fitzsimmons, J. A. & Maurer, G. B. (1991). A walk-through audit to improve restaurant
performance. Cornell H.R.A. Quarterly, 31, 95-99.
Fox, R. T. (1996). Using intervention analysis to assess catastrophic events on business
environment. International advances in economic research, 2, 341-349.
Franz, L. W. (2010). Consistency of the stock market in anticipating economic cycles.
Journal of business & economic research, 8, 53-58.
from http://krugman.blogs.nytimes.com/
Gaffen, D. (2009). By the numbers-How 2008 shakes out. The Wall Street journal. Retrieved
September 28, 2011 from http://blogs.wsj.com/marketbeat/2009/01/02/by-the-
numbers-how-2008-shakes-out/
Gitman, L. J., Joehnk, M. D., & Smart, S. J. (11th ed.). (2010). Fundamentals of Investing.
Boston: Pearson Education, Inc.
Gu, Z. (1993). Debt use and profitability: Reality check for the restaurant industry. Journal of
Foodservices Systems, 7, 135-147.
Gu, Z. (1996). Financial ratios of the restaurant industry by types of operations: before and
after the recent recession. The bottom line, 11(3), 20-22.
Gu, Z. (2002). Analyzing bankruptcy in the restaurant industry: a multiple of discriminant
model. International Journal of Hospitality Management, 21, 25-42.

85
Handley, M. (2011). What style of index investing is right for you? US News. Retrieved
January 30, 2012 from http://money.usnews.com/money/personal-finance/mutual-
funds/articles/2011/03/03/what-style-of-index-investing-is-right-for-you
Harvey, C. R. (1989). Forecasts of economic growth from the bond and stock markets.
Financial Analysts Journal, 45, 38-45.
Hensley, S., & Stensson, A. (2008). National restaurant association member testifies on food
price increases at congressional hearing. National Restaurant Association. Retrieved
November 17, 2012 from http://www.restaurant.org/pressroom/pressrelease/?id=1608
Ismail, Z., Suhartono, Yahaya, A., & Efendi, R. (2009). Intervention model for analyzing the
impact of terrorism to tourism industry. Journal of mathematic and statistics, 5, 322-
329.
Jagels, M. G., & Coltman, M. M. (8th ed.). (2004). Hospitality management accounting. New
Jersey: John Wiley & Sons, Inc.
Kelso, A. (2012). Remodeled Wendy’s units exceeding 25 percent sales growth. QSRWeb.
Retrieved November 17, 2012 from
http://www.qsrweb.com/article/196743/Remodeled-Wendy-s-units-exceeding-25-
percent-sales-growth
Korkki, P. (2008, March 30). Does recession mean doom for restaurants? The New York
Times. Retrieved January 10, 2011 from
http://www.nytimes.com/2008/03/30/business/30count.html?_r=1&scp=1&sq=recessi
on%20restaurant&st=Search

86
Krantz, M. (2009). Restaurants struggle as consumers eat at home. USA Today. Retrieved
September 28, 2011 from http://www.usatoday.com/money/industries/food/2009-02-
22-recession-struggle-restaurants_N.htm
Krugman, P. (2012).Free Money. New York Times. Retrieved July 26, 2012
Kumcu, A., & Kaufman, P. (2011). Food spending adjustments during recessionary times.
USDA Economic Research Service. Retrieved November 17, 2011 from
http://www.ers.usda.gov/amber-waves/2011-september/food-spending.aspx
Lawder, K. (1989). Ratio 101: Back to the basics of financial analysis. Business Credit,
91(6), 28-30.
Lee, S., Oh, C. & O’Leary, J. (2005). Estimating the impact of the September 11 terrorist
attacks on the US air transport passenger demand using intervention analysis.
Tourism Analysis, 9, 355-361.
Lim, P. J. (2008). A recession’s impact is all in the timing. The New York Times. Retrieved
November 17, 2011 from http://www.nytimes.com/2008/01/20/business/20fund.html
Mao, Z., & Gu, Z. (2008). The relationship between financial factors and firm performance:
empirical evidence from U.S. restaurant firms. Journal of Foodservice Business
Research, 11 (2), 138-159. doi: 10.1080/15378020801995564
McCleary, R., & Hay, R. (1980). Applied time series analysis. Beverly Hills, CA: Sage
Publication.
McDowall, D., McCleary, R., Meidinger, E.E., & Hay, R.A. (1980). Interrupted Time Series
Analysis. Newbury Park, CA: Sage Publications, Inc.
Melendez, E. (2011). Restaurant meal prices likely to rise in coming months, play catch-up to
food cost inflation. International Business Times. Retrieved November 17, 2012 from

87
http://www.ibtimes.com/restaurant-meal-prices-likely-rise-coming-months-play-
catch-food-cost-inflation-212883
Mendenhall, W., & Sincich, T. (6th ed.). (2003). A second course in statistics: regression
analysis. New Jersey: Pearson Education, Inc.
Miller, I., & Miller, M. (7th ed.). (2004). John E. Freund’s mathematical statistics with
applications. New Jersey: Pearson Education, Inc.
Min, J.C.H., Lim, C., & Kung, H. (2010). Intervention analysis of SARS on Japanese tourism
demand for Taiwan. Quality & Quantity, 45, 91-102.
Mollenkamp, C., Craig, S., Ng, S., & Lucchetti, A. (2008). Lehman files for bankruptcy,
Merrill sold, AIG seeks cash. The Wall Street Journal. Retrieved November 17, 2011
from http://online.wsj.com/article/SB122145492097035549.html
Montgomery, D. C., & Weatherby, G. (1980). Modeling and forecasting time series using
transfer function and intervention models. AIIE Transactions, 289–307.
Moyer, R. C., McGuigan, J. R., & Kretlow, W. J. (8th ed.). (2001). Contemporary financial
management. Cincinnati: Thomson Learning.
Mulligan, C. B. (2009). How long until the stock market fully rebounds? U.S. News & World
Report. Retrieved November 17, 2011 from
http://economix.blogs.nytimes.com/2009/02/11/how-long-until-the-stock-market-
fully-rebounds/
National Restaurant Association. (2008). National economy plunges deeper into recession.
Retrieved September 28, 2011 from
http://www.restaurant.org/pdfs/research/economic_commentary_120508.pdf

88
National Restaurant Association. (2009). 2009 restaurant industry pocket factbook. Retrieved
June 28, 2012 from http://www.restaurant.org/pdfs/research/2009Factbook.pdf
National Restaurant Association. (2012). Facts at a glance. Retrieved June 28, 2012 from
http://www.restaurant.org/research/facts/
Nelson, J. I. (2001). On mass distribution: a case study of chain stores in the restaurant
industry. Journal of consumer culture, 1, 119-138.
Newman, R. (2009). Restaurants on a roll. U.S. News & World Report. Retrieved September
28, 2011 from
http://money.usnews.com/money/blogs/flowchart/2009/11/04/restaurants-on-a-roll
Norris, F. (2010). As dividends have fallen, so may they rise. U.S. News & World Report.
Retrieved November 17, 2011 from
http://www.nytimes.com/2010/01/09/business/09charts.html
North American Industry Classification System Main page. (2011). Introduction. Retrieved
September 28, 2011 from http://www.census.gov/eos/www/naics/
O’Brien, K. (2012). How McDonald’s came back bigger than ever. The New York Times.
Retrieved November 17, 2011 from
http://www.nytimes.com/2012/05/06/magazine/how-mcdonalds-came-back-bigger-
than-ever.html?pagewanted=all
Oh, C. O., & Ditton, R. B. (2006). A time series approach to estimating the economic
impacts of exogenous events on a local economy. Proceedings of the 2006
northeastern recreation research symposium.

89
Retrieved July 22, 2012 from
http://online.wsj.com/article/SB10001424052702303918204577444222179044362.ht
ml
Rosenberg, Y. (2009, January 9). A stock to stomach tough times. CNN Money. Retrieved
January 3, 2011 from
http://money.cnn.com/2009/01/09/magazines/fortune/investing/investor_daily.fortune
/index.htm
Ruggless, R. (2010). Recession’s end cold comfort to industry still feeling its effects.
Nation’s Restaurant News. Retrieved September 28, 2011 from
http://www.nrn.com/article/recession%E2%80%99s-end-cold-comfort-industry-still-
feeling-its-effects
S&P Indices. (2011). Retrieved September 28, 2011 from
http://www.standardandpoors.com/indices/sp-500/en/us/?indexId=spusa-500-usduf--
p-us-l--
SAS Institute Inc. (2010), SAS/ETS® 9.22 User’s Guide, Cary, NC: SAS Institute Inc.
Retrieved April 27, 2011 from
http://support.sas.com/documentation/onlinedoc/ets/index.html
Schmidgall, R. (1989). Financial ratios: Perceptions of lodging industry general managers
and financial executives. FIU Hospitality Review, 7(2), 1-9.
Schmidgall, R. S. (6th ed.). (2006). Hospitality industry managerial accounting. Lansing, MI:
Educational Institute of the American Hotel and Lodging Association.
Schmidgall, R. S., Hayes, D. K., & Ninemeier, J. D. (2002). Restaurant financial basics. New
Jersey: John Wiley & Sons, Inc.

90
Schmidgall, R., & DeFranco, A. (2004). Ratio analysis: Financial benchmarks for the club
industry. The Journal of Hospitality Financial Management, 12(1), 1–15.
Schwert, G. W. (1990). Stock market volatility. Financial Analysts Journal, 46, 23-34.
Scott, D. F., Jr., Martin, J. D., Petty, J. W., & Keown, A. J. (8th ed.). (1999). Basic financial
management. Upper Saddle River, NJ: Prentice-Hall, Inc.
Shee, J. (2011). What happened to table service? QSR Magazine. Retrieved November 17,
2012 from http://www.qsrmagazine.com/competition/what-happened-table-service
Sheel, A. (2008). US economy, recession and its impact on the US tourism, hotel and
restaurant business: a brief review. Journal of hospitality financial management, 16,
8.
Shinkle, K. (2008). The crash of 2008. U.S. News & World Report. Retrieved September 28,
2011 from http://money.usnews.com/money/personal-
finance/investing/articles/2008/10/17/the-crash-of-2008
Singh, A., & Schmidgal, R. (2002). Analysis of financial ratios commonly used by US
lodging financial executives. Journal of Leisure Property, 2(3), 201-214.
Skidelsky, W. (2009). Downturn dining. New Statesman. 138, 18-19.
Solin, D. (2011). Jeremy Siegel is wrong: Stocks aren’t cheap. U.S. News & World Report.
Retrieved September 28, 2011 from http://money.usnews.com/money/blogs/On-
Retirement/2011/09/08/jeremy-siegel-is-wrong--stocks-arent-cheap
Sorkin, A. (2008). Lehman files for bankruptcy; Merrill is sold. The New York Times.
Retrieved November 17, 2011 from
http://www.nytimes.com/2008/09/15/business/15lehman.html?pagewanted=all&_r=0
Sprinthall, R. C. (1997). Basic statistical analysis. Boston: Allyn and Bacon.

91
Standard & Poor’s. (2011). S&P Indices. Retrieved November 17, 2011 from
https://www.sp-
indexdata.com/idpfiles/indexalert/prc/active/factsheets/Factsheet_SP_500.pdf
Stensson, A. (2012). Economist’s notebook: rising gas prices cutting into restaurants’ bottom
lines. Retrieved June 28, 2012 from
http://www.restaurant.org/nra_news_blog/2012/03/economists-notebook-rising-gas-
prices-cutting-into-restaurants-bottom-lines.cfm
Stephanopoulos, G. (Interviewer) & Obama, B. (Interviewee). (2009). This Week [Interview
transcript]. ABC News. Retrieved April 3, 2011 from
http://abcnews.go.com/ThisWeek/Economy/story?id=6618199&page=1
Sum, A., Khatiwada, I., McLaughlin, J., & Palma, S. (2009). The economic recession of
2007-2009: a comparative perspective on its duration and the severity of its labor
market impacts. Center for Labor Market Studies Publications, 20.
Taffler, R. (1982). Forecasting company failure in the UK using discriminant analysis and
financial ratio data. Journal of the Royal Statistical Society,145 (3), 342–348.
Taffler, R., & Tisshaw, H. (1977). Going, going, going four factors which predict?
Accountancy, 88, 50–54.
The Economist. (2010). Good and hungry. Retrieved November 17, 2011 from
http://www.economist.com/node/16380043
The National Bureau of Economic Research. (2010). US business cycle expansions and
contractions. Retrieved April 27, 2011 from http://www.nber.org/cycles/

92
The NDP Group. (2009). The NDP Group’s twenty-fourth annual report on eating patterns in
America 2009. Retrieved November 17, 2011 from www.npd.com/.../24th-Eating-
Patterns-In-America-TableofContents
Trowbridge, D. (2011). Fuel costs cut into restaurants’ thin profit margins. The Columbus
dispatch. Retrieved November 17, 2011 from
http://www.dispatch.com/content/stories/business/2011/04/19/fuel-costs-cut-into-
restaurants-thin-profit-margins.html
Tuttle, B. (2012). Fast food’s new mantra: remodel and they will come (and spend). Time.
Retrieved November 17, 2012 from http://business.time.com/2012/07/10/fast-foods-
new-mantra-remodel-and-they-will-come-and-spend/
U.S. Securities and Exchange Commission. (2007). Market capitalization. Retrieved
November 17, 2011 from http://www.sec.gov/answers/marketcapitalization.htm
U.S. Securities and Exchange Commission. (2007). Market indices. Retrieved November 17,
2011 from http://www.sec.gov/answers/indices.htm
United States Department of the Treasury. Retrieved on July 26, 2012 from
http://www.treasury.gov/resource-center/data-chart-center/interest-
rates/pages/textview.aspx?data=realyield
Upneja, A., Kim, H. & Singh, A. (2000). Differences in financial characteristics between
small and large firms: An empirical examination of the casino industry. The Journal
of Hospitality Financial Management, 8 (1), 23-35.
Valuation of the restaurant industry. (1999).Weekly Corporate Growth Report, 1062, 1-3.
Van Horne, J.C. (1998). Financial Management and Policy. Upper Saddle River, NJ:
Prentice-Hall, Inc.

93
Walker, J. R. (3rd ed.). (2002). Introduction to hospitality. Upper Saddle River, NJ: Pearson
Education.
Youn, H. W., & Gu, Z. (2007). A logit model for predicting Korean lodging firm business
failure. World Journal of Tourism and Small Business Management, 1 (1), 74-82.
Youn, H., & Gu, Z. (2010). U.S. restaurant firm performance check: An examination of the
impact of the recent recession. Journal of Hospitality Financial Management, 17 (2),
4.
Zwolak, R. (2010). IBISWorld industry report 72211 full service restaurants in the US.
IBISWorld.
Zwolak, R. (2010). IBISWorld industry report 72221 fast food restaurants in the US.
IBISWorld.