how carriers price their freight may 24, 2012 website:
TRANSCRIPT

How Carriers Price Their FreightMay 24, 2012
Website: www.3PLogistics.com

Copyright © 2012 Armstrong & Associates, Inc.
ATA Not-Seasonally Adjusted (NSA) Truck Tonnage Index Trends
2
Source: ATA Truck Tonnage, Morgan Stanley Research
Straight-Line Forecast for Monthly YoY % Change in ATA NSA Truck Tonnage Index

Copyright © 2012 Armstrong & Associates, Inc.
Cass Shipment Index Trends & Straight-Line Forecast
3
Source: Cass Freight Index, Morgan Stanley Research
Straight-Line Forecast for Monthly YoY % Change in Cass Shipment Index
Copyright © 2012 Armstrong & Associates, Inc.
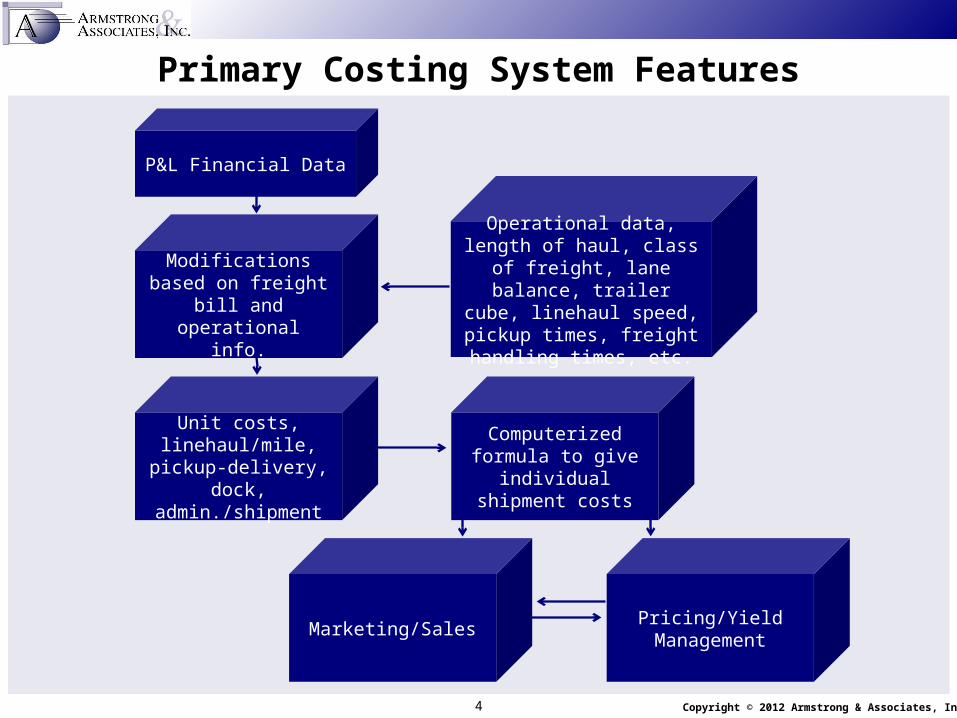
Primary Costing System Features
4
P&L Financial Data
Modifications based on freight bill and operational info.
Operational data, length of haul, class of freight, lane
balance, trailer cube, linehaul speed, pickup times,
freight handling times, etc.
Unit costs, linehaul/mile,
pickup-delivery, dock, admin./shipment
Computerized formula to give individual shipment costs
Pricing/Yield Management
Marketing/Sales

Copyright © 2012 Armstrong & Associates, Inc.
Cost Per Mile Comparisons for Carrier X
5
CPM without fuel - all milesCPM with fuel - all milesCPM loaded miles

Copyright © 2012 Armstrong & Associates, Inc.
Mileages – Cost Relationships
6
ShipmentWeight
Mileage at which Pickup-Delivery Cost is 50% or Greater of Total Cost
Mileage at which Linehaul Costs Exceed Terminal Costs*
200 825 None
500 475 1,740
1,000 450 1,175
2,000 240 915
5,000 180 485
10,000 175 415
20,000 145 215
40,000 225 240
*Terminal costs include pickup-delivery, platform and billing-collecting.

Copyright © 2012 Armstrong & Associates, Inc.
Fuel Prices
7
Sources: U.S. Energy Information Administration, Bloomberg News / Graphic by Transport Topics
$4.06
$98.00

Copyright © 2012 Armstrong & Associates, Inc.
Fuel Surcharge
8
Base $1.20Fuel Cost $4.00Difference $2.80
Miles Per Gallon Fuel Surcharge5.5$0.516.0$0.476.5$0.43
Issues: 1) Short Haul MPG <5.52) Empty Miles 10-25% (Biggest Challenge <300
Miles)
Copyright © 2012 Armstrong & Associates, Inc.
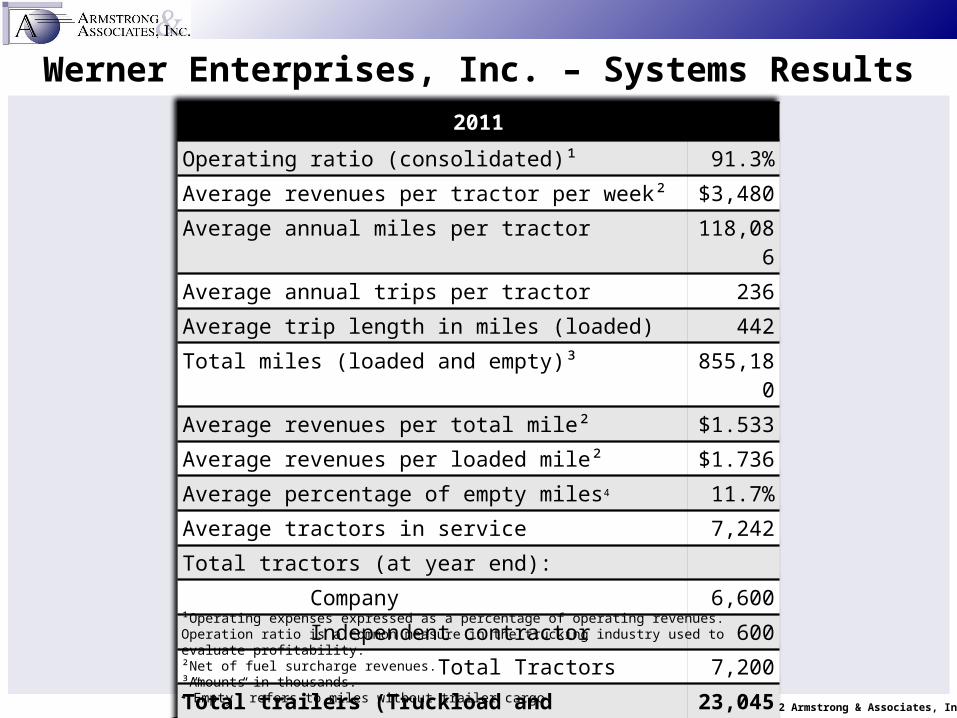
Werner Enterprises, Inc. – Systems Results
9
2011
Operating ratio (consolidated)¹ 91.3%Average revenues per tractor per week² $3,480Average annual miles per tractor 118,086Average annual trips per tractor 236Average trip length in miles (loaded) 442Total miles (loaded and empty)³ 855,180Average revenues per total mile² $1.533Average revenues per loaded mile² $1.736Average percentage of empty miles4 11.7%Average tractors in service 7,242Total tractors (at year end): Company 6,600 Independent contractor 600 Total Tractors 7,200Total trailers (Truckload and Intermodal, at year end)
23,045
¹Operating expenses expressed as a percentage of operating revenues. Operation ratio is a common measure in the trucking industry used to evaluate profitability.²Net of fuel surcharge revenues.³Amounts in thousands.4”Empty” refers to miles without trailer cargo.

Copyright © 2012 Armstrong & Associates, Inc.
Werner Enterprises, Inc. – Operating Expenses per Mile
10
2011
Salaries, wages and benefits $.596Fuel .481Supplies and maintenance .186Taxes and licenses .108Insurance and claims .078Depreciation .182Rent and purchased transportation .166Communications and utilities .017Other (.016) Total $1.798
Note: Fuel expense line does NOT include owner operator fuel.

Thank You!
Stoughton Wisconsin OfficeRichard Armstrong
Armstrong & Associates, Inc.100 Business Park Circle
Suite 202Stoughton, WI 53589 USA
608-873-8929
Milwaukee Wisconsin OfficeEvan Armstrong
Armstrong & Associates, Inc.10401 West Lincoln Avenue
Suite 207West Allis, WI 53227 USA
414-545-3838