how can i make a profit and still run out of cash? cash management
TRANSCRIPT

HOW CAN I MAKE A PROFIT AND STILL RUN OUT OF CASH?Cash Management

Foundations Update
…and the market will continue to be competitive More products More aggressive More options

Round 1

Round 2
Plus:
• A??
• Bold
• Cent
• Dabble
• East
• Feast

Now Many Products ?

The story thus far…
Key points of strategy: Product characteristics
positioning matching ideal spot - critical in High Tech segment
Margin pricing not high enough costs not low enough
automation too low low tech positioning too aggressive MTBF too high

The story thus far…
Sales forecasts possibly not accounting for lag in product introduction
may need to plan for full-scale product demand in 2 years – not 1
Liquidation older products?
Products developing new products v. repositioning current
products a viable strategy? What are the trade-offs? Cash management
running out of cash & making a profit?

Business Activities
Your Cash Management decisions:1. Operating: using $
create goods /services/ exchanges
2. Investing: what do you do with $ acquire assets (stuff) to run a business loan $ to others (who earn higher return)
3. Financing: where do you get $ funds to start and grow a business debt / equity / retained earnings

What Is Working Capital?
Working capital Cash a business requires for day-to-day operations Financing the conversion of raw materials into
finished goods
On the Balance Sheet, Working Capital shows up as:
Current Assets - Current Liabilities (cash, inventory, accounts receivable) (accounts payable)
Analysts look at these items for signs of a company's efficiency and financial strength.
So Why Do WE Run Out Of Money?

1. Failure to Finance

Working Capital and Cash Flow
Operating
Inventory
Sales
Accounts Receivable
Cash
Raw Materials
If you turn a lot of cash into inventory
but, less inventory back into cash (a lot of inventory left over)
you run out of cash (its in the warehouse waiting to be changed back)
Accounts Payable

jan feb mar april may june july aug sept oct nov dec
75 75 75 75 75 75 75 75 75 75 75 75
Produce 600 in a year…with 1 shift
2. Product Availability
50 50 50 50 50 50 50 50 50 50 50 50
50 50 50 50 50 50 50 50 50 50 50 50
Produce 1200 in a year…with 2 shifts
July 15th Announcement date from R&D

Product Availability


3. Poor Forecasting
NamePrimary
SegmentUnits Sold
Units in Inventory
Revision Date
Age Dec.31
MTBFPfmn Coord
Size Coord
PriceMaterial
CostLabor Cost
Contr Marg.
Able Low 1,483 424 13-Jan-14 2.9 19000 6.3 13.5 $34.90 $10.51 $13.13 29%
Awesom High 424 499 19-Apr-14 1.5 19000 8.9 11.9 $44.95 $14.75 $11.37 31%
Units * (Labor + Material) = Product Cost 424,000 * $23.64 = $10,023,360499,000 * $26.12 = $13,033,880
$23,057,240
Inventory * Sales Price = Potential Revenue
424,000 * $34.90 = $14,797,600499,000 * $44.95 = $22,430,050
$37,227,650
Money Spent
Revenue NotYet Received

Inventory
Too little inventory sell all the sensors you make ==> Stock Out lost sales & opportunities
Too much inventory inventory is expensive- it ties up cash product “ages” and is less desirable reduces future year production resulting in laying off
workforce
Just right 1 or more units left less than 60 days (production scheduled/6)

Balance SheetASSETS 2014 2013
Common Size Cash $0 0.0% $0 Accounts Receivable $5,820 6.3% $6,657 Inventory $23,750 25.7% $16,058 Total Current Assets $29,570 32.0% $22,715
Plant & Equipment $79,890 86.5% $53,570 Accumulated Depreciation ($17,139) -18.6% ($11,813)Total Fixed Assets $62,751 68.0% $41,757
Total Assets $92,321 100.0% $64,471
LIABILITIES & OWNER'S EQUITY
Accounts Payable $4,509 4.9% $5,609 Current Debt $19,116 20.7% $5,303 Long Term Debt $24,100 26.1% $17,833 Total Liabilities $47,725 51.7% $28,745
Common Stock $22,823 24.7% $12,823 Retained Earnings $21,773 23.6% $22,902 Total Equity $44,596 48.3% $35,725
Total Liabilities and Owner's Equity $92,321 100.0% $64,471
OperatingWorking Capital
OperatingWorking Capital
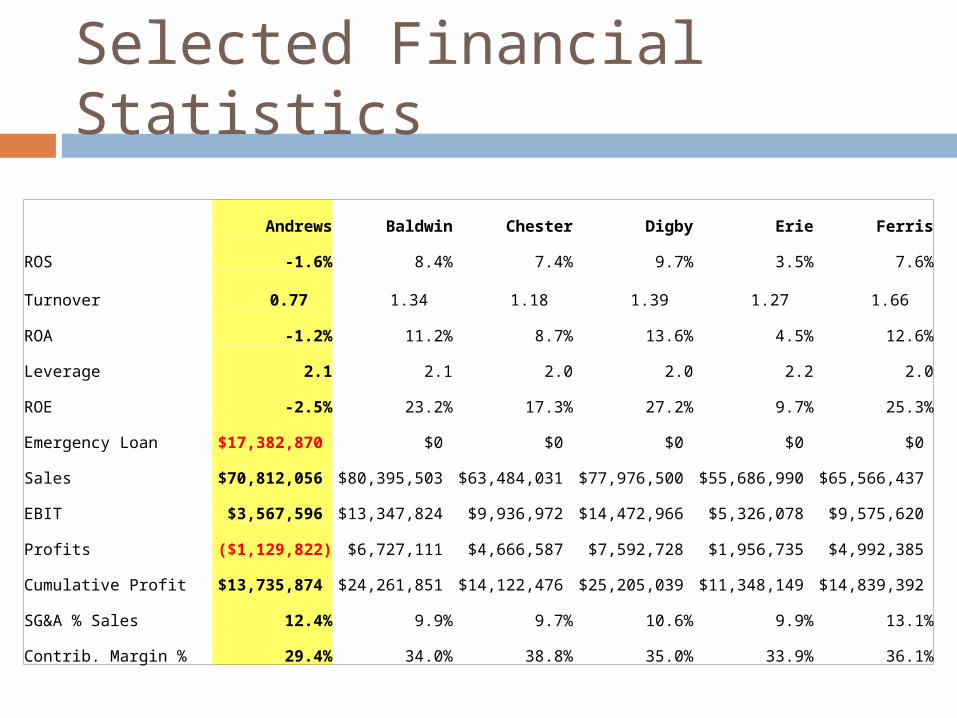
Selected Financial Statistics
Andrews Baldwin Chester Digby Erie Ferris
ROS -1.6% 8.4% 7.4% 9.7% 3.5% 7.6%
Turnover 0.77 1.34 1.18 1.39 1.27 1.66
ROA -1.2% 11.2% 8.7% 13.6% 4.5% 12.6%
Leverage 2.1 2.1 2.0 2.0 2.2 2.0
ROE -2.5% 23.2% 17.3% 27.2% 9.7% 25.3%
Emergency Loan $17,382,870 $0 $0 $0 $0 $0
Sales $70,812,056 $80,395,503 $63,484,031 $77,976,500 $55,686,990 $65,566,437
EBIT $3,567,596 $13,347,824 $9,936,972 $14,472,966 $5,326,078 $9,575,620
Profits ($1,129,822) $6,727,111 $4,666,587 $7,592,728 $1,956,735 $4,992,385
Cumulative Profit $13,735,874 $24,261,851 $14,122,476 $25,205,039 $11,348,149 $14,839,392
SG&A % Sales 12.4% 9.9% 9.7% 10.6% 9.9% 13.1%
Contrib. Margin % 29.4% 34.0% 38.8% 35.0% 33.9% 36.1%

Where is the Working Capital?
Cash has been depleted from last year It was eaten up by inventory – a result of poor sales
forecasting Carrying costs
Accounts payable increased Partially offsets high inventory levels
(it is like an interest free loan from vendors) Current Debt has increased by $19,116,000
If sales are increasing and need to fund inventory and accounts receivables (current assets), this may be justified.
It is not a good idea to fund long term assets (plant and equipment) with short term debt, because it could take years for this investment to pay off.

Business Activities
Your Cash Management decisions:1. Operating: using $ Operating: using $
create goods /services/ exchangescreate goods /services/ exchanges2. Investing: what do you do with $
acquire assets (stuff) to run a businessrenting $ to others (who earn higher return)
3. Financing:Financing: where do you get $where do you get $funds to start and grow a business funds to start and grow a business (debt / equity / retained earnings)(debt / equity / retained earnings)
Investing
Create the company you want to run? Build a new factory? Increase capacity for a current product? Increase Automation?
All will increase Plant & Equipment… Any increase in the value of plant and equipment is a
long term investment in your company You should generate the funds from – Long term sources:
Retained earnings Bonds Stock

Balance SheetASSETS 2014 2013
Common Size Cash $0 0.0% $0 Accounts Receivable $5,820 6.3% $6,657 Inventory $23,750 25.7% $16,058 Total Current Assets $29,570 32.0% $22,715
Plant & Equipment $79,890 86.5% $53,570 Accumulated Depreciation ($17,139) -18.6% ($11,813)Total Fixed Assets $62,751 68.0% $41,757
Total Assets $92,321 100.0% $64,471
LIABILITIES & OWNER'S EQUITY
Accounts Payable $4,509 4.9% $5,609 Current Debt $19,116 20.7% $5,303 Long Term Debt $24,100 26.1% $17,833 Total Liabilities $47,725 51.7% $28,745
Common Stock $22,823 24.7% $12,823 Retained Earnings $21,773 23.6% $22,902 Total Equity $44,596 48.3% $35,725
Total Liabilities and Owner's Equity $92,321 100.0% $64,471
OperatingWorking Capital
OperatingWorking Capital
Investing

Business Activities
Your Cash Management decisions:1. Operating: using $ Operating: using $
create goods /services/ exchangescreate goods /services/ exchanges2. Investing:Investing: what do you do with $what do you do with $
acquire assets (stuff) to run a businessacquire assets (stuff) to run a businessrenting $ to others (who earn higher renting $ to others (who earn higher return)return)
3. Financing: where do you get $funds to start and grow a business (debt / equity / retained earnings)

Financing
Funds to grow & operate Borrow- issue bonds Take on owners- Issue stock Reinvest profits- increase retained earnings
Extra cash (no investments to make)
retire bonds (lower interest payments) retire stock (only if stock price is low) pay dividend - (increase stock price)
Give the money back to rightful owners if you don’t have anything better to do with it

Financing…
Put your worst case scenario in Marketing’s Unit Sales Forecast
Finance long term investments with long term options (stock or bonds)
Cover operating expenses with short term loans
Ending cash position target 3.5% and 7% of total assets

Balance SheetASSETS 2014 2013
Common Size Cash $0 0.0% $0 Accounts Receivable $5,820 6.3% $6,657 Inventory $23,750 25.7% $16,058 Total Current Assets $29,570 32.0% $22,715
Plant & Equipment $79,890 86.5% $53,570 Accumulated Depreciation ($17,139) -18.6% ($11,813)Total Fixed Assets $62,751 68.0% $41,757
Total Assets $92,321 100.0% $64,471
LIABILITIES & OWNER'S EQUITY
Accounts Payable $4,509 4.9% $5,609 Current Debt $19,116 20.7% $5,303 Long Term Debt $24,100 26.1% $17,833 Total Liabilities $47,725 51.7% $28,745
Common Stock $22,823 24.7% $12,823 Retained Earnings $21,773 23.6% $22,902 Total Equity $44,596 48.3% $35,725
Total Liabilities and Owner's Equity $92,321 100.0% $64,471
OperatingWorking Capital
OperatingWorking Capital
Investing
Financing

Cash Flow StatementCash Flows from Operating Activities 2014 2013Net Income (Loss) ($1,130) $5,218 ProfitAdjustment for non-cash items
Depreciation $5,326 $3,571 Extraordinary gains/losses/writeoffs $0 $0
Change in Current Assets and Liabilities Accounts Payable ($1,101) $1,488 Inventory ($7,692) ($15,149) Too much inventoryAccounts Receivable $837 ($1,057)
Net cash from operations ($3,760) ($5,928)
Cash Flows From Investing Activities Plant Improvements ($26,320) ($19,940) Increased Production
Cash Flows from Financing Activities Dividends Paid $0 $0 Sales of Common Stock $10,000 $7,000 Issue StockPurchase of Common Stock $0 $0 Cash from long term debt $8,000 $9,000 Issue BondsRetirement of long term debt ($1,733) $0 Change in current debt (net) $13,813 $4,436 Emergency LoanNet cash from financing activities $30,080 $20,436
Net change in cash position $0 ($5,432)
Closing cash position $0 $0

Cash Flow StatementCash Flows from Operating Activities 2014Net Income (Loss) ($1,130)Adjustment for non-cash items
Depreciation $5,326 Extraordinary gains/losses/writeoffs $0
Change in Current Assets and LiabilitiesAccounts Payable ($1,101)Inventory ($7,692) Too much inventoryAccounts Receivable $837 And
Net cash from operations ($3,760) A huge investment
In plant andCash Flows From Investing Activities equipmentPlant Improvements ($26,320)
Cash Flows from Financing ActivitiesDividends Paid $0 Sales of Common Stock $10,000 Too little
Purchase of Common Stock $0 Long termfinancing
Cash from long term debt $8,000 Retirement of long term debt ($1,733) And youChange in current debt (net) $13,813 Take anNet cash from financing activities $30,080 Emergency loan
Net change in cash position $0
Closing cash position $0

2013 Common 2014Product Name Able Awesom Total SizeSales $51,744 $19,068 $70,812 100.0% $80,993 Variable Costs Direct Labor $19,131 $4,948 $24,078 34.0% $23,649 Direct Material $16,514 $6,569 $23,084 32.6% $29,451 Inventory Carry $1,223 $1,627 $2,850 4.0% $1,927 Total Variable Costs $36,868 $13,144 $50,012 70.6% $55,027 Contribution Margin $14,876 $5,924 $20,800 29.4% $25,966 Period Costs Depreciation $2,400 $2,926 $5,326 7.5% $3,571 SG&A: R&D $35 $300 $335 0.5% $554
Promotions $1,400 $1,800 $3,200 4.5% $3,600 Sales $1,800 $1,800 $3,600 5.1% $3,600 Admin $1,185 $437 $1,621 2.3% $3,021
Total Period Costs $6,820 $7,263 $14,083 19.9% $14,347 Net Margin $8,056 ($1,338) $6,718 9.5% $11,619
Other $3,150 4.4% $800 EBIT $3,568 5.0% $10,819 Short Term Interest $2,796 3.9% $766 Long Term Interest $2,510 3.5% $1,862 Taxes ($608) -0.9% $2,867 Profit Sharing $0 0.0% $106 Net Profit ($1,130) -1.6% $5,218
Income Statement