how advanced is your service supply chain? · supply chain performance, it’s not limited to one...
TRANSCRIPT
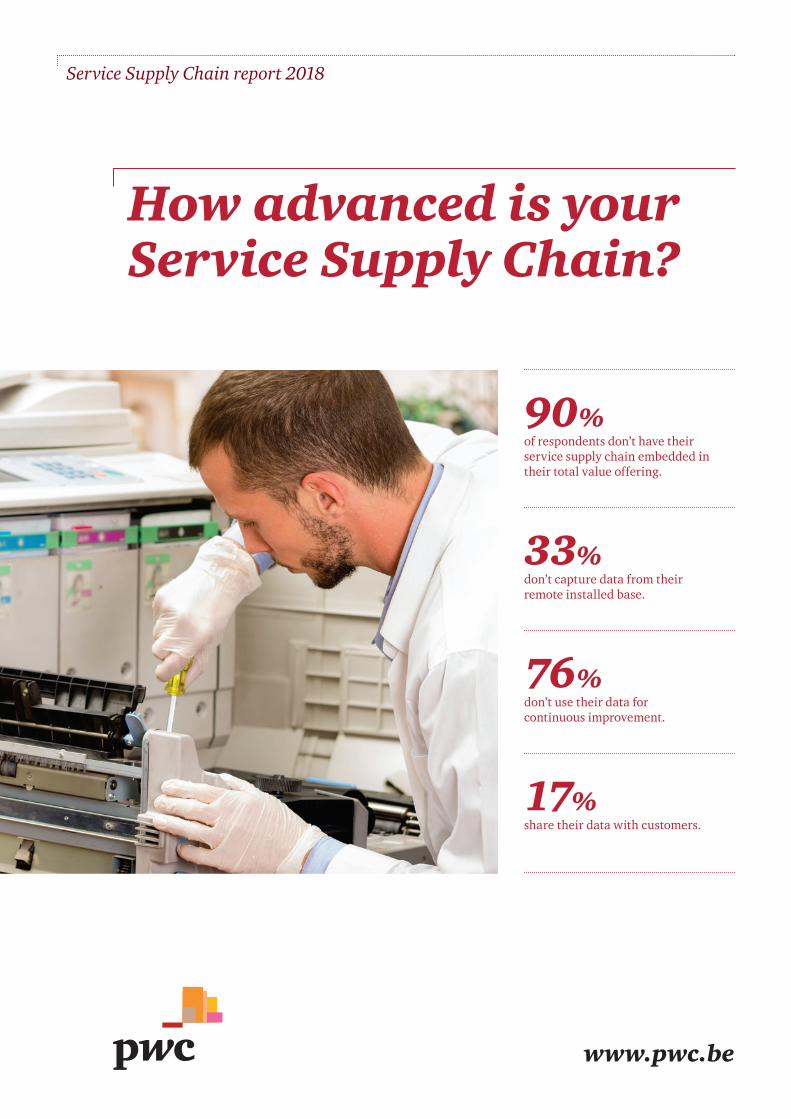
Service Supply Chain report 2018
90% of respondents don’t have their service supply chain embedded in their total value offering.
33% don’t capture data from their remote installed base.
76% don’t use their data for continuous improvement.
17% share their data with customers.
How advanced is your Service Supply Chain?
www.pwc.be

2
ContentIntroduction: A focus shift in the industry ..............................................................4
Executive summary ..............................................................................................6
Key elements of a service supply chain ...................................................................9
1. Service design and pricing ............................................................................. 10
2. Organisation .................................................................................................. 12
3. Field service management .............................................................................. 16
4. Spare parts supply chain ................................................................................ 18
5. Technology and software ...............................................................................20
The PwC Service Supply Chain Maturity Model ...................................................23
Your overall maturity ...........................................................................................25
Conclusion ..........................................................................................................28
Appendix .............................................................................................................29
3

4
Introduction A focus shift in the industry
Industrial companies are entering a new era: an era where prices and margins in traditional sales channels are under pressure, while costs of raw materials and technology are either stable or on the rise. For many organisations this has a major impact on their bottom line. Although the economy has experienced an uplift in recent years, it’s unclear how the trend will evolve. Industrial manufacturers are looking for new strategies to remain successful over the long term.
For many companies, an innovative service supply chain offering is key to maintaining their competitive edge. Innovation can be in the form of better integration of products within the service supply chain, which often gives rise to completely new business models. The growth of the ‘sharing economy’ also promotes the idea that ownership of an asset isn’t what brings value, but rather the output of that asset.
A business model that’s based on the value of the output rather than on the asset itself can therefore be very appealing.
When it comes to investment decisions by top management, there’s increased interest in the service element. While buyers were traditionally concerned about quality, functionality and price/investment, the focus is gradually shifting towards service of all types: after-sales service, advice and uptime. This is confirmed by the difference in performance between ‘service leaders’ and ‘service followers’. Service leaders see the service component of their offering as a real added value, which translates into better financial performance. Service followers still see the service component as an extension of their product offering.
4

5
Successful customer-centric companies manage to focus on three important elements:
Modularity Offering a broader set of service options to their customers. Deep market insights allow companies to conduct relevant segmentation and offer a service package that meets the needs of each segment. Closely related is the modularisation of products which allows for easier repairs (more ‘same walks’ in the repair centres, which improves the efficiency of operations) and higher customer satisfaction due to a higher first-time fix rate. Logistics costs improve as fewer parts are required, so the cost of field service decreases while effectiveness increases.
Output performance
Service leaders realise that service should be an integrated part of the offering from the very beginning of the product development and sales process. Often this results in a truly service-driven offering rather than a product-driven offering, where the focus is much more on the output than on the means to achieve that output. This concept may be new in your industry, but it’s already very common in other industries: consider copiers, where it’s common to pay per printed or copied page rather than for the machine itself.
Lifetime value
Customer-centric companies focus on end-to-end performance. It’s not the sale of the product as such that matters most, but the lifetime value of the equipment. The extension of the product lifetime is supported by preventive maintenance programmes to avoid downtime and machine breakdown. Thanks to new technologies, supported by the Internet of Things (IoT) and digitisation, new initiatives like condition-based maintenance and remote field service assistance will become the new drivers that’ll define customer satisfaction in the near future. The traditional key factor in creating customer satisfaction is a good first-time fix rate. As stated, new initiatives fostered by new technologies will define how a customer perceives not the product, but the value of a ‘solution’ offered by a brand. To achieve this, the field service force requires constant and frequent training. This is particularly relevant when field service activities have been outsourced to a partner company. Service leaders pay close attention to monitoring this performance element and take appropriate action when necessary.

6
Executive summary
The considerations expressed in the introduction were the triggers for PwC to launch a survey to assess the maturity of the industry in relation to service components in the aftermarket. The 74 survey respondents are responsible specifically for customer care, after sales or field service. They belong to the following function categories: C-level, directors and senior managers.
The service supply chain integrates sales, after-sales care and field service into a single, unified service offering for the client. The company no longer simply sells products, but also guarantees uptime, capacity or the continuous use of a product. The day-to-day monitoring required to ensure this service offering is handled by the company providing the service. To achieve the customer-focused organisation necessary for the service supply chain to be successful, an alignment of processes, organisation, technology and resources is required. It also involves the coordination and interconnection of channel partners like vendors, subcontractors, third-party technicians, service partners and customers.
Figure 1.Gross margin and maturity level (%)
Gross margin rises with a better maturity level
Basic Low Mid High Best
Maturity
0
10
20
30
40
50
60
15
20
28
35
50
Higher maturity leads to higher gross marginThe objective of the survey was to assess companies’ maturity regarding service supply chain and compare it to important KPIs like gross margin, turnover and first-time fix rate.
The survey targeted manufacturing companies that were interested in their service supply chain performance. We covered a wide range of industries, but 52% of respondents are active in either the automotive industry or industrial machinery. All respondents offer services in Europe, but most are also active in other parts of the world.
66

7
Each question in the survey has been converted into a maturity score and nearly all the scores are positively correlated. It appears that if a company is willing to invest in better service supply chain performance, it’s not limited to one specific characteristic of the service supply chain.
The results of the survey clearly indicate that the stronger and more advanced the setup and organisation of the service supply chain, the larger the gross margin of the company.
The chart below illustrates this correlation: if a field is green, the two corresponding scores are positively correlated.
Figure 2. Scores and correlation
1. Service operation design
2. Organisation structure
3. Functionalities in software system
4. Service parts classification
5. Service parts distribution
6. Service demand planning
7. Service pricing policy
8. Warranty management
9. Return/Repair management
10. Field service operations structure
11. Date capturing/monitoring
12. Customer feedback capturing
13. Profit

8
Key elements of a service supply chainThere are five key elements that define the service supply chain of an organisation, which we’ll describe in more detail in the next pages.
Service designand pricing
Organisation Field servicemanagement
Spare partssupply chain
Technology andsoftware
8

99

10
1. Service design and pricing
The survey shows that only 10% of respondents have their service supply chain embedded in their total value offering. By not seeing it as a value-creating aspect of the firm, a great deal of potential and benefits are lost or improperly exploited. Incorporating the service supply chain into the total value offering begins with a clear objective of what the company wants to achieve with its service offering. There’s no single solution that fits every company or customer, so a thorough analysis of the service potential must be completed first. A clear strategy and mission is crucial to becoming a successful customer-centric company, which in turn leads to improved brand image and customer retention.
with their resources. On the flipside, they remain cost sensitive and try to avoid major investments. They’re willing to invest in the services of the original equipment manufacturer (OEM) if these help develop their internal service organisation, for example in the form of training or specialised measuring instruments.
The most advanced service-oriented customer looks for offers and solutions that sustainably increase the performance of their assets in order to gain an advantage over competitors. They’re not price sensitive in their purchasing decisions, but they expect reliable quality. Total cost of ownership (TCO), output performance and uptime are crucial. They connect the brand of a machine manufacturer with performance and a value promise. For the most part, they prefer service contracts with the OEM which include a complete service package. Their internal service organisation is well-trained for emergencies and maintenance work. When purchasing services, they’ll try to learn from the OEM field engineer in order to provide comparable services in the future.
To fully tap the potential of a service offering, understanding the needs of your customer is key. For example, there’s no need to invest in a complete service offering if your customers only require basic services and are unwilling to invest more than the absolute minimum. These customers are unlikely to be interested in maintenance recommendations for the equipment and are likely to operate it until it quits. As your product is unlikely to be crucial to their operations, they perceive it as a commodity and in the case where spare parts or services are required, they’ll seek the most cost-effective solution. These customers therefore have little or no brand loyalty and prefer to buy from low-cost suppliers.
The average service-oriented customer recognises the benefit of maintenance recommendations and appreciates the services of the manufacturer. Their own maintenance organisation is extensive and they invest primarily in their knowledge structure. They attach great importance to the preservation and performance of equipment and look for solutions that link the manufacturer’s knowledge

11
The advanced customer is equipped with new machines and can share data with the OEM to help secure their competitive advantage through performance, quality and availability.
Companies often have customers of each type and adapting service offerings to specific customer segments will prove valuable and even necessary. Only a manufacturer that can provide a variety of services will exploit the full potential of their service supply chain.
Understanding what the customer wants will also prove beneficial for establishing the pricing strategy. When pricing spare parts, using a cost-plus approach for each product is likely to result in customers switching to other providers and therefore not benefitting from the full potential of the parts. Advanced providers apply a value-based approach, where the price reflects the value created for the customer. This pricing strategy is less transparent and less vulnerable to attack by competitors. Spare parts that are crucial for the process and don’t have many substitutes will have a higher value to the client than parts that can be ordered elsewhere.
Figure 3. Pricing principles and gross margin (%)
Gross margins rise with a better pricing strategy
Uniformpricing
Competitivepricing
Value basedpricing
25
32
40
0
10
20
30
40
50
The same goes for captive parts, where the manufacturer is the only one with specific knowledge or the intellectual rights. A high margin for these parts is recommended, paired with a lower margin for commonly-available parts. Not only part segmentation, but also customer segmentation, is recommended. Different service offerings can be linked to different types of customers. Large customers with a strong technical knowledge base in their company which can limit the breakdown risk of machines will go for the lighter service support. This way, they don’t need the full-service package where a risk premium is included. As a consequence, smaller companies with limited capabilities that can’t take the risk of a machine breaking down must opt for a more complete package that includes technical support from the service provider. The survey shows that gross margin increases when a tailored pricing approach is used.
12
2. Organisation
As product-centric structures and organisational silos aren’t sufficient for a competitive service offering, organisations will need to align, adapt and if necessary even transform to become completely customer-oriented. The integration of service supply chain functions and processes creates awareness throughout the organisation of the new customer-centric focus. Today, a strong global service organisation is recognised as an important attribute in negotiating partnerships with clients.
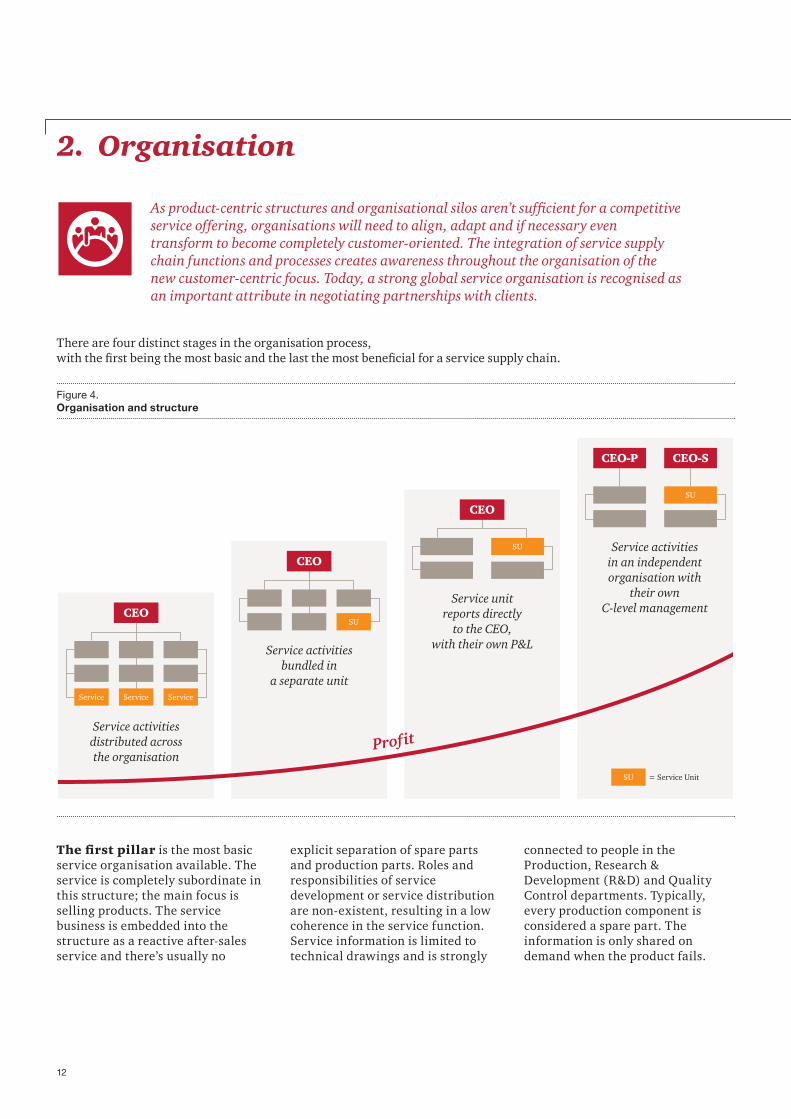
The first pillar is the most basic service organisation available. The service is completely subordinate in this structure; the main focus is selling products. The service business is embedded into the structure as a reactive after-sales service and there’s usually no
Figure 4. Organisation and structure
Service Service Service
CEOSU
CEO
CEO
SU
CEO-P CEO-S
SU
Service activities distributed across the organisation
Service activities bundled in
a separate unit
Service unit reports directly
to the CEO, with their own P&L
Service activities in an independent organisation with
their own C-level management
t iforP
SU = Service Unit
explicit separation of spare parts and production parts. Roles and responsibilities of service development or service distribution are non-existent, resulting in a low coherence in the service function. Service information is limited to technical drawings and is strongly
connected to people in the Production, Research & Development (R&D) and Quality Control departments. Typically, every production component is considered a spare part. The information is only shared on demand when the product fails.
There are four distinct stages in the organisation process, with the first being the most basic and the last the most beneficial for a service supply chain.

13
Once top management and service managers recognise the earnings potential and development opportunities of the service offering, they can bundle their service activities in a consolidated unit. This unit contains all existing service employees and the service portfolio. Companies have several options for integrating the service unit into the organisation. At this stage, most manufacturers consider service a part of marketing and sales.
As an independent service sales team usually doesn’t exist at this level, the responsibilities for customer contact fall on product sales. Smaller manufacturers can opt to place their service unit under product development. This ensures that the service team can integrate parameters like serviceability and ease of repair early in the product development process. It’s also easier to capture feedback from the field service team to increase the quality of the products.
If the service offering is to be seen as a sustainable pillar of the company, it requires a separate business area with its own profit and loss (P&L) responsibility and investment budget. Service development, service sales and service delivery are then completely separated from the product business, and the service organisation has its own support functions, like personnel and control. Like the previous structure, the unit is
responsible for the management of the service portfolio and the sale of services and spare parts. The new structure will place the services and spare parts offer under a strong brand, integrated with the offering of the product divisions. The service business becomes a marketable division with its own margin-
maximising pricing of services and spare parts. With a more complex structure and an increase of cross-departmental tasks, the planning and control of the service business increases. Service management assumes a major role with skilled and experienced service managers at the forefront.
14
The last pillar shows the most advanced service supply chain, where service is an independent and innovative business segment within the company. It has its own profit and loss, with a service CEO (CEO-S) who isn’t subordinate to the CEO of the product segment (CEO-P). The strategic orientation of the segment is as an outsourcing, development
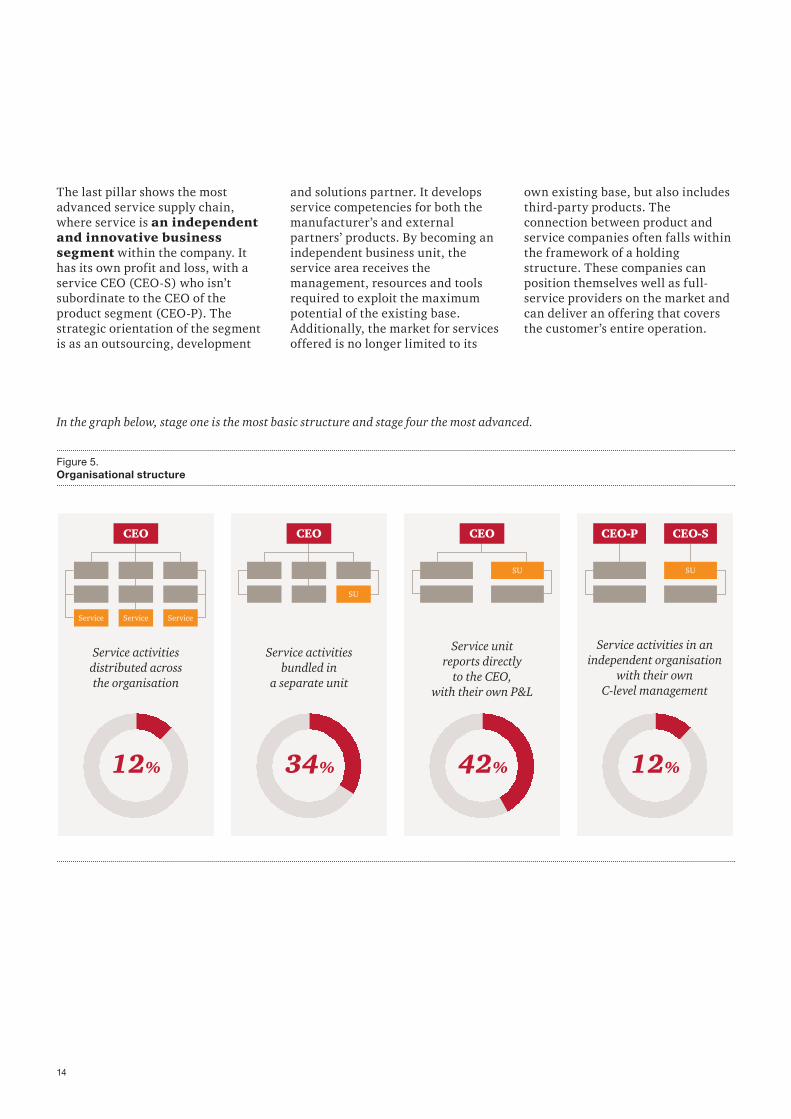
Figure 5. Organisational structure
Service Service Service
CEO
SU
CEO CEO
SU
CEO-P CEO-S
SU
Service activities distributed across the organisation
Service activities bundled in
a separate unit
Service unit reports directly
to the CEO, with their own P&L
Service activities in an independent organisation
with their own C-level management
12% 12%34% 42%
In the graph below, stage one is the most basic structure and stage four the most advanced.
and solutions partner. It develops service competencies for both the manufacturer’s and external partners’ products. By becoming an independent business unit, the service area receives the management, resources and tools required to exploit the maximum potential of the existing base. Additionally, the market for services offered is no longer limited to its
own existing base, but also includes third-party products. The connection between product and service companies often falls within the framework of a holding structure. These companies can position themselves well as full-service providers on the market and can deliver an offering that covers the customer’s entire operation.

15
According to the survey, only 12% of companies have the most advanced structure with an independent service organisation. Almost half the companies that responded don’t have profit and loss responsibilities for their service offering, revealing significant untapped potential.
1515

16
3. Field service management
Most businesses acknowledge that field service and spare parts sales are major contributors to revenue and profit, especially with a large installed base. While traditional field service management has become a commodity for companies providing services, it remains a valuable platform for understanding customer expectations, delivering the best service performance and maintaining long-lasting customer relationships.
A best-in-class service provider will appoint field engineers that act as key care managers. They’ll take care of maintenance contracts and repairs and become the spokespeople for the customers. Field engineers provide valuable insights about the customer’s perception of the service and brand, while performing maintenance on the equipment. Good field service management thus involves a service-driven team with experts in the field directly accountable to improving overall customer satisfaction. Front-line technicians will be a strategic asset for growing the service business, so it’s important to invest in education and training. Deployment of smart technologies and training with the support of virtual reality (VR) and augmented reality (AR) tools can attract and retain talented individuals.
Advanced technologies like scheduling algorithms and the Internet of Things (IoT) are evolving field service into an on-demand business, where the customer has immediate access to the service when they need it and pays according to usage. Remote connectivity and monitoring are important tools that’ll allow the field service management team to build client relationships that secure a competitive advantage. For a more in-depth explanation of how technology can assist field service and service supply in general, see the Technology and Software overview on page 20 of this report.
TicketingA team member of the customer assistance centre or call centre can immediately book the ticket and provide the client with an estimate of when an engineer will arrive to resolve the issue or perform maintenance. Ideally drawing from a knowledge base, the root cause will be identified and by verification of the availability of the required parts, the appropriate field engineer’s skills (for
Figure 6. Field Service Management
Field Service
Planning
CustomerSLAs
Ticketing
Spareparts
availability
Technicialqualifications & availability
Routing &networklayout
complex problems) and the preferred timeslot, a ticket is created. Typical standard maintenance and repair jobs are registered with a corresponding time interval to complete the job. Ticket creation will also trigger the required spare parts and consumables. For standard maintenance jobs, service or maintenance kits are available off the shelf, supporting efficiency and responsiveness.
Key areas for good field service management are identified in the figure below.

17
Spare parts availabilityDepending on business sector standards, spare parts need to be available as rolling stock in regional depots and central warehouses. This availability should be transparent throughout the company. If a required part doesn’t belong to the van stock of a field technician, the system should be able to search and reserve the correct part at the nearest stock location which guarantees the quickest delivery at the lowest cost. The warehouse management system (WMS) and remote devices used by field engineers must have the ability to reserve critical spare parts in relation to the different service contracts offered.
Customer Service Level Agreements (SLAs)A clear definition of different customer SLAs is mandatory, especially regarding response times and the first-time fix rate. The sets of SLAs and KPIs will differ in relation to the type of service contract the customer has chosen. In general, three types of service contracts are offered: Premium contracts typically guarantee not only uptime, but also output performance, where standard contracts might only cover service and repair guarantees within 48 or 72 hours. Different delivery types also apply in relation to different order types, such as emergency orders (e.g. vehicle off road, breakdown, machine down) versus normal orders or replenishment orders. Depending on the type of order, different SLAs are defined and the delivery cost is linked to the speed of delivery (e.g. night delivery, express, standard, etc.) Customers can usually decide what they consider to be an emergency order and will have to bear the costs, unless it’s embedded in their service contract conditions. With a minimum order value, regular orders are normally shipped with free delivery. The ticket system will (re-)prioritise maintenance or repair jobs by verifying the applicable service contract. The warehouse management system (WMS) will allocate the stock accordingly.
Technician qualifications and availabilityA competency matrix shows the abilities and skills of every technician, so quick decisions can be made about who to choose for which job. Tickets should clearly indicate the abilities required for a specific problem. Technicians in the field need connected devices for real-time access to their schedules, so they can be deployed when an emergency repair requires a specific technician who is scheduled for more generic jobs that day.
Routing and network layoutSoftware that can monitor and optimise the routing of field service technicians is a basic necessity for good field service management. On top of that, a continuous assessment of travel time and billable time can pinpoint difficulties and indicate routing optimisation potential, for example when a technician’s designated area is too large or job sites are too widespread.

18
4. Spare parts supply chain
In today’s economy, the biggest part of a service offering remains the supply of spare parts. Most companies still use a reactive approach driven by the requests of customers. With regards to delivery time and machine downtime, customers are more demanding than ever and fast service is necessary to stay competitive. A mature service provider can cover the entire product lifecycle with its service portfolio, all while upgrading the product and improving its performance.
Inventory management of spare parts is challenging: demand is often irregular and it’s nearly impossible to forecast parts with low demand. Inventory turnover in this type of environment is often less than one.
Figure 7. The use of forecasting tools (%)
More than 60% of respondents still use forecasts that are inaccurate for spare parts
24
37
35
4
No forecast
Forecast based on historic data
Forecast based on historic data and installed base
Forecast based on predictive models and machine learning
More than 60% of respondents use no forecast at all, or a forecast based on historical data. Only four percent have a service parts forecast with predictive modelling or machine learning.

19
In view of the particular challenges with spare parts demand, it’s important to ensure that as much information as possible is gathered:
• When do customers require preventive maintenance? Is it possible to convince them to share and transfer the required data to be fed into your service job scheduling and replenishment system?
• With your current installed base, do customers have the ability to extract this information from their equipment, or is an upgrade of the machine to sensor-based technologies required before data can be shared?
• If a part of the installed base is not adaptable to the new sensor technology, do you have insight into the failure rate of critical components based on historical data on hand?
The information may not be complete, but the quality of the data will improve over time. Nevertheless it’s imperative to analyse and utilise the information available. As spare parts inventory typically absorbs working capital, the effort required to optimise the information is justified. The worst case scenario is to be confronted with very high stock levels, many items blocking cash for which there is no demand and bad service levels.
A key question in spare parts logistics is the positioning of the order decoupling point and, related to that, the structure of the distribution network. An appropriate trade-off needs to be established between responsiveness (how fast the product can be delivered to the customer that needs it), inventory investment (taking into account that many parts have low to very low inventory turnover) and costs (both warehousing and transportation costs). Analytical and optimisation techniques can help find the ideal balance: the best selection of products to store locally, the extent of the use of horizontal flows in the network, when to use air freight versus sea freight, etc. These variables and decision parameters can be analysed to obtain a logistics network that provides the desired service level at the lowest cost.
An important technological breakthrough in the distribution of spare parts will be 3D printing or additive manufacturing. Spare and service parts (long tail/end-of-life phase) are potential candidates for this production technique. If demand for the part is low, the situation changes. The supplier may have a lead time of several weeks and will often impose minimum order quantities, resulting in years worth of stock. Managing extra inventory is expensive considering storage, handling, depreciation and ultimately scrapping costs. Print on demand, close to where the part is required will become an economically viable and common practice.

20
5. Technology and Software
In order to fully enable a solid, sustainable service supply chain, the necessary technology needs to be implemented to optimise the service offering by developing enhanced solutions and providing in-depth data analysis. The survey indicates that 33% of companies don’t capture data from their remote installed base, only 24% use the data for continuous improvement and just 17% share the data with customers.

21
There’s definitely room for improvement, as sharing data enhances cooperation between companies and their customers. Insight into equipment use, environment and the conditions in which the machine operates will form the base from which to adapt the equipment to specific circumstances. Achieving higher output performance can be the first step to introducing service as a core function within the company. At this stage, service will no longer be considered a necessary cost, but an enabler to drive performance and profit.
A number of new technologies form the base of an effective service supply chain. An assessment of what technologies contribute to different maturity levels is necessary. For example:
• IoT connects not only physical products via network connectivity to exchange data, but can also feed this information to every part of the company, creating and capturing a wealth of information. Product development receives data analyses on their installed base at the client site. Customer satisfaction can be continuously captured, with a feedback loop to R&D and quality management. Sensors continuously monitor machinery and transmit data, triggering preventive maintenance warnings when upper and lower limits are reached. This can prevent breakdowns and a part replacement can be scheduled before failure occurs.
• Augmented Reality (AR) can help field technicians with repairs. Manuals or holographic structures can provide information on the spot, especially where complexity is involved. Technicians can remotely ask for support and more experienced profiles will be able to visually guide them through problem assessment and repair.
• Virtual Reality (VR) is ideal for service training and test simulation purposes. It can be used for maintenance operations and remote collaboration. VR can create realistic simulations at a fraction of the cost of building physical scenarios, providing low-cost alternatives to extend field engineers’ experience.
• The shift to additive manufacturing can have a disruptive impact on your business. Like other digital technologies, it can generate opportunities for new business models and value creation. Planning for and implementing it sooner rather than later is highly recommended. Introduce new technology as part of a digital supply chain, learn through testing and prepare for rollout. (see also spare parts supply chain, page 18).
• Drones can survey large installations like roads, bridges, buildings, cell towers, wind turbines, pipelines and power lines. They’re a cost-efficient way to regularly inspect parts that are difficult to access, preventing breakdowns and emergencies.
Figure 8. Data capturing methods (%)
Only 17% of respondents share the captured data with their customer
No data captured
Data captured for continuous
monitoringData capturedbut notused
Data results
shared with clients
0
10
20
30
40
50
33
43
7
17

22
How can PwC support your service organisation?
22
23
The PwC Service Supply Chain (SSC) Maturity Model
Based on PwC’s SSC Maturity Model, we’re able to identify the current status (strengths and weaknesses) of your service organisation. The Service Supply Chain Maturity Model represents the service maturity of a company. We’ve identified five levels through which a business evolves from being product-oriented to being customer-centric.
Different maturity levels provide insights into how companies establish their service strategies. The five stages represent the milestones to be reached before a company can prepare and adapt its organisation, to advance to the next level.
A specific service supply chain questionnaire is used not only to identify the service profile of the company, but also to help understand its actual status and provide insights into areas of improvement or growth of business.
A company’s people and IT tools and systems must be assessed to gain better insights and understanding of the organisation and its business processes prior to assigning a maturity level. Each level describes the service approach, activities and solutions indicative of that maturity level.
As the correlation matrix on page 7 shows, almost every aspect of the service supply chain is positively correlated. This indicates that if a company is more advanced in one field, there’s a high chance it’ll be more mature in other fields as well. If a company chooses to advance from one stage to the next, it must cover all key elements of the service supply chain for a complete and integrated service offering.

24
Figure 9. PwC Service Supply Chain Maturity Model
InformalStructured
IntegratedHolistic
Cooperative
Service on customer request
Enhance OEM business
through Services
Establish services as a distinct line
of business
Maximise return from
service portfolio
Expand business model into
other segments
Stage 1Stage 2
Stage 3Stage 4
Stage 5
Maturity
Product centric
Service Follower Service Leader
Customer centric
Va
lue
The PwC SSC Maturity Model below outlines the steps from service follower to service leader.
Stage 1 is service from a purely reactive perspective. The customer asks for a service and as a product manufacturer you react to that request as you want to keep the customer satisfied, provided the request is within reason. Gradually a company can (and should) move to stage 2, where along with the physical product, you can offer a maintenance and service package that’s also supported by organised logistics. Service gradually becomes an element that’ll influence customers in their investment decision processes.
Once service becomes a more substantial part of the business, it’s time to move to stage 3, where the importance of the service component is emphasised by the creation of a proper P&L statement: service is no longer an add-on to product sales, but has separate business results. This will enable the collection of a significant amount of data on both the customer base and the installed base.
The information gathered can then be used for product improvement, which brings us to stage 4 of the maturity model: creating the structures that allow the sharing of the information gathered in the service organisation with the product organisation and vice versa. This knowledge will also serve as the basis that moves the service organisation towards helping customers in their preventive maintenance programmes. This integration with the customer can ultimately result in level 5 maturity, when product and service offerings are fully integrated, focusing on the output of the investment rather than on the investment itself.

25
The results of a maturity assessment of your company are depicted on a radar chart that rates your company on the five elements of service supply chain in comparison to the industry. This provides an overview of strengths and weaknesses in your service supply chain, so key points of
improvement can be identified. The radar chart below shows the results of the survey, covering all respondents. Worst in class is a combination of the lowest scores for every key element; best in class is a combination of the highest scores. Note that there are companies that
achieve an optimal service supply chain with respect to organisation or technology and software, but there’s room for improvement across the board in terms of service design, spare parts and field service management.
Figure 10. Service Supply Chain maturity assessment
Service Design
Organisation
Field Servicemanagement
Spare parts supply chain
Technology and software
Best in ClassAverageWorst in Class
Your overall maturity

2626

27
The key service supply chain elements from the previous chapter are applied to the different stages of the maturity model, as shown in the table below. This allows PwC to position a company on the matrix and work through the specific action points to advance to the next stage. This is only an example; the list of improvements and keystones is non-exhaustive.
Stage 1 Informal
Stage 2 Structured
Stage 3 Integrated
Stage 4 Holistic
Stage 5 Cooperative
Service design & Pricing
• Reactive service based on customer request
• Cost based pricing
• No pricing differentiation
• Service as a support for sales
• Offering is basic: installation and maintenance
• Service portfolio meets customer’s needs throughout the lifecycle
• Pricing based on Total Cost of Ownership
• Preventive maintenance
• Responsible for the uptime of installed base through service contracts
• Service is part of the total value offering
• Value based pricing
• Selling outcome instead of assets
Organisation
• Service processes informal and undefined
• Fragmented service organisation
• Service is often part of other business functions
• Service activities consolidated into one business unit with own P&L
• Service as a cross-enterprise process in which all divisions participate
• Service activities in an independent organisation with its own C-level management
Field Service Management
• Field service engineers non existent or untrained
• No structured follow up for warranty
• No program to capture customer feedback
• Field service is proactive
• Warranty is followed up based on customer claims
• Returns authorised by commercial team
• Field service engineers get regular training
• Full warranty tracking, without root-cause analysis
• Technical staff validates returns
• Field service strongly connected to back-office
• Warranty tracking with root-cause analysis
• Validated returns with a feedback loop to R&D
• Field service engineers get relevant information upfront
• Field service uses advanced digital technologies to support them in the field
Spare parts supply chain
• Service parts stored with production parts
• No forecast, replenishment based on experience
• One centralised but dedicated warehouse for spare parts
• Replenishment based on re-order point, min-max,…
• Dedicated service part inventory on different locations
• Forecast based on historic data
• Interdependencies between locations taken into account
• Forecast based on installed base and market information
• Virtual stock principles across the network
• Critical customers have dedicated spare parts inventory
• Forecast based on predictive models/machine learning
Technology & Software
• Limited service solutions
• Service is not consistently measured
• Simple standardised service solutions
• Service quality measured against target values
• Differentiated business processes support service strategies
• High attention to service quality data
• Clear differentiated solutions in the market
• Service quality feedback used in shaping future services
• Complex offerings developed with leading clients
• Service data shared with partners to drive performance
Figure 11. Key service supply chain attributes

28
Conclusion
Our Service Supply Chain Survey indicates a direct correlation between a mature service offering and company profits. The survey identifies five key dimensions that define a service offering and allow assessment of service supply chain maturity. The process to improve the service supply chain starts with designing a tailored service strategy as a basis for creating a service-focused organisation. Next steps include defining field service management and spare parts supply chain with the appropriate tools and technology.
The survey concludes that companies with the ambition to become a service leader will have to plan, adapt and prepare their organisation step by step. Gradually moving forward to subsequent stages while ensuring all key attributes per stage are present and well established is wholly advisable. From the integrated stage (stage 3) onwards, recognition and support from top management to foster initiatives and support necessary investments will be crucial in reaching objectives. To attain the highest maturity level (cooperative), not only ambition but also a deep understanding of customers’ expectations and the market in which they’re active are essential. To reach the cooperative stage means that the manufacturer becomes the customer’s partner in relation to the client’s production performance. Organisations that haven’t set clear goals or considered reviewing and adapting the five key dimensions listed above are extremely unlikely to reach the next level.
While the survey covered a wide range of companies with different maturity levels in service supply chain, it’s clear that there’s still a lot of improvement potential. Even the most mature companies in the survey can make significant improvements to further build on their competitive advantage. Disruptive innovations and an increased interest in a ‘sharing economy’ make it crucial for manufacturers to create an optimised and complete service supply chain sooner rather than later to remain competitive.
Improving the maturity of service capabilities delivers significant performance improvements.

29
Appendix
The additional charts provide further insight into the business sector, the centre of operations and the regions where the respondents operate.
Figure 12. What is your main industry? (%)
0 5 10 15 20 25 30
Industrial machinery 24
29Automotive
6Construction equipment
6Handling equipment
5Consumer electronics
5Electrical equipment
3Other transport equipment
3Agricultural & forestry machinery
2Food processing machinery
2High-tech & optical instruments
2Healthcare equipment
2Maintenance, Repair and Overhaul
13Other

30
Figure 13. Where is the centre of operations of your company? (%)
36
39
19
6
0
10
20
30
40
50
Benelux Rest ofEurope
NorthAmerica
Other

Figure 14. Where does your company offer services? (%)
81Africa
73Asia
63Oceania
100Europe
68North-America
67South-America
0 20 40 60 80 100

Contacts
At PwC, our purpose is to build trust in society and solve important problems. We’re a network of firms in 158 countries with more than 236,000 people who are committed to delivering quality in assurance, advisory and tax services. Find out more and tell us what matters to you by visiting us at www.pwc.com.
PwC refers to the PwC network and/or one or more of its member firms, each of which is a separate legal entity. Please see www.pwc.com/structure for further details.
© 2018 PwC. All rights reserved
Matthias ReyntjensPartner
+32 476 44 53 92 [email protected]
Koen CobbaertDirector
+32 479 98 61 76 [email protected]
Ruben CoetsierExternal consultant
+32 475 73 53 20 [email protected]