houston municipal employees pension system houston merf cafr.pdf · houston municipal employees...
TRANSCRIPT
COMPREHENSIVE ANNUAL FINANCIAL REPORT FOR THE YEAR ENDED JUNE 30, 2002
HOUSTON MUNICIPAL EMPLOYEES PENSION SYSTEM

HOUSTONMUNICIPALEMPLOYEES
PENSION SYSTEM
COMPREHENSIVE ANNUAL FINANCIAL REPORT
HOUSTON MUNICIPAL EMPLOYEES PENSION SYSTEMA COMPONENT UNIT OF THE CITY OF HOUSTON, TEXAS
FOR THE FISCAL YEAR ENDED JUNE 30, 2002
PREPARED BY THE PENSION ADMINISTRATION STAFFDAVID L. LONG, EXECUTIVE DIRECTOR
HOUSTON MUNICIPAL EMPLOYEES PENSION SYSTEM1111 BAGBY, SUITE 2450, HOUSTON, TEXAS 77002-2555
(713) 759-9275www.hmeps.org


Introductory SectionLetter of Transmittal . . . . . . . . . . . . . . . . . . . . . . . . . . . . . . . . . . . . . . . . . . . . . . . . . . . . . . . . . . . . . . . . . . . . . . .2GFOA Achievement Award . . . . . . . . . . . . . . . . . . . . . . . . . . . . . . . . . . . . . . . . . . . . . . . . . . . . . . . . . . . . . . . . . .6Professional Consultants and Investment Managers . . . . . . . . . . . . . . . . . . . . . . . . . . . . . . . . . . . . . . . . . . . . . . . .7
Financial SectionIntroduction to the Financial Statements . . . . . . . . . . . . . . . . . . . . . . . . . . . . . . . . . . . . . . . . . . . . . . . . . . . . . . .10Independent Auditors’ Report . . . . . . . . . . . . . . . . . . . . . . . . . . . . . . . . . . . . . . . . . . . . . . . . . . . . . . . . . . . . . . .11
Financial StatementsManagement’s Discussion and Analysis . . . . . . . . . . . . . . . . . . . . . . . . . . . . . . . . . . . . . . . . . . . . . . . . . . . . . . . .12Statements of Plan Net Assets June 30, 2002 and 2001 . . . . . . . . . . . . . . . . . . . . . . . . . . . . . . . . . . . . . . . . . . . .16Statements of Changes in Plan Net Assets Years Ended June 30, 2002 and 2001 . . . . . . . . . . . . . . . . . . . . . . . . . .17Notes to the Financial Statements June 30, 2002 and 2001 . . . . . . . . . . . . . . . . . . . . . . . . . . . . . . . . . . . . . . . . .18
Supplemental InformationSchedule of Funding Progress (Unaudited in Millions of Dollars) . . . . . . . . . . . . . . . . . . . . . . . . . . . . . . . . . . . . .24Schedule of Employer Contributions (Unaudited) . . . . . . . . . . . . . . . . . . . . . . . . . . . . . . . . . . . . . . . . . . . . . . . .25Notes to Required Supplemental Schedules (Unaudited) . . . . . . . . . . . . . . . . . . . . . . . . . . . . . . . . . . . . . . . . . . . .25Investment Summary ($000) Year Ended June 30, 2002 . . . . . . . . . . . . . . . . . . . . . . . . . . . . . . . . . . . . . . . . . . . .26Investment Services, Professional Services, and Administration
Expenses Years Ended June 30, 2002 and 2001 . . . . . . . . . . . . . . . . . . . . . . . . . . . . . . . . . . . . . . . . . . . . . . . .26Summary of Costs of Investment and Professional Services
Years Ended June 30, 2002 and 2001 . . . . . . . . . . . . . . . . . . . . . . . . . . . . . . . . . . . . . . . . . . . . . . . . . . . . . . .27
Investment SectionDiscussion of Investment Policies and Activities . . . . . . . . . . . . . . . . . . . . . . . . . . . . . . . . . . . . . . . . . . . . . . . . . .30Schedule of Top Investments ($000) as of June 30, 2002 . . . . . . . . . . . . . . . . . . . . . . . . . . . . . . . . . . . . . . . . . . .32Comparison of Investment Returns - Years Ended June 30 . . . . . . . . . . . . . . . . . . . . . . . . . . . . . . . . . . . . . . . . . .32 Performance by Fiscal Year Last Ten Years . . . . . . . . . . . . . . . . . . . . . . . . . . . . . . . . . . . . . . . . . . . . . . . . . . . . . .33Summary of Investments by Type as of June 30, 2002 . . . . . . . . . . . . . . . . . . . . . . . . . . . . . . . . . . . . . . . . . . . . .33Schedule of Fees and Commissions . . . . . . . . . . . . . . . . . . . . . . . . . . . . . . . . . . . . . . . . . . . . . . . . . . . . . . . . . . .34
Actuarial SectionActuary’s Letter to the Board of Trustees . . . . . . . . . . . . . . . . . . . . . . . . . . . . . . . . . . . . . . . . . . . . . . . . . . . . . . .38Actuarial Certification . . . . . . . . . . . . . . . . . . . . . . . . . . . . . . . . . . . . . . . . . . . . . . . . . . . . . . . . . . . . . . . . . . . . .38Summary of Key Results ($000) . . . . . . . . . . . . . . . . . . . . . . . . . . . . . . . . . . . . . . . . . . . . . . . . . . . . . . . . . . . . .39Summary of Assets as of July 1, 2000 ($000) . . . . . . . . . . . . . . . . . . . . . . . . . . . . . . . . . . . . . . . . . . . . . . . . . . .39Asset Information . . . . . . . . . . . . . . . . . . . . . . . . . . . . . . . . . . . . . . . . . . . . . . . . . . . . . . . . . . . . . . . . . . . . . . . .40Funding Information . . . . . . . . . . . . . . . . . . . . . . . . . . . . . . . . . . . . . . . . . . . . . . . . . . . . . . . . . . . . . . . . . . . . .41Contribution Information . . . . . . . . . . . . . . . . . . . . . . . . . . . . . . . . . . . . . . . . . . . . . . . . . . . . . . . . . . . . . . . . . .42Cash Flow Projection . . . . . . . . . . . . . . . . . . . . . . . . . . . . . . . . . . . . . . . . . . . . . . . . . . . . . . . . . . . . . . . . . . . . .44Participant Information . . . . . . . . . . . . . . . . . . . . . . . . . . . . . . . . . . . . . . . . . . . . . . . . . . . . . . . . . . . . . . . . . . .46Summary of Actuarial Methods and Assumptions . . . . . . . . . . . . . . . . . . . . . . . . . . . . . . . . . . . . . . . . . . . . . . . .47Changes in Methods and Assumptions Since the Prior Valuation . . . . . . . . . . . . . . . . . . . . . . . . . . . . . . . . . . . . .49Changes in Plan Provisions Since the Prior Valuation . . . . . . . . . . . . . . . . . . . . . . . . . . . . . . . . . . . . . . . . . . . . . .49
Statistical SectionSchedule of Average Benefit Payments for the Six Years Ended June 30, 2000 . . . . . . . . . . . . . . . . . . . . . . . . . . . .52Schedule of Benefits by Type ($000) for the Six Years Ended June 30, 2000 . . . . . . . . . . . . . . . . . . . . . . . . . . . . .52Schedule of Annuitants by Type . . . . . . . . . . . . . . . . . . . . . . . . . . . . . . . . . . . . . . . . . . . . . . . . . . . . . . . . . . . . .52Historical Active Participant Data . . . . . . . . . . . . . . . . . . . . . . . . . . . . . . . . . . . . . . . . . . . . . . . . . . . . . . . . . . . .53Schedule of Revenues by Source ($000) for the Six Years Ended June 30, 2002 . . . . . . . . . . . . . . . . . . . . . . . . . . .53Schedule of Expenses by Type ($000) for the Six Years Ended June 30, 2002 . . . . . . . . . . . . . . . . . . . . . . . . . . . .53
TABLE OF CONTENTS
Fred HolmesChairman
Ray KennedyVice Chairman
Barbara CheletteSecretary
Roderick J. NewmanElected Trustee
Albertino MaysTreasurer
Sherry MoseElected Trustee
Lee PipesElected Trustee
Lonnie G. VaraMayor�s Representative
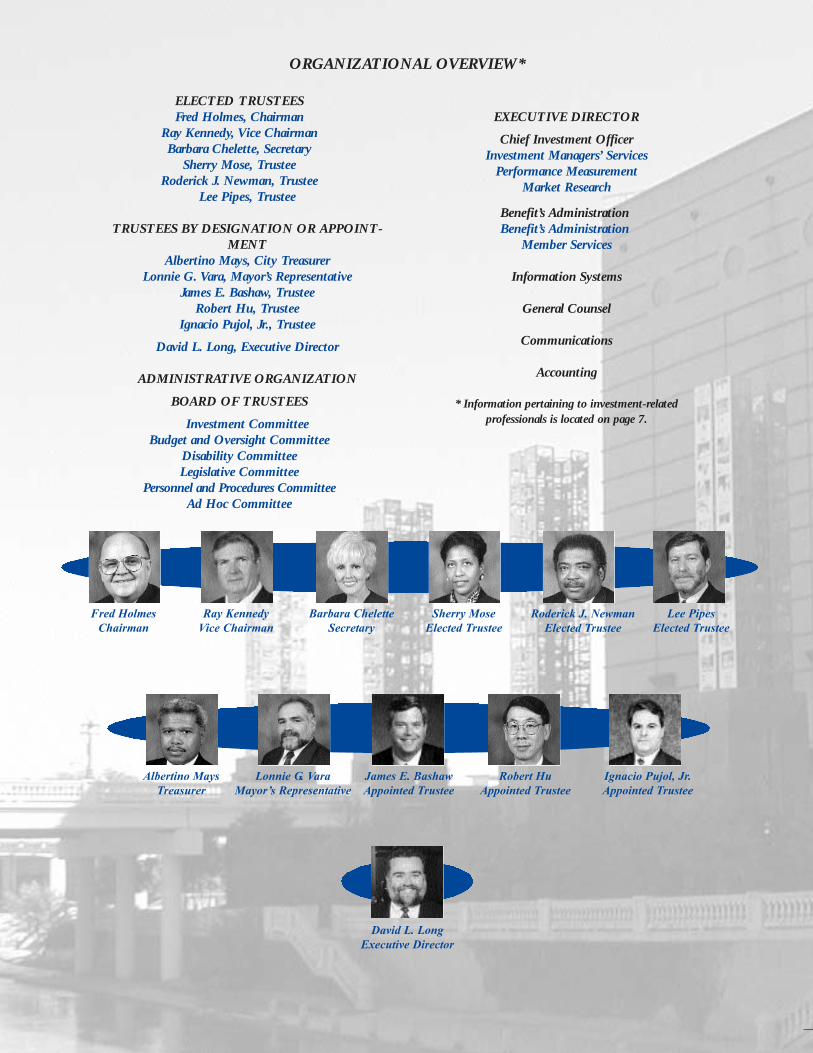
ELECTED TRUSTEESFred Holmes, Chairman
Ray Kennedy, Vice ChairmanBarbara Chelette, Secretary
Sherry Mose, TrusteeRoderick J. Newman, Trustee
Lee Pipes, Trustee
TRUSTEES BY DESIGNATION OR APPOINT-MENT
Albertino Mays, City TreasurerLonnie G. Vara, Mayor’s Representative
James E. Bashaw, TrusteeRobert Hu, Trustee
Ignacio Pujol, Jr., Trustee
David L. Long, Executive Director
ADMINISTRATIVE ORGANIZATION
BOARD OF TRUSTEES
Investment CommitteeBudget and Oversight Committee
Disability CommitteeLegislative Committee
Personnel and Procedures CommitteeAd Hoc Committee
EXECUTIVE DIRECTOR
Chief Investment OfficerInvestment Managers’ Services
Performance MeasurementMarket Research
Benefit’s AdministrationBenefit’s Administration
Member Services
Information Systems
General Counsel
Communications
Accounting
* Information pertaining to investment-related professionals is located on page 7.
Ignacio Pujol, Jr.Appointed Trustee
James E. BashawAppointed Trustee
Robert HuAppointed Trustee
David L. LongExecutive Director
ORGANIZATIONAL OVERVIEW*

INTRODUCTORY SECTION
• LETTER OF TRANSMITTAL
• GFOA CERTIFICATE OF ACHIEVEMENT
• PROFESSIONAL CONSULTANTS AND INVESTMENT MANAGERS

December 1, 2002
Mr. Albertino G. Mays, TreasurerCity of Houston, TexasP.O. Box 1562Houston, Texas 77251-1562
Dear Mr. Mays:
The Comprehensive Annual Financial Report (CAFR) of the Houston Municipal Employees PensionSystem (the System), a Component Unit of the City of Houston, Texas (the City) for the fiscal yearended June 30, 2002 (2002), is submitted herewith. The accuracy and completeness of this report arethe responsibility of the Board of Trustees of the System. The information provided pertains to therecords and accounts of the System and its operation.
The CAFR consists of five sections: (i) the introductory section, which contains this transmittal let-ter and other general information about the structure and activities of the System; (ii) the financial sec-tion, which contains the independent auditors' report and the basic financial statements, includingnotes to the financial statements and supplemental schedules; (iii) the investment section, whichincludes reports on the investment objectives and activities of the System during 2002; (iv) the actu-arial section, which contains information about the actuarial evaluation of the System as of July 1,2000, the funding objectives of the System and the progress being made toward achieving those objec-tives; and (v) the statistical section, which contains statistical and other significant data intended toprovide a user of this CAFR additional information about the System.
The System was created in 1943 under Chapter 358, Acts of the 48th Texas Legislature, RegularSession, Article 6243g, Vernon's Annotated Revised Texas Civil Statutes, and reenacted and contin-ued under HB1573, 77th Texas Legislature, as Art. 6243h, Vernon�s Annotated Revised Texas CivilStatutes (the Statute). The System is a multi-employer defined benefit pension plan and includes con-tributory groups (Group A and Group C) and a noncontributory group (Group B). The System pro-vides service retirement, disability retirement and death benefits for eligible participants including theemployees of the System and the officers and employees, except police officers and fire fighters, ofmunicipalities in the State of Texas having population of more than 1,500,000. System plan net assetsare used to pay benefits for eligible participants of Group A, Group B and Group C. The System isgoverned by a Board of Trustees (Board) including 11 Trustees of whom four (4) are active partici-pants elected by active participants, two (2) are retired participants elected by retirees, three (3) areappointed by the City's governing body, and two (2) are statutorily designated because of the Cityoffices they hold.
Significant Changes During the YearThere were no significant changes in the System or its operation that affected the year included in thisCAFR. However, the governing statute enacted during the 2001 Texas legislative session and effec-tive May 11, 2001, substantially amended the provisions of the plan for the period covered by thisreport. Those amendments are more fully explained in the �Other Significant Information� section onpage 4.
General Economic Conditions The U.S. economy has confronted very significant challenges over the past year including majordeclines in global equity markets, a sharp retrenchment in investment spending, and the effects of thetragic terrorist attacks of September 11th. Budget surpluses have turned to deficits and the geopo-litical climate remains cautious as Japan and Germany, the world�s second and third largesteconomies, struggle with their own domestic economic contractions. The world continues to be chal-lenged with a perfect storm facing the first synchronized global downturn of significant proportionin many decades.2
LETTER OF TRANSMITTAL

Underpinning the U.S. economy, the American consumerhas provided strong support as household spending hasheld up quite well and served as an important stabilizingforce for the overall economy. Interest rates havedeclined to 40 year lows thereby stimulating home pur-chases and mortgage re-financings. A surge in housingactivity coupled with strong auto sales and moderateretail purchases has offset the substantial contraction inbusiness spending and manufacturing activity.
Monetary policy has played an important role in cush-ioning the downturn as short term interest rates havebeen lowered twelve times since the economic contrac-tion commenced in the face of tame inflationary forces.Nevertheless, credit spreads for companies with less thanpristine balance sheets remain at historically high levelsand access to borrowing for many companies remainsdifficult.
Corporate profits have declined dramatically during thelast few years as the overall level of economic activityhas slackened from the previous robust pace. Investorconcern has been heightened by an unprecedented levelof misleading corporate accounting practices at manyprominent businesses resulting in the demise of severalwell known companies.
The equity markets fell sharply in the third quarter asearnings downgrades continued and investors focused onfading global economic prospects and mounting militarytensions. Valuations have fallen significantly from priorhistoric highs but still remain pricey based upon historicprecedents. Nevertheless, the equity markets are nowbetter positioned to gradually improve over time asinvestor confidence is restored and earnings visibilityimproves.
As expected, the economy has begun a slow road torecovery and the pace of economic activity is projectedto continue its gradual pace of recovery into2003-2004.
Investment ActivitiesAs discussed in more detail in theInvestment Section of this CAFR,investments strategies have beenimplemented by the System that arelong-term in perspective and designedto meet the expectation of workingwithin predefined ranges among assetclasses to produce returns, over marketcycles, that exceed the investment return
assumption adopted by the System for actuarial purposes.Diversification, professional management within statedguidelines, and periodic rebalancing from asset classes tocapture gains and to reduce risks associated with marketmovements, are methods that have been adopted by thePension Board to safeguard against loss due to unantici-pated market declines. Returns from investing activitiesfor the year ended June 30, 2002 amounted to -7.07%(see page 32 for more information). Time weightedreturns for the 5 fiscal years and 10 fiscal years endedJune 30, 2002 were 4.35% and 8.83%, respectively.
Financial HighlightsAdditions to assets received by the System are used tofund current and future benefits for participants and theircovered survivors. The primary sources of additions arecontributions from active participants and the City, andinvestment income. Net investment income after deduct-ing investment fees and costs of lending securities for theyears 2002 and 2001 was $(108) million and $(65.1) mil-lion, respectively. City contributions, employee contri-butions, and other income for 2002 totaled $54.5 millioncompared to $50.5 million for 2001. The City contribu-tion rate, 10% during 2002, is determined by requiredactuarial evaluation subject to a minimum rate of 10%.City contributions decreased by $.5 million during 2002over 2001. Participant contributions increased by $4.9million during 2002 over 2001. The chart, Additions byType, is a relative representation of 2002 additions bycomponents.Deductions from assets consist of benefits paid to retiredmembers and their eligible survivors, refunds of contri-butions to former members, fees for professional servic-es, and the cost of administering the programs of theSystem. Total deductions for 2002 were $21.4 million
3
Employee Contributions $13,475,642
Additions By Type
Investment Income $(108,023,585)
Other Income $286,05975%
0%24%
1% City Contributions $40,757,900
LETTER OF TRANSMITTAL

more than for 2001. Benefits and contribution refundswere $20 million more, professional services were notsignificantly different for 2002 over 2001, and adminis-trative costs were $1.3 million more. The chart,Deductions by Type, demonstrates the relationshipamong types of deductions.The net of additions over deductions for 2002, reportedin the financial statements as the net decrease in plan netassets, was $(136.1) million. That decrease in plan netassets represents the results of System operations for fis-cal year 2002 and represents a decrease of plan net assetsheld in trust for pension benefits.
Accounting System and Internal ControlsThe financial statements and related information includ-ed in the financial section of this report are the responsi-bility of the management of the System. The financialstatements have been prepared in accordance with gener-ally accepted accounting principles and presented inaccordance with the Governmental AccountingStandards Board (GASB). The System adopted GASBStatement No. 34, as amended, during the current fiscalyear. As a result of the adoption of GASB Statement No.34, the Management's Discussion and Analysis has beenincluded as required supplementary information and pre-cedes the financial statements. In accordance with GASBStatement No. 34, the 2001 financial statements havebeen restated to reflect the capitalization and depreciationof expenditures for furniture, fixtures and equipment.
The System�s independent auditors have audited thefinancial statements. The purpose of the audit is to givereasonable assurance to users of those financial state-ments, the Board, and participants of the System, that thefinancial statements present fairly, in all materialrespects, information regarding the System's net assetsheld in trust for pension benefits and in conformity withaccounting principles generally accepted in the UnitedStates of America.
A significant responsibility of the Board is toensure that the System has in place a proper sys-tem of internal controls. A system of internalcontrols is an entity's plan of organization and allof its coordinated methods and measures adoptedto safeguard its assets, ensure the accuracy andreliability of the accounting system and promoteadherence to management policies. These controlsinclude strategic design of the entity's business sys-tems, the appropriate segregation of duties and responsi-bilities, sound practices in the performance of those
duties, capable personnel, and the organizational structureitself. We believe the System's internal controls are ade-quate and are working as designed.
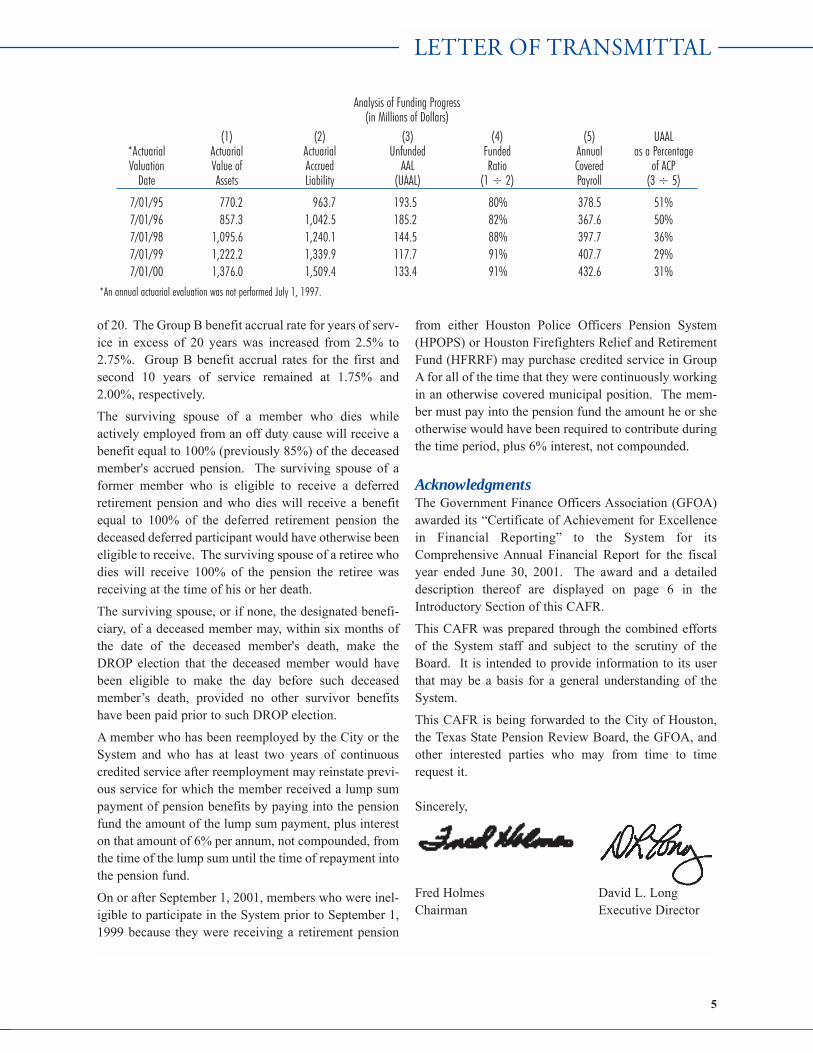
Funding StatusExpressing the actuarial value of assets (AVA) as a per-centage of the actuarial accrued liability (AAL) providesone indication of the System's funding status on a going-concern basis. Analysis of that percentage over timeindicates whether the System is becoming financiallystronger or weaker. Generally, the greater that percent-age, the stronger the plan. The net of AAL minus AVA isthe unfunded actuarial accrued liability (UAAL). SinceUAAL and annual covered payroll (ACP) are bothaffected by inflation, expressing the UAAL as a percent-age of ACP approximately adjusts for the effects of infla-tion and aids analysis of the System's progress towardaccumulating sufficient assets to pay benefits when due.Generally, the smaller this percentage, the stronger thesystem. The analysis (following page) indicates theSystem's funding progress according to the most recentfive actuarial valuations.
Other Significant InformationThere were significant changes in the provisions of theplan resulting from the enactment of the governingStatute during the 2001 session of the Texas Legislature.Those amendments became effective May 11, 2001,prior to the period covered by this CAFR. Primaryamong those are the following provisions:
Group A benefit accrual rates for eligible active memberswere increased to 3.25% for the first 10 years of service,3.5% for service in excess of 10 years but less than 20,and 4.25% for service during years of service in excess
4
Refunds $269,692
Deductions By Type
Professional Services $395,541
94%
4%
1%
Benefits $78,317,974
Administrative Costs $3,662,432
1%
LETTER OF TRANSMITTAL
of 20. The Group B benefit accrual rate for years of serv-ice in excess of 20 years was increased from 2.5% to2.75%. Group B benefit accrual rates for the first andsecond 10 years of service remained at 1.75% and2.00%, respectively.
The surviving spouse of a member who dies whileactively employed from an off duty cause will receive abenefit equal to 100% (previously 85%) of the deceasedmember's accrued pension. The surviving spouse of aformer member who is eligible to receive a deferredretirement pension and who dies will receive a benefitequal to 100% of the deferred retirement pension thedeceased deferred participant would have otherwise beeneligible to receive. The surviving spouse of a retiree whodies will receive 100% of the pension the retiree wasreceiving at the time of his or her death.
The surviving spouse, or if none, the designated benefi-ciary, of a deceased member may, within six months ofthe date of the deceased member's death, make theDROP election that the deceased member would havebeen eligible to make the day before such deceasedmember�s death, provided no other survivor benefitshave been paid prior to such DROP election.
A member who has been reemployed by the City or theSystem and who has at least two years of continuouscredited service after reemployment may reinstate previ-ous service for which the member received a lump sumpayment of pension benefits by paying into the pensionfund the amount of the lump sum payment, plus intereston that amount of 6% per annum, not compounded, fromthe time of the lump sum until the time of repayment intothe pension fund.
On or after September 1, 2001, members who were inel-igible to participate in the System prior to September 1,1999 because they were receiving a retirement pension
from either Houston Police Officers Pension System(HPOPS) or Houston Firefighters Relief and RetirementFund (HFRRF) may purchase credited service in GroupA for all of the time that they were continuously workingin an otherwise covered municipal position. The mem-ber must pay into the pension fund the amount he or sheotherwise would have been required to contribute duringthe time period, plus 6% interest, not compounded.
AcknowledgmentsThe Government Finance Officers Association (GFOA)awarded its �Certificate of Achievement for Excellencein Financial Reporting� to the System for itsComprehensive Annual Financial Report for the fiscalyear ended June 30, 2001. The award and a detaileddescription thereof are displayed on page 6 in theIntroductory Section of this CAFR.
This CAFR was prepared through the combined effortsof the System staff and subject to the scrutiny of theBoard. It is intended to provide information to its userthat may be a basis for a general understanding of theSystem.
This CAFR is being forwarded to the City of Houston,the Texas State Pension Review Board, the GFOA, andother interested parties who may from time to timerequest it.
Sincerely,
Fred Holmes David L. LongChairman Executive Director
Analysis of Funding Progress(in Millions of Dollars)
(1) (2) (3) (4) (5) UAAL*Actuarial Actuarial Actuarial Unfunded Funded Annual as a PercentageValuation Value of Accrued AAL Ratio Covered of ACP
Date Assets Liability (UAAL) (1 ÷ 2) Payroll (3 ÷ 5)
7/01/95 770.2 963.7 193.5 80% 378.5 51%7/01/96 857.3 1,042.5 185.2 82% 367.6 50%7/01/98 1,095.6 1,240.1 144.5 88% 397.7 36%7/01/99 1,222.2 1,339.9 117.7 91% 407.7 29%7/01/00 1,376.0 1,509.4 133.4 91% 432.6 31%
*An annual actuarial evaluation was not performed July 1, 1997.
5
LETTER OF TRANSMITTAL

The Government Finance Officers Association of theUnited States and Canada (GFOA) awarded a�Certificate of Achievement for Excellence in FinancialReporting� to Houston Municipal Employees PensionSystem for its comprehensive annual financial report forthe fiscal year ended June 30, 2001. The Certificate ofAchievement is a prestigious national award recognizingconformance with the highest standards for preparationof state and local government financial reports.
In order to be awarded a Certificate of Achievement, agovernment unit must publish an easily readable andefficiently organized comprehensive annual financialreport, the contents of which conform to program stan-dards. Such CAFR must satisfy both generally acceptedaccounting principles and applicable legal requirements.
A Certificate of Achievement is valid for a period of oneyear only. Houston Municipal Employees PensionSystem has received a Certificate of Achievement for thelast 8 consecutive years (fiscal years ended June 30,1994 through 2001). We believe our current report con-tinues to conform to the Certificate of Achievement pro-gram requirements, and we are submitting it to theGFOA for consideration.
6
GFOA CERTIFICATE OF ACHIEVEMENT

Consultants
AuditorMir, Fox & Rodriguez, P.C.Certified Public Accountants
Board Medical AdvisorCharles Schuhmacher, M.D.
Investment ConsultantsWilshire Associates, Inc.Pension Consulting Alliance
Investment Performance AnalysisWilshire Associates, Inc.
Legal CounselBaker Botts, L.L.P.Lawson, Fields, McCue, Lee & Campbell, P.C.Locke, Liddell and Sapp, L.L.P.
Master Custodian/TrusteeState Street Bank and Trust Co.
ActuaryTowers Perrin
Investment Managers
Domestic EquitiesBarclays Global Investors, N.A.Brown Capital ManagementDePrince, Race & Zollo, Inc.Legg Mason Capital ManagementNeumeier Investment CounselPacific Investment Management Co.Putnam Investments
Fixed IncomeBarclays Global Investors, N.A.Loomis, Sayles & Co.MDL CapitalSmith Graham & Co.Taplin, Canida & HabachtWestern Asset Management
International EquitiesAxiom InternationalBrandes InternationalOechsle InternationalTT International
Real AssetsAlliance Bernstein Institutional Investment
ManagementBarclays Global Investors, N.A.Brinson Partners, Inc.CB Richard Ellis InvestorsCrow HoldingsGoldman, Sachs & Co.Heitman Capital ManagementL&B Realty Advisors, Inc.Lone Star U.S. Acquisitions, L.L.C.Morgan Stanley Asset Management, Inc.Olympus Real Estate Corp.PM Realty AdvisorsPrudential InvestmentsSoros Private Funds Management, L.L.C.State Street Research & Management Co.
Alternative InvestmentsAdams Street PartnersBarclays Global Investors, N.A.Brera Capital Partners, L.L.C.Brockway Moran & Partners, Inc.Goldman, Sachs & Co.HarbourVest Partners, L.L.C.J.W. Childs Associates, L.P.Kopp Investment AdvisorsOaktree Capital ManagementPacven Walden Management Co., LTD.Pegasus Investors, L.P.Pharos Capital Partners, L.L.C.Triad Ventures, LTD.TSG Capital Group, L.L.C.
7
PROFESSIONAL CONSULTANTS ANDINVESTMENT MANAGERS


FINANCIAL SECTION
• INTRODUCTION TO FINANCIAL STATEMENTS• INDEPENDENT AUDITORS’ REPORT
• STATEMENTS OF PLAN NET ASSETS JUNE 30, 2002 AND 2001• STATEMENTS OF CHANGES IN PLAN NET ASSETS
YEARS ENDED JUNE 30, 2002 AND 2001• NOTES TO FINANCIAL STATEMENTS JUNE 30, 2002 AND 2001
• SUPPLEMENTAL INFORMATION
The Audited Financial Statements and the accompanyingIndependent Auditors� Report included in this CAFRwere approved by the Board of Trustees (the Board) in itsmeeting of September 27, 2002.
The audit of the System's financial statements was con-ducted in accordance with generally accepted auditingstandards (GAAS). The Independent Auditors' Report isbased on that audit, and it is intended to give reasonableassurance to users of the System's financial statementsthat those financial statements are free of material mis-statement when taken as a whole and that they presentfairly the financial position and results of operations ofthe System at the times and for the periods reported. Theaudit gives reasonable assurance to the Board and mem-bers of the System that the System's assets are adequate-ly safeguarded and that its financial transactions areproperly authorized and recorded.
The financial statements provide a comprehensiveoverview of the financial position of the System as ofJune 30, 2002 and June 30, 2001 and the results of itsoperation for the years then ended. The financial state-ments are presented in conformity with accounting andreporting standards of the Government AccountingStandards Board (GASB).
The System is responsible for the accuracy of its financialstatements and the completeness and fairness of their pres-entation. The auditors are responsible for issuing an opin-ion on those financial statements when taken as a whole.
The financial statements consist of Statements of PlanNet Assets, Statements of Changes in Plan Net Assets
Held in Trust for Pension Benefits, Notes to the FinancialStatements, and Supplemental Schedules.
The Statements of Plan Net Assets present the financialposition of the System as of the end of the fiscal yearsreported. They are statements of the System's assets, lia-bilities, and net assets held in trust for pension benefits.
The Statements of Changes in Plan Net Assets Held inTrust for Pension Benefits include additions to theSystem's assets and deductions from them and theincrease in plan net assets. Additions consist of contri-butions, investment income, and other income.Deductions are benefit payments, fees for professionalservices and costs of administering the programs of theSystem. The net of additions and deductions representsthe change, for the years presented, in net assets held intrust for pension benefits.
Notes to the financial statements contain disclosuresrequired by generally accepted accounting principles andGASB reporting standards. Required disclosures includea summary description of the pension plan, significantaccounting policies, information about the System'sfunding status and progress toward achieving its fundingobjectives, information about the System's investmentsand investing activities, and information about theSystem's commitments.
Supplemental Schedules provide information requiredby GASB and additional detailed analyses of certainamounts summarized in the financial statements.
10
INTRODUCTION TO FINANCIAL STATEMENTS
Board of TrusteesHouston Municipal Employees Pension SystemCity of Houston, Texas:
We have audited the accompanying statements of plan net assets of the Houston Municipal EmployeesPension System (the System) as of June 30, 2002 and 2001, and the related statements of changes in plannet assets for the years then ended. These financial statements are the responsibility of the System's man-agement. Our responsibility is to express an opinion on these financial statements based on our audits.
We conducted our audits in accordance with auditing standards generally accepted in the United States ofAmerica. Those standards require that we plan and perform the audit to obtain reasonable assuranceabout whether the financial statements are free of material misstatement. An audit includes examining,on a test basis, evidence supporting the amounts and disclosures in the financial statements. An audit alsoincludes assessing the accounting principles used and significant estimates made by management, as wellas evaluating the overall financial statement presentation. We believe that our audits provide a reason-able basis for our opinion.
In our opinion, the financial statements referred to above present fairly, in all material respects, informa-tion regarding the System's net assets held in trust for pension benefits as of June 30, 2002 and 2001, andchanges therein for the years then ended, in conformity with accounting principles generally accepted inthe United States of America.
Management's Discussion and Analysis (MD&A), the Required Supplemental Information and theSupplemental Information listed in the Table of Contents are not a required part of the basic financialstatements but is supplementary information either required by the Governmental Accounting StandardsBoard or presented for the purpose of additional analysis. This information is the responsibility of theSystem's management. We have applied certain limited procedures, which consisted principally ofinquiries of management regarding the methods of measurement and presentation of the supplementaryinformation. However, we did not audit such information and do not express an opinion it.
September 17, 2002
Mir � FoxRodriguez, P.C.
Certified Public Accountants
&
11
INDEPENDENT AUDITORS� REPORT

The Board of Trustees (the Board) of the HoustonMunicipal Employees Pension System (System) ispleased to provide this overview and analysis of thefinancial performance and activities of the System for thefiscal year ended June 30, 2002. We encourage the read-ers to consider the information presented here in con-junction with the basic financial statements.
OVERVIEW OF THE FINANCIAL STATEMENTSThe discussion and analysis is intended to serve as anintroduction to the System's financial statements. Thefinancial section consists of (1) System FinancialStatements, (2) Notes to Financial Statements, and (3)Supplemental Information.
System Financial StatementsThere are two financial statements presented herewith.The Statements of Plan Net Assets as of June 30, 2002and 2001 indicate the net assets available to pay futurepayments and gives a snapshot at a particular point intime. The Statements of Changes in Plan Net Assets forthe fiscal years ended June 30, 2002 and 2001 provide aview of the fiscal years additions and deductions to theSystem.
Notes to Financial StatementsThe notes are an integral part of the financial statementsand provide additional background information that isessential for a complete understanding of the data pro-vided in the System's financial statements. The notes tothe financial statements can be found on pages 9 to 18 ofthis report.
Supplemental InformationThe required supplemental information consists of:
Schedule 1 - Schedule of Funding Progress - this pro-vides historical trend information that contributes to theunderstanding of the changes in the funded status of theSystem over time. These are calculations made by theSystem's actuaries and they provide actuarial informa-tion that contributes to the understanding of the changesin the actuarial funding of and the funded status of theSystem over a number of years. It should be noted thatactuarial information is based upon assumptions aboutfuture events, and therefore, the figures presented areestimates.
Schedule 2 - Schedule of Employer Contributions - pro-vides historical trend information of required annual
employer contributions and the contributions actuallymade in relation to this requirement over time.
The other supplemental information consists of:
Schedule 3 - Investment Summary - lists the System'sinvestments by type presented both at cost and fair mar-ket value and the purchases and sales during the fiscalyear.
Schedule 4 - Investment Services, Professional Services,and Administration Expenses - provides more informa-tion for purposes of more detailed analysis.
Schedule 5 - Summary of Costs of Investment andProfessional Services - provides more information forpurposes of more detailed analysis.
COMPARATIVE FINANCIAL STATEMENTSOn the following page is a condensed and comparativesummary of major classes of Plan Net Assets at fairvalue.
FINANCIAL HIGHLIGHTS (In Thousands ofDollars, Unless Otherwise Noted)
� The System received $13,476 in employee con-tributions from over 12,000 participants and$40,758 in employer contributions from the Cityof Houston during the 2002 fiscal year. The Cityof Houston contribution represents the requiredcontribution rate of 10% based on actuarial val-uations of the System's assets and liabilities.
� Employee contributions increased by $4,944 or58% in fiscal year 2002 compared to fiscal year2001 which was attributed to an increased num-ber of participants in Group A (Contributorygroup). The System has improved benefitaccrual rates as a result of certain amendmentsto the Statute that became effective May 11,2001.
� The net investment loss of the Plan is $108,023during the fiscal year 2002 compared to$65,147 during the fiscal year 2001, which is anincrease of 66%. This is a reflection of adversemarket conditions during the past fiscal year.
� Benefit payments grew by 34% or $78,318 dur-ing the fiscal year 2002 compared to $58,296during the fiscal year 2001. Service retirementpension benefits amounted to $53,103 (22%increase from last year) which accounted for68% of the total benefit payments for the fiscalyear 2002.
MANAGEMENT�S DISCUSSION AND ANALYSIS
12
MANAGEMENT�S DISCUSSION AND ANALYSIS
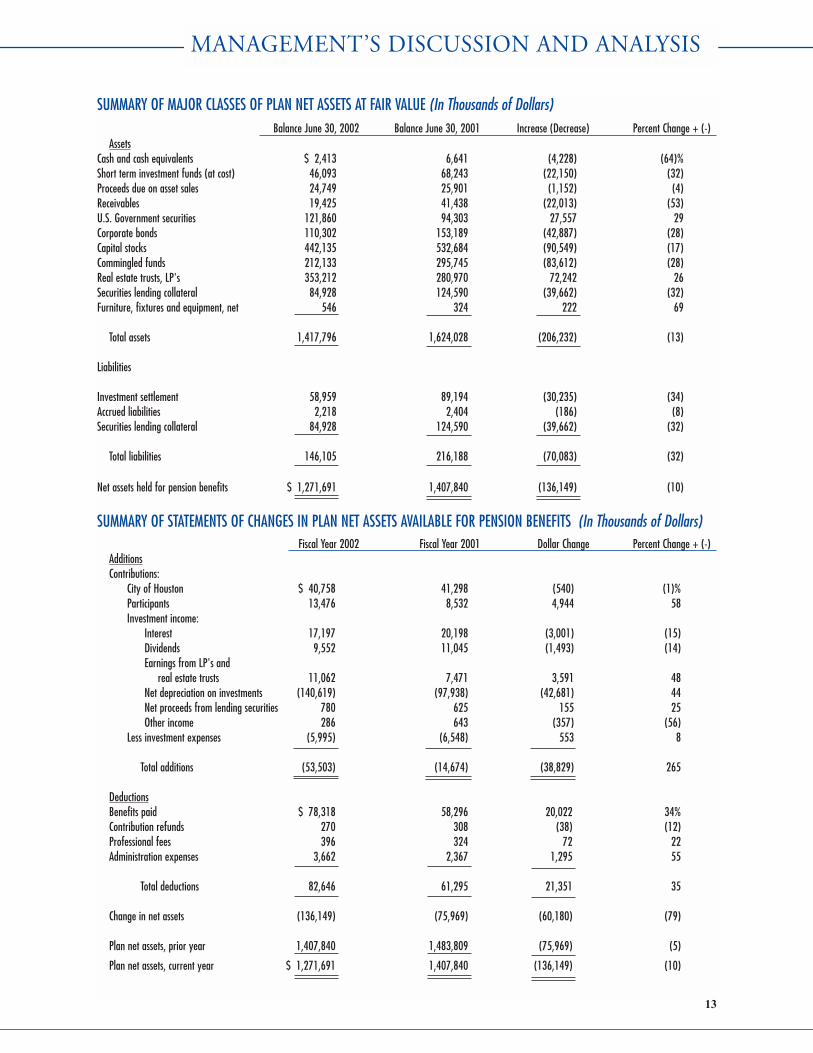
SUMMARY OF MAJOR CLASSES OF PLAN NET ASSETS AT FAIR VALUE (In Thousands of Dollars)Balance June 30, 2002 Balance June 30, 2001 Increase (Decrease) Percent Change + (-)
AssetsCash and cash equivalents $ 2,413 6,641 (4,228) (64)%Short term investment funds (at cost) 46,093 68,243 (22,150) (32)Proceeds due on asset sales 24,749 25,901 (1,152) (4)Receivables 19,425 41,438 (22,013) (53)U.S. Government securities 121,860 94,303 27,557 29Corporate bonds 110,302 153,189 (42,887) (28)Capital stocks 442,135 532,684 (90,549) (17)Commingled funds 212,133 295,745 (83,612) (28)Real estate trusts, LP's 353,212 280,970 72,242 26Securities lending collateral 84,928 124,590 (39,662) (32)Furniture, fixtures and equipment, net 546 324 222 69
Total assets 1,417,796 1,624,028 (206,232) (13)
Liabilities
Investment settlement 58,959 89,194 (30,235) (34)Accrued liabilities 2,218 2,404 (186) (8)Securities lending collateral 84,928 124,590 (39,662) (32)
Total liabilities 146,105 216,188 (70,083) (32)
Net assets held for pension benefits $ 1,271,691 1,407,840 (136,149) (10)
SUMMARY OF STATEMENTS OF CHANGES IN PLAN NET ASSETS AVAILABLE FOR PENSION BENEFITS (In Thousands of Dollars)Fiscal Year 2002 Fiscal Year 2001 Dollar Change Percent Change + (-)
AdditionsContributions:
City of Houston $ 40,758 41,298 (540) (1)%Participants 13,476 8,532 4,944 58Investment income:
Interest 17,197 20,198 (3,001) (15)Dividends 9,552 11,045 (1,493) (14)Earnings from LP's and
real estate trusts 11,062 7,471 3,591 48Net depreciation on investments (140,619) (97,938) (42,681) 44Net proceeds from lending securities 780 625 155 25Other income 286 643 (357) (56)
Less investment expenses (5,995) (6,548) 553 8
Total additions (53,503) (14,674) (38,829) 265
DeductionsBenefits paid $ 78,318 58,296 20,022 34%Contribution refunds 270 308 (38) (12)Professional fees 396 324 72 22Administration expenses 3,662 2,367 1,295 55
Total deductions 82,646 61,295 21,351 35
Change in net assets (136,149) (75,969) (60,180) (79)
Plan net assets, prior year 1,407,840 1,483,809 (75,969) (5)
Plan net assets, current year $ 1,271,691 1,407,840 (136,149) (10)
13

� Benefit payments exceeded total employee plusemployer contributions by $24,084 during fiscalyear 2002.
� Costs of administering the benefit programs ofthe System were $3,662 for fiscal year 2002 foralmost 20,000 participants.
� Net assets decreased by $136,149 during fiscalyear 2002. The decrease was primarily due tothe adverse world equity market conditions.
The System capitalized expenditures for furniture, fix-tures and computer equipment in accordance withGovernmental Accounting Standards Board StatementNo. 34, Basic Financial Statements - and Management'sDiscussion and Analysis - for State and LocalGovernments, as amended. The 2001 financial state-ments have been restated to reflect this capitalization.Furniture, fixtures and equipment, net of accumulateddepreciation, as of fiscal year end 2002 and 2001 is $546and $324, respectively.
Total investments were $1.29 billion at fiscal year end2002, and net loss on investments was $108 million dur-ing the fiscal year, for a negative return of 7%. Thiscompares to a net loss of $65.1 million during 2001 witha negative return of 5%. The performances of invest-ment classes are based on investment amounts as of June30, 2002 (see table).
The year ended June 30, 2002 proved to be another dif-ficult period for the investment community. Capital mar-kets around the world reflected a lack of investor confi-dence due to the tragic terrorist events of September 11,2001, corporate accounting fraud (Enron, WorldCom,Global Crossing, etc.) and continued low corporate prof-itability. These conditions resulted in negative worldequity market performance, a declining U.S. dollar and aflight to quality in fixed-income markets. For the pastthree years, most equity markets have remained in nega-tive territory, while fixed-income and real estate marketshave provided the only safe haven. The S&P 500 wasdown 18.0% and 9.2% for the past one and three-yearperiods, while the fixed-income market was up 8.6% and8.1%, respectively, as measured by the LehmanAggregate index. The real estate market was up 5.5%and 9.6%, respectively, over the same periods as meas-ured by the NCREIF Index.
Throughout fiscal year 2002, the System maintained itsexisting target asset allocation mix of 30% domesticequities, 20% international equities, 20% fixed-income,15% real estate and 15% alternative investments.However, due to movements in the markets and rebal-ancing activities directed by staff, the System maintaineda slight underweight to equities and a slight overweightto fixed-income and real estate.
PERFORMANCE OF INVESTMENT CLASSESBenchmark System
Investment Class Index Return(%) Return(%) Amount($) Allocation(%)
U.S. Equities Wilshire TargetTop 2500 Index -17.20% -12.72% $ 361,956 28%
International MSCI All CountryEquities World Index Free
ex US (ACWI Freeex US) -8.16 -13.16 243,696 19
Fixed-Income Lehman Aggregate Index 8.64 2.34 282,117 22
Real Estate NCREIF Index 5.53 5.23 230,387 18
Alternatives S&P 500 Index -17.99 -18.59 167,579 13
Total -6.75 -7.06 $ 1,285,735 100%
MANAGEMENT�S DISCUSSION AND ANALYSIS
14

The System's investment performance was -7.0% and3.1% for the past one and three-year periods. The one-year performance was slightly below median relative toits peer group, ranking in the 63rd percentile. However,the three-year performance was significantly higher thanits peer group, ranking in the 8th percentile. TheSystem's negative investment performance over the pastyear was driven by its exposure to the equity markets andhigh exposure to credits in the fixed-income markets.The System's 18% exposure to real estate has been thebest performer over the past one and three-year periods,returning 5.2% and 13.3%, respectively. Also contribut-ing to the System's performance over the three-year peri-od has been its exposure to alternative investments,which returned an average of 6.7% per annum.
The System's securities lending program obtains addi-tional income by lending securities to broker-dealers andbanks. During the years ended June 30, 2002 and 2001,the System's custodian lent, at the direction of the Board,the System's securities and received cash, securitiesissued or guaranteed by the United States government,and irrevocable bank letters of credit as collateral. TheBoard and the borrowers maintained the right to termi-nate all securities lending transactions on demand. Thecash collateral received on each loan was invested,together with the cash collateral of other qualified tax-exempt plan lenders, in a collective investment pool. OnJune 30, 2002, the System had no credit risk exposure toborrowers.
The System's investments in limited partnerships areincluded in the tables appearing in note 5 under invest-ments not categorized. In connection with those invest-ments, the System has remaining commitments as ofJune 30, 2002 of approximately $299 million pursuant toterms of the respective limited partnerships.
CONTACTING THE SYSTEM'S FINANCIAL MANAGEMENTThis financial report is designed to provide our partici-pants, employer, business partners, and taxpayers with ageneral overview of the System's financial activities. Ifyou have questions about this report or need additionalfinancial information, contact the Accounting Managerof the Houston Municipal Employees Pension System at1111 Bagby, Suite 2450, Houston, Texas 77002.
MANAGEMENT�S DISCUSSION AND ANALYSIS
15

2002 2001Assets:Investments, at fair value:
United States government securities(cost: $122,388,783 in 2002 and $93,740,808 in 2001) $ 121,859,607 94,302,910
Corporate bonds(cost: $123,447,124 in 2002 and $174,778,718 in 2001) 110,302,312 153,189,183
Capital stocks(cost: $456,935,751 in 2002 and $523,248,401 in 2001) 442,135,030 532,684,311
Commingled funds (cost: $204,148,431 in 2002 and $239,146,572 in 2001) 212,132,654 295,745,330
Limited partnerships, real estate trusts, and loans and mortgages(cost $360,526,672 in 2002 and $267,775,069 in 2001) 353,211,833 280,970,325
Short-term investment funds (valued at cost) 46,093,354 68,243,125
Total investments 1,285,734,790 1,425,135,184
Cash and cash equivalents 2,412,976 6,640,996Proceeds due on asset sales 24,748,818 25,900,651Receivables on foreign exchanges 12,990,583 33,776,370Receivables 6,433,963 7,660,403Collateral on securities lending arrangements, at fair value 84,928,716 124,590,077Furniture, fixtures and equipment, net 546,375 324,389
Total assets 1,417,796,221 1,624,028,070
Liabilities:Amounts due on asset purchases 45,765,126 55,750,637Payables on foreign exchanges 12,990,583 33,371,436Accrued liabilities 2,217,701 2,404,332Options written 203,228 71,098Collateral on securities lending arrangements, at fair value 84,928,716 124,590,077
Total liabilities 146,105,354 216,187,580
Plan net assets held in trust for pension benefits $ 1,271,690,867 1,407,840,490
(A schedule of funding progress for the plan is presented on page 24).
See accompanying notes to the financial statements.
16
STATEMENTS OF PLAN NET ASSETS JUNE 30, 2002 AND 2001
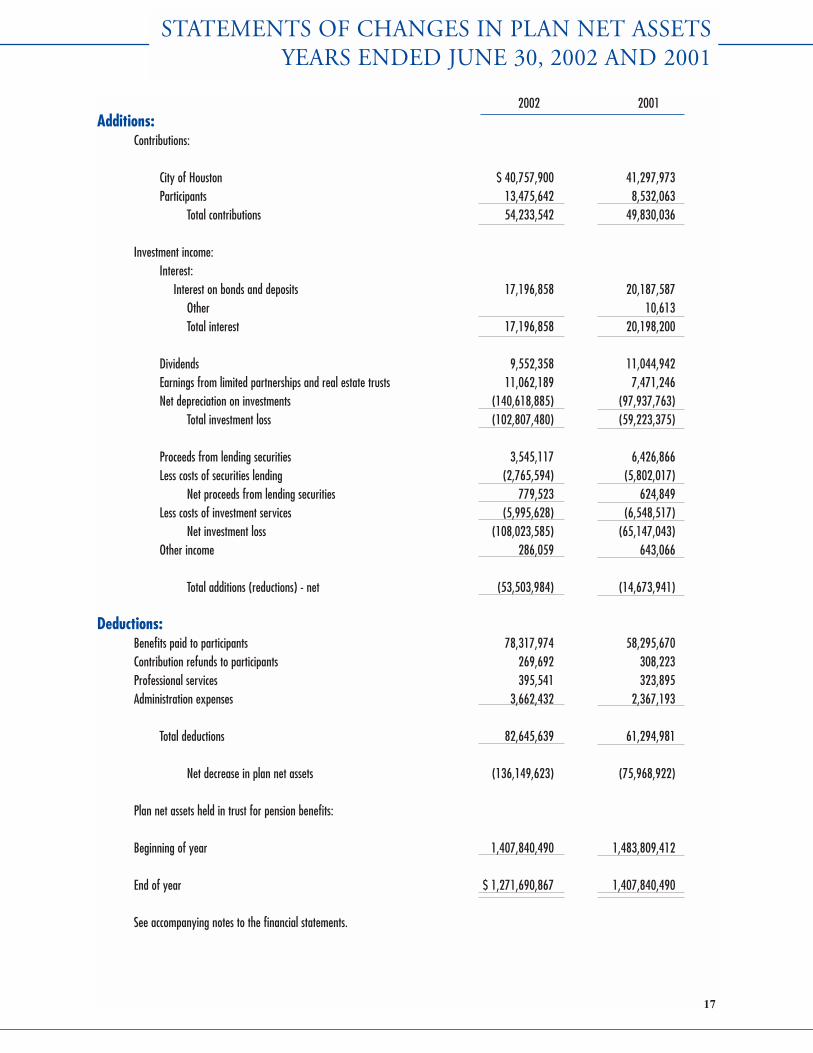
2002 2001Additions:
Contributions:
City of Houston $ 40,757,900 41,297,973 Participants 13,475,642 8,532,063
Total contributions 54,233,542 49,830,036
Investment income:Interest:
Interest on bonds and deposits 17,196,858 20,187,587 Other 10,613 Total interest 17,196,858 20,198,200
Dividends 9,552,358 11,044,942 Earnings from limited partnerships and real estate trusts 11,062,189 7,471,246 Net depreciation on investments (140,618,885) (97,937,763)
Total investment loss (102,807,480) (59,223,375)
Proceeds from lending securities 3,545,117 6,426,866 Less costs of securities lending (2,765,594) (5,802,017)
Net proceeds from lending securities 779,523 624,849 Less costs of investment services (5,995,628) (6,548,517)
Net investment loss (108,023,585) (65,147,043)Other income 286,059 643,066
Total additions (reductions) - net (53,503,984) (14,673,941)
Deductions:Benefits paid to participants 78,317,974 58,295,670 Contribution refunds to participants 269,692 308,223 Professional services 395,541 323,895 Administration expenses 3,662,432 2,367,193
Total deductions 82,645,639 61,294,981
Net decrease in plan net assets (136,149,623) (75,968,922)
Plan net assets held in trust for pension benefits:
Beginning of year 1,407,840,490 1,483,809,412
End of year $ 1,271,690,867 1,407,840,490
See accompanying notes to the financial statements.
17
STATEMENTS OF CHANGES IN PLAN NET ASSETS YEARS ENDED JUNE 30, 2002 AND 2001
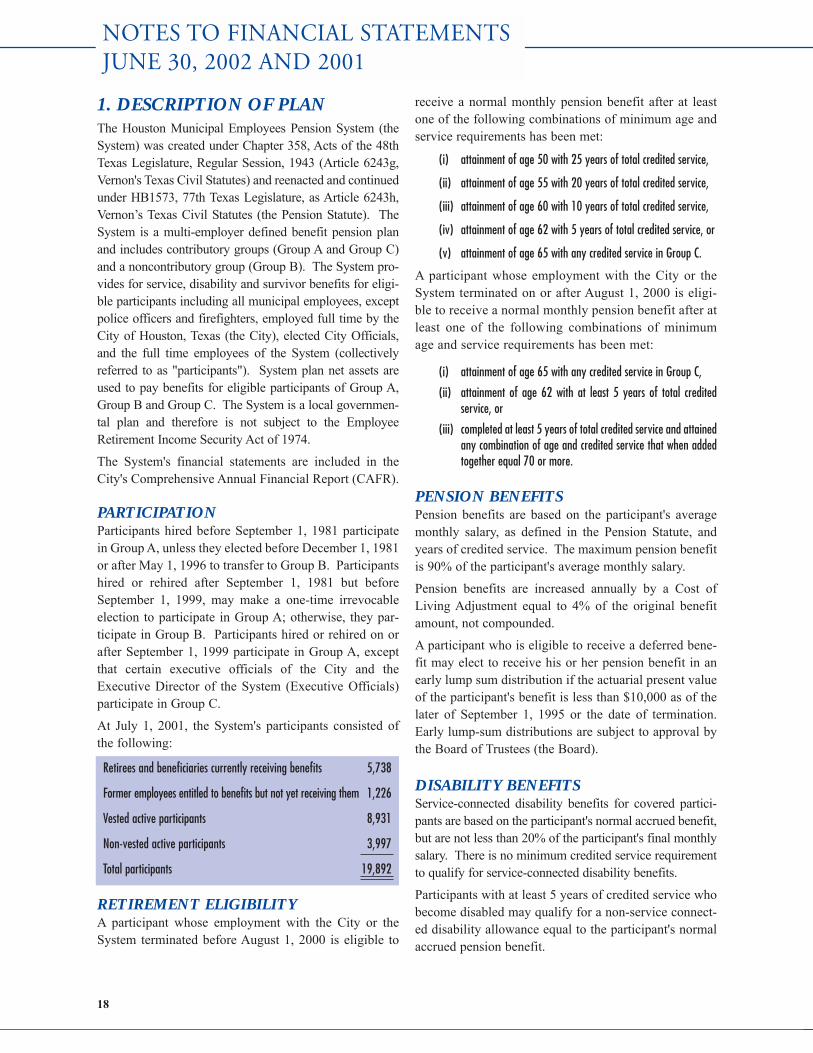
1. DESCRIPTION OF PLAN The Houston Municipal Employees Pension System (theSystem) was created under Chapter 358, Acts of the 48thTexas Legislature, Regular Session, 1943 (Article 6243g,Vernon's Texas Civil Statutes) and reenacted and continuedunder HB1573, 77th Texas Legislature, as Article 6243h,Vernon�s Texas Civil Statutes (the Pension Statute). TheSystem is a multi-employer defined benefit pension planand includes contributory groups (Group A and Group C)and a noncontributory group (Group B). The System pro-vides for service, disability and survivor benefits for eligi-ble participants including all municipal employees, exceptpolice officers and firefighters, employed full time by theCity of Houston, Texas (the City), elected City Officials,and the full time employees of the System (collectivelyreferred to as "participants"). System plan net assets areused to pay benefits for eligible participants of Group A,Group B and Group C. The System is a local governmen-tal plan and therefore is not subject to the EmployeeRetirement Income Security Act of 1974.
The System's financial statements are included in theCity's Comprehensive Annual Financial Report (CAFR).
PARTICIPATIONParticipants hired before September 1, 1981 participatein Group A, unless they elected before December 1, 1981or after May 1, 1996 to transfer to Group B. Participantshired or rehired after September 1, 1981 but beforeSeptember 1, 1999, may make a one-time irrevocableelection to participate in Group A; otherwise, they par-ticipate in Group B. Participants hired or rehired on orafter September 1, 1999 participate in Group A, exceptthat certain executive officials of the City and theExecutive Director of the System (Executive Officials)participate in Group C.
At July 1, 2001, the System's participants consisted ofthe following:
Retirees and beneficiaries currently receiving benefits 5,738
Former employees entitled to benefits but not yet receiving them 1,226
Vested active participants 8,931
Non-vested active participants 3,997
Total participants 19,892
RETIREMENT ELIGIBILITYA participant whose employment with the City or theSystem terminated before August 1, 2000 is eligible to
receive a normal monthly pension benefit after at leastone of the following combinations of minimum age andservice requirements has been met:
(i) attainment of age 50 with 25 years of total credited service,
(ii) attainment of age 55 with 20 years of total credited service,
(iii) attainment of age 60 with 10 years of total credited service,
(iv) attainment of age 62 with 5 years of total credited service, or
(v) attainment of age 65 with any credited service in Group C.
A participant whose employment with the City or theSystem terminated on or after August 1, 2000 is eligi-ble to receive a normal monthly pension benefit after atleast one of the following combinations of minimumage and service requirements has been met:
(i) attainment of age 65 with any credited service in Group C,
(ii) attainment of age 62 with at least 5 years of total creditedservice, or
(iii) completed at least 5 years of total credited service and attainedany combination of age and credited service that when addedtogether equal 70 or more.
PENSION BENEFITSPension benefits are based on the participant's averagemonthly salary, as defined in the Pension Statute, andyears of credited service. The maximum pension benefitis 90% of the participant's average monthly salary.
Pension benefits are increased annually by a Cost ofLiving Adjustment equal to 4% of the original benefitamount, not compounded.
A participant who is eligible to receive a deferred bene-fit may elect to receive his or her pension benefit in anearly lump sum distribution if the actuarial present valueof the participant's benefit is less than $10,000 as of thelater of September 1, 1995 or the date of termination.Early lump-sum distributions are subject to approval bythe Board of Trustees (the Board).
DISABILITY BENEFITSService-connected disability benefits for covered partici-pants are based on the participant's normal accrued benefit,but are not less than 20% of the participant's final monthlysalary. There is no minimum credited service requirementto qualify for service-connected disability benefits.
Participants with at least 5 years of credited service whobecome disabled may qualify for a non-service connect-ed disability allowance equal to the participant's normalaccrued pension benefit.
18
NOTES TO FINANCIAL STATEMENTS JUNE 30, 2002 AND 2001
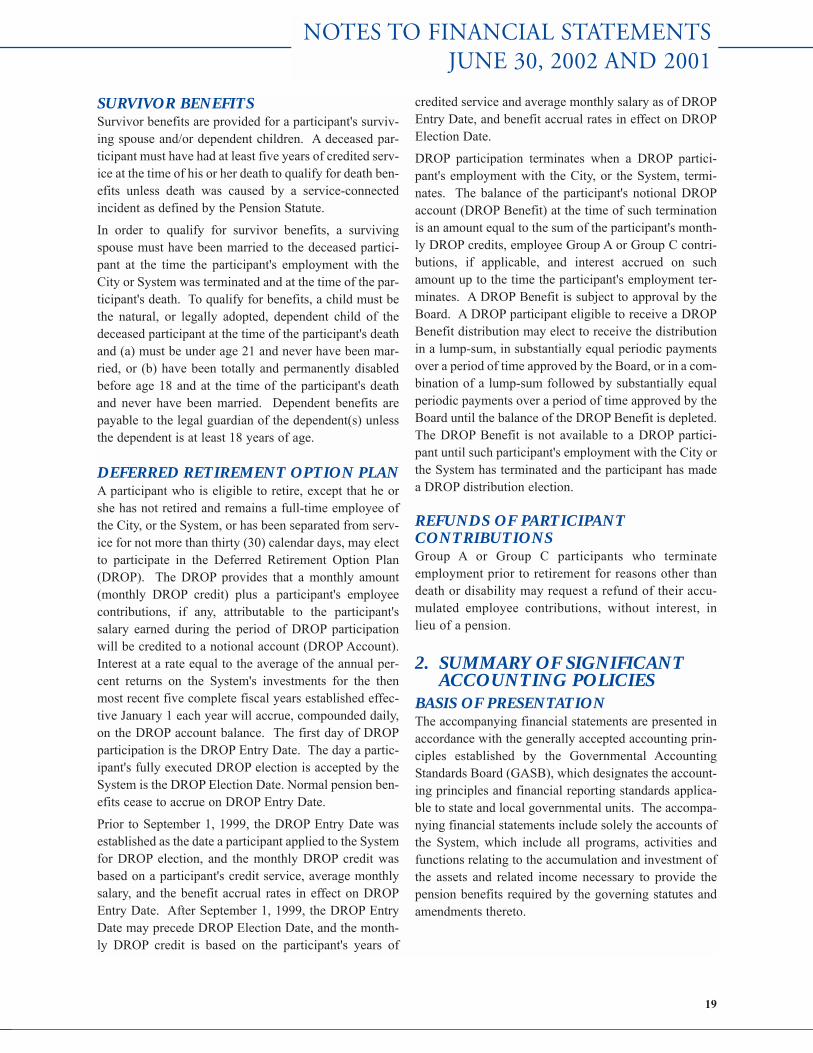
SURVIVOR BENEFITSSurvivor benefits are provided for a participant's surviv-ing spouse and/or dependent children. A deceased par-ticipant must have had at least five years of credited serv-ice at the time of his or her death to qualify for death ben-efits unless death was caused by a service-connectedincident as defined by the Pension Statute.
In order to qualify for survivor benefits, a survivingspouse must have been married to the deceased partici-pant at the time the participant's employment with theCity or System was terminated and at the time of the par-ticipant's death. To qualify for benefits, a child must bethe natural, or legally adopted, dependent child of thedeceased participant at the time of the participant's deathand (a) must be under age 21 and never have been mar-ried, or (b) have been totally and permanently disabledbefore age 18 and at the time of the participant's deathand never have been married. Dependent benefits arepayable to the legal guardian of the dependent(s) unlessthe dependent is at least 18 years of age.
DEFERRED RETIREMENT OPTION PLANA participant who is eligible to retire, except that he orshe has not retired and remains a full-time employee ofthe City, or the System, or has been separated from serv-ice for not more than thirty (30) calendar days, may electto participate in the Deferred Retirement Option Plan(DROP). The DROP provides that a monthly amount(monthly DROP credit) plus a participant's employeecontributions, if any, attributable to the participant'ssalary earned during the period of DROP participationwill be credited to a notional account (DROP Account).Interest at a rate equal to the average of the annual per-cent returns on the System's investments for the thenmost recent five complete fiscal years established effec-tive January 1 each year will accrue, compounded daily,on the DROP account balance. The first day of DROPparticipation is the DROP Entry Date. The day a partic-ipant's fully executed DROP election is accepted by theSystem is the DROP Election Date. Normal pension ben-efits cease to accrue on DROP Entry Date.
Prior to September 1, 1999, the DROP Entry Date wasestablished as the date a participant applied to the Systemfor DROP election, and the monthly DROP credit wasbased on a participant's credit service, average monthlysalary, and the benefit accrual rates in effect on DROPEntry Date. After September 1, 1999, the DROP EntryDate may precede DROP Election Date, and the month-ly DROP credit is based on the participant's years of
credited service and average monthly salary as of DROPEntry Date, and benefit accrual rates in effect on DROPElection Date.
DROP participation terminates when a DROP partici-pant's employment with the City, or the System, termi-nates. The balance of the participant's notional DROPaccount (DROP Benefit) at the time of such terminationis an amount equal to the sum of the participant's month-ly DROP credits, employee Group A or Group C contri-butions, if applicable, and interest accrued on suchamount up to the time the participant's employment ter-minates. A DROP Benefit is subject to approval by theBoard. A DROP participant eligible to receive a DROPBenefit distribution may elect to receive the distributionin a lump-sum, in substantially equal periodic paymentsover a period of time approved by the Board, or in a com-bination of a lump-sum followed by substantially equalperiodic payments over a period of time approved by theBoard until the balance of the DROP Benefit is depleted.The DROP Benefit is not available to a DROP partici-pant until such participant's employment with the City orthe System has terminated and the participant has madea DROP distribution election.
REFUNDS OF PARTICIPANT CONTRIBUTIONSGroup A or Group C participants who terminateemployment prior to retirement for reasons other thandeath or disability may request a refund of their accu-mulated employee contributions, without interest, inlieu of a pension.
2. SUMMARY OF SIGNIFICANTACCOUNTING POLICIES
BASIS OF PRESENTATIONThe accompanying financial statements are presented inaccordance with the generally accepted accounting prin-ciples established by the Governmental AccountingStandards Board (GASB), which designates the account-ing principles and financial reporting standards applica-ble to state and local governmental units. The accompa-nying financial statements include solely the accounts ofthe System, which include all programs, activities andfunctions relating to the accumulation and investment ofthe assets and related income necessary to provide thepension benefits required by the governing statutes andamendments thereto.
19
NOTES TO FINANCIAL STATEMENTSJUNE 30, 2002 AND 2001

BASIS OF ACCOUNTINGThe basis of accounting is the method by which revenuesand expenses are recognized in the accounts and report-ed in the financial statements. The accompanying finan-cial statements are presented on the accrual basis ofaccounting. Under the accrual basis of accounting, rev-enues, which include contributions and investmentincome, are recognized when they are earned and collec-tion is reasonably assured, and expenses, which includebenefits and contribution refunds, are recognized whenthe liability is incurred. Accrued income, when deemednot collectible, is charged to operations.
NEW ACCOUNTING PRONOUNCEMENTIn June 1999, the GASB issued Statement No. 34, BasicFinancial Statements - and Management's Discussionand Analysis - for State and Local Governments (GASB34). In June 2001, the GASB issued Statement No. 37,Basic Financial Statements - and Management�sDiscussion and Analysis - for State and LocalGovernments: Omnibus, which amended certain provi-sions of GASB 34. The System adopted GASB 34, asamended, during the current year. As a result of theadoption of GASB 34, the Management's Discussion andAnalysis has been included as required supplementaryinformation and precedes the financial statements. Inaccordance with GASB 34, the 2001 financial statementshave been restated to reflect the capitalization of expen-ditures for furniture, fixtures and equipment.
INVESTMENTSInvestments are reported at fair value. Securities tradedon a national or international exchange are valued at thelast reported sales price at current exchange rates.Mortgages are valued on the basis of future principal andinterest payments, and are discounted at prevailing inter-est rates for similar instruments. The fair value of limit-ed partnerships and real estate trusts are based on inde-pendent appraisals or recent financial results. Short-terminvestments are carried at cost, which approximates fairvalue. Investments that do not have an established mar-ket are reported at estimated fair value.
Purchases and sales of investments and forward foreignexchange contracts are recorded on the trade date. Gainsor losses on the forward foreign exchange contracts arerecognized when the contract is complete.
Dividend income is recorded on the ex-dividend date.Income from other investments is recorded when earned.
CASH AND CASH EQUIVALENT SECURITIESThe System's cash balances are classified in three cate-gories of credit risk:
(1) insured or collateralized with securities held by theSystem or by its agent in the System's name,
(2) collateralized with securities held by the pledgingfinancial institution's trust department or agent in theSystem's name,
(3) uncollateralized, including any bank balance that iscollateralized with securities held by the pledginginstitution or by its agent or trust department but notin the System's name.
As of June 30, 2002 and 2001, the System had bank bal-ances of $5,506,470 and $2,205,094, respectively, thatmeet the criteria of Category (1) held in demanddeposits. The book balances, reflected in the financialstatements, of those deposits are $2,412,976 and$(169,800), respectively. A cash balance of $6,810,796,at June 30, 2001 was held in trust by the System's mas-ter custodian that met the criteria of Category (3). Thebank balance is the same as the book balance for cashamounts held in trust by the System's master custodian.
FURNITURE, FIXTURES AND EQUIPMENTFurniture, fixtures and equipment are recorded at cost lessaccumulated depreciation and amortization. Depreciationand amortization expense is computed using the straight-line method over the estimated useful lives of the relatedassets ranging from three to ten years. Any gain or losson the retirement of assets is recognized currently.Maintenance and repairs are charged to expense whileexpenditures for improvements are capitalized.
USE OF ESTIMATESThe preparation of financial statements in conformitywith accounting principles generally accepted in theUnited States of America requires management to makeestimates and assumptions that affect the reportedamounts of assets and liabilities at the date of the finan-cial statements and the reported amounts of additions anddeductions during the reporting period. Actual resultscould differ from those estimates.
INCOME TAX STATUSThe System obtained its latest determination letter onApril 23, 2002, in which the Internal Revenue Service
20
NOTES TO FINANCIAL STATEMENTS JUNE 30, 2002 AND 2001

stated that the System, as amended on May 11, 2001, isin compliance with the applicable requirements of theInternal Revenue Code. The System's management andBoard believe that the System is currently designed andbeing operated in compliance with the applicablerequirements of the Internal Revenue Code.
COSTS OF ADMINISTERING THE SYSTEMThe costs of administering the System are paid by theSystem from current earnings pursuant to an annual fis-cal budget adopted by the Board.
3. FUNDING STATUS AND PROGRESS
Participants of Group A and Group C are required to con-tribute to the System amounts set forth in the PensionStatute. In addition, the City is required to contributeamounts to the System which provide funding, on anactuarial reserve basis, stated as a percentage of coveredpayroll, for normal cost plus the level of percentages ofpayroll payments required to amortize the unfundedaccrued liability over 40 years from January 1, 1983.The City's contribution rate is based on actuarial valua-tions of the System's assets and liabilities, and shall benot less than the greater of 10% of all member salaries ortwo times the rate contributed by Group A participants.
The latest actuarial report on the System, which wasapproved and accepted by the Board, is based on partic-ipant data at July 1, 2000. The significant actuarialassumptions adopted as of July 1, 2000, and used in thatactuarial valuation are as follows:
Actuarial Assumptions
Investment yield rate 8.5%
Salary increases Constant annual rate of 5.5%
Payroll growth factor 5.0%
General inflation rate 4.5%
Funding method Entry age normal cost method
Life expectancy 1994 Group Annuity Mortality Table
The City's required contribution rate during the yearended June 30, 2002 is based on the July 1, 2000 actu-arial valuation. The actuarially determined contribu-tion requirements as of July 2000 and the contributionsactually made for the year ended June 30, 2002 are asfollows:
Contributions Required and Contributions Made
Percentage of (in millions) covered payroll
Normal cost $ 31.0 7.5 %
Amortization of unfunded actuarial accrued liability 8.3 2.0 %
Employer contributions actually made 40.8 10.0 %
Participant contributions made 13.5 4.0 %
Seven-year historical trend information is provided asrequired supplementary information on page 25. Thishistorical information is intended to demonstrate theprogress the System has made in accumulating sufficientassets to pay benefits when due and the related actuarialassumptions used in determining the actuarially deter-mined amounts.
4. DEFERRED COMPENSATIONPLAN
The System offers its employees a deferred compensa-tion plan (the DCP) created in accordance with InternalRevenue Code Section 457. The DCP, available to allemployees of the System, permits employees to defer aportion of their salary until future years. Distributionsfrom the DCP are not available to employees until termi-nation, retirement, death or unforeseeable emergency.The DCP has a third party administrator, NationwideRetirement Solutions (Nationwide), and the cost ofadministration and funding are borne by the DCP partic-ipants. Amounts deferred are held in trust by Nationwideand, because the System has no fiduciary responsibilityfor the DCP, these amounts are not reflected in theaccompanying financial statements in accordance withGASB Statement No. 32.
5. INVESTMENTSPortions of the System's investments are classified assecurity investments. A security is a transferable finan-cial instrument that evidences ownership or creditorship.The System's security investments have been classifiedby risk category to indicate the level of risk assumed bythe System. There are 3 categories of risk. Category 1includes securities that are insured or registered, or secu-rities that are held by the System or its agent in theSystem's name. Category 2 includes securities which areuninsured and unregistered, with securities held by thecounterparty's trust department or agent in the System's
21
NOTES TO FINANCIAL STATEMENTSJUNE 30, 2002 AND 2001
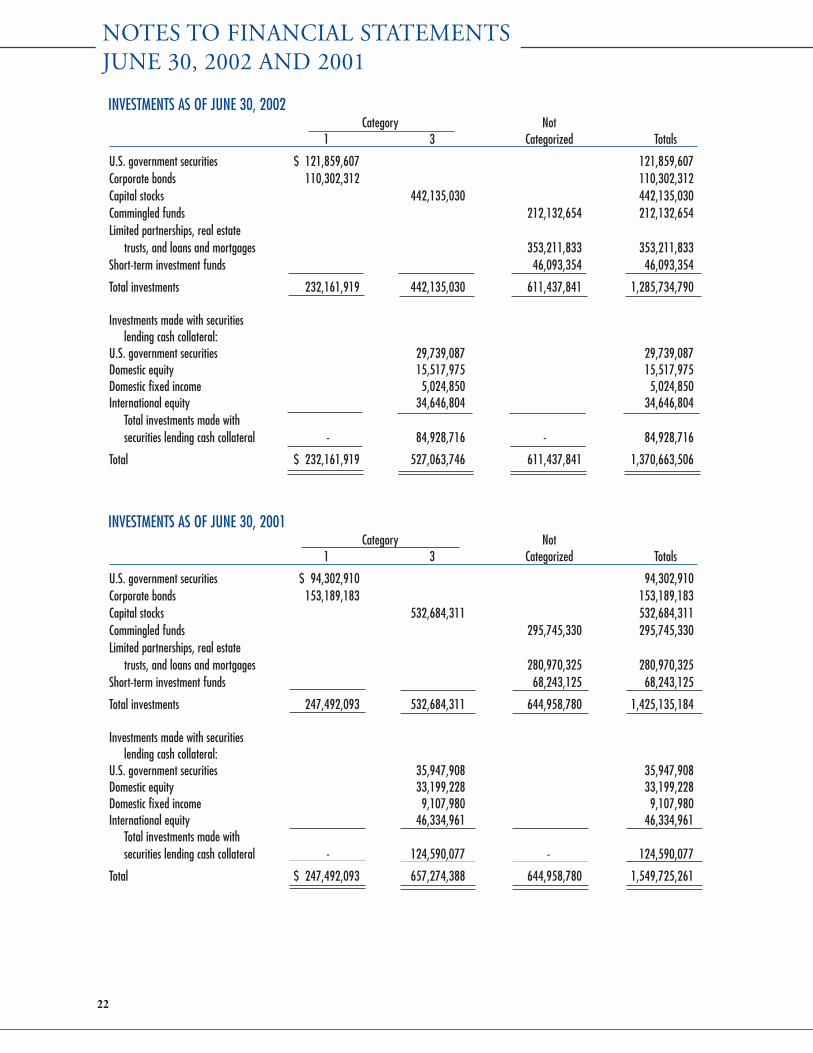
INVESTMENTS AS OF JUNE 30, 2002Category Not
1 3 Categorized Totals
U.S. government securities $ 121,859,607 121,859,607Corporate bonds 110,302,312 110,302,312Capital stocks 442,135,030 442,135,030Commingled funds 212,132,654 212,132,654Limited partnerships, real estate
trusts, and loans and mortgages 353,211,833 353,211,833Short-term investment funds 46,093,354 46,093,354
Total investments 232,161,919 442,135,030 611,437,841 1,285,734,790
Investments made with securitieslending cash collateral:
U.S. government securities 29,739,087 29,739,087Domestic equity 15,517,975 15,517,975Domestic fixed income 5,024,850 5,024,850International equity 34,646,804 34,646,804
Total investments made withsecurities lending cash collateral - 84,928,716 - 84,928,716
Total $ 232,161,919 527,063,746 611,437,841 1,370,663,506
INVESTMENTS AS OF JUNE 30, 2001Category Not
1 3 Categorized Totals
U.S. government securities $ 94,302,910 94,302,910Corporate bonds 153,189,183 153,189,183Capital stocks 532,684,311 532,684,311Commingled funds 295,745,330 295,745,330Limited partnerships, real estate
trusts, and loans and mortgages 280,970,325 280,970,325Short-term investment funds 68,243,125 68,243,125
Total investments 247,492,093 532,684,311 644,958,780 1,425,135,184
Investments made with securitieslending cash collateral:
U.S. government securities 35,947,908 35,947,908Domestic equity 33,199,228 33,199,228Domestic fixed income 9,107,980 9,107,980International equity 46,334,961 46,334,961
Total investments made withsecurities lending cash collateral - 124,590,077 - 124,590,077
Total $ 247,492,093 657,274,388 644,958,780 1,549,725,261
22
NOTES TO FINANCIAL STATEMENTS JUNE 30, 2002 AND 2001

23
name. Category 3 includes securities which are unin-sured and unregistered, with securities held by the coun-terparty, or its trust department or agent but not in theSystem's name.
The fair values of the System's investments at June 30,2002 and June 30, 2001 are presented in the followingtables. Investments are listed by category of credit risk.Investments not subject to credit risk classification arelisted but not categorized.
The System's investment as of June 30, 2002 of$90,014,335 in BZW Alpha TILTS Fund exceeds 5% ofthe System's net assets as of June 30, 2002. The System'sinvestment of $108,915,182 in BZW ALPHA TILTSFund as of June 30, 2001 exceeded 5% of the System'snet assets on that date. All investments that exceed 5%of the System's total investments as of June 30, 2002 and2001 are included in the amounts invested in commin-gled funds. Schedule 5 on page 27 lists the System'sinvestment and professional service providers.
Investment securities, in general, are exposed to variousrisks, such as interest rate, credit, and overall marketvolatility. Due to the level of risk associated with certaininvestment securities, it is reasonably possible thatchanges in the values of investment securities will occur inthe near term and that such changes could materially affectthe amounts reported in the statement of plan net assets.
6. FURNITURE, FIXTURES AND EQUIPMENT
Furniture, fixtures and equipment are comprised as fol-lows at June 30:
2002 2001
Office furniture and equipment $ 221,833 $ 60,320
Computer equipment 111,190 13,650
Leasehold improvements 345,995 267,033
679,018 341,003Less accumulated depreciation and amortization (132,643) (16,614)
$ 546,375 $ 324,389
7. SECURITIES LENDINGState statutes do not prohibit the System from participat-ing in securities lending transactions and the Board hasauthorized its custodian to lend the System's securities tobroker-dealers and banks pursuant to a form of loan
agreement. During the years ended June 30, 2002 and2001, the System's custodian lent, at the direction of theBoard, the System's securities and received cash, securi-ties issued or guaranteed by the United States govern-ment, and irrevocable bank letters of credit as collateral.The custodian does not have the ability to pledge or sellsecurities delivered for collateral, absent a borrowersdefault. Borrowers were required to deliver collateral foreach loan equal to: (i) in the case of loaned securitiesdenominated in United States dollars or whose primarytrading market was located in the United States or sover-eign debt issued by foreign governments, 102% of themarket value of the loaned securities; and (ii) in the caseof loaned securities not denominated in United Statesdollars or whose primary trading market was not locatedin the United States, 105% of the market value of theloaned securities.
The Board did not impose any restrictions on theamounts of the loans that the System's custodian madeon its behalf. There were no failures by any borrowers toreturn loaned securities or pay distributions. Moreover,there were no losses during the year resulting from adefault of the borrowers or the custodian.
During the years ended June 30, 2002 and 2001, theBoard and the borrowers maintained the right to termi-nate all securities lending transactions on demand. Thecash collateral received on each loan was invested,together with the cash collateral of other qualified tax-exempt plan lenders, in a collective investment pool. Asof June 30, 2002 and 2001, such investment pool had anaverage duration of 69 and 73 days, respectively, and anaverage weighted maturity of 144 and 172 days, respec-tively. Because the loans were terminable at will, theirduration did not generally match the duration of theinvestments made with cash collateral. On June 30,2002, the System had no credit risk exposure to borrow-ers. The collateral held and the fair value of securities onloan as of June 30, 2002, were $92,757,102 and$90,605,956, respectively, and $128,614,730 and$124,255,580, respectively, as of June 30, 2001.
8. COMMITMENTS As described in note 1, certain participants of the Systemare eligible to receive, upon request, a refund of their accu-mulated Group A and/or Group C contributions, withoutinterest, upon termination of employment with the City, orSystem, prior to being eligible for pension benefits. AtJune 30, 2002 aggregate contributions from active partic-ipants of the System were approximately $46,893,000.
NOTES TO FINANCIAL STATEMENTSJUNE 30, 2002 AND 2001
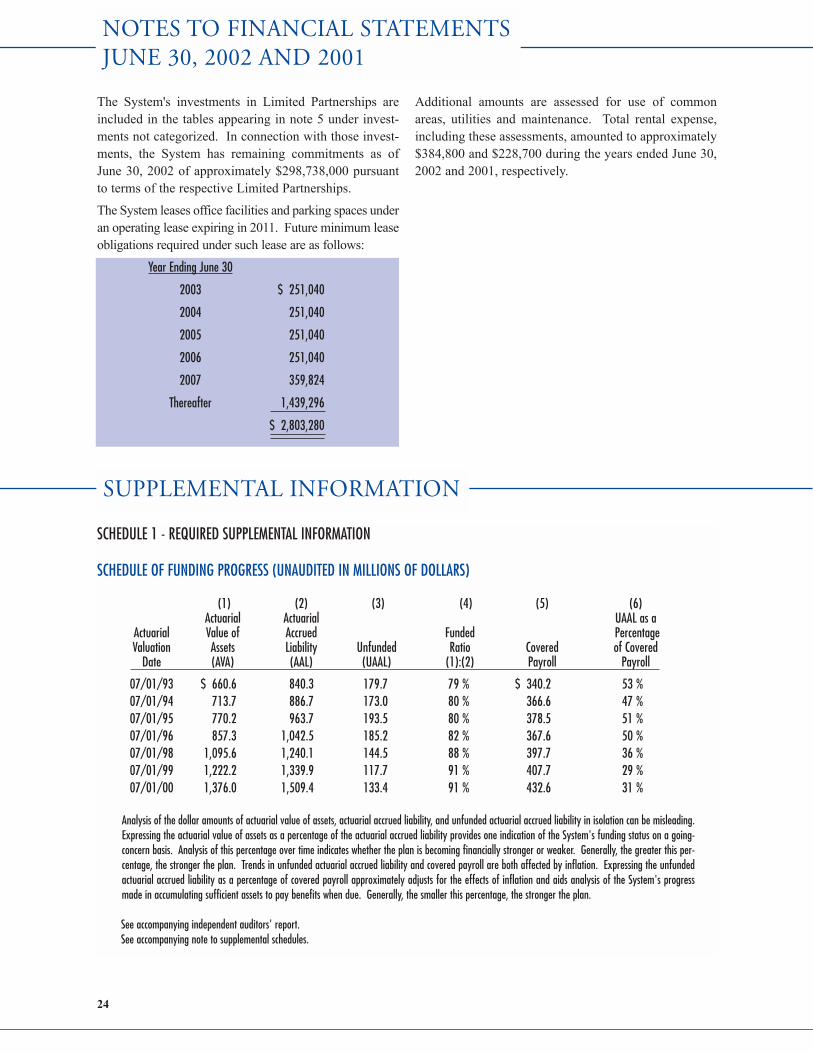
SCHEDULE 1 - REQUIRED SUPPLEMENTAL INFORMATION
SCHEDULE OF FUNDING PROGRESS (UNAUDITED IN MILLIONS OF DOLLARS)
(1) (2) (3) (4) (5) (6)Actuarial Actuarial UAAL as a
Actuarial Value of Accrued Funded PercentageValuation Assets Liability Unfunded Ratio Covered of Covered
Date (AVA) (AAL) (UAAL) (1):(2) Payroll Payroll
07/01/93 $ 660.6 840.3 179.7 79 % $ 340.2 53 %07/01/94 713.7 886.7 173.0 80 % 366.6 47 % 07/01/95 770.2 963.7 193.5 80 % 378.5 51 % 07/01/96 857.3 1,042.5 185.2 82 % 367.6 50 % 07/01/98 1,095.6 1,240.1 144.5 88 % 397.7 36 % 07/01/99 1,222.2 1,339.9 117.7 91 % 407.7 29 %07/01/00 1,376.0 1,509.4 133.4 91 % 432.6 31 %
Analysis of the dollar amounts of actuarial value of assets, actuarial accrued liability, and unfunded actuarial accrued liability in isolation can be misleading.Expressing the actuarial value of assets as a percentage of the actuarial accrued liability provides one indication of the System's funding status on a going-concern basis. Analysis of this percentage over time indicates whether the plan is becoming financially stronger or weaker. Generally, the greater this per-centage, the stronger the plan. Trends in unfunded actuarial accrued liability and covered payroll are both affected by inflation. Expressing the unfundedactuarial accrued liability as a percentage of covered payroll approximately adjusts for the effects of inflation and aids analysis of the System's progressmade in accumulating sufficient assets to pay benefits when due. Generally, the smaller this percentage, the stronger the plan.
See accompanying independent auditors' report.See accompanying note to supplemental schedules.
24
NOTES TO FINANCIAL STATEMENTS JUNE 30, 2002 AND 2001
The System's investments in Limited Partnerships areincluded in the tables appearing in note 5 under invest-ments not categorized. In connection with those invest-ments, the System has remaining commitments as ofJune 30, 2002 of approximately $298,738,000 pursuantto terms of the respective Limited Partnerships.
The System leases office facilities and parking spaces underan operating lease expiring in 2011. Future minimum leaseobligations required under such lease are as follows:
Year Ending June 30
2003 $ 251,040
2004 251,040
2005 251,040
2006 251,040
2007 359,824
Thereafter 1,439,296
$ 2,803,280
Additional amounts are assessed for use of commonareas, utilities and maintenance. Total rental expense,including these assessments, amounted to approximately$384,800 and $228,700 during the years ended June 30,2002 and 2001, respectively.
SUPPLEMENTAL INFORMATION
25
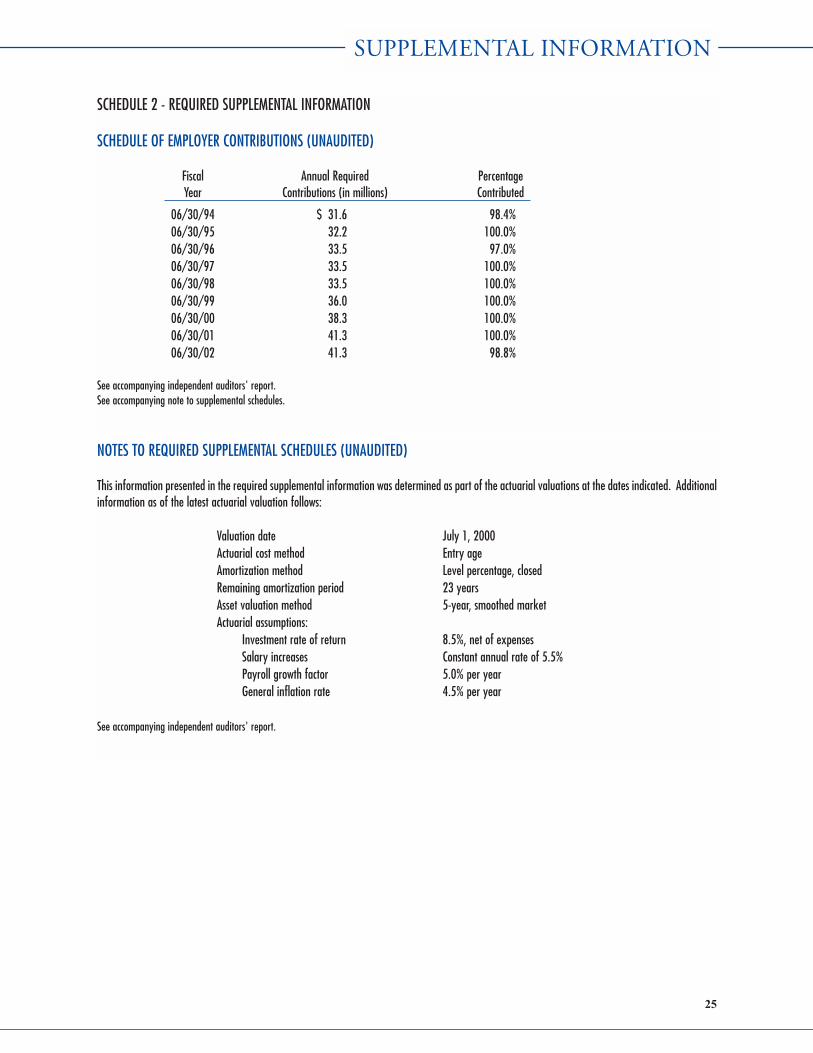
NOTES TO REQUIRED SUPPLEMENTAL SCHEDULES (UNAUDITED)
This information presented in the required supplemental information was determined as part of the actuarial valuations at the dates indicated. Additionalinformation as of the latest actuarial valuation follows:
Valuation date July 1, 2000Actuarial cost method Entry ageAmortization method Level percentage, closedRemaining amortization period 23 yearsAsset valuation method 5-year, smoothed marketActuarial assumptions:
Investment rate of return 8.5%, net of expensesSalary increases Constant annual rate of 5.5%Payroll growth factor 5.0% per yearGeneral inflation rate 4.5% per year
See accompanying independent auditors' report.
SUPPLEMENTAL INFORMATION
SCHEDULE 2 - REQUIRED SUPPLEMENTAL INFORMATION
SCHEDULE OF EMPLOYER CONTRIBUTIONS (UNAUDITED)
Fiscal Annual Required PercentageYear Contributions (in millions) Contributed
06/30/94 $ 31.6 98.4%06/30/95 32.2 100.0%06/30/96 33.5 97.0%06/30/97 33.5 100.0%06/30/98 33.5 100.0%06/30/99 36.0 100.0%06/30/00 38.3 100.0%06/30/01 41.3 100.0%06/30/02 41.3 98.8%
See accompanying independent auditors' report.See accompanying note to supplemental schedules.

SCHEDULE 4
INVESTMENT SERVICES, PROFESSIONAL SERVICES, AND ADMINISTRATION EXPENSESYEARS ENDED JUNE 30, 2002 AND 2001
2002 2001Investment services:
Custodial services $ 190,593 152,082Money management services 5,383,535 5,994,935Consulting services 421,500 401,500
Total investment services $ 5,995,628 6,548,517
Professional services:Actuarial services 117,050 151,960Auditing and consulting services 54,299 47,031Legal services 224,192 124,904
Total professional services $ 395,541 323,895
Administration expenses:Office costs 419,951 310,878Insurance costs 109,340 28,147Costs of staff and benefits 2,417,370 1,712,195Costs of equipment and supplies 527,559 70,975Costs of education and research 188,212 244,998
Total administration expenses $ 3,662,432 2,367,193
See accompanying independent auditors' report.
26
SUPPLEMENTAL INFORMATION
SCHEDULE 3
INVESTMENT SUMMARY ($000) YEAR ENDED JUNE 30, 2002
June 30, 2001 June 30, 2002 Percent
Sales and of FairType of Investment Cost Fair Value Purchases Redemptions Cost Fair Value Value Fixed income:
U.S. government securities $ 93,740,808 94,302,910 507,118,074 478,470,099 122,388,783 121,859,607 9.48%Corporate bonds 174,778,718 153,189,183 42,853,812 94,185,406 123,447,124 110,302,312 8.58%
Total fixed income 268,519,526 247,492,093 549,971,886 572,655,505 245,835,907 232,161,919 18.06%
Capital stocks 523,248,401 532,684,311 696,714,423 763,027,073 456,935,751 442,135,030 34.39%Commingled funds 239,146,572 295,745,330 70,921,286 105,919,427 204,148,431 212,132,654 16.50%Limited partnerships, real estatetrusts and loans and mortgages 267,775,069 280,970,325 364,816,702 272,065,099 360,526,672 353,211,833 27.47%
Short-term investment funds 68,243,125 68,243,125 982,896,686 1,005,046,457 46,093,354 46,093,354 3.58%
Total investments $ 1,366,932,693 1,425,135,184 2,665,320,983 2,718,713,561 1,313,540,115 1,285,734,790 100.00%
Space and cost restrictions make it impractical to print the entire investment portfolio in this report. A portfolio listing is available for review at the System's office by appointment upon request.See accompanying independent auditors' report.
27
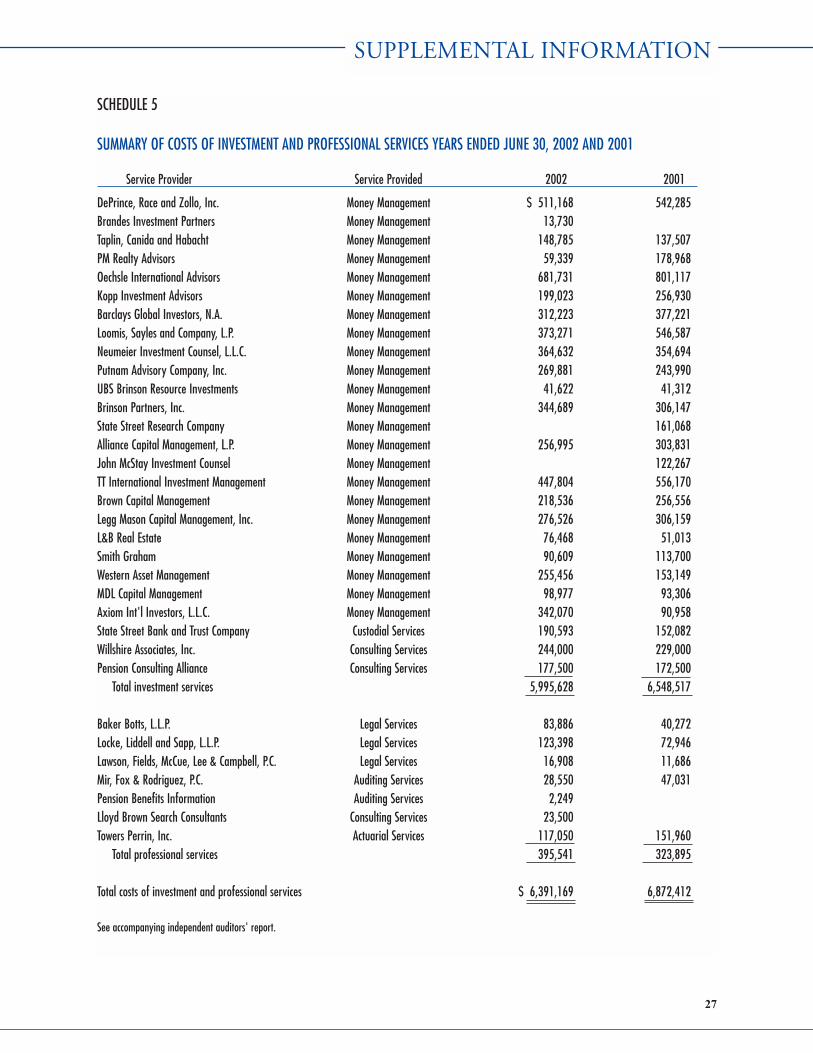
SCHEDULE 5
SUMMARY OF COSTS OF INVESTMENT AND PROFESSIONAL SERVICES YEARS ENDED JUNE 30, 2002 AND 2001
Service Provider Service Provided 2002 2001
DePrince, Race and Zollo, Inc. Money Management $ 511,168 542,285Brandes Investment Partners Money Management 13,730Taplin, Canida and Habacht Money Management 148,785 137,507PM Realty Advisors Money Management 59,339 178,968Oechsle International Advisors Money Management 681,731 801,117Kopp Investment Advisors Money Management 199,023 256,930Barclays Global Investors, N.A. Money Management 312,223 377,221Loomis, Sayles and Company, L.P. Money Management 373,271 546,587Neumeier Investment Counsel, L.L.C. Money Management 364,632 354,694Putnam Advisory Company, Inc. Money Management 269,881 243,990UBS Brinson Resource Investments Money Management 41,622 41,312Brinson Partners, Inc. Money Management 344,689 306,147State Street Research Company Money Management 161,068Alliance Capital Management, L.P. Money Management 256,995 303,831John McStay Investment Counsel Money Management 122,267TT International Investment Management Money Management 447,804 556,170Brown Capital Management Money Management 218,536 256,556Legg Mason Capital Management, Inc. Money Management 276,526 306,159L&B Real Estate Money Management 76,468 51,013Smith Graham Money Management 90,609 113,700Western Asset Management Money Management 255,456 153,149MDL Capital Management Money Management 98,977 93,306Axiom Int'l Investors, L.L.C. Money Management 342,070 90,958State Street Bank and Trust Company Custodial Services 190,593 152,082Willshire Associates, Inc. Consulting Services 244,000 229,000Pension Consulting Alliance Consulting Services 177,500 172,500
Total investment services 5,995,628 6,548,517
Baker Botts, L.L.P. Legal Services 83,886 40,272Locke, Liddell and Sapp, L.L.P. Legal Services 123,398 72,946Lawson, Fields, McCue, Lee & Campbell, P.C. Legal Services 16,908 11,686Mir, Fox & Rodriguez, P.C. Auditing Services 28,550 47,031Pension Benefits Information Auditing Services 2,249Lloyd Brown Search Consultants Consulting Services 23,500Towers Perrin, Inc. Actuarial Services 117,050 151,960
Total professional services 395,541 323,895
Total costs of investment and professional services $ 6,391,169 6,872,412
See accompanying independent auditors' report.
SUPPLEMENTAL INFORMATION


INVESTMENT SECTION
• DISCUSSION OF INVESTMENT POLICIES AND ACTIVITIES• SCHEDULE OF TOP INVESTMENTS
• INVESTMENT RETURNS FOR FIVE YEARS ENDED JUNE 30, 2002• PERFORMANCE BY FISCAL YEAR LAST TEN YEARS
• SUMMARY OF INVESTMENTS BY TYPE AS OF JUNE 30, 2002• SCHEDULE OF FEES AND COMMISSIONS

The Board of Trustees (the Board) of the HoustonMunicipal Employees Pension System (System) hasadopted a Statement of Investment Policies andObjectives (Statement) as a framework for the invest-ment of the System's assets. The authority to amend theStatement rests solely with the Board. The Board maydelegate to the Investment Committee (Committee) theauthority to act on certain matters relating to the System'sinvestments. The Committee is made up of the fullBoard of Trustees. The following provides an outline ofthe Statement.
GENERALThe Board recognizes the following investment responsi-bilities: a) to establish investment policy, guidelines andobjectives for the investment of System assets, b) to selectindependent investment managers to implement manage-ment strategies in conformity with stated investment poli-cies and guidelines, and c) to monitor investment activitiesand progress toward attaining investment objectives.
INVESTMENT POLICIESSTRATEGIC ASSET ALLOCATIONPOLICY AND MAINTENANCEThe Board periodically undertakes strategic studies toaddress the appropriateness of asset classes to be consid-ered for inclusion in the allocation plan, and to define thetargeted percentage to each asset class to achieve thedesired level of diversification. If market conditionscause one or more asset levels to move significantly out-side the targeted range for that class, the Board authoriz-es appropriate actions to re-balance toward desired diver-sification levels.
MANAGER STRUCTURE CONSIDERATIONSFor major asset classes (U.S. Equities, InternationalEquities, and Fixed Income), the Board diversifiesinvestments by engaging the services of professionalinvestment portfolio managers with demonstrated skillsand expertise in managing portfolios with characteristicscomparable to the desired asset class. The managersretained are expected to utilize varied investmentapproaches that, when combined, will exhibit character-istics that are similar to the asset class proxy utilized inthe strategic asset allocation plan. Cash inflows and out-flows are directed, within the targeted asset class, to thevarious managers so that actual characteristics of the port-folio will be consistent with the strategic plan. No invest-
ment manager is permitted to have more than 15% of thefair value of the fund's assets in a single investment style.
INVESTMENT MANAGER GUIDELINES AND EVALUATIONInvestment managers are subject to guidelines and objec-tives incorporated in the investment management agree-ment entered into by the Board and the respective invest-ment managers. Investment managers are expected toperform their fiduciary duties as prudent people skilledin such matters and, further, are expected to comply withall applicable State and Federal statutes governing theinvestment of retirement funds. Within the context of theguidelines, investment managers have full discretionwith respect to the purchase and sale of individual secu-rities and concentrations of similar securities. Portfoliosare to be managed in a manner similar to other portfolioswithin an organization with similar guidelines and per-formance objectives.
The Board requires that all investment managers seekbest execution for all trades ordered on behalf of theSystem. Domestic equity managers are encouraged todirect a designated percentage of their brokerage activityto an approved list of brokers. Domestic fixed incomemanagers are encouraged to direct primary trading activ-ity wherever there is an opportunity to recapture a por-tion of the syndication costs for the System.
MANAGER EVALUATIONManagers of portfolios are evaluated periodically againstpredetermined benchmarks such as an appropriate marketindex or a comparable peer group. All managers arerequired to make formal reports to the Board of their activ-ities and performance according to standards set forth inthe Statement. In addition, System personnel and profes-sional consultants engaged by the Board monitor, pursuantto instructions by the Board, managers' performance andconformity with their guidelines and objectives.
PERFORMANCE EVALUATIONThe Board reviews System investment performance on aperiodic basis to evaluate conformity to the goals andobjectives established in the strategic plan. The Boardrecognizes that financial markets from time to time maynot support attainment of those goals and objectives.During such times, progress toward conformity is evalu-ated by comparing performance to a percentage equal tothe weighted average of the performances of indexes andpeer groups comparable in class and weight to the stylesin the System's investment portfolio.
30
DISCUSSION OF INVESTMENT POLICIES AND ACTIVITIES

Investment results were calculated using a time-weight-ed rate of return based on the market rate of return, whichis not materially different from the AIMR PerformancePresentation Standards.
PROXY VOTINGThe Board authorizes each investment manager to voteall proxies relating to shares of securities under manage-ment, and requires each Investment Manager to providea written proxy voting policy statement. Each manageris expected to promptly vote all proxies and relatedactions in a manner consistent with the long-term inter-ests of the System and its participants and beneficiaries.Each investment manager is required to keep detailedrecords of all voting of proxies and related actions and tocomply with all related regulatory obligations. TheSystem's management staff periodically review eachinvestment manager's policies and actions in respect toproxy voting.
INVESTMENT ACTIVITIESDuring the period covered by this CAFR, investmentstrategies were employed that are long-term in perspec-tive and designed to work within predefined rangesamong asset classes to produce returns that, over marketcycles, will exceed the investment return assumptionadopted by the Board for actuarial purposes.Diversification provides safeguards against unanticipat-ed market disfavor of one or more asset classes. TheChief Investment Officer, Neal Wallach, has provided asummary in the table (see following page) of actualinvestment allocation among asset classes compared tothe targeted allocation.
To facilitate execution of the strategic investment plan,the System engages the services of a master custodianwhich utilizes a multi-currency reporting system thatreports investments at fair value stated in terms of thebase currency, the US dollar. Professional portfolio man-agers that specialize in a targeted asset class are engagedto perform investment activities within specified guide-lines. A nationally recognized institutional investmentconsulting firm is engaged to provide expert advice tothe System in matters pertaining to perceived marketconditions and prognosis, portfolio manager selection,and performance measurement and evaluation.
The schedules in this section of this CAFR display infor-mation that pertains to the System's investing activities.
Asset Class Target Actual
U.S. Equities 30.0 % 28.6 %
International Equities 20.0 19.2
Fixed Income 20.0 20.5
Real Assets 15.0 18.1
Alternative Investments 15.0 13.2
Cash 0 0.4
31
DISCUSSION OF INVESTMENT POLICIES AND ACTIVITIES
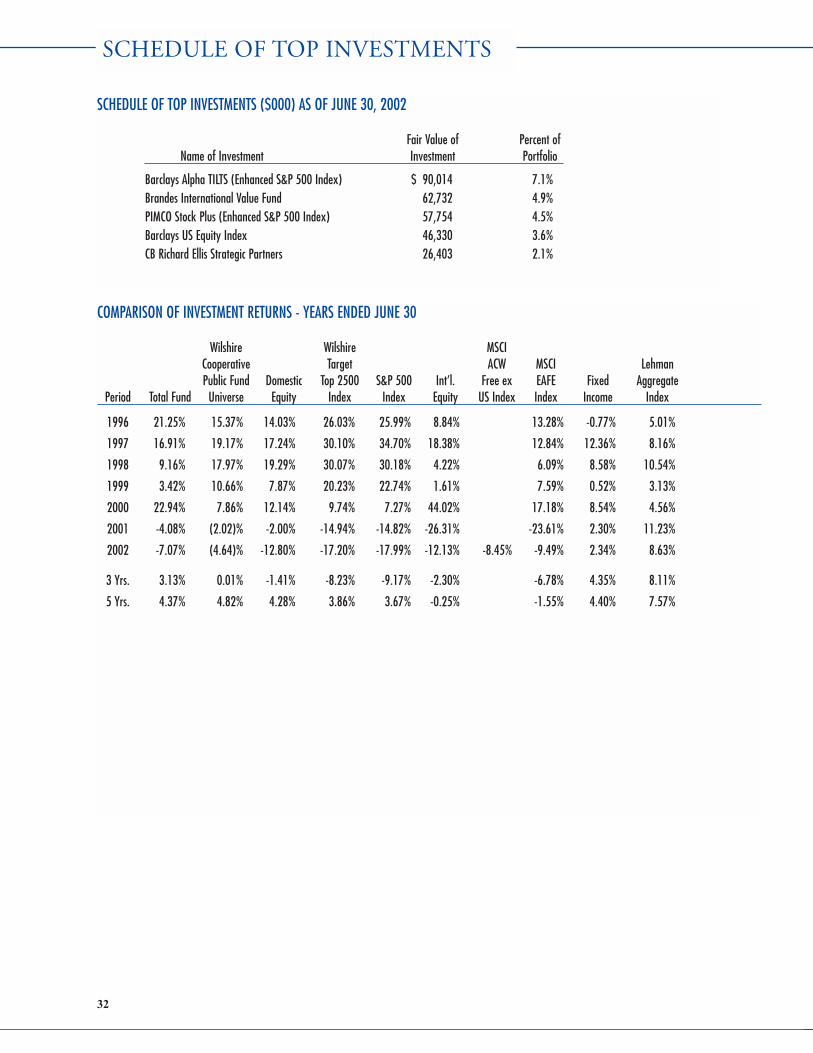
SCHEDULE OF TOP INVESTMENTS ($000) AS OF JUNE 30, 2002
Fair Value of Percent ofName of Investment Investment Portfolio
Barclays Alpha TILTS (Enhanced S&P 500 Index) $ 90,014 7.1%Brandes International Value Fund 62,732 4.9%PIMCO Stock Plus (Enhanced S&P 500 Index) 57,754 4.5%Barclays US Equity Index 46,330 3.6%CB Richard Ellis Strategic Partners 26,403 2.1%
COMPARISON OF INVESTMENT RETURNS - YEARS ENDED JUNE 30
Wilshire Wilshire MSCICooperative Target ACW MSCI LehmanPublic Fund Domestic Top 2500 S&P 500 Int’l. Free ex EAFE Fixed Aggregate
Period Total Fund Universe Equity Index Index Equity US Index Index Income Index
1996 21.25% 15.37% 14.03% 26.03% 25.99% 8.84% 13.28% -0.77% 5.01%
1997 16.91% 19.17% 17.24% 30.10% 34.70% 18.38% 12.84% 12.36% 8.16%
1998 9.16% 17.97% 19.29% 30.07% 30.18% 4.22% 6.09% 8.58% 10.54%
1999 3.42% 10.66% 7.87% 20.23% 22.74% 1.61% 7.59% 0.52% 3.13%
2000 22.94% 7.86% 12.14% 9.74% 7.27% 44.02% 17.18% 8.54% 4.56%
2001 -4.08% (2.02)% -2.00% -14.94% -14.82% -26.31% -23.61% 2.30% 11.23%
2002 -7.07% (4.64)% -12.80% -17.20% -17.99% -12.13% -8.45% -9.49% 2.34% 8.63%
3 Yrs. 3.13% 0.01% -1.41% -8.23% -9.17% -2.30% -6.78% 4.35% 8.11%
5 Yrs. 4.37% 4.82% 4.28% 3.86% 3.67% -0.25% -1.55% 4.40% 7.57%
32
SCHEDULE OF TOP INVESTMENTS
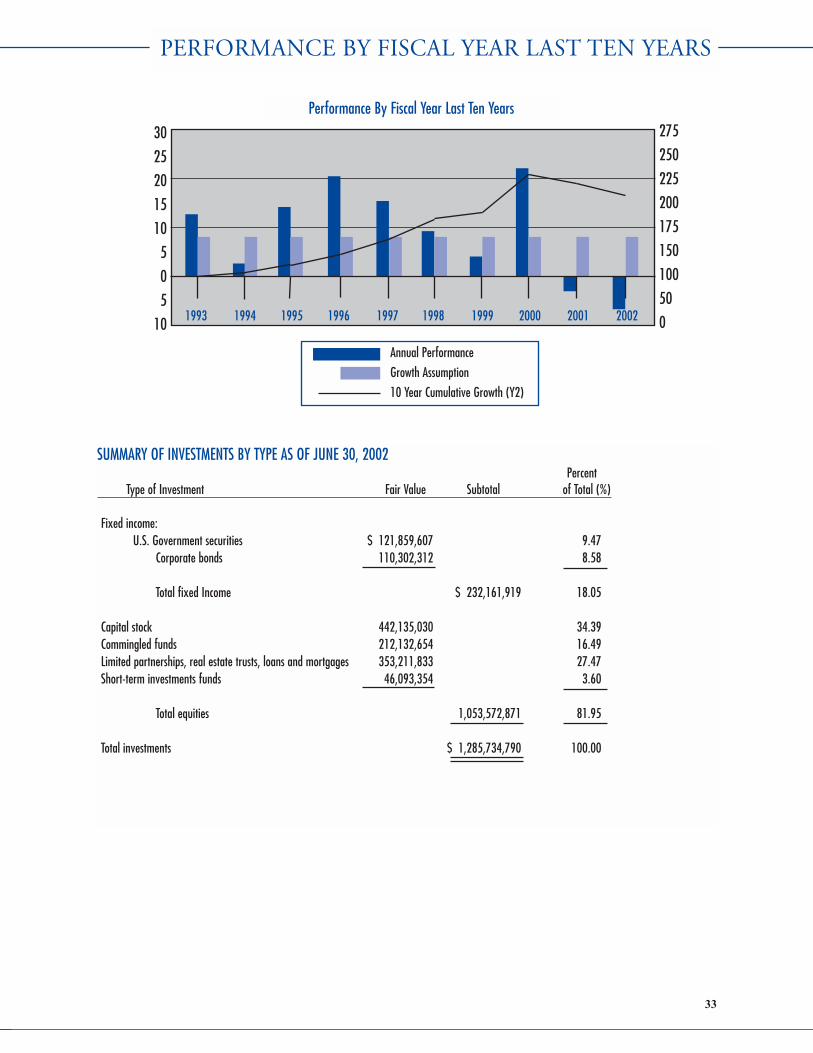
SUMMARY OF INVESTMENTS BY TYPE AS OF JUNE 30, 2002Percent
Type of Investment Fair Value Subtotal of Total (%)
Fixed income:U.S. Government securities $ 121,859,607 9.47
Corporate bonds 110,302,312 8.58
Total fixed Income $ 232,161,919 18.05
Capital stock 442,135,030 34.39Commingled funds 212,132,654 16.49Limited partnerships, real estate trusts, loans and mortgages 353,211,833 27.47Short-term investments funds 46,093,354 3.60
Total equities 1,053,572,871 81.95
Total investments $ 1,285,734,790 100.00
33
Performance By Fiscal Year Last Ten Years
30
25
20
15
10
5
0
5
10 1993 1994 1995 1996 1997 1998 1999 2000 2001 2002
Annual Performance
Growth Assumption
10 Year Cumulative Growth (Y2)
275
250
225
200
175
150
100
50
0
PERFORMANCE BY FISCAL YEAR LAST TEN YEARS

34
SCHEDULE OF FEES & COMMISSIONS PAID IN FISCAL YEAR 2002
Shares Commissions cents/share
UBS/Warburg/Paine Webber 7,475,270 $245,025 3.3 Merrill Lynch 10,577,169 $231,202 2.2 Lehman Bros 8,533,771 $198,327 2.3 Credit Suisse First Boston 13,433,007 $164,838 1.2 Capital Institutional Svcs (Gross Commission) 2,456,865 $130,401 5.3 Salomon Smith Barney 7,779,370 $125,673 1.6 Lynch Jones Ryan (Gross Commission) 3,547,396 $122,053 3.4 Morgan Stanley 5,466,127 $115,338 2.1 Goldman Sachs 6,964,576 $103,333 1.5 JP Morgan/Chase 7,146,432 $87,244 1.2 Deutsche Bank 6,549,943 $72,324 1.1 Cantor Fitzgerald 1,658,553 $71,899 4.3 HSBC / Capel James 4,193,004 $68,657 1.6 ABN Amro 3,568,487 $65,112 1.8 Dresdner Kleinwort Benson 2,342,196 $63,945 2.7 Morgan Grenfell 5,092,035 $61,604 1.2 Prudential Securities 1,047,287 $45,526 4.3 NBD Capital Markets 909,500 $34,570 3.8 Daiwa Securities 56,664,017 $33,809 0.1 Brockhouse & Cooper 1,710,095 $28,249 1.7 Nomura Securities 4,161,064 $27,508 0.7 SG Securities/SG Cowen 2,162,254 $25,706 1.2 Friedman Billings Ramsey 1,198,500 $25,420 2.1 Credit Lyonnais 2,113,650 $25,019 1.2 Bear Stearns 1,395,266 $23,182 1.7 Cazenove & Co 2,297,146 $21,255 0.9 Bank Julius Baer 268,966 $17,152 6.4 Carnegie 309,572 $17,082 5.5 Gerard Klauer Mattison 284,650 $16,100 5.7 Charles Schwab 438,150 $16,000 3.7 Indosuez/WI Carr Securities/Credit Agricole Indosuez 365,495 $14,657 4.0 ING Baring Securities 595,676 $14,323 2.4 BNP Paribas 344,057 $13,990 4.1 Auerbach Grayson 173,540 $12,520 7.2 Bank of America 486,371 $11,933 2.5 ABG Securities 289,392 $11,343 3.9 Paribas Quilter 192,486 $11,145 5.8 Bridge Trading 364,880 $10,907 3.0 Thomason Institutional 217,925 $10,896 5.0 Investec/Henderson Crossthwaite/Investment
Technology Group 745,852 $10,868 1.5 Pereire TOD Ltd 312,417 $10,410 3.3 Fox Pitt Kelton 690,613 $10,363 1.5 Macquarie Equities 1,164,173 $9,490 0.8 Jardine Fleming 12,360 $9,292 75.2 LG Securities 148,050 $9,058 6.1 West LB Panmure 184,025 $8,849 4.8 CIBC Oppenheimer/Woodgundy 197,950 $8,552 4.3
SCHEDULE OF FEES AND COMMISSIONS
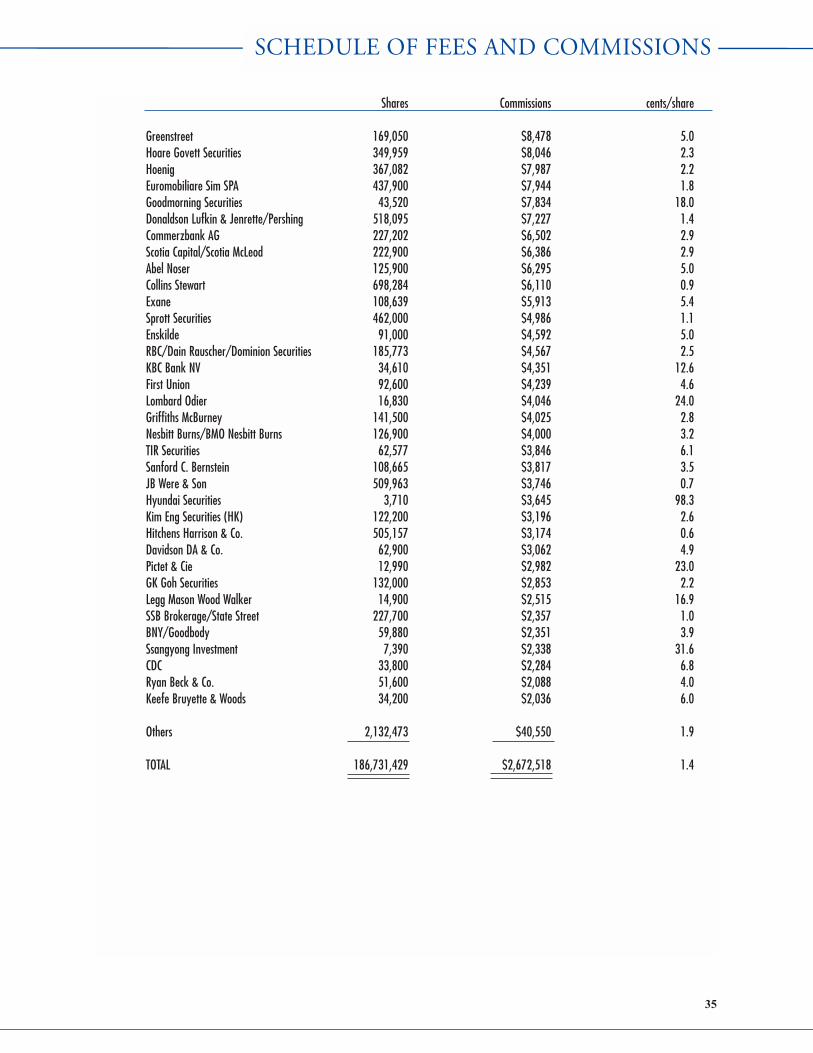
35
Shares Commissions cents/share
Greenstreet 169,050 $8,478 5.0 Hoare Govett Securities 349,959 $8,046 2.3 Hoenig 367,082 $7,987 2.2 Euromobiliare Sim SPA 437,900 $7,944 1.8 Goodmorning Securities 43,520 $7,834 18.0 Donaldson Lufkin & Jenrette/Pershing 518,095 $7,227 1.4 Commerzbank AG 227,202 $6,502 2.9 Scotia Capital/Scotia McLeod 222,900 $6,386 2.9 Abel Noser 125,900 $6,295 5.0 Collins Stewart 698,284 $6,110 0.9 Exane 108,639 $5,913 5.4 Sprott Securities 462,000 $4,986 1.1 Enskilde 91,000 $4,592 5.0 RBC/Dain Rauscher/Dominion Securities 185,773 $4,567 2.5 KBC Bank NV 34,610 $4,351 12.6 First Union 92,600 $4,239 4.6 Lombard Odier 16,830 $4,046 24.0 Griffiths McBurney 141,500 $4,025 2.8 Nesbitt Burns/BMO Nesbitt Burns 126,900 $4,000 3.2 TIR Securities 62,577 $3,846 6.1 Sanford C. Bernstein 108,665 $3,817 3.5 JB Were & Son 509,963 $3,746 0.7 Hyundai Securities 3,710 $3,645 98.3 Kim Eng Securities (HK) 122,200 $3,196 2.6 Hitchens Harrison & Co. 505,157 $3,174 0.6 Davidson DA & Co. 62,900 $3,062 4.9 Pictet & Cie 12,990 $2,982 23.0 GK Goh Securities 132,000 $2,853 2.2 Legg Mason Wood Walker 14,900 $2,515 16.9 SSB Brokerage/State Street 227,700 $2,357 1.0 BNY/Goodbody 59,880 $2,351 3.9 Ssangyong Investment 7,390 $2,338 31.6 CDC 33,800 $2,284 6.8 Ryan Beck & Co. 51,600 $2,088 4.0 Keefe Bruyette & Woods 34,200 $2,036 6.0
Others 2,132,473 $40,550 1.9
TOTAL 186,731,429 $2,672,518 1.4
SCHEDULE OF FEES AND COMMISSIONS

ACTUARIAL SECTION
• ACTUARY'S LETTER TO THE BOARD OF TRUSTEES• ACTUARIAL CERTIFICATION
• SUMMARY OF KEY RESULTS ($000)• ASSET INFORMATION
• FUNDING INFORMATION• CONTRIBUTION INFORMATION
• CASH FLOW PROJECTION• PARTICIPANT INFORMATION
• SUMMARY OF METHODS AND ASSUMPTIONS• CHANGES IN METHODS AND ASSUMPTIONS
SINCE THE PRIOR VALUATION• CHANGES IN PLAN PROVISIONS
SINCE THE PRIOR VALUATION

Towers PerrinOctober 24, 2000
Board of TrusteesHouston Municipal EmployeesPension System1111 Bagby, Suite 1450Houston, Texas 77002
Dear Board Members:
We certify that the information contained in this July 1, 2000 Actuarial Report for the Houston Municipal Employees Pension Systemhas been prepared in accordance with generally accepted actuarial principles and practices. To the best of our knowledge, the informa-tion is accurate and fairly presents the actuarial position of the System as of July 1, 2000.In preparing the actuarial results, we have relied upon information provided by the Board of Trustees regarding plan provisions, plan par-ticipants, plan assets and other matters. Historical information for the years prior to 1993 was prepared by the prior actuaries and wasnot subjected to our actuarial review.
Frequency of Actuarial Valuations
Actuarial valuations are prepared at least every three years. The last actuarial valuation was performed as of July 1, 1999.
Financing Objectives of the System
Contribution rates are established that, over time, will remain level as a percentage of payroll. The contribution rate has been determinedto provide for normal cost plus the level percentage of payroll required to amortize the unfunded actuarial accrued liability (or surplus)over 40 years from January 1, 1983.
Progress Toward Realization of Financing Objective
The summary of accrued and unfunded accrued liabilities on page 24 of this report illustrates the progress toward realization of thefinancing objective.
Disclosure of Pension Information
Effective for fiscal years beginning on or after July 1, 1996, the Board of Trustees has adopted compliance with the requirements ofGovernmental Accounting Standards Board (GASB) Statement No. 25. The information required to be disclosed by GASB No. 25 inthe notes to the System's financial statements is shown on pages 26 and 27 of this report.
Data
In preparing the July 1, 2000 actuarial valuation, we relied upon data provided by the Board. As part of this valuation, we tested the datafor reasonableness. We did not, however, subject this data to any auditing procedures.
Actuarial Methods and Assumptions
The actuarial methods and assumptions described on pages 47 through 49 of the report were selected by the Board of Trustees based uponour recommendation. The Board has sole authority to determine theactuarial assumptions. Changes in the actuarial methods and assump-tions since the prior valuation are described on page 49. In our opin-ion, the actuarial assumptions used are appropriate for the purposes ofthe valuation and, in the aggregate, are reasonably related to the expe-rience of the System and to reasonable expectations.
Plan Provisions
The plan provisions used in the actuarial valuation are described inthe Financial Section of this report. Changes in the plan provisionssince the prior valuation are described on page 49. We are available to answer any questions on the information con-tained in the report, or to provide any additional information youmay need.
Sincerely,
Alan S. Taper, F.S.A., M.A.A.A.Principal
Actuarial Certification
We certify that the information contained in this Actuarial Report has been prepared inaccordance with generally accepted actuarial principles and practices. To the best of ourknowledge, the information is accurate and fairly presents the actuarial position of thePension System as of July 1, 2000.
In preparing the actuarial results, we have relied upon information provided by theBoard of Trustees regarding plan provisions, plan participants, plan assets and othermatters. Historical information for years prior to 1993 was prepared by the prior actu-aries and was not subjected to our actuarial review.
The actuarial methods and assumptions used in this valuation were selected by the Boardof Trustees. The Board has sole authority to determine the actuarial assumptions. Inour opinion, the actuarial assumptions used are appropriate for purposes of the valua-tion and, in the aggregate, are reasonably related to the experience of the PensionSystem and to reasonable expectations.
Towers Perrin
Alan S. Taper, F.S.A., M.A.A.A.
38
ACTUARY�S LETTER TO THE BOARD OF TRUSTEES
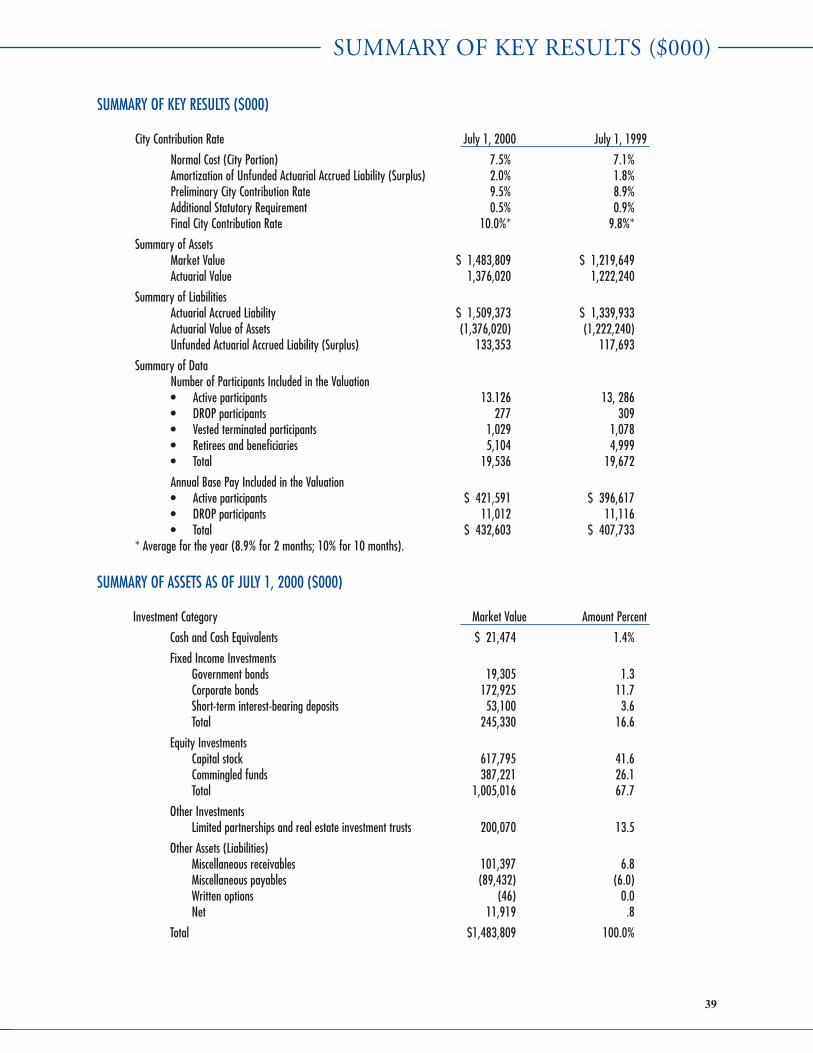
SUMMARY OF KEY RESULTS ($000)
City Contribution Rate July 1, 2000 July 1, 1999
Normal Cost (City Portion) 7.5% 7.1%Amortization of Unfunded Actuarial Accrued Liability (Surplus) 2.0% 1.8%Preliminary City Contribution Rate 9.5% 8.9%Additional Statutory Requirement 0.5% 0.9%Final City Contribution Rate 10.0%* 9.8%*
Summary of AssetsMarket Value $ 1,483,809 $ 1,219,649Actuarial Value 1,376,020 1,222,240
Summary of LiabilitiesActuarial Accrued Liability $ 1,509,373 $ 1,339,933Actuarial Value of Assets (1,376,020) (1,222,240)Unfunded Actuarial Accrued Liability (Surplus) 133,353 117,693
Summary of DataNumber of Participants Included in the Valuation• Active participants 13.126 13, 286• DROP participants 277 309• Vested terminated participants 1,029 1,078• Retirees and beneficiaries 5,104 4,999• Total 19,536 19,672
Annual Base Pay Included in the Valuation• Active participants $ 421,591 $ 396,617• DROP participants 11,012 11,116• Total $ 432,603 $ 407,733
* Average for the year (8.9% for 2 months; 10% for 10 months).
SUMMARY OF ASSETS AS OF JULY 1, 2000 ($000)
Investment Category Market Value Amount Percent
Cash and Cash Equivalents $ 21,474 1.4%
Fixed Income InvestmentsGovernment bonds 19,305 1.3Corporate bonds 172,925 11.7Short-term interest-bearing deposits 53,100 3.6Total 245,330 16.6
Equity InvestmentsCapital stock 617,795 41.6Commingled funds 387,221 26.1Total 1,005,016 67.7
Other InvestmentsLimited partnerships and real estate investment trusts 200,070 13.5
Other Assets (Liabilities)Miscellaneous receivables 101,397 6.8Miscellaneous payables (89,432) (6.0)Written options (46) 0.0Net 11,919 .8
Total $1,483,809 100.0%
39
SUMMARY OF KEY RESULTS ($000)
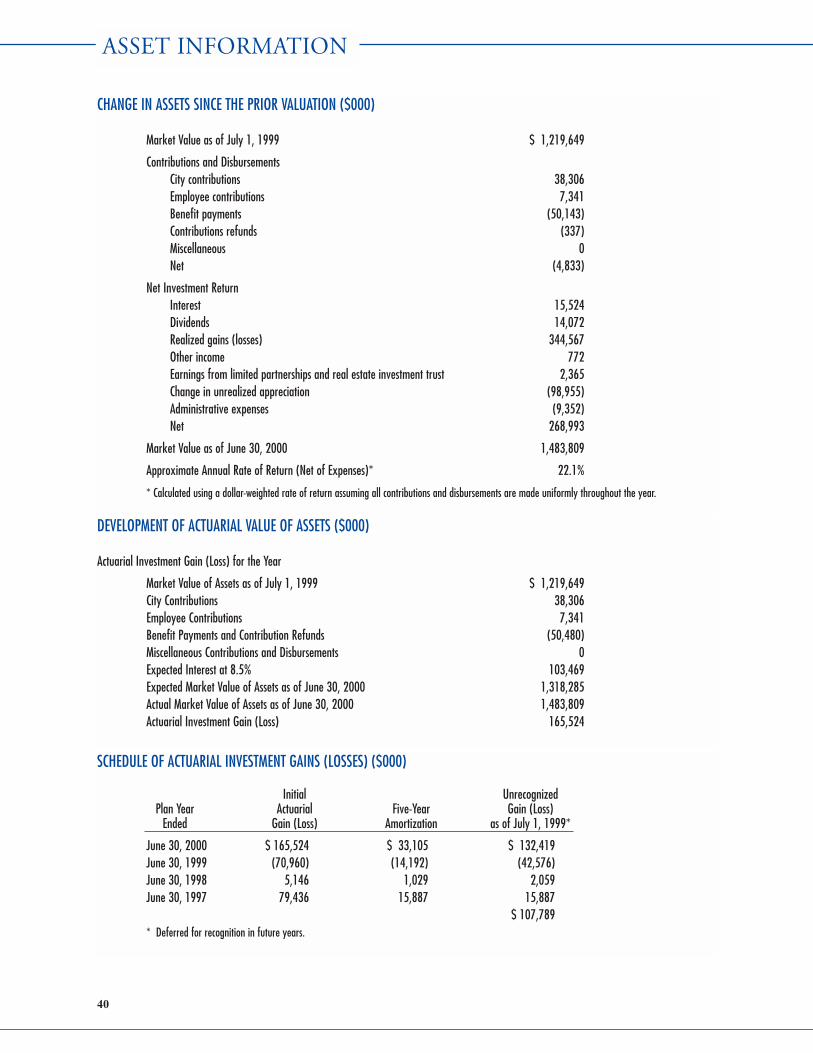
CHANGE IN ASSETS SINCE THE PRIOR VALUATION ($000)
Market Value as of July 1, 1999 $ 1,219,649
Contributions and DisbursementsCity contributions 38,306Employee contributions 7,341Benefit payments (50,143)Contributions refunds (337)Miscellaneous 0Net (4,833)
Net Investment ReturnInterest 15,524Dividends 14,072Realized gains (losses) 344,567Other income 772Earnings from limited partnerships and real estate investment trust 2,365Change in unrealized appreciation (98,955)Administrative expenses (9,352)Net 268,993
Market Value as of June 30, 2000 1,483,809
Approximate Annual Rate of Return (Net of Expenses)* 22.1%
* Calculated using a dollar-weighted rate of return assuming all contributions and disbursements are made uniformly throughout the year.
DEVELOPMENT OF ACTUARIAL VALUE OF ASSETS ($000)
Actuarial Investment Gain (Loss) for the Year
Market Value of Assets as of July 1, 1999 $ 1,219,649City Contributions 38,306Employee Contributions 7,341Benefit Payments and Contribution Refunds (50,480)Miscellaneous Contributions and Disbursements 0Expected Interest at 8.5% 103,469Expected Market Value of Assets as of June 30, 2000 1,318,285Actual Market Value of Assets as of June 30, 2000 1,483,809Actuarial Investment Gain (Loss) 165,524
SCHEDULE OF ACTUARIAL INVESTMENT GAINS (LOSSES) ($000)
Initial Unrecognized Plan Year Actuarial Five-Year Gain (Loss)
Ended Gain (Loss) Amortization as of July 1, 1999*
June 30, 2000 $ 165,524 $ 33,105 $ 132,419June 30, 1999 (70,960) (14,192) (42,576)June 30, 1998 5,146 1,029 2,059June 30, 1997 79,436 15,887 15,887
$ 107,789* Deferred for recognition in future years.
40
ASSET INFORMATION
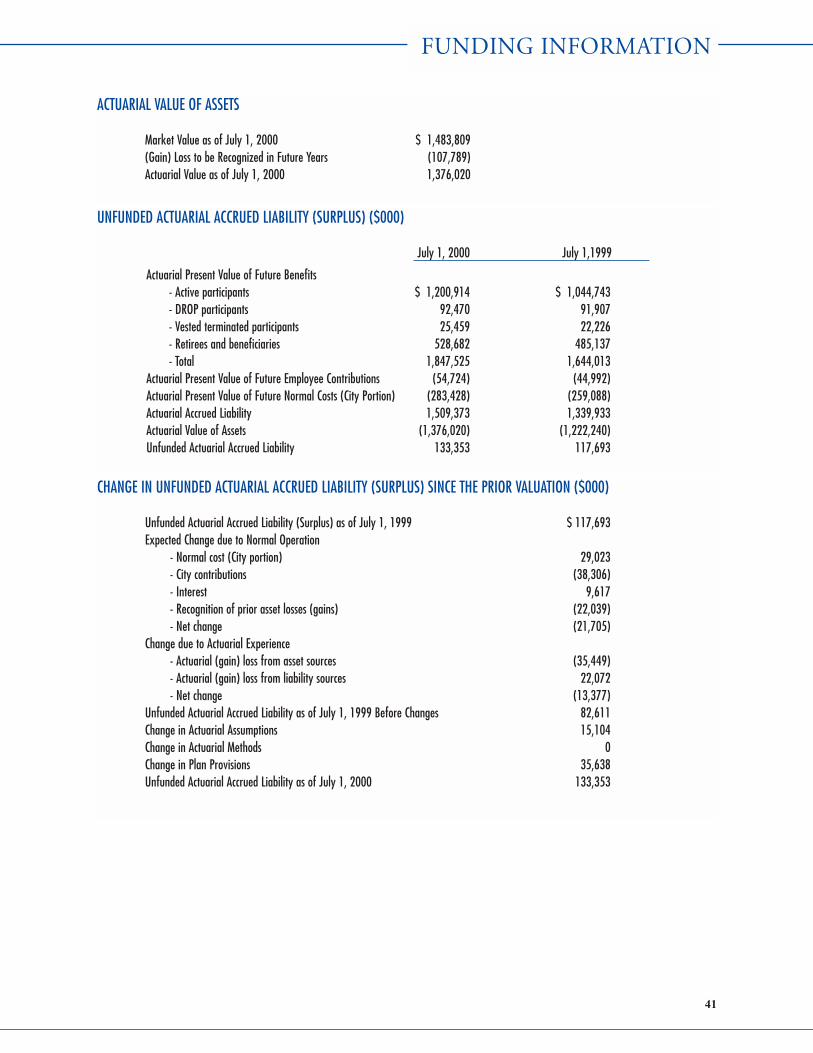
ACTUARIAL VALUE OF ASSETS
Market Value as of July 1, 2000 $ 1,483,809(Gain) Loss to be Recognized in Future Years (107,789)Actuarial Value as of July 1, 2000 1,376,020
UNFUNDED ACTUARIAL ACCRUED LIABILITY (SURPLUS) ($000)
July 1, 2000 July 1,1999
Actuarial Present Value of Future Benefits- Active participants $ 1,200,914 $ 1,044,743- DROP participants 92,470 91,907- Vested terminated participants 25,459 22,226- Retirees and beneficiaries 528,682 485,137- Total 1,847,525 1,644,013
Actuarial Present Value of Future Employee Contributions (54,724) (44,992)Actuarial Present Value of Future Normal Costs (City Portion) (283,428) (259,088)Actuarial Accrued Liability 1,509,373 1,339,933Actuarial Value of Assets (1,376,020) (1,222,240)Unfunded Actuarial Accrued Liability 133,353 117,693
CHANGE IN UNFUNDED ACTUARIAL ACCRUED LIABILITY (SURPLUS) SINCE THE PRIOR VALUATION ($000)
Unfunded Actuarial Accrued Liability (Surplus) as of July 1, 1999 $ 117,693Expected Change due to Normal Operation
- Normal cost (City portion) 29,023- City contributions (38,306)- Interest 9,617- Recognition of prior asset losses (gains) (22,039)- Net change (21,705)
Change due to Actuarial Experience- Actuarial (gain) loss from asset sources (35,449)- Actuarial (gain) loss from liability sources 22,072- Net change (13,377)
Unfunded Actuarial Accrued Liability as of July 1, 1999 Before Changes 82,611Change in Actuarial Assumptions 15,104Change in Actuarial Methods 0Change in Plan Provisions 35,638Unfunded Actuarial Accrued Liability as of July 1, 2000 133,353
41
FUNDING INFORMATION

HISTORICAL UNFUNDED ACTUARIAL ACCRUED LIABILITY ($000)
Actuarial Actuarial AVA UAALAccrued Value of as a as a Percentage
Valuation Liability Assets Percentage Unfunded Covered of CoveredDate (AAL) (AVA) of AAL AAL Payroll Payroll
July 1, 1990 $ 596,939 $ 557,820 93% $ 39,119 $ 258,556 15%July 1, 1991 688,322 558,144 81 130,178 284,914 46July 1, 1992 765,299 608,524 80 156,775 314,686 50July 1, 1993 840,321 660,637 79 179,684 340,249 53July 1, 1994 886,699 713,696 80 173,003 366,561 47July 1, 1995 963,712 770,189 80 193,523 378,511 51July 1, 1996 1,042,459 857,332 82 185,127 367,610 50July 1, 1998 1,240,141 1,095,617 88 144,524 397,698 36July 1, 1999 1,339,933 1,222,240 91 117,693 407,733 29July 1, 2000 1,509,373 1,376,020 91 133,353 432,604 31
HISTORICAL SOLVENCY TEST ($000)
Actuarial Accrued Liability for: Portion ofActuarial Accrued
Retirees, Beneficiaries, Active Actuarial Liability CoveredVested Terminated Participants Value of by Assets
Valuation Employee and DROP Participants (City-Financed AssetsDate Contributions Portion) (1) (2) (3)
(1) (2) (3)
July 1, 1990 $ 32,085 $ 281,518 $ 283,336 $ 557,820 100% 100% 86%July 1, 1991 32,606 289,174 366,542 558,144 100 100 64July 1, 1992 32,850 317,849 414,600 608,524 100 100 62July 1, 1993 32,866 369,561 437,894 660,637 100 100 59July 1, 1994 32,410 384,100 470,189 713,696 100 100 63July 1, 1995 31,130 420,830 511,752 770,189 100 100 62July 1, 1996 45,819 438,486 558,154 857,332 100 100 67July 1, 1998 34,781 502,335 703,025 1,095,617 100 100 79July 1, 1999 33,985 599,270 706,678 1,222,240 100 100 83July 1, 2000 38,292 646,611 824,470 1,376,020 100 100 84
CITY CONTRIBUTION RATE
July 1, 2000 July 1, 1999through through
June 30, 2001 June 30, 2000
City Normal Cost Rate 7.5% 7.1%Rate to Amortize Unfunded Actuarial Accrued
Liability Over 40 Years from January 1, 1983 2.0% 1.8%City Contribution Rate 9.5% 8.9%Additional Statutory Requirement .5% .9%Final City Contribution Rate 10.0% 9.8%*
*Average for the year (8.9% for 2 months; 10% for 10 months).
42
CONTRIBUTION INFORMATION
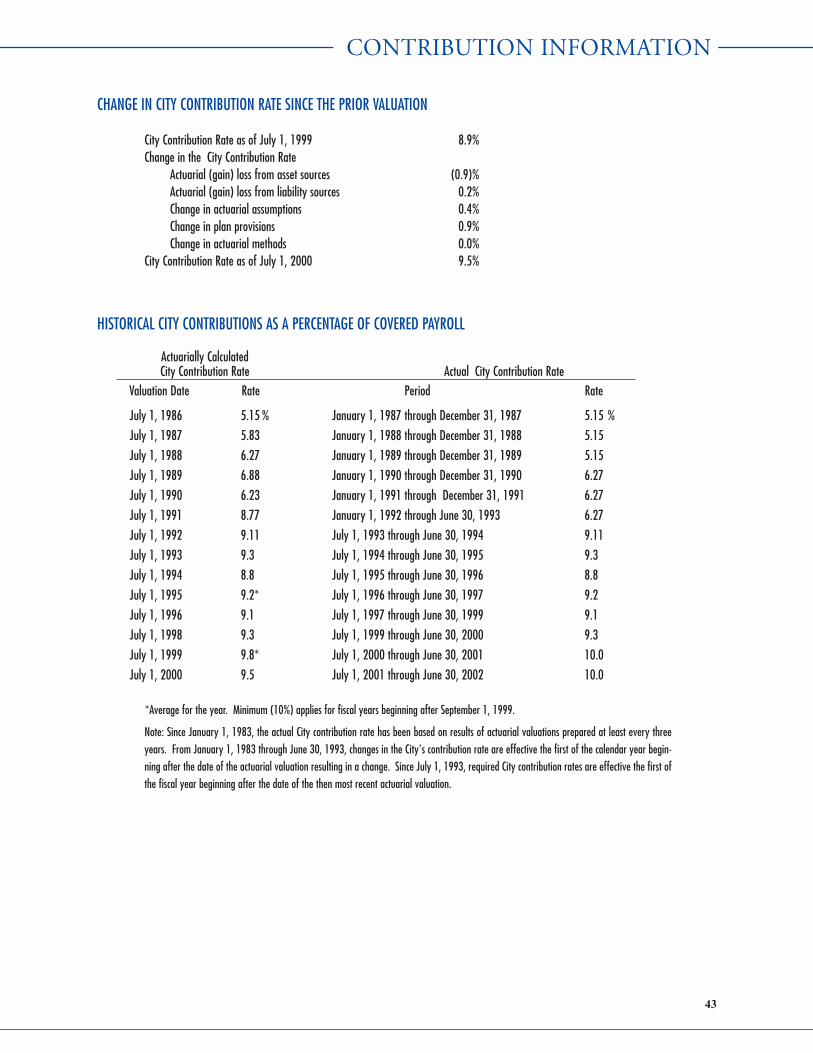
CHANGE IN CITY CONTRIBUTION RATE SINCE THE PRIOR VALUATION
City Contribution Rate as of July 1, 1999 8.9%Change in the City Contribution Rate
Actuarial (gain) loss from asset sources (0.9)%Actuarial (gain) loss from liability sources 0.2%Change in actuarial assumptions 0.4%Change in plan provisions 0.9%Change in actuarial methods 0.0%
City Contribution Rate as of July 1, 2000 9.5%
HISTORICAL CITY CONTRIBUTIONS AS A PERCENTAGE OF COVERED PAYROLL
Actuarially Calculated City Contribution Rate Actual City Contribution Rate
Valuation Date Rate Period Rate
July 1, 1986 5.15 % January 1, 1987 through December 31, 1987 5.15 %
July 1, 1987 5.83 January 1, 1988 through December 31, 1988 5.15
July 1, 1988 6.27 January 1, 1989 through December 31, 1989 5.15
July 1, 1989 6.88 January 1, 1990 through December 31, 1990 6.27
July 1, 1990 6.23 January 1, 1991 through December 31, 1991 6.27
July 1, 1991 8.77 January 1, 1992 through June 30, 1993 6.27
July 1, 1992 9.11 July 1, 1993 through June 30, 1994 9.11
July 1, 1993 9.3 July 1, 1994 through June 30, 1995 9.3
July 1, 1994 8.8 July 1, 1995 through June 30, 1996 8.8
July 1, 1995 9.2* July 1, 1996 through June 30, 1997 9.2
July 1, 1996 9.1 July 1, 1997 through June 30, 1999 9.1
July 1, 1998 9.3 July 1, 1999 through June 30, 2000 9.3
July 1, 1999 9.8* July 1, 2000 through June 30, 2001 10.0
July 1, 2000 9.5 July 1, 2001 through June 30, 2002 10.0
*Average for the year. Minimum (10%) applies for fiscal years beginning after September 1, 1999.
Note: Since January 1, 1983, the actual City contribution rate has been based on results of actuarial valuations prepared at least every threeyears. From January 1, 1983 through June 30, 1993, changes in the City's contribution rate are effective the first of the calendar year begin-ning after the date of the actuarial valuation resulting in a change. Since July 1, 1993, required City contribution rates are effective the first ofthe fiscal year beginning after the date of the then most recent actuarial valuation.
43
CONTRIBUTION INFORMATION

PROJECTION OF ESTIMATED ASSETS AND LIABILITIES ($000)
Year Annual City City Employee Benefit Net Cash Market Value UnfundedBeginning Covered Contributions Contribution Contributions Payments Flow of Assets at Actuarial
July1 Payroll Rate* Beginning Liability atof Year Beginning of Year
2000 432,604 43,260 10.0 6,595 52,030 (2,175) 1,483,809 133,353 2001 454,234 45,423 10.0 6,925 56,117 (3,769) 1,607,668 202,493 2002 476,945 55,803 11.7 7,271 67,848 (4,774) 1,740,394 238,347 2003 500,793 62,599 12.5 7,634 92,122 (21,889) 1,883,354 222,199 2004 525,832 64,677 12.3 8,016 78,158 (5,465) 2,020,639 187,267 2005 552,124 66,598 11.7 8,417 87,264 (12,249) 2,186,702 185,485 2006 579,730 67,828 11.7 8,838 92,541 (15,875) 2,357,730 186,118 2007 608,717 71,220 11.7 9,280 101,194 (20,694) 2,541,602 186,048 2008 639,152 74,781 11.7 9,744 111,312 (26,787) 2,736,081 185,177 2009 671,110 78,520 11.7 10,231 122,250 (33,499) 2,940,745 183,398 2010 704,666 82,446 11.7 10,742 134,355 (41,167) 3,155,814 180,591 2011 739,899 86,568 11.7 11,280 148,127 (50,279) 3,381,178 176,627 2012 776,894 90,897 11.7 11,843 162,049 (59,309) 3,616,206 171,359 2013 815,738 94,626 11.6 12,436 177,409 (70,347) 3,861,806 164,630 2014 856,525 99,357 11.6 13,057 193,860 (81,446) 4,116,783 157,114 2015 899,352 104,325 11.6 13,710 210,236 (92,201) 4,381,873 147,883 2016 944,319 109,541 11.6 14,396 228,626 (104,689) 4,658,292 136,739 2017 991,535 115,018 11.6 15,116 246,504 (116,370) 4,945,199 123,462 2018 1,041,112 120,769 11.6 15,871 264,932 (128,292) 5,244,326 107,811 2019 1,093,168 126,807 11.6 16,665 284,149 (140,677) 5,556,461 89,522
* Based on actuarially determined rate from the prior year's valuation.
44
CONTRIBUTION INFORMATION
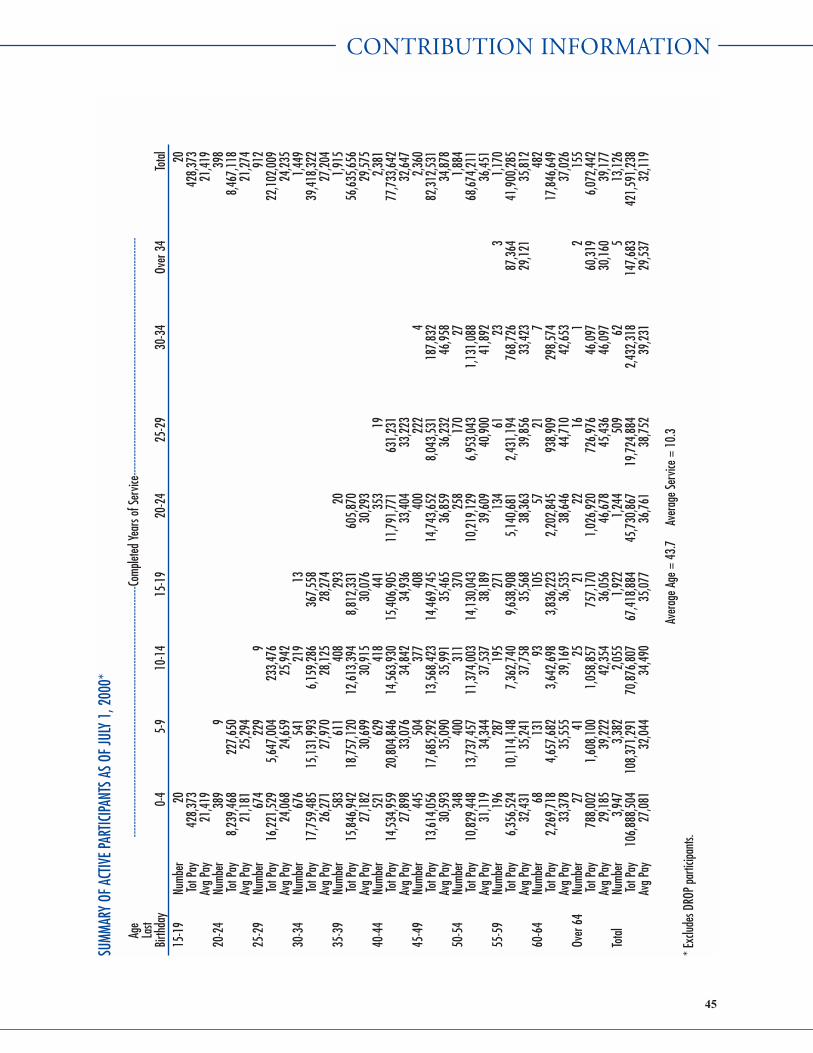
SUMM
ARY
OF A
CTIV
E PAR
TICIPA
NTS A
S OF J
ULY
1, 2
000*
Age
------
------
------
------
------
------
------
------
------
------
------
------
------
Comp
leted
Year
s of S
ervic
e----
------
------
------
------
------
------
------
------
------
------
------
----
Last
Birth
day
0-4
5-9
10-1
415
-19
20-2
425
-29
30-3
4Ov
er 3
4To
tal
15-1
9Nu
mber
2020
Tot P
ay42
8,37
342
8,37
3Av
g Pa
y21
,419
21,4
1920
-24
Numb
er38
99
398
Tot P
ay8,
239,
468
227,
650
8,46
7,11
8Av
g Pa
y21
,181
25,2
9421
,274
25-2
9Nu
mber
674
229
991
2To
t Pay
16,2
21,5
295,
647,
004
233,
476
22,1
02,0
09Av
g Pa
y24
,068
24,6
5925
,942
24,2
3530
-34
Numb
er67
654
121
913
1,44
9To
t Pay
17,7
59,4
8515
,131
,993
6,15
9,28
636
7,55
839
,418
,322
Avg
Pay
26,2
7127
,970
28,1
2528
,274
27,2
0435
-39
Nu
mber
583
611
408
293
201,
915
Tot P
ay15
,846
,942
18,7
57,1
2012
,613
,394
8,81
2,33
160
5,87
056
,635
,656
Avg
Pay
27,1
8230
,699
30,9
1530
,076
30,2
9329
,575
40-4
4
Numb
er52
162
941
844
135
319
2,38
1To
t Pay
14,5
34,9
5920
,804
,846
14,5
63,9
3015
,406
,905
11,7
91,7
7163
1,23
177
,733
,642
Avg
Pay
27,8
9833
,076
34,8
4234
,936
33,4
0433
,223
32,6
4745
-49
Numb
er44
550
437
740
840
022
24
2,36
0To
t Pay
13,6
14,0
5617
,685
,292
13,5
68,4
2314
,469
,745
14,7
43,6
528,
043,
531
187,
832
82,3
12,5
31Av
g Pa
y30
,593
35,0
9035
,991
35,4
6536
,859
36,2
3246
,958
34,8
7850
-54
Numb
er34
840
031
137
025
817
027
1,88
4To
t Pay
10,8
29,4
4813
,737
,457
11,3
74,0
0314
,130
,043
10,2
19,1
296,
953,
043
1,13
1,08
868
,674
,211
Avg
Pay
31,1
1934
,344
37,5
3738
,189
39,6
0940
,900
41,8
9236
,451
55-5
9Nu
mber
196
287
195
271
134
6123
31,
170
Tot P
ay6,
356,
524
10,1
14,1
487,
362,
740
9,63
8,90
85,
140,
681
2,43
1,19
476
8,72
687
,364
41,9
00,2
85Av
g Pa
y32
,431
35,2
4137
,758
35,5
6838
,363
39,8
5633
,423
29,1
2135
,812
60-6
4Nu
mber
6813
193
105
5721
748
2To
t Pay
2,26
9,71
84,
657,
682
3,64
2,69
83,
836,
223
2,20
2,84
593
8,90
929
8,57
417
,846
,649
Avg
Pay
33,3
7835
,555
39,1
6936
,535
38,6
4644
,710
42,6
5337
,026
Over
64
Numb
er27
4125
2122
161
215
5To
t Pay
788,
002
1,60
8,10
01,
058,
857
757,
170
1,02
6,92
072
6,97
646
,097
60,3
196,
072,
442
Avg
Pay
29,1
8539
,222
42,3
5436
,056
46,6
7845
,436
46,0
9730
,160
39,1
77To
tal
Numb
er3,
947
3,38
22,
055
1,92
21,
244
509
625
13,1
26To
t Pay
106,
888,
504
108,
371,
291
70,8
76,8
0767
,418
,884
45,7
30,8
6719
,724
,884
2,43
2,31
814
7,68
342
1,59
1,23
8Av
g Pa
y27
,081
32,0
4434
,490
35,0
7736
,761
38,7
5239
,231
29,5
3732
,119
Aver
age A
ge =
43.
7
Ave
rage
Serv
ice =
10.
3* E
xclud
es D
ROP
parti
cipan
ts.
45
CONTRIBUTION INFORMATION

HISTORICAL ACTIVE PARTICIPANT DATAAnnual
PercentageAnnual Average Increase In
Valuation Number of Average Payroll Annual AverageData Participants Age ($000) Salary Salary
January 1, 1980 10,617 N/A $ 137,400 $ 12,752 --January 1, 1982 12,338 N/A 207,100 16,906 15.1%
July 1, 1984 12,407 N/A 227,000 18,429 3.5July 1, 1986 11,459 N/A 234,300 20,342 5.1July 1, 1987 12,149 N/A 239,500 19,832 (2.5)July 1, 1988 11,344 N/A 227,900 19,934 0.5July 1, 1989 11,356 N/A 235,400 20,771 4.2July 1, 1990 12,037 40.0 258,556 21,480 3.4July 1, 1991 12,488 40.3 284,914 22,815 6.2July 1, 1992 12,913 40.5 314,686 24,370 6.8July 1, 1993 13,112 40.9 340,249 25,949 6.5July 1, 1994 14,027 40.9 366,561 26,133 0.7July 1, 1995 14,364 41.3 378,511 26,351 0.8July 1, 1996 14,067 41.8 367,610 26,133 (0.8)July 1, 1998* 13,764 42.8 394,919 28,692 9.8July 1, 1999* 13,286 42.9 396,617 29,852 4.0July 1, 2000* 13,126 43.7 421,591 32,119 7.6
* Excludes DROP participants.
SUMMARY OF INACTIVE PARTICIPANTS AS OF JULY 1, 2000Annual AverageBenefits Annual
Number ($000) Benefit
DROP Participants* 277 $ 5,823 $ 21,023Retirees 3,241 39,664 12,238
Beneficiaries 1,346 6,816 5,064Disabled Participants 517 3,490 6,750
Deferred Vested 1,029 5,114 4,970Total 6,410 60,907 9,502
* Annual payroll for DROP participants is $11,012,287.
RETIREES, BENEFICIARIES AND DISABLED PARTICIPANTS ADDED TO AND REMOVED FROM ROLLS
Rolls at the EndAdded to Rolls Removed from Rolls of the Year
Annual Annual AveragePeriod Benefits Benefits Annual AnnualEnded Number ($000) Number ($000) Number Benefits Benefits
June 30, 1993 473 $ 3,714 309 $ 1,534 4,189 $ 32,419 $ 7,739June 30, 1994 306 2,474 227 1,593 4,268 33,971 7,959June 30, 1995 393 3,044 220 1,307 4,441 36,482 8,215June 30, 1996 416 3,119 239 1,438 4,618 38,815 8,405June 30, 1998 693 5,840 441 3,212 4,870 43,394 8,910June 30, 1999 432 2,131 303 1,515 4,999 46,732 9,348June 30, 2000 360 3,412 255 1,380 5,104 49,970 9,755
46
PARTICIPANT INFORMATION
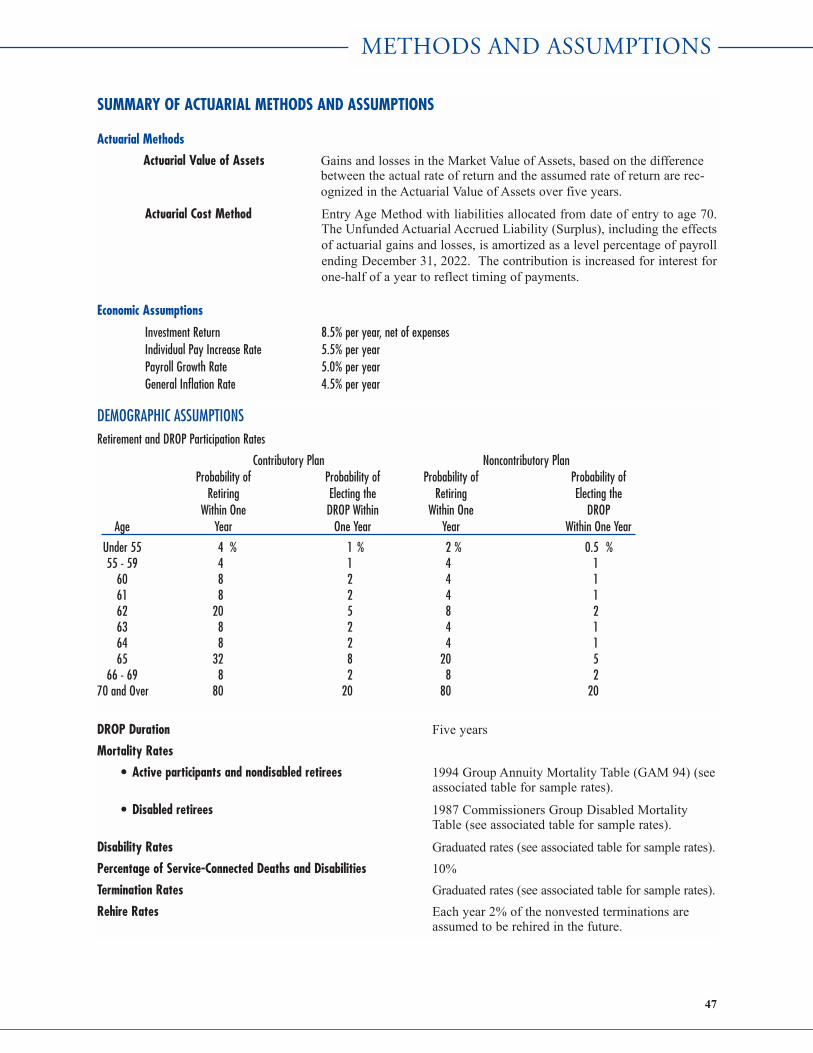
SUMMARY OF ACTUARIAL METHODS AND ASSUMPTIONS
Actuarial Methods
Actuarial Value of Assets Gains and losses in the Market Value of Assets, based on the differencebetween the actual rate of return and the assumed rate of return are rec-ognized in the Actuarial Value of Assets over five years.
Actuarial Cost Method Entry Age Method with liabilities allocated from date of entry to age 70.The Unfunded Actuarial Accrued Liability (Surplus), including the effectsof actuarial gains and losses, is amortized as a level percentage of payrollending December 31, 2022. The contribution is increased for interest forone-half of a year to reflect timing of payments.
Economic Assumptions
Investment Return 8.5% per year, net of expensesIndividual Pay Increase Rate 5.5% per yearPayroll Growth Rate 5.0% per yearGeneral Inflation Rate 4.5% per year
DEMOGRAPHIC ASSUMPTIONSRetirement and DROP Participation Rates
Contributory Plan Noncontributory PlanProbability of Probability of Probability of Probability of
Retiring Electing the Retiring Electing theWithin One DROP Within Within One DROP
Age Year One Year Year Within One Year
Under 55 4 % 1 % 2 % 0.5 %55 - 59 4 1 4 1
60 8 2 4 161 8 2 4 162 20 5 8 263 8 2 4 164 8 2 4 165 32 8 20 5
66 - 69 8 2 8 270 and Over 80 20 80 20
DROP Duration Five yearsMortality Rates
• Active participants and nondisabled retirees 1994 Group Annuity Mortality Table (GAM 94) (seeassociated table for sample rates).
• Disabled retirees 1987 Commissioners Group Disabled MortalityTable (see associated table for sample rates).
Disability Rates Graduated rates (see associated table for sample rates).Percentage of Service-Connected Deaths and Disabilities 10%Termination Rates Graduated rates (see associated table for sample rates).Rehire Rates Each year 2% of the nonvested terminations are
assumed to be rehired in the future.
47
METHODS AND ASSUMPTIONS

SUMMARY OF ACTUARIAL METHODS AND ASSUMPTIONS (CON’T)
Marital Status at Benefit Eligibility
• Percentage married 60%. (No beneficiaries other than the spouse assumed).
• Age difference Husbands assumed to be three years older than wives.
Valuation Payroll Pay reported by the City for the 12 months prior to the valuationdate projected with one year of assumed pay increases.
Missing Data Assumptions
Current Age:
• Active participants Contributory Plan - 45.9
Noncontributory Plan - 41.6
• Retirees and spouses 65
• Deferred vested participants 40
Service for Active Participants Contributory Plan - 14.2
Noncontributory Plan - 8.1
Pay Contributory Plan - $34,000
Noncontributory Plan - $28,700
Form of Payment:
Contributory Plan
• Retirees and spouses 75% joint and survivor annuity
• Deferred vested participants 50% joint and survivor annuity
Noncontributory Plan
• Retirees and spouses 75% joint and survivor annuity
• Deferred vested participants 50% joint and survivor annuity
48
METHODS AND ASSUMPTIONS
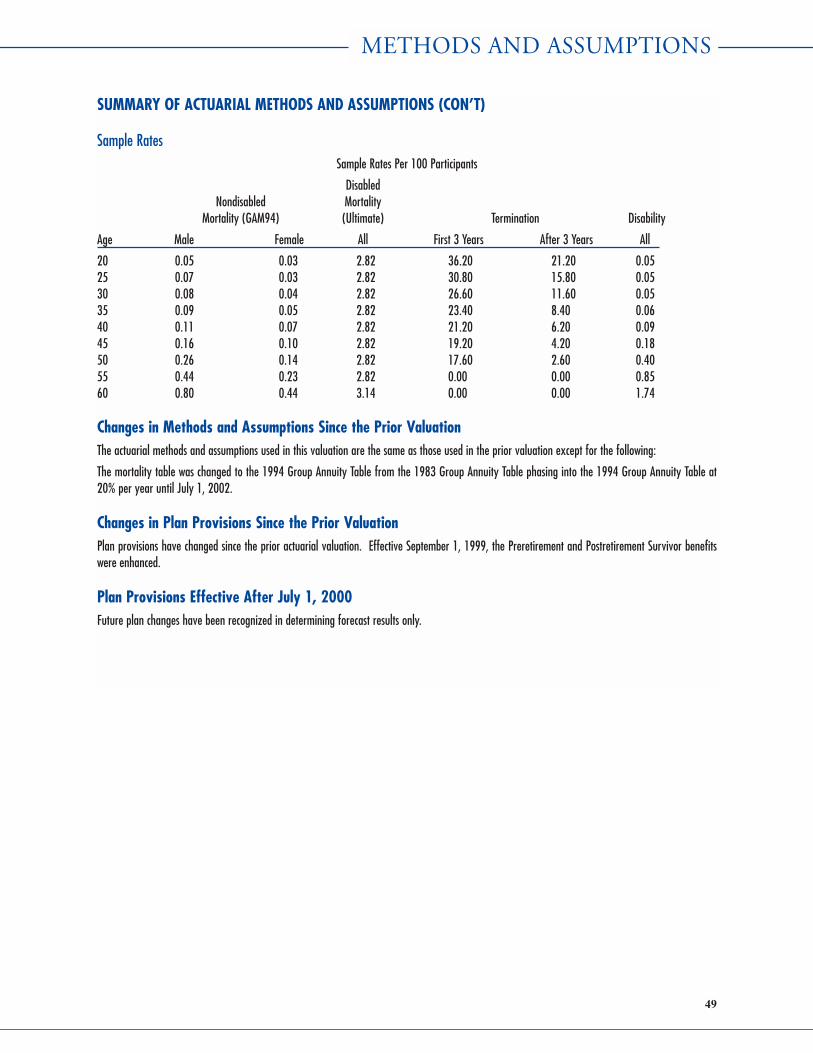
SUMMARY OF ACTUARIAL METHODS AND ASSUMPTIONS (CON’T)
Sample RatesSample Rates Per 100 Participants
DisabledNondisabled Mortality
Mortality (GAM94) (Ultimate) Termination Disability
Age Male Female All First 3 Years After 3 Years All
20 0.05 0.03 2.82 36.20 21.20 0.0525 0.07 0.03 2.82 30.80 15.80 0.0530 0.08 0.04 2.82 26.60 11.60 0.0535 0.09 0.05 2.82 23.40 8.40 0.0640 0.11 0.07 2.82 21.20 6.20 0.0945 0.16 0.10 2.82 19.20 4.20 0.1850 0.26 0.14 2.82 17.60 2.60 0.4055 0.44 0.23 2.82 0.00 0.00 0.8560 0.80 0.44 3.14 0.00 0.00 1.74
Changes in Methods and Assumptions Since the Prior ValuationThe actuarial methods and assumptions used in this valuation are the same as those used in the prior valuation except for the following:
The mortality table was changed to the 1994 Group Annuity Table from the 1983 Group Annuity Table phasing into the 1994 Group Annuity Table at20% per year until July 1, 2002.
Changes in Plan Provisions Since the Prior ValuationPlan provisions have changed since the prior actuarial valuation. Effective September 1, 1999, the Preretirement and Postretirement Survivor benefitswere enhanced.
Plan Provisions Effective After July 1, 2000Future plan changes have been recognized in determining forecast results only.
49
METHODS AND ASSUMPTIONS

STATISTICAL SECTION
• SCHEDULE OF AVERAGE BENEFIT PAYMENT AMOUNTS FOR THE SIX YEARS ENDED JUNE 30, 2000• SCHEDULE OF BENEFITS BY TYPE PAID
FOR THE SIX YEARS ENDED JUNE 30, 2000• SCHEDULE OF ANNUITANTS BY TYPE
• HISTORICAL ACTIVE PARTICIPANT DATA• SCHEDULE OF REVENUES BY SOURCE ($000)
FOR THE SIX YEARS ENDED JUNE 30, 2002• SCHEDULE OF EXPENSES BY TYPE ($000) FOR THE SIX YEARS ENDED JUNE 30, 2002
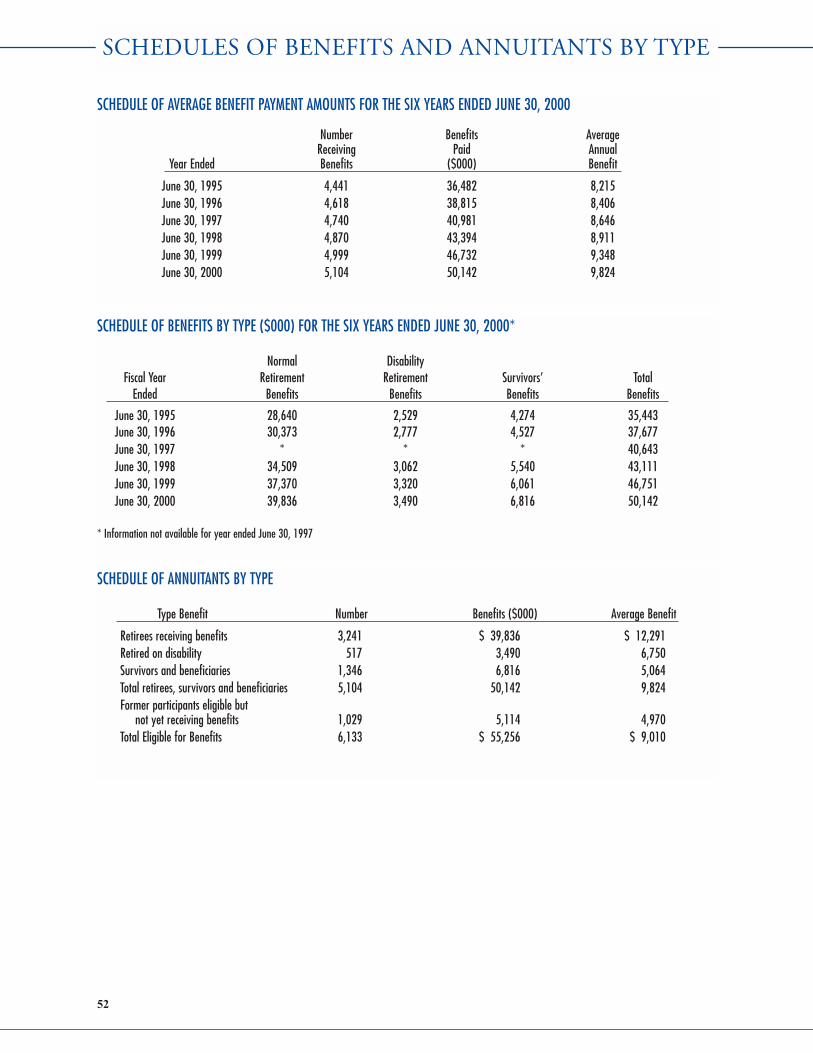
SCHEDULE OF AVERAGE BENEFIT PAYMENT AMOUNTS FOR THE SIX YEARS ENDED JUNE 30, 2000
Number Benefits AverageReceiving Paid Annual
Year Ended Benefits ($000) Benefit
June 30, 1995 4,441 36,482 8,215June 30, 1996 4,618 38,815 8,406June 30, 1997 4,740 40,981 8,646June 30, 1998 4,870 43,394 8,911June 30, 1999 4,999 46,732 9,348June 30, 2000 5,104 50,142 9,824
SCHEDULE OF BENEFITS BY TYPE ($000) FOR THE SIX YEARS ENDED JUNE 30, 2000*
Normal DisabilityFiscal Year Retirement Retirement Survivors’ Total
Ended Benefits Benefits Benefits Benefits
June 30, 1995 28,640 2,529 4,274 35,443June 30, 1996 30,373 2,777 4,527 37,677June 30, 1997 * * * 40,643June 30, 1998 34,509 3,062 5,540 43,111June 30, 1999 37,370 3,320 6,061 46,751June 30, 2000 39,836 3,490 6,816 50,142
* Information not available for year ended June 30, 1997
SCHEDULE OF ANNUITANTS BY TYPE
Type Benefit Number Benefits ($000) Average Benefit
Retirees receiving benefits 3,241 $ 39,836 $ 12,291Retired on disability 517 3,490 6,750Survivors and beneficiaries 1,346 6,816 5,064Total retirees, survivors and beneficiaries 5,104 50,142 9,824Former participants eligible but
not yet receiving benefits 1,029 5,114 4,970Total Eligible for Benefits 6,133 $ 55,256 $ 9,010
52
SCHEDULES OF BENEFITS AND ANNUITANTS BY TYPE
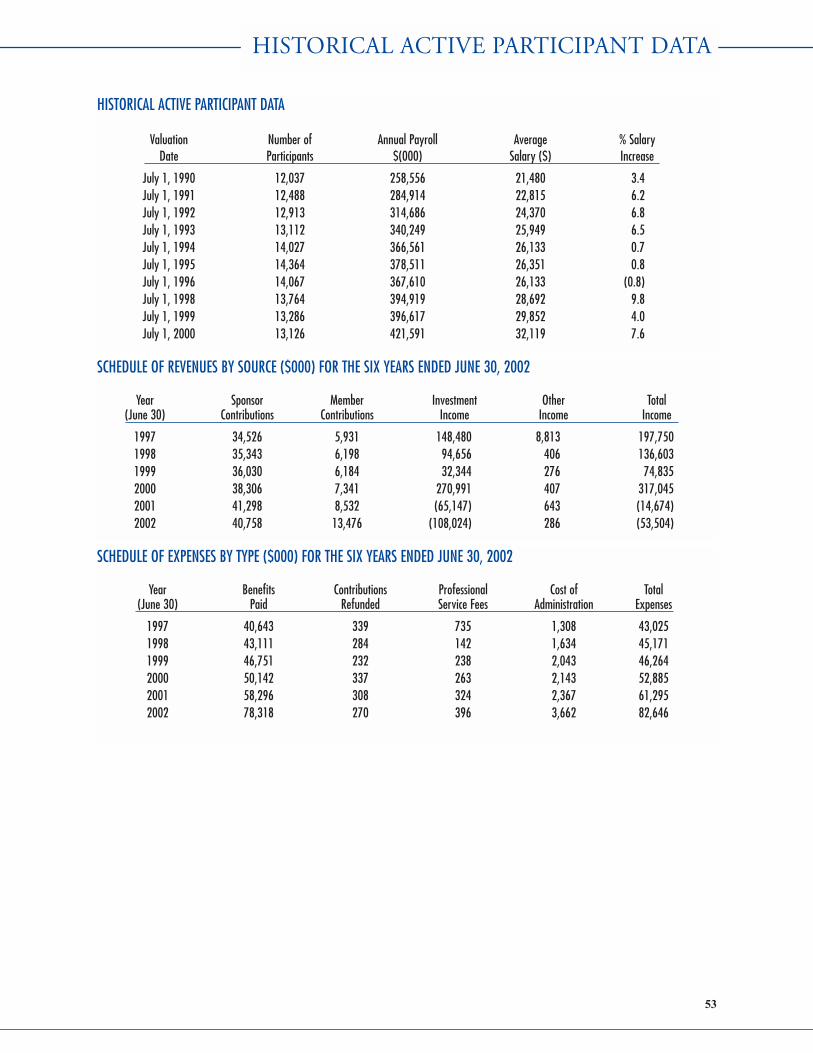
HISTORICAL ACTIVE PARTICIPANT DATA
Valuation Number of Annual Payroll Average % SalaryDate Participants $(000) Salary ($) Increase
July 1, 1990 12,037 258,556 21,480 3.4 July 1, 1991 12,488 284,914 22,815 6.2 July 1, 1992 12,913 314,686 24,370 6.8 July 1, 1993 13,112 340,249 25,949 6.5 July 1, 1994 14,027 366,561 26,133 0.7 July 1, 1995 14,364 378,511 26,351 0.8July 1, 1996 14,067 367,610 26,133 (0.8)July 1, 1998 13,764 394,919 28,692 9.8July 1, 1999 13,286 396,617 29,852 4.0July 1, 2000 13,126 421,591 32,119 7.6
SCHEDULE OF REVENUES BY SOURCE ($000) FOR THE SIX YEARS ENDED JUNE 30, 2002
Year Sponsor Member Investment Other Total(June 30) Contributions Contributions Income Income Income
1997 34,526 5,931 148,480 8,813 197,7501998 35,343 6,198 94,656 406 136,6031999 36,030 6,184 32,344 276 74,8352000 38,306 7,341 270,991 407 317,0452001 41,298 8,532 (65,147) 643 (14,674)2002 40,758 13,476 (108,024) 286 (53,504)
SCHEDULE OF EXPENSES BY TYPE ($000) FOR THE SIX YEARS ENDED JUNE 30, 2002
Year Benefits Contributions Professional Cost of Total(June 30) Paid Refunded Service Fees Administration Expenses
1997 40,643 339 735 1,308 43,0251998 43,111 284 142 1,634 45,1711999 46,751 232 238 2,043 46,2642000 50,142 337 263 2,143 52,8852001 58,296 308 324 2,367 61,2952002 78,318 270 396 3,662 82,646
53
HISTORICAL ACTIVE PARTICIPANT DATA