2013 annual report - ministry of health · 2019-09-26 · 6 municipal employees’ pension plan •...
TRANSCRIPT

2013
Municipal Employees’ Pension Plan
Annu
al R
epor
t


1Municipal Employees’ Pension Plan • Annual Report • 2013M
unicipal Employees’
Pension PlanExpenditures &
StatisticsStrategicInitiatives
RiskM
anagement
Investments
Managem
ent Report/A
ctuaries Opinion
FinancialStatem
entsFinancial
Highlights
Appendix
Letters of Transmittal 2
Chair’s Comments 3
Financial Highlights 4
Plan Profile 6
Municipal Employees’ Pension Commission 7
Commission Goals & Values
Education
Contracted Services
Plan Expenditures and Statistics 12
Strategic Initiatives 17
Customer-oriented Communications & Service
Maintain the Financial Integrity of the Plan
Plan Governance
Accountability
Risk Management 22
Investments 26
Trustees
Investment Policy
Investment Consultant
Custodia
Investment Objectives
Management’s Report 30
Actuaries’ Opinion 31
Financial Statements 33
Independent Auditor’s Report
Statement of Financial Position
Statement of Changes in Net Assets Available for Benefits
Statement of Changes in Pension Obligations and Provision
for Annuity Obligations
Notes to the Financial Statements
Appendix ‘A’ - Description of Market Indices 61
This annual report is available in electronic format at www.peba.gov.sk.ca
Table of contents

2 Municipal Employees’ Pension Plan • Annual Report • 2013
Her Honour, The Honourable Vaughn Solomon Schofield Lieutenant Governor of the Province of Saskatchewan
May it Please Your Honour:
I respectfully submit the Annual Report of the Municipal Employees’ Pension Plan for the year ending December 31, 2013.
Ken Krawetz Minister of Finance
The Honourable Ken Krawetz Minister of Finance
Sir:
On behalf of the Municipal Employees’ Pension Commission, I have the honour of submitting the Annual Report of the Municipal Employees’ Pension Plan for the year ending December 31, 2013.
Betty Moleski Chair
Ken KrawetzMinister of Finance

3Municipal Employees’ Pension Plan • Annual Report • 2013M
unicipal Employees’
Pension PlanExpenditures &
StatisticsStrategicInitiatives
RiskM
anagement
Investments
Managem
ent Report/A
ctuaries Opinion
FinancialStatem
entsFinancial
Highlights
Appendix
Betty MoleskiChair
As the new chair of the Municipal Employees’ Pension Plan, I would like to take this opportunity to thank the dedicated members of the 2013 Commission. I want to specifically recognize the leadership of outgoing chair, Bonnie Ozirny, for her support, leadership and continued insights and contributions.
After another year of thorough plan management, we continue to evaluate MEPP’s current and future challenges and work to find solutions. As a defined benefit plan, financial pressures will exist and flexible and realistic options must be explored to address matters such as Plan sustainability.
A changing pension environment framed our decisions this past fiscal year and ensured we set a sound strategic direction to move the Plan forward. As a result, the Commission continues to be committed to strong governance practices and attentiveness, which will lead into a thorough consultative process with our members in 2014. This process will ensure all members are aware of the long term vision, ongoing management and future sustainability of the Plan.
With an increasing demand for quality and timely services, the Commission has continued to improve MEPP’s capabilities and capacities to deliver pension services to members. We continue to offer an array of valuable retirement planning tools and workshops, which includes the ability to access
one-on-one meetings with our Retirement Information Consultants. In addition, we expanded communication offerings in 2013 and are focused on rebuilding our current website to offer modern and interactive communication channels that will be more beneficial to our members.
In 2014, the MEPP Commission will strive to again achieve our mission and key values through diligent plan monitoring. As we reach out during consultations this year, we will act in a transparent and balanced manner so our members can trust that plan management is conducted with the highest integrity.
On behalf of the MEPP Commission, I am pleased to present the Municipal Employees’ Pension Plan Annual Report for the year ended December 31, 2013.
Betty Moleski Chair

4 Municipal Employees’ Pension Plan • Annual Report • 2013
17.6
11.2
18.9
25.4 26.3
20.5 19.6
04 05 06 07 08 09 10 11 12 13
16.6
25.6
31.1
(as at December 31, 2013)
32.3 33.3 35.8 39.6 42.8 45.956.7
04 05 06 07 08 09 10 11 12 13
70.9 74.7
86.5
31.233.8
36.6 38.6 41.0 43.4 45.7
04 05 06 07 08 09 10 11 12 13
48.5 51.454.8
1,399
1,1481,258
1,3921,415
1,1511,285
04 05 06 07 08 09 10 11 12 13
1,3951,561
1,685
Transfers, Refunds & Termination Payments ($ millions)
1.68 bil l ion$
ToTal asseTs
2013 Financial highlights
$86.5 million NeT CoNTribuTioNs
$54.8 million ToTal PeNsioN Payroll
Total Assets ($ millions) Pension Payroll ($ millions)
Total Contributions & Transfers-In ($ millions)

5Municipal Employees’ Pension Plan • Annual Report • 2013M
unicipal Employees’
Pension PlanExpenditures &
StatisticsStrategicInitiatives
RiskM
anagement
Investments
Managem
ent Report/A
ctuaries Opinion
FinancialStatem
entsFinancial
Highlights
Appendix
Total MEPP Fund Investment Performance (%)
2013 2012 2011 2010 2009 2008 2007 2006 2005 2004
Total Fund Real Return 9.6 14.5 0.6 10.0 14.5 (16.2) 4.2 13.6 12.1 11.4
Benchmark 8.6 10.8 0.4 10.1 15.5 (17.7) 3.3 12.9 10.6 9.8
Rolling 4-year Average Returns (%)
Total Fund Real Return 7.8 9.8 1.5 2.4 3.2 2.7 10.3 13.0 8.9 6.5
Benchmark 7.6 9.4 0.1 1.9 2.7 1.7 9.3 12.0 6.9 3.4
Comparative Investment and Administration Costs ($ thousands)
2013 2012 2011 2010 2009 2008 2007 2006 2005 2004
Administrative Costs 4,997 4,894 4,922 4,048 3,654 3,162 2,822 2,540 2,328 2,051
Custodial fees 786 518 141 155 167 210 207 128 131 128
Investment fees 7,865 5,498 4,655 4,254 4,828 6,112 3,906 3,237 2,708 2,296
Totals 13,648 10,910 9,718 8,457 8,649 9,484 6,935 5,905 5,167 4,475
23.3 thousandPlaN members 4.8 thousand PeNsioNers
average age of aCTive members 47.1
M e m b e r s S e r v e d

6 Municipal Employees’ Pension Plan • Annual Report • 2013
The Municipal Employees’ Pension Plan (MEPP or the Plan) is a ‘defined benefit’ plan. Pensions are based on a formula that provides pension, disability, death and termination benefits for all eligible members. The formula is based on highest average salary, pensionable service and the accrual rate in effect during the years of service. Members contribute a fixed percentage of salary. Employers match these contributions.
The amount of pension a member will receive is not directly related to investment returns. An adequate level of contributions and positive investment returns are necessary to secure the Plan’s ability to pay benefits.
Under normal retirement rules, members may retire and receive a pension with no reduction if they are 65 years of age, or if their age and eligibility service equal at least 80 years. Members may retire and receive a reduced pension if they have reached age 55 and have at least 15 years of eligibility service.
Designated firefighters and police officers may receive an unreduced pension if their age and eligibility service equal at least 75, they are 55 years of age, or they have at least 25 years of eligibility service. These members may retire and receive a reduced pension if they have reached age 45 and their age and eligibility service equal at least 70.
MEPP’s history begins in the 1940s. Initially, the Rural Municipal Secretary Treasurer’s Superannuation Plan was established in 1941. In 1949, the Urban Employees’ Superannuation Plan was established. In 1959, these two plans joined to form the Municipal Employees’ Superannuation Plan, which became the current plan in 1973.
MEPP is registered under the Income Tax Act (Canada) and is governed by The Municipal Employees’ Pension Act and related regulations, and The Pension Benefits Act, 1992 and related regulations.
The Plan holds close to $1.7 billion in total assets. MEPP’s membership consists of more than 23,000 members; of which 4,800 are pensioners.
Your plan

7Municipal Employees’ Pension Plan • Annual Report • 2013M
unicipal Employees’
Pension PlanExpenditures &
StatisticsStrategicInitiatives
RiskM
anagement
Investments
Managem
ent Report/A
ctuaries Opinion
FinancialStatem
entsFinancial
Highlights
Appendix
The Municipal Employees’ Pension Commission (the Commission) administers MEPP. The Commission has the fiduciary responsibility for administering MEPP and managing the investment activities in the best interests of all MEPP members.
Our MissionTo oversee and direct the administration of the Plan and manage the assets in the best interests of members.
Our Goals• Provide customer-oriented communications and service:
The Commission is determined to ensure that all Plan stakeholders have access to pension services and information which meet their needs.
• Maintain the financial integrity of the Plan: The Commission is committed to achieving the needs of Plan members and employers through affordable, sustainable Plan benefits and services.
• Plan Governance: The Commission strives to demonstrate leading practices of pension plan governance.
• Accountability: Performance of the Plan and the Commission’s service providers is managed, measured and reported.
Our Values• Accountability: We are accountable to the members and the
stakeholders of MEPP for our administration of the Plan. We operate in a transparent manner.
• Professionalism: We strive for excellence in the administration of MEPP by being diligent and making informed decisions.
• Integrity: As trustees of the Municipal Employees’ Pension Fund, we hold ourselves to the highest standards of integrity. We strive to act always with honesty and in a manner worthy of the trust our members have placed in us.
• Fairness: We administer MEPP in the best interests of all members of the Plan. We strive to ensure that our decisions are equitable for all Plan members by adhering to decision making that is fair and open-minded. Our actions are courteous, considerate and responsive.
The commission

8 Municipal Employees’ Pension Plan • Annual Report • 2013
AttendanceThe Commission met nine times in 2013. Table 1.1 shows the number of meetings each Commission member attended.
The Commission has 10 members, five appointed on behalf of participating employers and five on behalf of employees. The full term of office for Commission members is four years. A member may be appointed for two full terms. Each year the Commission
members elect a Chair and a Vice-Chair. The Chair and Vice-Chair are elected for a one-year term. At December 31, 2013, the Commission was composed of the members listed below.
Bonnie Ozirny, ChairSaskatchewan School Boards Association
Betty Moleski, MemberTrade Unions representing employees who are members of the Plan
Rory Griffith, Vice-ChairThe Saskatchewan Association of School Business Officials
Ray Orb, MemberThe Saskatchewan Association of Rural Municipalities
Randy Goulden, MemberThe Saskatchewan Urban Municipalities Association
Brad Hvidston, MemberThe Urban Municipal Administrators’ Association of Saskatchewan
Beverly Crossman, MemberRegional Colleges/Regional Libraries
Wayne Steen, MemberSaskatchewan School Boards Association
Don McCallum, MemberThe Rural Municipal Administrators’ Association of Saskatchewan
Randy Hurd, MemberAssociations representing Designated Police Officers and Firefighters
Name Number of Meetings Attended Name Number of Meetings Attended
Bonnie Ozirny 9 Allan Johnson* 6
Rory Griffith 9 Earl Braun* 6
Randy Goulden 8 Orrin Redden* 6
Don McCallum 5 Brad Hvidston** 3
Betty Moleski 9 Beverly Crossman** 3
Ray Orb 4 Randy Hurd** 3
Wayne Steen 8Table 1.1
* These Commission members’ appointments ended August 31, 2013. They attended 100 per cent of meetings they were eligible to attend during their appointment.
** These Commission members’ appointments began September 1, 2013. They attended 100 per cent of meetings they were eligible to attend during their appointment.

9Municipal Employees’ Pension Plan • Annual Report • 2013M
unicipal Employees’
Pension PlanExpenditures &
StatisticsStrategicInitiatives
RiskM
anagement
Investments
Managem
ent Report/A
ctuaries Opinion
FinancialStatem
entsFinancial
Highlights
Appendix
The Commission has an education program for its members. The purpose of this program is to ensure the Commission members possess a sound knowledge and understanding of pension, investment and governance issues. The Commission budgets $5,000 per year for each Commission member for educational registration fees.
Upon appointment to the Commission, new members receive information outlining the documents that come before the Commission, the Municipal Employees’ Pension Plan member booklet, the Annual Report, information on the budget, funding policies, the Statement of Investment Policies and Procedures (SIP&P), the Strategic Business Plan and updates, the Risk Management plan and most recent review, as well as the meeting minutes for the past year.
Within three months of appointment, members will receive an orientation provided by the Public Employees Benefits Agency’s (PEBA) Executive Management.
Commission members have a formal education program that they are required to attend. The program provides a list of courses and seminars that deliver content specific to investment-related, funding-related and governance-related information:
• Within one year, members must attend education sessions on basic investment principles and on basic actuarial principles. Also, members are to attend the Queen’s Governance Program facilitated by Queen’s School of Business, Queen’s University.
• Within two years, members must complete the Board Effectiveness Program presented by the International Centre for Pension Management at the Rotman School of Management, University of Toronto.
Commission members who have completed the formal education program are required to attend one educational event annually that is facilitated by an industry-recognized pension and benefits organization. A Commission member who is actively pursuing the formal education program is exempt from the ongoing developmental requirements for members. However, all members are strongly encouraged to attend an educational event.
Conferences and other events attended by Commission members as part of their ongoing education provide the Commission with information on the current governance, investment and legal environment affecting pension plans. They also provide opportunities for Commission members to meet with pension experts and trustees from other plans to discuss common issues.
Table 1.2 lists the education events attended by Commission members to December 31, 2013.
educaTion

10 Municipal Employees’ Pension Plan • Annual Report • 2013
Education Events Attended by Commission Members in 2013
Commission Member Course
TotalRegistration
FeesTotal
HonorariumTotal Other Expenses Total
Betty Moleski Rotman Board Effectiveness Program $ 6,950.00 $ 1,750.00 $ 1,836.01 $10,536.01
Bonnie Ozirny British Columbia Public Sector Pensions and Benefits Conference
Canadian Pension and Benefits Institute Forum 2013
46th Annual Canadian Employee Benefits Conference
$ 1,925.00 $ 3,921.30 $ 6,070.98 $11,917.28
Brad Hvidston Queen’s Governance Program $ 4,100.00 $ 1,882.00 $ 1,366.50 $ 7,348.50
Don McCallum Investment Basics
Mercer School of Pension Investment Management$ 2,700.00 $ 1,677.50 $ 2,446.21 $ 6,823.71
Randy Goulden Investment Basics Complimentary $ 120.00 $ 195.36 $ 315.36
Ray Orb Rotman Board Effectiveness Program $ 6,950.00 $ 1,549.00 $ 1,862.47 $10,361.47
Rory Griffith Deloitte Transformational Transactions: the Board’s Role
Rotman Board Effectiveness Program$ 6,950.00 $ 1,750.00 $ 1,934.84 $10,634.84
Wayne Steen Investment Basics
Queen’s Governance Program$ 4,100.00 $ 1,805.40 $ 1,148.27 $ 7,053.67
Earl Braun British Columbia Public Sector Pensions and Benefits Conference
$ 500.00 $ 1,000.00 $ 1,361.04 $ 2,861.04
Totals $34,175.00 $15,455.20 $18,221.68 $67,851.88
Table 1.2

11Municipal Employees’ Pension Plan • Annual Report • 2013M
unicipal Employees’
Pension PlanExpenditures &
StatisticsStrategicInitiatives
RiskM
anagement
Investments
Managem
ent Report/A
ctuaries Opinion
FinancialStatem
entsFinancial
Highlights
Appendix
Contracted Services The Commission is ultimately responsible for the Plan’s administration, communication and investment activities. To discharge these responsibilities, the Commission uses the services of various organizations.
The Commission contracts with the PEBA to provide executive management and administrative services for the Plan. PEBA is part of the Ministry of Finance, Government of Saskatchewan, and administers a wide range of pension and benefits plans.
Under contract with the Commission, PEBA:
• maintains all member and accounting records;
• collects and deposits contributions to the Municipal Employees’ Pension Fund (the Fund);
• transfers contributions to the custodian of the Fund for investment;
• monitors, administers and assists in the execution of the Plan’s investment program in accordance with the investment policy;
• determines coverage and eligibility for benefits;
• calculates and pays all pension benefits;
• communicates with members and participating employers;
• recommends an actuary as an advisor to PEBA and the Commission, and retains an actuary selected on behalf of the Commission;
• recommends policy regarding calculating rates of interest and implements and calculates the rates of return for the plan; and
• prepares the annual report.
PEBA is responsible for ensuring that all transactions are made in accordance with The Municipal Employees’ Pension Act, The Pension Benefits Act, 1992, and their related regulations.
The Commission retains RBC Investor Services Trust as the Plan custodian, Aon Hewitt as the Plan actuary, and Mercer (Canada) Limited as the investment consultant. The Commission also retains the investment managers listed in Table 1.10 on page 27 of this report.
12 Municipal Employees’ Pension Plan • Annual Report • 2013
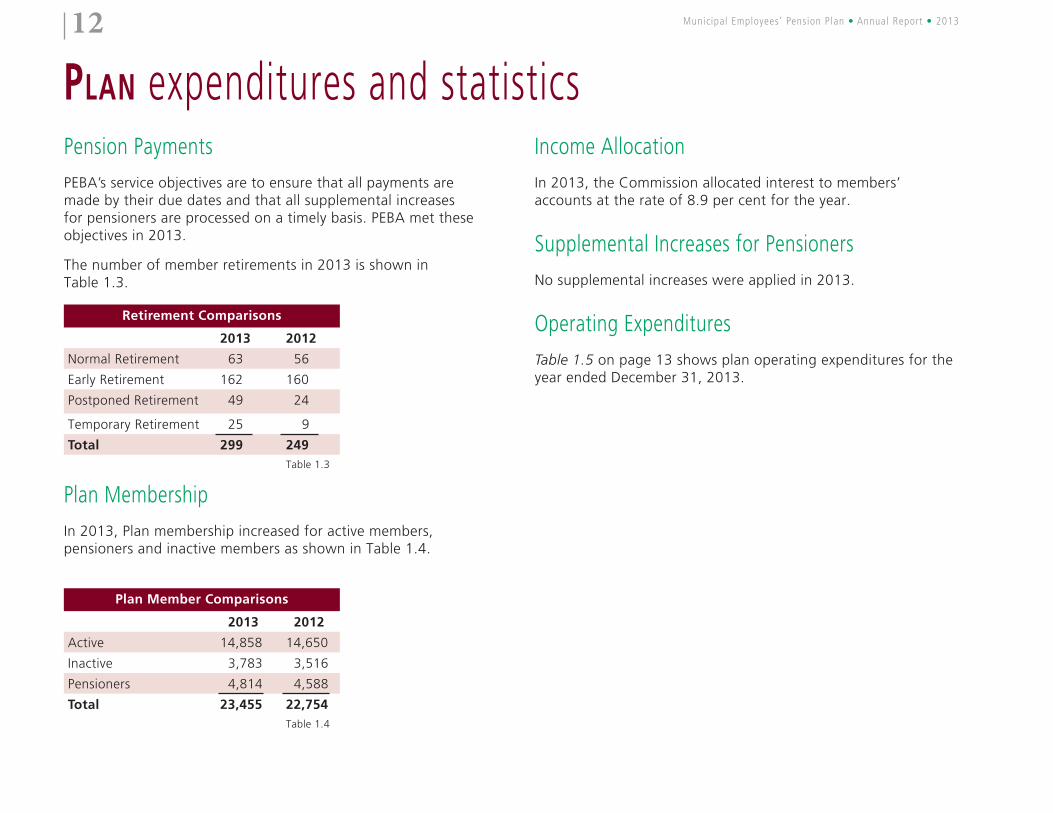
Pension PaymentsPEBA’s service objectives are to ensure that all payments are made by their due dates and that all supplemental increases for pensioners are processed on a timely basis. PEBA met these objectives in 2013.
The number of member retirements in 2013 is shown in Table 1.3.
Retirement Comparisons
2013 2012
Normal Retirement 63 56
Early Retirement 162 160
Postponed Retirement 49 24
Temporary Retirement 25 9
Total 299 249Table 1.3
Plan Membership In 2013, Plan membership increased for active members, pensioners and inactive members as shown in Table 1.4.
Plan Member Comparisons
2013 2012
Active 14,858 14,650
Inactive 3,783 3,516
Pensioners 4,814 4,588
Total 23,455 22,754Table 1.4
Income Allocation In 2013, the Commission allocated interest to members’ accounts at the rate of 8.9 per cent for the year.
Supplemental Increases for Pensioners No supplemental increases were applied in 2013.
Operating ExpendituresTable 1.5 on page 13 shows plan operating expenditures for the year ended December 31, 2013.
Plan expenditures and statistics

13Municipal Employees’ Pension Plan • Annual Report • 2013M
unicipal Employees’
Pension PlanExpenditures &
StatisticsStrategicInitiatives
RiskM
anagement
Investments
Managem
ent Report/A
ctuaries Opinion
FinancialStatem
entsFinancial
Highlights
Appendix
Expenses ($ thousands)Total Cost (%)
Administration costs / Investment consultant fees $4,997 36.61
Custodial fees 786 5.76
Investment management fees
Global Infrastructure Partners - C, LP 2,014 14.76
Greystone Managed Investments Inc. 425 3.11
Foyston, Gordon & Payne Inc. 436 3.20
Brandes Investment Partners, LP 510 3.73
BlackRock Asset Management Canada Ltd. 56 0.41
Snyder Capital Management, LP 637 4.67
Pareto Investment Management Ltd. 90 0.66
Steel River Infrastructure Fund North America, LP 1 0.01
TDAM Fixed Income Overlay 501 3.67
Canso Investment Domestic Portfolio 329 2.41
PIMCO Investments Global Shadow A/C 374 2.74
Wellington Management Global Shadow 265 1.94
GIP II 581 4.26
Global Transition Account 6 0.04
CGOV Asset Management 441 3.23
Schroder Investment Management North America Inc. 334 2.45
Vontobel Asset Management, Inc. 528 3.87
Private Equity 337 2.47
$13,648 100.0Table 1.5
14 Municipal Employees’ Pension Plan • Annual Report • 2013
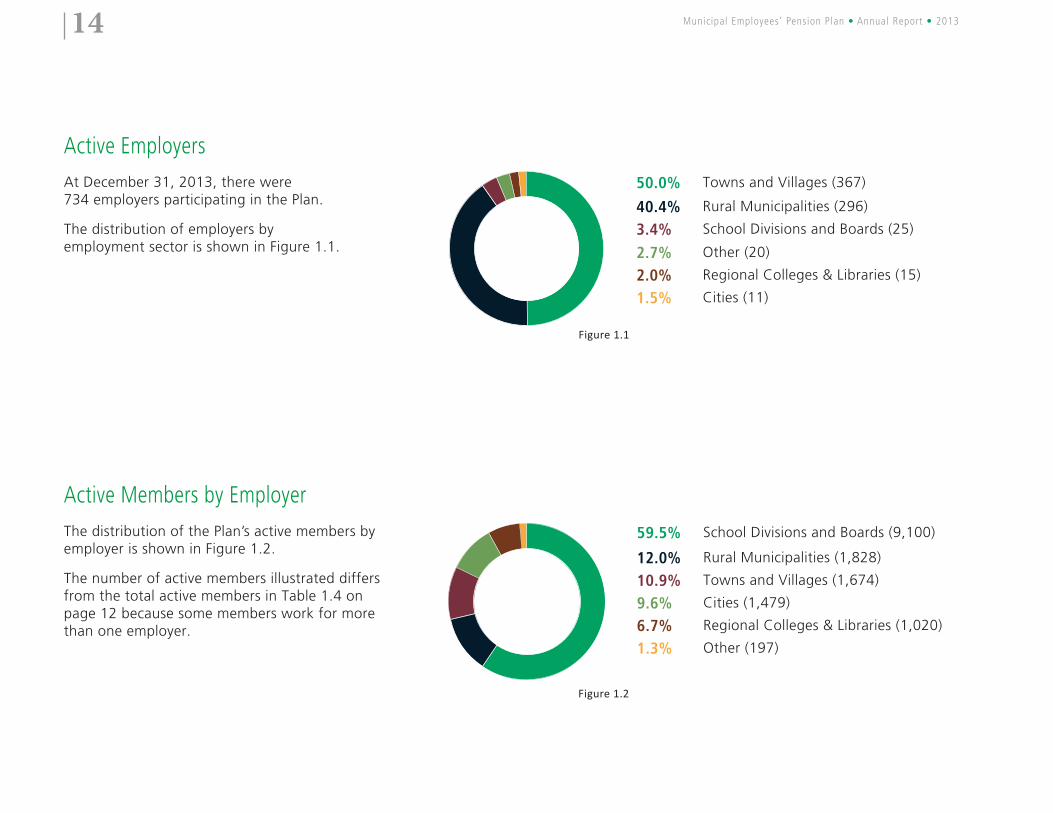
Active EmployersAt December 31, 2013, there were 734 employers participating in the Plan.
The distribution of employers by employment sector is shown in Figure 1.1.
Active Members by EmployerThe distribution of the Plan’s active members by employer is shown in Figure 1.2.
The number of active members illustrated differs from the total active members in Table 1.4 on page 12 because some members work for more than one employer.
Figure 1.1
50.0% Towns and Villages (367)
40.4% Rural Municipalities (296)
3.4% School Divisions and Boards (25)
2.7% Other (20)
2.0% Regional Colleges & Libraries (15)
1.5% Cities (11)
59.5% School Divisions and Boards (9,100)
12.0% Rural Municipalities (1,828)
10.9% Towns and Villages (1,674)
9.6% Cities (1,479)
6.7% Regional Colleges & Libraries (1,020)
1.3% Other (197)
Figure 1.2

15Municipal Employees’ Pension Plan • Annual Report • 2013M
unicipal Employees’
Pension PlanExpenditures &
StatisticsStrategicInitiatives
RiskM
anagement
Investments
Managem
ent Report/A
ctuaries Opinion
FinancialStatem
entsFinancial
Highlights
Appendix
PEBA Service Standards January 1, 2013 to December 31, 2013
CompletedNumber that Meet or Exceeded Standard
% that Meet or Exceeded Standard
*Standard (Business Days and % Target)
Statement on Termination (Option Letter) 1,707 1,611 94.4 20* 75%
Statement on Death (Active/Deferred) (Option Letter)
34 29 85.3 10 80%
Statement on Death (Pensioners) (Option Letter) 166 163 98.2 10 80%
Payments (includes on termination and death) 1,536 1,381 89.9 10 80%
Payment of New Retirements 272 262 96.3 15* 80%
Pension Estimates (Retirement Option Letter) 486 452 93.0 10* 90%
Marriage Breakdown Calculations 52 48 92.3 10* 75%
Purchase of Service 28 25 89.3 20* 80%
Portability Transfer Values 21 20 95.2 30 80%
Total 4,302 3,991 92.8Table 1.6
PEBA Periodic Requirements January 1, 2013 to December 31, 2013
CompletedNumber that Meet or Exceeded Standard
% that Meet or Exceeded Standard
*Standard (Business Days)
Annual Member Statement 1 1 100.0 75
Budget Variance Reporting 4 4 100.0 Quarterly
Proposed Annual Budget 1 1 100.0 Annually
Performance Measurement 4 4 100.0 Quarterly
Decisions Affecting Stakeholders 0 0 n/a 1 Month
Newsletter (MEPP Matters) 2 2 100.0 Semi-annually
Total 12 12 100Table 1.7
* Standard is set within the contract between the Commission and PEBA
PEBA reports measurement against standards to the Commission quarterly. Table 1.6 and Table 1.7 provide measurement results for the 2013 year.

16 Municipal Employees’ Pension Plan • Annual Report • 2013
LEFT TO RIGHT: Rory Griffith, Beverly Crossman, Brad Hvidston, Ray Orb, Jeff McNaughton, Don McCallum, Betty Moleski, Randy Hurd, Randy Goulden
NOT PICTURED: Wayne Steen

17Municipal Employees’ Pension Plan • Annual Report • 2013M
unicipal Employees’
Pension PlanExpenditures &
StatisticsStrategicInitiatives
RiskM
anagement
Investments
Managem
ent Report/A
ctuaries Opinion
FinancialStatem
entsFinancial
Highlights
Appendix
In May 2011, the Commission reviewed and amended its three-year strategic business plan for the period 2011 to 2013.
The strategic business plan sets out goals for the planning period in four major categories:
The strategic business plan was developed as part of the Commission’s comprehensive governance process, which includes regular strategic business planning and risk management planning. It was developed within the context of the Plan’s purpose, mission and goals, and the Commission’s values of accountability, professionalism, integrity and fairness.
The new strategic business plan considers a number of internal and external factors.
This annual report will provide reporting for the strategic initiatives completed in 2013 and other activities accomplished in 2013.
STraTegic initiatives
Maintain the Financial Integrity of the Plan
Plan Governance Accountability
The Commission is determined to identify, assess and, where appropriate, implement opportunities to add value to the services the Plan provides
to its members.
The Commission is committed to achieving the needs of Plan members and employers through a�ordable, sustainable Plan bene�ts and services.
The Commission strives to demonstrate leading practices in pension plan governance.
Performance of the Plan and the Commission’s service providers is measured, managed, and reported.
Customer-orientedCommunications and Service
...flexible and realistic options must be explored to address matters such as Plan sustainability

18 Municipal Employees’ Pension Plan • Annual Report • 2013
The Commission’s objectives:
• Support member understanding of the Plan, including individual member benefits and responsibilities.
• Provide relevant, timely and accurate information which is easy to understand.
• Support participating employers.
• Maintain an up-to-date suite of services that meet evolving member needs.
The Commission has a number of ongoing communication strategies that are designed to inform members and employers about the Plan, including:
• A stakeholder consultation process.
• Plan overview presentations for employers and employees.
• Plan member retirement workshops.
• Print materials that include the MEPP Matters newsletter, the MEPP Member Booklet, the MEPP In-Depth publications for specific Plan issues, and quarterly MEPP Employer Bulletins. These materials are available on the Plan’s website.
• The MORe retirement planner is available on the Plan website.
Activities planned and accomplished in 2013
Communicate the value of the Plan.
The content audit of the website has been completed. Updating the format of the website will continue into 2014 as significant changes are needed to the content management system in order to modernize web viewing compatibility to include contemporary content styles.
Expand uses for the Employer Remittance System.
Online forms for enrolling Plan members and updating Plan member information were implemented in November 2013.
Electronic media.
E-mail communications are now provided to members who prefer to receive their pension information electronically. Member statements are not included at this time but investigation continues into the feasibility of a secure way for members to view their statements online.
Customer-oriented communications and service

19Municipal Employees’ Pension Plan • Annual Report • 2013M
unicipal Employees’
Pension PlanExpenditures &
StatisticsStrategicInitiatives
RiskM
anagement
Investments
Managem
ent Report/A
ctuaries Opinion
FinancialStatem
entsFinancial
Highlights
Appendix
Maintain the financial integrity of the plan
The Commission’s objectives:
• Maintain Plan funding that will be able to pay promised benefits in full as they come due while keeping contribution rates stable over the long term.
• Ensure Plan design includes benefits that meet the needs of all stakeholders.
• Identify, assess and manage the Plan’s financial risks.
The Commission has implemented a funding policy that monitors the ability of the Plan to pay benefits on a fully-funded basis. The policy includes established target ranges that the Commission uses to make decisions concerning plan contributions and benefit levels.
Activities planned and accomplished in 2013
The Commission will conclude a plan design study that will form the basis for consultations with the Plan’s stakeholders – this will determine whether or not changes in legislation are required.
The Commission completed its plan design study. Stakeholder consultations are to take place in 2014.
Over 140%
Temporary bene�t increasesIndexation of bene�tsContribution decrease
Funding Level
125% - 140%
Indexation of pensionsContribution decrease
115% - 125%110% - 115%Up to110%
Watch contribution levelsContribution increase to
maintain funding
Keep Contribution and bene�t levels
steady
Indexation of pensions for current year
Considerations
105%Minimum
Funding Target

20 Municipal Employees’ Pension Plan • Annual Report • 2013
The Commission’s objectives:
• The Commission demonstrates that it is a responsible fiduciary.
• Ensure the Plan’s business model, including roles and responsibilities of both the Commission and the contracted service providers, is consistent with the Plan’s strategy and operations.
The Commission employs various tools to achieve its objectives, including:
• The Commission’s member orientation program and its formal and ongoing educational program.
• A comprehensive Governance Manual.
• The development of a Policy Manual.
• The establishment of service standards with the Plan’s administrator.
Activities planned and accomplished in 2013
The Commission will continue to conduct a formal evaluation of the provision of executive management services by its plan administrator.
The Commission received the results of the evaluation of the Public Employees Benefits Agency’s provision of executive management services for the year-ended 2012. These results were discussed at the March meeting.
Plan governance
...the Commission continues to be committed to strong governance practices and attentiveness.

21Municipal Employees’ Pension Plan • Annual Report • 2013M
unicipal Employees’
Pension PlanExpenditures &
StatisticsStrategicInitiatives
RiskM
anagement
Investments
Managem
ent Report/A
ctuaries Opinion
FinancialStatem
entsFinancial
Highlights
Appendix
The Commission’s objectives:
• Understand stakeholder and member information requirements and provide them with information regarding the Plan’s strategy, operations and values.
• Provide relevant and timely reporting on the performance of the Plan, the Commission and service providers.
The Commission demonstrates its accountability to the Plan’s members and employers through:
• Annual self-assessments completed by the Commission.
• The development, implementation and review of the Commission’s Strategic Business Plan.
Activities planned and accomplished in 2013
The Commission will receive proposed measures for the enhanced reporting tool. If the proposed measures are approved, the implementation of enhanced performance reporting for the Plan, the Commission and service providers will commence in late 2013.
Enhanced reporting using the approved measures commenced in 2013.
Accountability
STraTegic initiatives for 2014 - 2016The Commission met in November 2013 for a strategic planning session. This included a review of the values, goals and objectives of the plan as well as identification of the current strategic risks for the Plan. From this planning session, the Strategic Plan for 2014-2016 and the associated initiatives are currently under development.

22 Municipal Employees’ Pension Plan • Annual Report • 2013
Within its mandate, the Commission is responsible for managing risks that could affect the operation of the pension plan, the Plan’s members and other stakeholders. The risk management process provides the Commission and its administrator with the means to identify and evaluate the foreseeable risks in the Plan. Supporting strategies are developed to manage or mitigate these risks.
The Risk Management Plan and its annual review ensure that a regular, documented process is in place that provides rationale for the Commission’s risk management decisions.
In order to assist in the identification and assessment of all foreseeable risks in the Plan, the Commission has identified the following key broad-based risks of the Plan:
riSk management
Broad-based Risks (definition of risk) Key RisksStrategic Risk encompasses the potential risks
as they relate to communication and service delivery, plan design suitability, plan reputation, plan governance and accountability
• Communications and member engagement
• Governance
• Risks to members/Plan stemming from members’ need for advice
Financial Risk relates to the investment, funding, and benefit policies, plan design costs, and demographic considerations
• Market risk
• Funding requirement shortfall
• Changes in cost
• Fraud
Regulatory Risk associates with non-compliance with legislation, fiduciary obligations and the legal requirements of pension plan management
• Non-compliance with legislative requirements
• Failure to meet fiduciary obligations to Plan members and their beneficiaries
Operational Risk includes operational emergencies and non-compliance with governance policies
• Investment manager performance
• Errors or omissions
• Loss of service provider
• Poor performance of service providers
• Capacity to deliver services
Table 1.8

23Municipal Employees’ Pension Plan • Annual Report • 2013M
unicipal Employees’
Pension PlanExpenditures &
StatisticsStrategicInitiatives
RiskM
anagement
Investments
Managem
ent Report/A
ctuaries Opinion
FinancialStatem
entsFinancial
Highlights
Appendix
The Commission believes that these broad-based risks are integrated with each other and with the processes of the Plan. Therefore, the Commission has to retain a balanced approach in the management of all four types of risk.
The Commission has developed and implemented the following strategies and ongoing business practices to manage these risks:
• The Commission recognizes the need to maintain a healthy Plan for all stakeholders. A stakeholder consultation process provides employers and Plan members with the opportunity to consider the affordability of the benefits provided and the contributions needed to fund these benefits.
• The design of the Plan is a key element of the overall financial security of its members and an important component of employers’ human resources strategies. It is this recognition that prompted the Commission to take proactive measures to ensure the health of the Plan through a formal funding policy.
• The funding policy enables the Commission to be proactive in managing the financial status of the Plan and helps to facilitate communication with stakeholders on the status of the Plan.
• The Commission implemented a Statement of Investment Policies and Procedures (SIP&P) that outlines the Commission’s investment beliefs and provides for risk management through diversification of asset classes, capital markets and investment managers. The Commission annually reviews the SIP&P.
• The Commission communicates investment performance. Monitoring of investment performance is carried out by PEBA and Mercer (Canada) Ltd.
• The Commission ensures initiatives and Plan related activities are adequately funded through its budgeting process.
• The Commission reviews the performance standards for the Commission’s administrator quarterly, investment consultant annually, investment managers quarterly, and custodian semi-annually.
• The Commission annually evaluates the performance of the executive management services provided by its administrator.
• The Commission requires that service providers confirm that they maintain business continuity plans and adhere to a code of conduct.
• The Commission’s administrator has internal controls in place. These controls are audited annually.
There are two levels of audit:
• The Commission retains Deloitte LLP to conduct an audit of the Plan.
• The Provincial Auditor of Saskatchewan reports to the Legislative Assembly regarding the audit of the Plan.
• The Commission has an Acquisition and Retention of Services policy that details how the Commission is to retain and evaluate service providers.
• The Commission’s administrator reviews and reports compliance with legislative requirements annually.
• The Periodic Checklist is a list of major items identified by the Commission that are necessary for the prudent administration of a pension plan. The checklist allows verification that an activity has been carried out. The completed Periodic Checklist is provided to the Commission on a semi-annual basis.
• Commission members are required to review and sign the Commission’s Code of Conduct and Conflict of Interest Procedures at least annually.

24 Municipal Employees’ Pension Plan • Annual Report • 2013
• The Commission has outlined the education required to aid Commission members in executing their fiduciary and governance duties.
• The Commission formally reviews its Strategic Business Plan on a periodic basis.
• The Commission regularly consults with legal counsel and other expert advisors regarding issues on which it is deliberating.
• The Commission retains service providers who are experts in the responsibilities to which they are assigned with respect to the Plan.
• PEBA staff provides retirement information seminars and individual information to Plan members.
• Information tools include member and employer seminars, employer bulletins and guides, website information, and written materials.
Activities planned and accomplished in 2013
The Commission will continue to work with its administrator and actuary on the review of the current Plan design for MEPP and the potential options for future plan design to determine if changes in legislation are required.
The Commission completed its plan design study. Stakeholder consultations are to take place in 2014.
The Commission will conduct an evaluation of executive management services for 2012 in the first quarter of 2013.
The Commission received the results of the evaluation of executive management services for 2012 at its March 2013 meeting. An evaluation of 2013 services will be received in March 2014.
The Commission will initiate an enhanced risk management process to monitor risks to the Plan.
A review of the enhanced risk management assessment was conducted in November 2013 that resulted in the identification of a number of key risks to the Plan and the development of incremental strategies to further manage these risks. This process more directly relates the risk management process with strategic business planning and other governance processes.
The Commission will conduct a review to confirm that all of its service providers maintain a Business Continuity Plan.
The Commission conducted a review and received confirmation that all of its service providers maintain a Business Continuity Plan and that their staff abide by a code of conduct/conflict of interest policy.

25Municipal Employees’ Pension Plan • Annual Report • 2013M
unicipal Employees’
Pension PlanExpenditures &
StatisticsStrategicInitiatives
RiskM
anagement
Investments
Managem
ent Report/A
ctuaries Opinion
FinancialStatem
entsFinancial
Highlights
Appendix
Risk Management Activities Planned for 2014
The Risk Management review identified ways to incrementally strengthen risk management strategies for the key broad-based risks.
Incremental strategies identified for 2014:
Strategic Risk:
• Examine whether the Plan should provide advice; and
• Implement measures on asset retention.
Financial Risk:
• Continue the sustainability review; and
• Develop a communications plan for the sustainability review.
Operational Risk:
• Continue to monitor and review the process of investment manager oversight.
• Ensure continuous monitoring of the personnel planning process
• Ensure timely implementation of enhanced reporting.

26 Municipal Employees’ Pension Plan • Annual Report • 2013
TrusteesAs trustees of the Fund, the Commission is responsible for prudently investing the Fund’s assets.
Investment PolicyIn fulfilling its responsibility to prudently invest the Fund’s assets, the Commission has adopted an investment policy for the Plan. This policy is set out in the SIP&P, which the Commission reviews annually.
The SIP&P contains guidelines for investment of Plan assets, and includes:
• investment and risk philosophy;
• asset mix and diversification policy, including portfolio return expectations;
• benchmarks for each investment manager and for the Fund;
• permitted investments and quality guidelines;
• monitoring and control responsibilities, including performance targets;
• compliance reporting and monitoring requirements; and
• conflict of interest guidelines.
Investment ConsultantThe Plan’s investment consultant is Mercer (Canada) Ltd. In 2013, the investment consultant provided strategic investment guidance, performance monitoring, regular and special project investment consulting, and reports to the Commission. The Commission paid consulting fees of $549,800 in 2013 (Table 1.9).
Fees Paid for Investment Services in 2013
Investment Managers (total) $7,865,000
Investment Consultant 550,000
Custodian 786,000
Total $9,201,000Table 1.9
Investment ManagersThe Commission delegates responsibility for investing the Fund assets to professional investment managers. Each manager invests within a specific mandate, as outlined in Table 1.10. Investment managers were paid a total of $7,865,000 in 2013.
inveSTmenTS

27Municipal Employees’ Pension Plan • Annual Report • 2013M
unicipal Employees’
Pension PlanExpenditures &
StatisticsStrategicInitiatives
RiskM
anagement
Investments
Managem
ent Report/A
ctuaries Opinion
FinancialStatem
entsFinancial
Highlights
Appendix
Investments by Investment Manager
Figure 1.3
11.1% Schroder Investment Management North America Inc.
10.9% CGOV Asset Management
10.2% Vontobel Asset Management, Inc.
9.3% Canso Investment Council Ltd.
8.6% PIMCO Canada Corp.
8.2% Wellington Management Company, LLP
8.0% BlackRock Asset Management Canada Ltd.
6.9% TD Asset Management, Inc.
6.8% Foyston, Gordon & Payne Inc.
6.2% Greystone Management Investments Inc.
5.6% Brandes Investment Partners, LP
5.1% Snyder Capital Management, LP
3.3% Infrastructure (Various)
0.1% Private Equity (Various)
-0.3% Pareto Investment Management Ltd.
Investment Manager Mandate Investment Manager Mandate
Canso Investment Council Ltd. Corporate Bonds Pareto Investment Management Ltd. Currency
PIMCO Canada Corp. Core Plus Bonds Greystone Management Investments Inc. Real Estate
TD Asset Management, Inc. Bond Overlay Antin Infrastructure Partners Infrastructure
Wellington Management Company, LLP Long Bonds Plus Global Infrastructure Partners Fund Infrastructure
CGOV Asset Management Canadian Equities SteelRiver Infrastructure Fund North America, LP Infrastructure
Foyston, Gordon & Payne Inc. Canadian Equities Falcon Investment Advisors, LLC Private Equity
BlackRock Asset Management Canada Ltd. U.S. Equities Great Hill Partners Private Equity
Brandes Investment Partners, LP Non-North American Equities
Neuberger Berman Group LLC Private Equity
Schroder Investment Management North America Inc.
Global Equities New Mountain Capital LLC Private Equity
Vontobel Asset Management, Inc. Global Equities Silver Lake Management LLC Private Equity
Snyder Capital Management, LP U.S. Small Cap Equities
Table 1.10
-2
0
2
4
6
8
10
12

28 Municipal Employees’ Pension Plan • Annual Report • 2013
MEPP Asset Mix
Figure 1.4
34.9% Foreign Large Cap Equities
33.0% Fixed Income
17.7% Canadian Equities
6.2% Real Estate
5.1% U.S. Small Cap Equities
3.3% Infrastructure
0.1% Private Equity
-0.3% Cash Currency Forwards
Investment Objectives Total Fund
The Fund’s primary objective is to grow at a rate which exceeds the growth of the Plan’s liabilities. To measure the growth of the Plan’s liabilities, a fixed income portfolio that approximates its going-concern pension liabilities behaviour (the liability benchmark) has been established.
To achieve its goal, the Commission has established:
• a long-term strategic asset mix that is reflected by the Plan’s benchmark (a standard against which performance is measured); and,
• an investment management structure consisting of one or more investment managers in each major asset class.
Custodian The Commission retains RBC Investor Services Trust as the custodian of the Plan. The custodian is responsible for:
• safekeeping of assets;
• collection of income;
• settlement of investment transactions; and
• recording and verifying investment transactions.
RBC Investor Services Trust received $786,000 in fees in 2013.

29Municipal Employees’ Pension Plan • Annual Report • 2013M
unicipal Employees’
Pension PlanExpenditures &
StatisticsStrategicInitiatives
RiskM
anagement
Investments
Managem
ent Report/A
ctuaries Opinion
FinancialStatem
entsFinancial
Highlights
Appendix
Performance by Asset Class
Four-year Return
Four-year Benchmark
FixedIncome
CanadianEquities
Foreign LC Equities
US SC Equities RealEstate
InfrastructureCurrencyOverlay
0.7% 0.7%
12.0%
10.2%
11.7%
18.7% 18.8%
10.7%11.1%
10.2%
6.8%
4.3%3.4%
5.1%
One-year Return
One-year Benchmark
FixedIncome
CanadianEquities
Foreign LC Equities
US SC Equities RealEstate
Infrastructure
CurrencyOverlay
-1.1% -0.5%
4.4%6.1%
11.7%
7.2%
36.4%
48.1%
30.7%28.0%
20.7%
13.0%
-6.0% -6.2%

30 Municipal Employees’ Pension Plan • Annual Report • 2013
To the Members of the Legislative Assembly of Saskatchewan:
Administration of the Municipal Employees’ Pension Plan is presently assigned to the Public Employees Benefits Agency of the Ministry of Finance. Management is responsible for financial administration, administration of funds and managing of assets.
The financial statements which follow have been prepared by management in conformity with Canadian accounting standards for pension plans. Management uses internal controls and exercises its best judgment in order that the financial statements fairly reflect the financial position of the Plan.
The Municipal Employees’ Pension Commission reviews and approves the financial statements. In doing so, the Commission has had the opportunity to discuss the statements with management throughout the year.
The provision for annuity benefits and the accrued pension benefits are determined by an actuarial valuation. Actuarial valuation reports require best estimate assumptions about future events and require approval by management.
The financial statements have been audited by Deloitte LLP whose report follows.
Brian SmithAssistant Deputy MinisterPublic Employees Benefits Agency
Regina, SaskatchewanMarch 21, 2014
managemenT’S report

31Municipal Employees’ Pension Plan • Annual Report • 2013M
unicipal Employees’
Pension PlanExpenditures &
StatisticsStrategicInitiatives
RiskM
anagement
Investments
Managem
ent Report/A
ctuaries Opinion
FinancialStatem
entsFinancial
Highlights
Appendix
acTuarieS opinion
Actuarial Opinion With respect to the Municipal Employees’ Pension Plan, I have prepared an actuarial valuation as at December 31, 2012 with the results subsequently extrapolated to December 31, 2013, for the purpose of determining the necessary actuarial information for financial statement reporting purposes in accordance with Section 4600 of the CPA Canada Handbook.
In my opinion, for the purpose of this actuarial valuation and extrapolation: The data on which this valuation and subsequent extrapolation are based are sufficient and reliable. Where applicable, the assumptions have been adopted as management’s best estimates for accounting purposes and
consequently I have not rendered a specific opinion on them; however, in my opinion, the assumptions are, in aggregate, not unreasonable when considering the circumstances of the program and the purpose of the valuation and extrapolation.
The actuarial cost methods, extrapolation methods and valuation methods employed are appropriate. The actuarial valuation and extrapolation conform to the requirements of Section 4600 of the CPA Canada Handbook. Nonetheless, emerging experience differing from the assumptions will result in gains or losses which will be revealed in subsequent valuations.
This report has been prepared and this actuarial opinion has been given in accordance with accepted actuarial practice.
David R. Larsen Fellow, Society of Actuaries Fellow, Canadian Institute of Actuaries
February 10, 2014

We administer MEPP in the best interests of all members of the Plan.

33Municipal Employees’ Pension Plan • Annual Report • 2013Financial
Highlights
Expenditures &Statistics
StrategicInitiatives
RiskM
anagement
Investments
Managem
ent Report/A
ctuaries Opinion
FinancialStatem
entsM
unicipal Employees’
Pension PlanA
ppendix
Municipal Employees’ Pension Plan
Financial Statements
Year ended December 31, 2013

34 Municipal Employees’ Pension Plan • Annual Report • 2013
indePendenT auditor’s reportTo Members of the Legislative Assembly of Saskatchewan:
We have audited the accompanying financial statements of the Municipal Employees’ Pension Plan, which comprise the statement of financial position as at December 31, 2013, and the statement of changes in net assets available for benefits and the statement of changes in pension obligations and provision for annuity obligations for the year then ended, and a summary of significant accounting policies and other explanatory information.
Management’s Responsibility for the Financial Statements
Management is responsible for the preparation and fair presentation of these financial statements in accordance with Canadian accounting standards for pension plans, and for such internal control as management determines is necessary to enable the preparation of financial statements that are free from material misstatement, whether due to fraud or error.
Auditor’s Responsibility
Our responsibility is to express an opinion on these financial statements based on our audit. We conducted our audit in accordance with Canadian generally accepted auditing standards. Those standards require that we comply with ethical requirements and plan and perform the audit to obtain reasonable assurance about whether the financial statements are free from material misstatement.
An audit involves performing procedures to obtain audit evidence about the amounts and disclosures in the financial statements. The procedures selected depend on the auditor’s judgment, including the assessment of the risks of material misstatement of the financial statements, whether due to fraud or error. In making those risk assessments, the auditor considers internal control relevant to the entity’s preparation and fair presentation of the financial statements in order to design audit procedures that are appropriate in the circumstances, but not for the purpose of expressing an opinion on the effectiveness of the entity’s internal control. An audit also includes evaluating the appropriateness of accounting policies used and the reasonableness of accounting estimates made by management, as well as evaluating the overall presentation of the financial statements.
We believe that the audit evidence we have obtained is sufficient and appropriate to provide a basis for our audit opinion.
Opinion
In our opinion, the financial statements present fairly, in all material respects, the financial position of Municipal Employees’ Pension Plan as at December 31, 2013, and the changes in its net assets available for benefits and changes in its pension obligations and annuity obligations for the year then ended in accordance with Canadian accounting standards for pension plans.
Emphasis of Matter
Without modifying our opinion, we draw attention to Note 4 of the financial statements which explains that certain comparative information for the year ended December 31, 2012 has been restated.
Chartered AccountantsMarch 21, 2014Regina, Saskatchewan
35Municipal Employees’ Pension Plan • Annual Report • 2013Financial
Highlights
Expenditures &Statistics
StrategicInitiatives
RiskM
anagement
Investments
Managem
ent Report/A
ctuaries Opinion
FinancialStatem
entsM
unicipal Employees’
Pension PlanA
ppendix
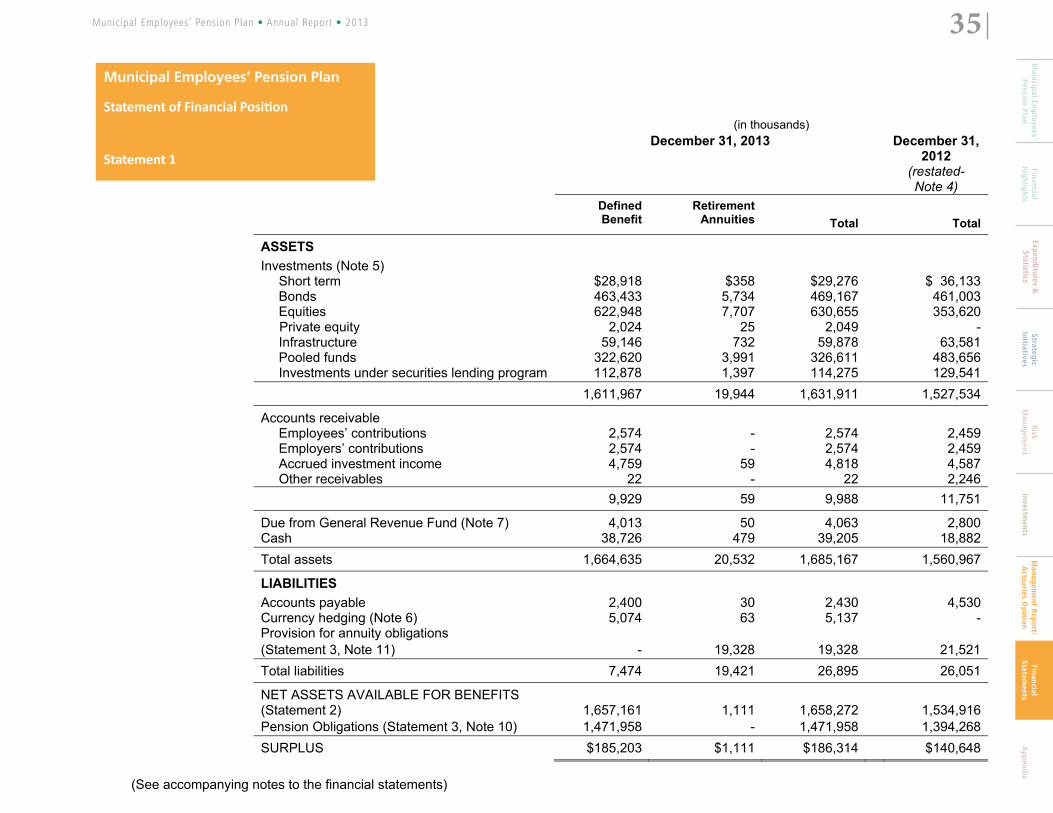
Municipal Employees’ Pension Plan
Statement of Financial Position
Statement 1
Municipal Employees’ Pension Plan Statement 1 Statement of Financial Position
(in thousands) December 31, 2013 December 31,
2012 (restated- Note 4)
Defined Benefit
Retirement Annuities
Total
Total
ASSETS Investments (Note 5) Short term $28,918 $358 $29,276 $ 36,133 Bonds 463,433 5,734 469,167 461,003 Equities 622,948 7,707 630,655 353,620 Private equity 2,024 25 2,049 - Infrastructure 59,146 732 59,878 63,581 Pooled funds 322,620 3,991 326,611 483,656 Investments under securities lending program 112,878 1,397 114,275 129,541 1,611,967 19,944 1,631,911 1,527,534
Accounts receivable Employees’ contributions 2,574 - 2,574 2,459 Employers’ contributions 2,574 - 2,574 2,459 Accrued investment income 4,759 59 4,818 4,587 Other receivables 22 - 22 2,246 9,929 59 9,988 11,751
Due from General Revenue Fund (Note 7) 4,013 50 4,063 2,800Cash 38,726 479 39,205 18,882Total assets 1,664,635 20,532 1,685,167 1,560,967
LIABILITIES Accounts payable 2,400 30 2,430 4,530Currency hedging (Note 6) 5,074 63 5,137 -Provision for annuity obligations (Statement 3, Note 11) - 19,328 19,328 21,521Total liabilities 7,474 19,421 26,895 26,051
NET ASSETS AVAILABLE FOR BENEFITS (Statement 2) 1,657,161 1,111 1,658,272 1,534,916Pension Obligations (Statement 3, Note 10) 1,471,958 - 1,471,958 1,394,268SURPLUS $185,203 $1,111 $186,314 $140,648
(See accompanying notes to the financial statements)

36 Municipal Employees’ Pension Plan • Annual Report • 2013
Municipal Employees’ Pension Plan
Statement of Changes in Net Assets Available for Benefits
Statement 2
Municipal Employees' Pension Plan Statement 2 Statement of Changes in Net Assets Available for Benefits
(in thousands) 2013 2012 (restated-
Note 4)
Year Ended December 31 Defined Benefit Retirement Annuities Total Total
INCREASE IN ASSETS Investment income Interest Security lending Pooled funds Dividends Infrastructure
$23,621 173
6,869 14,754
7,615
$3142
91196101
$23,935 175
6,960 14,950
7,716
$18,294 112
10,953 11,782
6,943 53,032 704 53,736 48,084Change in fair value of investments 98,730 1,222 99,952 143,533Contributions Employee contributions Employer contributions Reciprocal transfers in Arrears contributions and interest
42,853 42,673
772 210
- - - -
42,853 42,673
772 210
36,778 36,787
833 322
86,508 - 86,508 74,720
Net decrease in provision for annuity benefits (Statement 3, Note 11) - 2,193 2,193 3,771
Total increase in assets 238,270 4,119 242,389 270,108DECREASE IN ASSETS Transfers and refunds (Note 9) Benefit payments (Note 9) Pension obligation payments Annuities Investment transaction costs Administrative expenses (Note 13)
31,056 9,568
51,722 -
9,835 13,513
---
3,074130135
31,056 9,568
51,722 3,074 9,965
13,648
25,592 7,519
48,081 3,330 6,691
10,910Total decrease in assets 115,694 3,339 119,033 102,123INCREASE IN NET ASSETS 122,576 780 123,356 167,985NET ASSETS AVAILABLE FOR BENEFITS, BEGINNING OF YEAR 1,534,585 331 1,534,916 1,366,931NET ASSETS AVAILABLE FOR
BENEFITS, END OF YEAR $1,657,161 $1,111 $1,658,272 $1,534,916(See accompanying notes to the financial statements)

37Municipal Employees’ Pension Plan • Annual Report • 2013Financial
Highlights
Expenditures &Statistics
StrategicInitiatives
RiskM
anagement
Investments
Managem
ent Report/A
ctuaries Opinion
FinancialStatem
entsM
unicipal Employees’
Pension PlanA
ppendix
Municipal Employees’ Pension Plan
Statement of Changes in Pension Obligations and Provision For Annuity Obligations
Statement 3
Municipal Employees' Pension Plan Statement 3 Statement of Changes in Pension Obligations and Provision for Annuity Obligations
(in thousands) Year Ended December 31 2013 2012 PENSION OBLIGATIONS, BEGINNING OF YEAR $1,394,268 $1,599,687
Increase in pension obligations Interest on pension obligations Pension obligations accrued Transfers-in Experience loss
90,102 75,397
772 3,765
80,227 90,105
833 -
170,036 171,165Decrease in pension obligations Transfers, refunds and defined pension obligations paid Experience gain Transfer to provision for annuities Change in assumptions
92,346 - - -
81,192 28,201
36 267,155
92,346 376,584PENSION OBLIGATIONS, END OF YEAR (Note 10) $1,471,958 $1,394,268 PROVISION FOR ANNUITY OBLIGATIONS, BEGINNING OF YEAR $21,521 $25,292Increase in provision for annuity obligations Interest on annuity obligations New annuities purchased Experience loss
1,299 - -
1,182 36
270 1,299 1,488
Decrease in provision for annuity obligations Annuities paid Change in assumptions
3,074 418
3,330 1,929
3,492 5,259
PROVISION FOR ANNUITY OBLIGATIONS, END OF YEAR (Note 11) $19,328 $21,521 (See accompanying notes to the financial statements)

38 Municipal Employees’ Pension Plan • Annual Report • 2013
Municipal Employees’ Pension Plan
Notes to the Financial Statements
December 31, 2013
Municipal Employees' Pension Plan Notes to the Financial Statements December 31, 2013 1. Description of the Municipal Employees' Pension Plan General
The Municipal Employees' Pension Plan (the “Plan”) which is domiciled in Regina, Saskatchewan, is comprised of three components: defined benefit, defined contribution benefit and retirement annuities. The following description of the Plan is a summary only. For more complete information, reference should be made to The Municipal Employees' Pension Act. The Municipal Employees' Pension Act (the “Act”) provides authority for the Plan. The Act directs that all allowances, payments and refunds under the Act shall be payable out of the Plan in the manner provided in the Act together with all benefits granted under a former Act. The Municipal Employees' Pension Commission (the “Commission”) is responsible for holding in trust and investing the monies of the Plan. The Commission's composition and authority to administer the Plan are provided in Section 7 of the Act. The Plan is registered under The Pension Benefits Act, 1992 and is required to provide valuations every three years as to whether the Plan has sufficient assets to meet its pension obligations on an on-going basis as well as on a hypothetical wind-up basis. These valuations are filed with the Superintendent of Pensions (the “Superintendent”). If the Plan has insufficient assets, the Act outlines the steps to address the shortfall of assets. The Commission filed its December 31, 2012 valuation with the Superintendent. Due to an accounting adjustment on the 2012 financial statements (Note 4), a revised valuation was prepared on December 13, 2013 and re-filed with the Superintendent on December 18, 2013. The fund is required to obtain the next actuarial valuation as at December 31, 2015. Defined Benefit Component The Defined Benefit Component became effective July 1, 1973. This Defined Benefit Component is mandatory for permanent employees and optional for some non-permanent employees. A. Funding
Effective January 1, 2013, employee contributions are 8.15% of salary for general members and 11.35% for police officers and firefighters (2012- 7.4% and 10.2% respectively). Employee contributions are matched by the employer. There are some employee contributions that are not matched by employers, these contributions consist of transfers from other plans and purchase of prior services.
B. Pensions
Employees receive a pension at age 65 for general members and at age 60 for police officers and firefighters, for each year and fractional year of contributory service in the Plan prior to retirement that is determined as:

39Municipal Employees’ Pension Plan • Annual Report • 2013Financial
Highlights
Expenditures &Statistics
StrategicInitiatives
RiskM
anagement
Investments
Managem
ent Report/A
ctuaries Opinion
FinancialStatem
entsM
unicipal Employees’
Pension PlanA
ppendix
For service earned before 1990 and service earned after 2000 but before 2006, the number of years of contributory service during these periods times the greater of: a) 1.8% times the average salary for the highest three annualized years of the member's total pensionable service in the Plan (2% for
police officers and firefighters); or b) i) 1.3% of that portion of the member’s average salary not exceeding the average yearly maximum pensionable earnings under
the Canada Pension Plan; and ii) 2% of that portion of the member's average salary exceeding the average yearly maximum pensionable earnings under the
Canada Pension Plan. For all other service, the number of years of contributory service for the period times the greater of: a) 1.5% times the average salary for the highest three annualized years of the member's total pensionable service in the Plan
(1.7% for police officers and firefighters); or b) i) 1.3% of that portion of the member's average salary not exceeding the average yearly maximum pensionable earnings under
the Canada Pension Plan; and ii) 2% of that portion of the member's average salary exceeding the average yearly maximum pensionable earnings under the
Canada Pension Plan. Members who commenced employment on or after January 1, 1993:
For service earned after 2000 but before 2006, the number of years of contributory service during this period times 1.8% times the average salary for the highest three annualized years of the member's total pensionable service in the Plan (2% for police officers and firefighters). For all other service, the number of years of contributory service for the period times 1.5% times the average salary for the highest three annualized years of the member's total pensionable service in the Plan (1.7% for police officers and firefighters).
C. Retirement Normal retirement is at age 65 for general members and age 60 for police officers and firefighters. Members may retire earlier under
certain conditions.
The Plan also provides benefits in the event of termination of employment, death or disability.
D. Surplus Any surpluses arising in the Plan can be utilized at the discretion of the Commission.
40 Municipal Employees’ Pension Plan • Annual Report • 2013
E. Transfers Subject to lock in provisions of the Plan, transfer of a member’s commuted value is payable when a member ceases to be employed. As the December 31, 2012 actuarial valuation for filing purposes stated a solvency ratio of 77.2%, commuted value transfers out of the
Plan are limited to 77.2%. Payment of the remaining transfer deficiency shall occur over the following five-year period.
Defined Contribution Component The Defined Contribution Component consists of members who made contributions to the Defined Contribution Component in effect prior to July 1, 1973. Members may retire and purchase an annuity at age 65. Members may retire earlier under certain conditions. Upon retirement a member can purchase an annuity from either the Plan or a private insurer based on employee and employer contributions together with the interest thereon. In the event of death prior to retirement, the member's spouse may receive a life annuity or elect to receive a lump-sum payment of employee and employer contributions plus interest. If the member's beneficiary is other than the spouse, a lump-sum payment of employee and employer contributions plus interest is made. Retirement Annuities Component If a member elects to purchase an annuity through the Commission, an annuity contract is issued based on the member's balance, current interest rates and annuity tables. The present value of these annuities is reflected as a liability of the Plan. Supplementary Benefits In accordance with the Act, the Commission may grant supplementary benefits to those members receiving pensions and annuities to compensate them for lost purchasing power. The Commission may grant the supplementary benefits as long as the solvency of the entire Plan is not impaired. Income Taxes The Plan is a registered pension plan, as defined by the Income Tax Act (Canada) and, accordingly, is not subject to income taxes.
2. Basis of Preparation
a. Statement of Compliance
The financial statements for the year ended December 31, 2013 have been prepared in accordance with Canadian accounting standards for pension plans as defined in the CPA Canada Handbook section 4600, Pension Plans. For matters not addressed in Section 4600, International Financial Reporting Standards (IFRSs) have been followed.

41Municipal Employees’ Pension Plan • Annual Report • 2013Financial
Highlights
Expenditures &Statistics
StrategicInitiatives
RiskM
anagement
Investments
Managem
ent Report/A
ctuaries Opinion
FinancialStatem
entsM
unicipal Employees’
Pension PlanA
ppendix
b. Functional and Presentation Currency
These financial statements are presented in Canadian Dollars, which is the Plan’s functional currency, and are rounded to the nearest thousand unless otherwise noted.
3. Significant Accounting Policies
The significant accounting policies are as follows: a. Basis of Presentation
The Plan has disclosed financial results for its Defined Benefit and Retirement Annuities components separately. The Plan maintains a single investment portfolio and assets were allocated to the retirement annuities component at January 1, 2002 based upon the provision for annuity obligations as at that date. Investment income is split so that it matches the rate of return and operating expenses and the change in fair value have been allocated relative to the assets. These financial statements were authorized and issued by the Commission on March 21, 2014.
b. Investments
Investments are stated at their fair value in the Statement of Financial Position. The change in the fair value of investments at the beginning and end of each year is reflected in the Statement of Changes in Net Assets Available for Benefits. Fair value of investments is determined as follows: Short-term investments are valued at cost which, together with accrued investment income, approximates fair value given the short-term nature of these investments. Bonds are valued at year-end quoted bid prices in an active market when available. When quoted market prices are not available, the fair value is based on a valuation technique, being the present value of the principal and interest receivable discounted at the appropriate market interest rates. Equities are valued at year-end quoted bid prices from accredited stock exchanges on which the security is principally traded. Private equity investments are valued at market values supplied by the private equity investment manager. These market values are based on a year-end valuation of the underlying investments performed by the private equity investment manager. Infrastructure investments are valued at market values supplied by the infrastructure investment manager. These market values are based on a year-end valuation of the underlying investments performed by the infrastructure investment manager. Pooled fund investments are valued at the year-end unit value supplied by the pooled-fund administrator, which represent the underlying net assets of the pooled fund at fair values determined using closing bid prices. Real estate pooled-fund underlying assets are valued by third-party appraisals.
42 Municipal Employees’ Pension Plan • Annual Report • 2013
Investments in derivative financial instruments, including futures, repurchase agreements, forwards and option contracts, are valued at year-end quoted market prices where available. Where quoted market prices are not available, values are determined using pricing models, which take into account current market and contractual prices of the underlying instruments, as well as time value and yield curve or volatility factors underlying the position. Investment transactions are recorded on the trade date.
c. Other Assets and Financial Liabilities
Accounts receivable are classified as loans and receivables and accounts payable are classified as other financial liabilities and are measured at amortized cost. Due to their short-term nature, the amortized cost of these instruments approximates their fair value.
d. Investment Income and Transaction Costs
Investment income, which is recorded on the accrual basis, includes interest income, dividends, real estate operating income, pooled-fund income, infrastructure income, and security lending income. Brokers’ commissions and other transaction costs are recognized in the statement of changes in net assets available for benefits in the period incurred.
e. Foreign Currency Translation
The fair values of foreign currency denominated investments included in the statement of Financial Position are translated into Canadian dollars at year-end rates of exchange. Gains and losses from translations are included in the change in fair value of investments.
Foreign currency-denomination transactions are translated into Canadian dollars at the rates of exchange on the trade dates of the related transactions. Realized gains and losses on the sale of investments are included in the change in fair value of investments.
f. Provision for Annuity Obligations
Provision for annuity obligations represents the present value of the retirement annuities underwritten by the Plan and is determined pursuant to an actuarial valuation or extrapolation. Any change in the liability pursuant to the valuation or extrapolation is recognized as an increase or decrease in that year’s statement of changes in pension obligations and provision for annuity obligations.
g. Use of Estimates
The preparation of financial statements in accordance with Canadian accounting standards for pension plans requires management to make estimates and assumptions that affect the recorded amounts of assets and liabilities and disclosures of contingent assets and liabilities at the date of the financial statement and the recorded amounts of revenue and expenses during the year. Significant items subject to such estimates and assumptions include the valuation of investments, the provision for annuity obligations and pension obligations. Actual results could differ from these estimates.
h. Changes in Accounting Policies
The Plan has adopted the following new standards, along with any consequential amendments, effective January 1, 2013, or on such a date they became applicable. The adoption of these changes did not result in any adjustments and had no significant impact on the financial statements:

43Municipal Employees’ Pension Plan • Annual Report • 2013Financial
Highlights
Expenditures &Statistics
StrategicInitiatives
RiskM
anagement
Investments
Managem
ent Report/A
ctuaries Opinion
FinancialStatem
entsM
unicipal Employees’
Pension PlanA
ppendix
IFRS 13 - Fair Value Measurement IFRS 13, issued in May 2011, redefines fair value to emphasize that it is a market-based measurement, not an entity-specific measurement. It also provides a single framework for measuring fair value and applies, with limited exceptions, when another standard permits or requires fair value measurement. In addition, IFRS 13 requires specific disclosures about fair value measurement. The standard is effective for annual periods beginning on or after January 1, 2013.
i. Future Accounting Policy Changes
A number of new standards, amendments to standards and interpretations, are not yet effective for the year ended December 31, 2013, and have not been applied in preparing these financial statements. In particular, IFRS 9, Financial Instruments, for which the effective date of adoption, has not been determined. The extent of the impact of adoption of this standard is not known at this time, but is not expected to be material.
4. Accounting Adjustment In November 2013, an accounting error was discovered pertaining to the 2012 financial statements. The error was due to an inaccuracy in the
estimate of the year-end market value of the infrastructure assets. The error resulted in a $17.6 million overstatement of the infrastructure assets on the Statement of Financial Position and an overstatement of the change in the fair value of investments on the Statement of Changes in Net Assets Available for Benefits. In addition, the error resulted in an overstatement of the surplus reported in 2012 by $17.6 million. The December 31, 2012 financial statements have been restated to reflect the following adjustments:
Statement of Financial Position (in thousands)Infrastructure reported in 2012 $ 81,150 Adjustment (17,569)
$ 63,581
Surplus reported in 2012 $ 158,217Adjustment (17,569)Restated surplus $ 140,648
Statement of Changes in Net Assets Change in fair value of investments reported in 2012 $ 161,102Adjustment (17,569)Restated change in fair value of investments $ 143,533
Net assets available for benefits reported in 2012 $1,552,485 Adjustment (17,569)Restated net assets available for benefits $1,534,916

44 Municipal Employees’ Pension Plan • Annual Report • 2013
5. Investments Details of significant terms and conditions, exposure to interest rate and credit risks of investments are as follows: Investments The carrying values of the Plan’s investments are as follows: 2013 2012
(restated) Short-term $ 29,276 $ 36,133 Bonds 469,167 461,003 Equities Private equity
630,655 2,049
353,620 -
Infrastructure 59,878 63,581 Pooled Funds 326,611 483,656 $1,517,636 $1,397,993 Investments under securities lending: Equities $ 78,588 $ 74,924 Bonds 35,687 54,617 $ 114,275 $ 129,541 $1,631,911 $1,527,534 Security Lending Program Through its custodian, the Plan participates in an investment security lending program for the purpose of generating fee income. Non-cash collateral of at least 105% of the market value of the loaned securities is retained by the Plan until the loaned securities have been returned (see Securities lending in note 12). The market value of the loaned securities is monitored on a daily basis with additional collateral obtained or refunded as the market value of the loaned securities fluctuates. In addition, the custodian provides indemnification against any potential losses in the securities lending program. While in the possession of counterparties, the loaned securities may be resold or re-pledged by such counterparties. Short-Term Investments These investments are comprised of treasury bills, notes, commercial paper, repurchase agreements and a short-term investment fund. Short-term investments held as of December 31, 2013 had effective interest rates of 0.9% to 1.9% (2012 - 0.9% to 1.9%) and an average term to maturity of 58 days (2012 – 143 days). The Plan's investment policy states that investments must meet a minimum investment standard of "A2/P2" or equivalent rating as rated by a recognized bond rating service. Other than the Government of Canada, no single issuer represents more than 58.94% (2012 – 51.88%) of the total Plan's short-term investments. Included in short-term investments is $15.0 million (2012 - $17.6 million) in repurchase agreements, $510 thousand (2012 - $818 thousand) of swap collateral and a negative $91 thousand (2012 - $21 thousand) in bond forwards which have maturity dates of less than one year.

45Municipal Employees’ Pension Plan • Annual Report • 2013Financial
Highlights
Expenditures &Statistics
StrategicInitiatives
RiskM
anagement
Investments
Managem
ent Report/A
ctuaries Opinion
FinancialStatem
entsM
unicipal Employees’
Pension PlanA
ppendix
Bonds The Plan's investment policy states that bonds must meet a minimum quality standard of BBB as rated by a recognized bond rating service unless otherwise permitted within a specific investment manager mandate. In addition, not more than 10% of its total bond market value may be invested in lower than BBB rated bonds. In 2013 there were 4.57% (2012 – 4.31%) invested in lower than BBB Bonds. The market value, coupon rates and effective interest rate to maturity are shown in the following chart by contractual maturity. Actual maturity may differ from contractual maturity because certain borrowers have the right to call or prepay obligations with or without call or prepayment penalties. 2013 (in thousands)
Years to Maturity Federal
Foreign Government Provincial Municipal Corporate
Total Market Value Coupon Rate
Effective Interest
Rate Under 5 $ - $3,018 $ 840 $ - $100,673 $104,531 1.25% - 9.0% 3.47% 5 to 10 28,761 442 35,205 1182 68,316 133,906 0.59% - 10.50% 5.45% Over 10 57,962 4,999 132,981 11,336 59,139 266,417 1.50% - 9.00% 12.54% Market Value
$86,723
$8,459
$169,026
$12,518
$228,128
$504,854
2012 (in thousands)
Years to Maturity Federal
Foreign
Government Provincial Municipal Corporate
Total Market Value Coupon Rate
Effective Interest
Rate Under 5 $ - $ 2,742 $ 263 $ 657 $ 76,987 $ 80,649 1.25% - 8.25% 2.67% 5 to 10 22,543 5,671 48,442 148 61,623 138,427 0.49% - 11.04% 5.67% Over 10 56,968 3,602 146,027 9,198 80,749 296,544 0.00% - 9.38% 8.95% Market Value
$79,511
$12,015
$194,732
$ 10,003
$219,359
$515,620
All foreign bonds are reported in Canadian dollars. Equities The Plan's investment policy allows no one holding to represent more than 10% of the market value of the related portfolio and no one holding to represent more than 10% of the common stock in any corporation. The investment policy allows between 19% and 41% of the Plan to be invested in foreign equities, including those held in pooled funds. As at December 31, 2013 the Plan held 25.07% (2012 – 8.21%) of the Plan’s total investments in segregated foreign equities and 13.79% (2012 – 21.45%) of the Plan’s total investments in pooled foreign equity funds. Foreign equities are comprised of 33.24% (2012 – 60.32%) in U.S. equities and 66.76% (2012 – 26.95%) in Non-North American equities.

46 Municipal Employees’ Pension Plan • Annual Report • 2013
All foreign equities are reported in Canadian dollars. The Plan's equities have no fixed maturity date and are not exposed directly to interest rate risk. Dividends are generally declared on a quarterly basis. The average effective dividend rate is 2.31% (2012 – 2.86%). Private Equity Private equity investments are made through limited partnership arrangements. The investments represent partial equity ownership in entities that are not traded and priced in stock exchanges. The Plan’s private equity investments consist of the following:
(in thousands)
2013
2012 Falcon Strategic Partners IV $ 1,495 $ - Neuberger Berman Secondary Opportunities III 447 - Silver Lake Partners IV 107 - $ 2,049 $ -
The Plan’s investment policy limits private equity investments to a maximum of 8% of the Plan’s assets. As of December 31, 2013 the Plan’s private equity investments were 0.13% (2012 – nil %) of the Plan investments. Falcon Strategic Partners IV is a limited partnership formed to invest in North American private companies. As at December 31, 2013 the Plan was committed to a further investment in this limited partnership of up to $3.8 million in Canadian funds. Neuberger Berman Secondary Opportunities III is a limited partnership formed to invest in North American private companies. As at December 31, 2013 the Plan was committed to a further investment in this limited partnership of up to $10.1 million in Canadian funds. Silver Lake Partners IV is a limited partnership formed to invest in North American private companies. As at December 31, 2013 the Plan was committed to a further investment in this limited partnership of up to $2.5 million in Canadian funds. New Mountain Partners IV is a limited partnership formed to invest in U.S. private companies. As at December 31, 2013 the Plan was committed to an investment in this limited partnership of up to $10.0 million in U.S. funds. Private equity managers utilize an internal valuation policy to establish a market value for the underlying assets within their portfolios. This policy outlines that any marketable assets within the portfolio will be valued at the price on the securities exchange. Non-marketable securities will be subject to professional judgment and may take into account several factors such as:
Market conditions Purchase price Estimated liquidation value Third-party transactions in the private market Present value of expected future cash flows Present value of anticipated sale or flotation when asset is soon to be divested
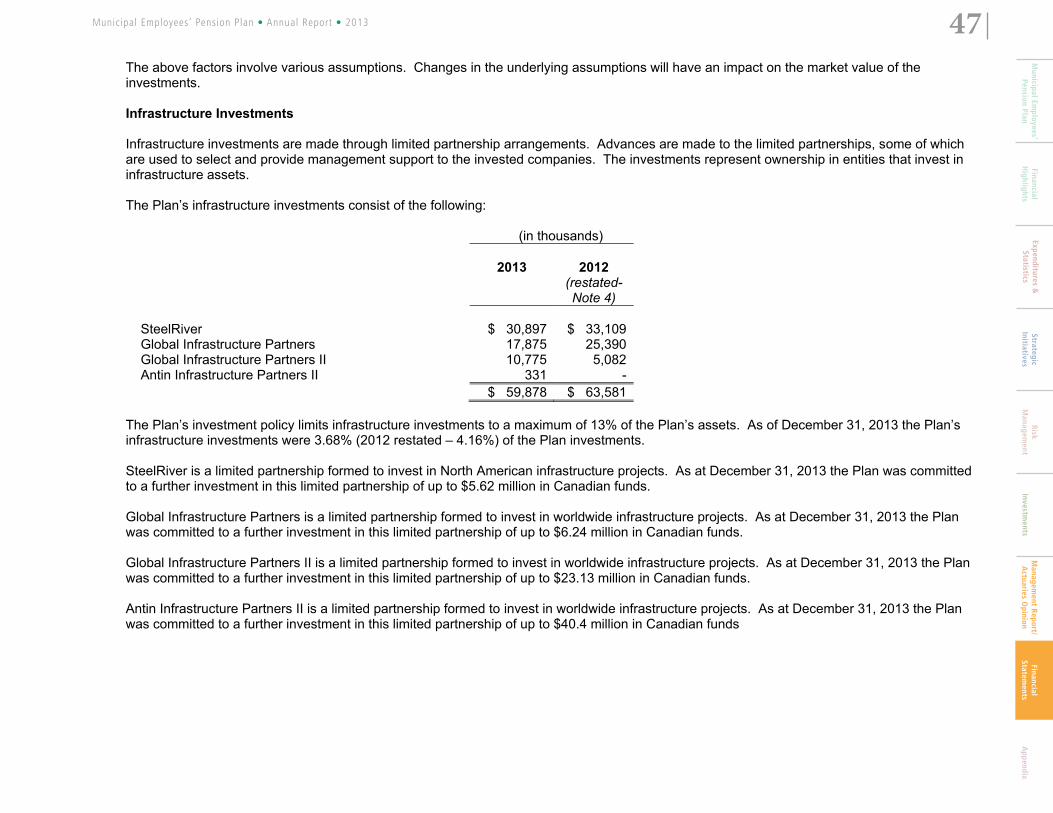
47Municipal Employees’ Pension Plan • Annual Report • 2013Financial
Highlights
Expenditures &Statistics
StrategicInitiatives
RiskM
anagement
Investments
Managem
ent Report/A
ctuaries Opinion
FinancialStatem
entsM
unicipal Employees’
Pension PlanA
ppendix
The above factors involve various assumptions. Changes in the underlying assumptions will have an impact on the market value of the investments.
Infrastructure Investments Infrastructure investments are made through limited partnership arrangements. Advances are made to the limited partnerships, some of which are used to select and provide management support to the invested companies. The investments represent ownership in entities that invest in infrastructure assets. The Plan’s infrastructure investments consist of the following:
(in thousands)
2013
2012 (restated- Note 4)
SteelRiver $ 30,897 $ 33,109 Global Infrastructure Partners 17,875 25,390 Global Infrastructure Partners II 10,775 5,082 Antin Infrastructure Partners II 331 - $ 59,878 $ 63,581
The Plan’s investment policy limits infrastructure investments to a maximum of 13% of the Plan’s assets. As of December 31, 2013 the Plan’s infrastructure investments were 3.68% (2012 restated – 4.16%) of the Plan investments. SteelRiver is a limited partnership formed to invest in North American infrastructure projects. As at December 31, 2013 the Plan was committed to a further investment in this limited partnership of up to $5.62 million in Canadian funds. Global Infrastructure Partners is a limited partnership formed to invest in worldwide infrastructure projects. As at December 31, 2013 the Plan was committed to a further investment in this limited partnership of up to $6.24 million in Canadian funds. Global Infrastructure Partners II is a limited partnership formed to invest in worldwide infrastructure projects. As at December 31, 2013 the Plan was committed to a further investment in this limited partnership of up to $23.13 million in Canadian funds. Antin Infrastructure Partners II is a limited partnership formed to invest in worldwide infrastructure projects. As at December 31, 2013 the Plan was committed to a further investment in this limited partnership of up to $40.4 million in Canadian funds

48 Municipal Employees’ Pension Plan • Annual Report • 2013
Infrastructure managers utilize an internal valuation policy to establish a market value for the underlying assets within their portfolios. This policy outlines that any marketable assets within the portfolio will be valued at the price on the securities exchange. Non-marketable securities will be subject to professional judgment and may take into account several factors such as:
Market conditions Purchase price Estimated liquidation value Third-party transactions in the private market Present value of expected future cash flows Present value of anticipated sale or flotation when asset is soon to be divested
The above factors involve various assumptions. Changes in the underlying assumptions will have an impact on the market value of the investments. Pooled Funds The Plan’s investment policy limits pooled-fund holdings to not more than 10% of the market value of the individual pooled fund. Exceptions to the 10% limit are allowed if provision has been made to transfer securities in kind when units of the pooled fund are sold. The Plan’s pooled funds are comprised of:
Units Held (in thousands)
% of Total Units Outstanding
Market Value (in thousands)
Pooled Fund 2013
2012 2013 2012 2013 2012
U.S. Equity BlackRock CDN US Equity Index Non-Taxable Class A Fund
9,300
11,978
2.86%
19.00%
$131,857
$149,582
Global Equity Greystone EAFE (Hansberger) Brandes Canada International Equity Unit Trust TD Emerald EAFE
-
6,863 -
6,769
12,199 5,350
-
27.62% -
4.81%
21.36% 2.30%
-
92,501 -
60,686
123,514 58,321
Real Estate Greystone Real Estate Fund
1,004
1,003
2.28%
2.41%
102,253
91,553
$326,611
$483,656

49Municipal Employees’ Pension Plan • Annual Report • 2013Financial
Highlights
Expenditures &Statistics
StrategicInitiatives
RiskM
anagement
Investments
Managem
ent Report/A
ctuaries Opinion
FinancialStatem
entsM
unicipal Employees’
Pension PlanA
ppendix
Pooled-fund investments are governed by the policies for each fund. Financial derivatives are permitted within the pooled funds as outlined below:
BlackRock funds may contain equity index futures, to replicate the return of the S&P 500 Composite Index, and currency contracts used to hedge U.S. dollar exposure back to the Canadian dollar. Brandes may employ the use of foreign exchange contracts to hedge against changes in exchange rates and American depositary receipts to substitute for direct investment in the underlying security. Greystone is authorized to employ derivatives to protect against losses from changes in exchange rates, interest rates and market indices. These derivatives may include such instruments as options, futures and forward contracts.
Investments in real estate consist of Canadian commercial property held directly by the Greystone Real Estate Fund. The market appraisals used in valuing the real estate involve various assumptions. Changes in the underlying assumptions will have an impact on the market value of the investments. Fair Value The Plan has classified its investments using a hierarchy that reflects the significance of the inputs used in determining their fair value. Under the classification structure, financial instruments recorded at unadjusted quoted prices in active markets for identical assets and liabilities are classified as Level 1. Instruments valued using inputs other than quoted prices included in Level 1 that are observable for the asset or liability either directly or indirectly are classified as Level 2. Instruments values using inputs that are not based on observable market data are classified as Level 3. The following table classifies the Plan’s required financial instruments within a fair value hierarchy:
2013 (in thousands)
Level 1 Level 2 Level 3 Total Bonds $ - $504,854 $ - $504,854Pooled funds - 224,359 102,252 326,611Short-term 29,276 - - 29,276Equities 709,243 - - 709,243Private Equity - - 2,049 2,049Infrastructure - - 59,878 59,878Total $738,519 $729,213 $164,179 $1,631,911

50 Municipal Employees’ Pension Plan • Annual Report • 2013
Fair Value measurements using level 3 inputs
Steel River Global Infrastructure
Partners
Global Infrastructure
Partners II
Antin
Real
Estate
Private Equity
Total
Balance at December 31, 2012 (restated- Note 4) $33,109 $25,390 $ 5,082 $- $91,553 $- $155,134Net purchases and sales 41 (3,953) 3,503 292 - 1,934 1,817Gains (losses) Realized (2) 27 28 - - - 53 Unrealized (2,251) (3,589) 2,162 39 10,699 115 7,175Balance at December 31, 2013
$30,897
$17,875
$10,775
$331
$102,252
$2,049
$164,179
2012 (restated) (in thousands)
Level 1 Level 2 Level 3 Total Bonds $ - $515,620 $ - $515,620Pooled funds - 392,103 91,553 483,656Short-term 36,133 - - 36,133Equities 428,544 - - 428,544Infrastructure - - 63,581 63,581Total $464,677 $907,723 $155,134 $1,527,534
6. Derivatives Derivative financial instruments are financial contracts whose values are derived from changes in underlying assets, interest or currency
exchange rates. The Plan objective is to achieve an overall Plan duration that approximates the duration of the Plan liabilities on a going-concern basis.
At December 31, 2013 the Plan held the following derivatives: Future / Forward Contracts
The Plan has entered into foreign exchange forward contracts to hedge some of its foreign currency exposure in its foreign equities. Foreign exchange forward contracts are obligations in which two counterparties agree to exchange one currency for another at a specified price for settlement on a predetermined date in the future. The Plan uses a passive currency hedging strategy to manage the currency exposures inherent in the foreign equity exposure of the Plan, as well as provide protection of the Canadian value of the portfolio. The following summarizes the Plan’s use of foreign currency forward exchange contracts within the passive currency hedging strategy:

51Municipal Employees’ Pension Plan • Annual Report • 2013Financial
Highlights
Expenditures &Statistics
StrategicInitiatives
RiskM
anagement
Investments
Managem
ent Report/A
ctuaries Opinion
FinancialStatem
entsM
unicipal Employees’
Pension PlanA
ppendix Net exposure of Brandes Canada International Equity Unit Trust is the percentage of investments denominated in foreign currency that are not hedged through forward exchange contracts. The hedge strategy involves protecting against the foreign equity exposures that exist in the underlying portfolio of U.S., global and Non-North American equity mandates. The Plan uses a passive hedging strategy with an applied hedge ratio of 50% of the underlying portfolio. Hedging is limited to those foreign currency exposures that are included in the MCSI EAFE Index and excludes any Canadian Dollar exposures. The plan also hedges USD on top of other currency countries in the MSCI EAFE Index. Based on the current rate of exchange as of December 31, 2013, the forward contracts are in a net loss position of $5.1 million (2012 – gain of $1.1 million). The foreign currency forward exchange contracts are short-term in duration and all current contracts as of December 31, 2013 have a maturity date of less than one year. During the year management also sought increased returns and added value to the Plan by generating returns from relative movements between foreign currencies. These value-added contracts are not used for hedging purposes by the Plan and has experienced a net unrealized loss of $328 thousand during the year (2012 – net unrealized loss of $226 thousand). The contracts are short-term in duration and have a maturity date of less than one year. The value added contracts the Plan has entered into are as follows:
FOREIGN EXCHANGE FORWARD CURRENCY CONTRACTS (in thousands)
2013 2012
Currency Notional Value* Gain (Loss) Net Exposure Notional Value* Gain (Loss) Net Exposure
AUD (111) 22 49.9% - - -
DKK (1,642) (68) 50.0% - - -
EUR (35,391) (1,488) 50.0% (16,513) (1,057) 79.0%
HKD (3,487) (45) 50.0% (3,816) (63) 51.8%
JPY (15,329) 686 49.9% (51,790) 3,258 3.84% MXN (1,529) 11 50.0% - - - GPB (29,515) (1,405) 50.0% (17,755) (849) 65.8% SEK (1,114) (43) 50.0% - - - CHF (11,913) (574) 49.9% (1,776) (202) 88.0% USD (194,657) (2,229) 49.9% - - -
(5,133)
1,087

52 Municipal Employees’ Pension Plan • Annual Report • 2013
2013 2012
Currency Net notional value
Net unrealized gain/ loss
Net notional
value
Net unrealized gain/ loss
CAD/EUR EUR/CAD - (29) - (242)
CAD/AUD AUD/CAD - 1 - 12
CAD/JPY JPY/CAD - (8) - 62
CAD/RUB RUB/CAD - - - (1)
CAD/GBP GBP/CAD - (221) - (58)
CAD/SEK SEK/CAD - - - (16)
GBP/USD USD/GBP - 4 - (6)
JPY/USD USD/JPY - 12 - (33)
AUD/USD USD/AUD - (3) - 8
BRL/USD USD/BRL - 6 - 1
USD/ZAR ZAR/USD - - - (8)
USD/NZD NZD/USD - (9) - 5
EUR/USD USD/EUR - (45) - 15
CAD/USD USD/CAD - 11 - 112
USD/CHF CHF/USD - (29) - (8)
USD/CLP CLP/USD - 4 - -
COP/USD USD/COP - (1) - 1
USD/PLN PLN/USD - 5 - -
USD/RUB RUB/USD - - - 6
USD/CZK CZK/USD - (1) - (3)
USD/CNY CNY/USD - 1 - -
HUF/USD USD/HUF - (2) - -
USD/MXN MXN/USD - 1 - 8
USD/INR INR/UAD - (1) - 4
ILS/USD USD/ILS - - - -
SGD/USD USD/SGD - 3 - (2)
USD/TRY TYR/USD - 2 - (1)
NOK/USD USD/NOK - (5) - (19)
USD/KRW KRW/USD - - - (1)
SEK/USD USD/SEK - (13) - 43
ZAR/USD USD/ZAR - (11) - (105)
(328) (226)

53Municipal Employees’ Pension Plan • Annual Report • 2013Financial
Highlights
Expenditures &Statistics
StrategicInitiatives
RiskM
anagement
Investments
Managem
ent Report/A
ctuaries Opinion
FinancialStatem
entsM
unicipal Employees’
Pension PlanA
ppendix
*Notional value represents the contractual amount to which a rate or price is applied in order to calculate the exchange of cash flows, and is therefore not recorded on the financial statements. Repurchase Agreements
A repurchase agreement, also known as a repo, is a contract entered into between two counterparties to sell securities together with an agreement for the seller to buy back the securities at a later date. At December 31, 2013, the Plan has entered into repurchase agreements with a notional value of $855 million (2012 - $788 million) and a fair value of $15.03 million (2012 - $17.6 million). This amount is included in short-term investments on the Statement of Financial Position. The repurchase agreements have a term to maturity of less than one year. The amount of bonds pledged for collateral is $98 million (2012 - $112 million). The amount of collateral required is based on the notional value of the repurchase agreements and may fluctuate with the notional value. The investment in repurchase agreements is available as additional margin. No specific collateral is pledged for the repurchase agreement exposure as the investment is not leveraged. Collateral may be pledged to the Plan if the market value of the repurchase agreements changes significantly. Interest Rate Swaps
An interest rate swap is an agreement in which two parties agree to exchange interest rate cash flows, based on a specified notional amount from a fixed interest rate to a variable interest rate. At December 31, 2013, the Plan held an interest rate swap with a notional value of $124.3 million (2012 - $(6.8) million) and a loss in fair value of $306 thousand (2012 - $399 thousand). This amount is included in bond investments on the Statement of Financial Position. The interest rate swap has a term to maturity of less than one year.
7. Due from General Revenue Fund
The Plan's bank account is included in the Consolidated Offset Bank Concentration arrangement for the Government of Saskatchewan. Earned interest is calculated and paid by the General Revenue Fund on a quarterly basis using the Government's thirty- day borrowing rate and the Plan's average daily bank account balance. The Government’s thirty-day borrowing rate for 2013 was 1.05% (2012 – 1.08%).
8. Earnings Allocation to Members
Interest is allocated annually to the individual member's account balances in accordance with the provisions of the governing legislation. In 2013, an interest rate of 8.88% (2012 – 11.49%) was calculated and applied to the Defined Contribution Component and the Defined Benefit Component. The applied interest rate is based on investment income, current year's change in fair value of the investments, less administration, custodian and investment managers’ fees.

54 Municipal Employees’ Pension Plan • Annual Report • 2013
9. Transfers and Refunds
(in thousands) 2013 2012Transfers to other retirement plans $ 715 $ 560Transfer to other retirement vehicles 21,986 18,205Withdrawals with interest 8,355 6,827 $31,056 $25,592
Benefit Payments
(in thousands) 2013 2012Lump sum payments to estates $ 4,850 $ 2,151Payments in lieu of annuities 4,718 5,368 $ 9,568 $ 7,519
10. Pension Obligations
The actuarial present value of pension obligations for the Defined Benefit Component of the Plan was determined using the projected benefit method prorated on service and management’s best estimate assumptions of future investment performance, salary escalation, inflation, and future pension indexing. An actuarial valuation for management purposes was performed as at December 31, 2012 by AON Hewitt and they have extrapolated the results of that valuation to December 31, 2013 with interest, estimated service accruals and actual obligation payments for the purposes of these financial statements. Actuarial valuations for management purposes are performed annually. An actuarial valuation for filing and funding purposes was performed as at December 31, 2012 by AON Hewitt and filed with the regulatory authorities. On the basis of that valuation, application was made for, and temporary solvency deficiency payment relief was granted under the Pension Benefits Act, 1992. The next valuation to be filed will be required effective December 31, 2015. The pension liability is based on a number of assumptions about future events including interest rates, rate of salary increases, inflation, mortality, retirement rates and termination rates. The major assumptions used in determining the actuarial present value of pension obligations for the Defined Benefit Component of the Plan are:
2013 2012 Interest rate 6.50% 6.50% Salary escalation to Dec 12 n/a n/a Salary escalation thereafter 3.5% 3.5% Inflation 2.5% 2.5% Indexation of pensions none assumed none assumed Mortality UP 94
(projected generationally) UP 94 (projected generationally)

55Municipal Employees’ Pension Plan • Annual Report • 2013Financial
Highlights
Expenditures &Statistics
StrategicInitiatives
RiskM
anagement
Investments
Managem
ent Report/A
ctuaries Opinion
FinancialStatem
entsM
unicipal Employees’
Pension PlanA
ppendix
Actual rates may vary significantly from the long-term assumptions used. The following illustrates the effect of changing certain assumptions from the assumed rates of salary of 3.5%, interest rate of 6.5%, indexing on pre-1999 benefits of 0%, and indexing on post-1998 benefits of 0%. The changes in assumptions are independent of one another.
Effect on Pension Obligation Liability
Salary
Interest Rate Pension Indexing
(pre 1999) Pension Indexing
(post 1998) Assumptions 2.5% 4.5% 5.50% 7.50% 1.0% 1.0% (Decrease) Increase (2.5%) 2.8% 13.7% (11.1%) 8.1% 7.0%
Because the Plan has a solvency deficiency, there is a requirement for a solvency deficiency holdback to be withheld from payouts of
commuted value for a period of five years. Solvency deficiency holdbacks owing as of December 31, 2013 are a total of $3.0 million (2012 - $1.3 million).
11. Provision for Annuity Obligations The actuarial present value of the provision for annuity obligations was determined using management’s best estimate of future investment
performance and future pension indexing. Aon Hewitt performed an actuarial valuation for management purposes as at December 31, 2012 and they have extrapolated the results of that valuation to December 31, 2013 with interest, estimated service accruals and actual benefit payments. Actuarial valuations for management purposes are performed annually.
An actuarial valuation for filing purposes was performed as at December 31, 2012 by Aon Hewitt and filed with the regulatory authorities. On
the basis of that valuation, application was made and granted for temporary solvency deficiency payment relief under the Pension Benefits Act, 1992. The next valuation to be filed will be required effective December 31, 2015.
The actuarial valuation was based on a number of assumptions about future events including interest rates, pension indexing (for members who
elected indexed annuities) and mortality as follows:
2013 2012 Interest Rate 6.5% 6.5% Indexation of Pensions 2.5% 2.5% Mortality UP94
(projected generationally) UP94 (projected generationally)
The actual rates may vary significantly from the assumptions used. The following illustrates the effect of changing certain assumptions from the assumed interest rate of 6.5% and pension indexing of 2.5%. The changes in assumptions are independent of one another.
Effect on Provision for Annuity Obligations
Interest Rate Pension Indexing Assumptions 5.5% 7.5% 1.5% 3.5% (Decrease) Increase 5.8% (5.2%) (0.4%) 0.5%

56 Municipal Employees’ Pension Plan • Annual Report • 2013
In the future, increases on non-indexed annuities will be granted to the extent that investment earnings exceed a threshold and to the extent that the assets will support it. As there is currently no surplus available, the liabilities for non-indexed annuities do not reflect any future indexing.
The cash outflow to pay the required annuity obligation is calculated using the above assumptions. The cash outflows in the next five years
would be $12.5 million, in the next 10 years $20.6 million and in the next 30 years $29.3 million. 12. Financial Risk Management
The nature of the Plan’s operations results in a statement of financial position that consists primarily of financial instruments. The risks that arise are credit risk, market risk (consisting of interest rate risk, foreign exchange risk and equity price risk) and liquidity risk. Significant financial risks are related to the Plan’s investments. These financial risks are managed by having an investment policy, which is approved annually by the Commission. The investment policy provides guidelines to the Plan’s investment managers for the asset mix of the portfolio regarding quality and quantity. The asset mix helps to reduce the impact of market value fluctuations by requiring investments in different asset classes and in domestic and foreign markets. Derivatives are allowed within the Plan to hedge against losses and substitute for direct investment. The Commission reviews regular compliance reports from its investment managers and custodian as to their compliance with the investment policy. The Commission also receives regular compliance reports from the Public Employees Benefits Agency on its custodian as to the investment managers’ compliance with the investment policy. Credit risk Credit risk is the risk that one party does not pay funds owed to another party. The Plan’s credit risk arises primarily from two distinct sources: accounts receivable and certain investments. The maximum credit risk to which it is exposed at December 31, 2013 is limited to the carrying value of the financial assets summarized as follows:
(in thousands) 2013 2012 Cash $ 39,205 $ 18,882 Accounts receivable 9,988 11,751 Fixed income investments1 534,130 490,138 Due from the General Revenue Fund 4,063 2,800 Equities under security lending 78,588 74,924
1Includes short-term investments, bonds, bonds under security lending and derivatives. Accounts receivable are made up of employee and employer contributions receivable, accrued investment income, and accrued receivable for committed sale of an investment. Employee and employer contributions receivable are generally received in less than 30 days. Accrued investment income is received on the next scheduled payment date, generally either annually or semi-annually. Proceeds from the sale of an investment will normally be received 3 days after the trade date. Credit risk within investments is primarily related to short-term investments and bonds. It is managed through the investment policy that limits fixed term investments to those of high credit quality (minimum rating for bonds, BBB unless otherwise permitted within specific investment manager mandate, and for short-term investments is A2/P2) along with limits to the maximum notional amount of exposure with respect to any one issuer.

57Municipal Employees’ Pension Plan • Annual Report • 2013Financial
Highlights
Expenditures &Statistics
StrategicInitiatives
RiskM
anagement
Investments
Managem
ent Report/A
ctuaries Opinion
FinancialStatem
entsM
unicipal Employees’
Pension PlanA
ppendix
Credit ratings for bonds are as follows:
(In thousands) 2013 2012 Credit Rating Fair Value Makeup of
Portfolio (%) Fair Value Makeup of
Portfolio (%) AAA $130,689 25.89 $152,443 29.56AA 136,315 27.00 141,973 27.53A 140,136 27.76 130,792 25.37BBB 74,622 14.78 68,221 13.23BB 4,311 0.85 6,233 1.21B 15,562 3.08 15,958 3.10Unrated 3,219 0.64 - -Total $504,854 100.00 $515,620 100.00
Within bond investments, there are no holdings from one issuer, other than the Government of Canada or a Canadian province, over 3.11% (2012 – 2.73%) of the market value of the combined bond and short-term investment portfolios. No one holding of a province is over 14.44% (2012 – 19.77%) of the market value of the bond portfolio. The Plan is also subject to credit risk through its use of derivative contracts. The contracts are entered into between the Plan and approved counterparties. The credit risk is mitigated by limiting counterparties to specific entities. Market risk Market risk represents the potential for loss from changes in the value of financial instruments. Value can be affected by changes in interest rates, foreign exchange rates and equity prices. Market risk primarily impacts the value of investments. Interest rate risk The Plan is exposed to changes in interest rates in its fixed income investments, including short-term investments and bonds. Duration is a measure used to estimate the extent market values of fixed-income instruments change with changes in interest rates. Using this measure, it is estimated that a 100 basis point increase in interest rates would decrease net assets available for benefits and surplus by $166 million at December 31, 2013 (2012- $168 million); representing 12.1% of the $1.4 billion fair value of fixed-income investments, of which $855 million (2012 - $788 million) is included in Repurchase Agreements – see Note 6. Conversely, a decrease in interest rates of 100 basis points would increase net assets available for benefits and surplus by $166 million at December 31, 2013 (2012 - $168 million); representing 12.1% of the $1.4 billion fair value of fixed income investments. The Plan has implemented a fixed income overlay strategy to manage interest rate exposure. This overlay creates an asset-liability duration match which neutralizes the market value impact of interest rate shocks. Repurchase agreements have been transacted as a means to position duration of assets to parallel the duration (or interest rate sensitivity) of Plan liabilities.

58 Municipal Employees’ Pension Plan • Annual Report • 2013
Foreign exchange The Plan is exposed to changes in the U.S./Canadian dollar exchange rate through its U.S. denominated investments. Also, the Plan is exposed to EAFE (Europe, Australasia and Far East) currencies through its investment in global equity pooled funds. Exposure to both U.S. equities and non-North American equities, including the pooled equity funds, is limited to a maximum 41% each of the market value of the total investment portfolio. At December 31, 2013, the Plan’s exposure to U.S. equities was 24.6% (2012 – 12.0%) and its exposure to Non-North American equities was 13.7% (2012 – 10.5%). At December 31, 2013, a 10% change in the Canadian dollar versus U.S. dollar exchange rate would result in approximately a $26.8 million (2012 - $12.8 million) change in the net assets available for benefits. A 10% change in the Canadian dollar versus the Non- North American currencies would result in approximately an $10.8 million (2012 - $12.8 million) change in net assets available for benefits. The Plan’s exposure to exchange rate risk resulting from the purchase of goods and services is not considered material to the operations of the Plan. The Plan has mitigated its exposure to foreign exchange through the use of derivatives as explained in Note 6. As at December 31, 2013, the Plan’s exposure net of derivatives is $376 million (2012 – $343 million). A 10% change in the exchange rate would equate to a net change of $37.6 million (2012 – $34.5 million). Equity prices The Plan is exposed to changes in equity prices in Canadian, U.S. and EAFE markets. Equities comprise 55.9% (2012 – 53.0%) of the carrying value of the Plan’s total investments. Individual stock holdings are diversified by geography, industry type and corporate entity. No one investee represents greater than 10% of the market value of the Plan. As well, no one holding represents more than 30% of the outstanding share issue of any corporation. The following table indicates the approximate change that could be anticipated for both the increase and decrease in net assets available for benefits based on changes in the Plan’s benchmark indices at December 31, 2013:
(in thousands) 10% increase 10% decrease S&P/TSX Composite Index $ 29,333 $ (29,333)S&P 500 Index 40,903 (40,903)MSCI EAFE Index 22,797 (22,797)
Securities lending At December 31, 2013, no Plan assets have been deposited or pledged as collateral as part of the securities lending strategy. As part of the Plan’s securities lending strategy, collateral has been pledged to the Plan by various counterparties for securities out on loan to the counterparties. At December 31, 2013, the total amount of collateral pledged to the Plan amounted to $126 million (2012– $136 million). Security lending obtains collateral of at least 105% of the market value of the securities lent. Such loans must be secured by readily marketable government bonds, treasury bills and/or letters of credit, discount notes and banker’s acceptances of Canadian chartered banks.
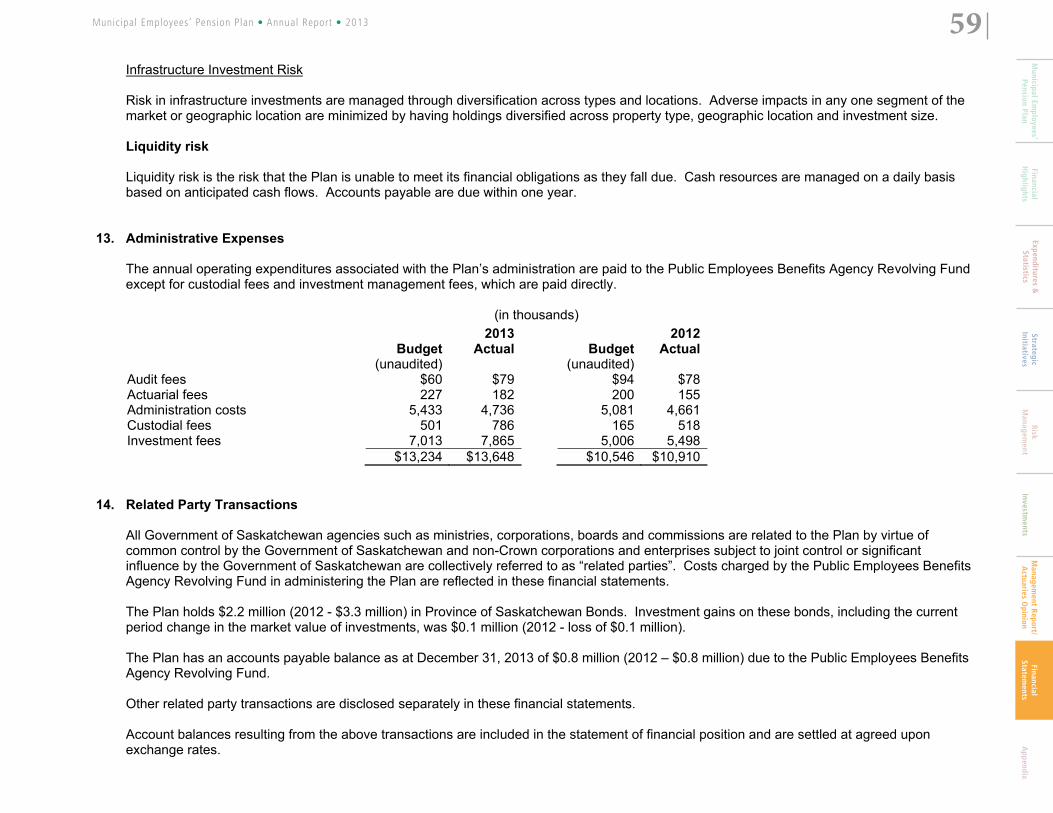
59Municipal Employees’ Pension Plan • Annual Report • 2013Financial
Highlights
Expenditures &Statistics
StrategicInitiatives
RiskM
anagement
Investments
Managem
ent Report/A
ctuaries Opinion
FinancialStatem
entsM
unicipal Employees’
Pension PlanA
ppendix
Infrastructure Investment Risk Risk in infrastructure investments are managed through diversification across types and locations. Adverse impacts in any one segment of the market or geographic location are minimized by having holdings diversified across property type, geographic location and investment size. Liquidity risk Liquidity risk is the risk that the Plan is unable to meet its financial obligations as they fall due. Cash resources are managed on a daily basis based on anticipated cash flows. Accounts payable are due within one year.
13. Administrative Expenses The annual operating expenditures associated with the Plan’s administration are paid to the Public Employees Benefits Agency Revolving Fund except for custodial fees and investment management fees, which are paid directly. (in thousands) 2013 2012 Budget Actual Budget Actual (unaudited) (unaudited)Audit fees Actuarial fees Administration costs Custodial fees Investment fees
$60 227
5,433 501
7,013
$79 182
4,736 786
7,865
$94 200
5,081 165
5,006
$78 155
4,661 518
5,498 $13,234 $13,648 $10,546 $10,910
14. Related Party Transactions
All Government of Saskatchewan agencies such as ministries, corporations, boards and commissions are related to the Plan by virtue of common control by the Government of Saskatchewan and non-Crown corporations and enterprises subject to joint control or significant influence by the Government of Saskatchewan are collectively referred to as “related parties”. Costs charged by the Public Employees Benefits Agency Revolving Fund in administering the Plan are reflected in these financial statements. The Plan holds $2.2 million (2012 - $3.3 million) in Province of Saskatchewan Bonds. Investment gains on these bonds, including the current period change in the market value of investments, was $0.1 million (2012 - loss of $0.1 million). The Plan has an accounts payable balance as at December 31, 2013 of $0.8 million (2012 – $0.8 million) due to the Public Employees Benefits Agency Revolving Fund. Other related party transactions are disclosed separately in these financial statements. Account balances resulting from the above transactions are included in the statement of financial position and are settled at agreed upon exchange rates.

60 Municipal Employees’ Pension Plan • Annual Report • 2013
15. Capital Management The Plan receives new capital from employee and employer contributions. The plan also benefits from income and market value increases on
its invested capital. The Plan’s capital is invested in a number of asset classes including equities, fixed-income infrastructure, and short-term investments. The Commission has delegated the operational investment decisions to a number of different investment management firms through a number of different investment mandates as defined in the Plan’s Statement of Investment Policy and Procedures.
16. Investment Performance
The investment managers make day-to-day decisions on whether to buy or sell investments in order to achieve the long-term performance objectives set by the Commission. The Commission reviews the investment performance of the Plan in terms of the performance of the benchmark portfolio over 4-year rolling periods. The primary long-term investment performance objective for the entire portfolio is to outperform a benchmark portfolio. The following is a summary of the Plan's investment performance: Rolling Four Year Average 2013 Annual Return
Plan's actual rate of return before deducting 9.56% 8.55% investment and administration expenses Benchmark 7.84% 7.57% The Plan's benchmark for its investment portfolio has been determined using the actual returns of market indexes such as the S&P/TSX Capped Composite Index, Morgan Stanley, Europe, Australasia and Far East Index, DEX Universe Bond Index, 91 Day Canadian Treasury Bill, and Investment Property Databank Ltd. Return Index.
17. Fair Value
For financial instruments including due from general revenue fund, short-term investments, accounts receivable, and accounts payable, cost approximates fair value due to their immediate or short-term maturity. The fair values of investments are considered to be market value, the calculation of which is detailed in Note 5.
18. Contingencies
A union representing participating employees has applied by Notice of Motion, which also names several participating employers, for an order quashing purported decisions of the Commission relating to the application of actuarial surplus in the fund, as well as other relief. It is not possible to estimate the potential effect of the claim at this stage in the proceedings.
19. Comparative Figures
Certain comparative figures have been reclassified to conform to the current year’s presentation.

61Municipal Employees’ Pension Plan • Annual Report • 2013Financial
Highlights
Expenditures &Statistics
StrategicInitiatives
RiskM
anagement
Investments
Managem
ent Report/A
ctuaries Opinion
FinancialStatem
entsM
unicipal Employees’
Pension PlanA
ppendix
aPPendixS&P/TSX Composite
The S&P/TSX Composite Index is Canada’s bellwether electronically operated stock exchange. It is the headline index and the principal broad market measure for the Canadian equity markets. This is the basis for numerous sub-indices, which break down the Canadian market by different factors including size, Global Industry Classification Standard (GICS®) and income trust inclusion versus non-inclusion. The index is calculated and managed by Standard & Poor’s and is the main benchmark for Canadian pension and mutual equity funds.
S&P/TSX Capped Composite
S&P/TSX Capped Composite index includes all constituents of the S&P/TSX Composite index with relative weighting of each constituent capped at 10% equity weighting.
S&P 500
Standard & Poor’s 500 Composite Stock Index consists of the largest 500 companies in the United States chosen for market size, liquidity and industry group representation. It is a market-value weighted index, with each stock’s weight in the index proportionate to its market value. For the purposes of this report, the S&P Index returns are converted from U.S. dollars into Canadian dollars and, therefore, reflect currency gains or losses.
MSCI EAFE
Morgan Stanley Capital International Europe, Australasia, Israel, and Far East Index (MSCI EAFE Index) is a widely recognized benchmark of international equity performance. It is a free-float weighted equity index comprising of over 20 developed market country underlying indices representing developed markets outside of Canada and the US.
DEX UBI
DEX (formerly Scotia Capital) Universe Bond Index covers all marketable Canadian bonds with term to maturity of more than one year. The Universe contains over 1,000 marketable Canadian bonds with an average term of 10 years and an average duration of 6.5 years. The purpose of the index is to reflect the performance of the broad “Canadian Bond Market” in a similar manner to the S&P/TSX Composite Index.
DEX All Corporate Bond
DEX All Corporate Bond Index covers all marketable Canadian corporate bonds with a term to maturity of more than one year. The index is based on the Corporate sector of the DEX UBI. The purpose of the index is to reflect the performance of the corporate Canadian bond market.

62 Municipal Employees’ Pension Plan • Annual Report • 2013
DEX Long Term Overall Bond
DEX Long Term Overall Bond Index covers all marketable Canadian bonds with a term to maturity of at least 10 years. The index is based on the long-term bonds held within the DEX UBI. The purpose of the index is to reflect the performance of the long-term Canadian bond market.
DEX Long Government Bond
DEX Long Government Bond Index covers all marketable Canadian government bonds with a term to maturity of more than 10 years. The index is based on the government bonds held within the DEX UBI. The purpose of the index is to reflect the performance of the Canadian long government bond market.
IPD Total Property
The REALpac / IPD Canada Annual Property Index is published by the Investment Property Databank Ltd. On December 31, 2010, REALpac assumed the functions of the Institute of Canadian Real Estate Investment Managers (“ICREIM”), an organization originally formed to manage the Frank Russell Index for Canada and subsequently, the ICREIM / IPD Canada Property Index. The index measures total returns to directly held standing property investments from one open market valuation to the next. IPD compiles property level information from pension funds, life insurance companies and real estate managers on a quarterly basis.
91-Day T-Bills
Canada Treasury Bills represent the highest quality short-term instruments available. The index is constructed by selling and repurchasing Government of Canada T-Bills with an average term to maturity of 91 days. The Scotia Capital 91-Day Treasury Bill Index is calculated and marked to market daily.
CPI
Consumer Price Index is used to gauge Canada’s inflation rate. The series used is the all items, not seasonally adjusted, 1992 base.
Russell 2000
The Russell 2000 Index offers investors access to the small-cap segment of the U.S. equity universe. The Russell 2000 is constructed to provide a comprehensive and unbiased barometer for the small-cap segment and is completely reconstituted annually to ensure larger stocks do not distort the performance and characteristics of the true small-cap opportunity set.