household nonresponse: what we have … · participating agencies, and from the contributions of...
TRANSCRIPT

HOUSEHOLD NONRESPONSE: WHAT WE HAVE LEARNED AND A FRAMEWORK FOR FURTHER WORK
This report was prepared by a subgroup of the Interagency Household Survey Nonresponse Group(IHSNG):
B.K. Atrostic Census Bureau -- co-chairGeraldine Burt Census Bureau -- co-chairFrances Chevarley National Center for Health StatisticsVicki Huggins Census Bureau (formerly)Karen King Census BureauTracy Mattingly Census Bureau Adrienne Onetto Census BureauAdriana Silberstein Bureau of Labor Statistics
The subgroup benefitted from contributions of other IHSNG members and our colleagues atparticipating agencies, and from the contributions of Monique Sanders and Jeremy Shimer, both of theCensus Bureau, who consolidated survey-specific information into tables and graphs. We would alsolike to thank Brian Harris-Kojetin, formerly of the Bureau of Labor Statistics, who was one of theoriginal co-chairs. The other current and former IHSNG members are:
Fernando Armstrong Census BureauRichard Bavier Office of Management and BudgetAudrey Brinkley Census BureauBruce Bulmash Census Bureau Diane Craven Bureau of Justice StatisticsKathleen Creighton Census BureauAnn Hardy National Center for Health StatisticsPaul Hsen Bureau of Labor StatisticsEnrique Lamas Census BureauRobert Latta Department of EnergyThomas Mayer Census BureauMichael McMahon Census BureauJeffrey Moore Census BureauThomas Moore Census BureauFrancisco Otal Census BureauCraig Perkins Bureau of Justice StatisticsBlair Russell Census BureauJ. Michael Stump Census BureauAntoinette Tremblay Census BureauClyde Tucker Bureau of Labor StatisticsRonald Tucker Census Bureau

Disclaimer: This paper reports the results of research and analysis undertaken by Census Bureaustaff. It has undergone a more limited review than official Census Bureau publications. This report isreleased to inform interested parties of research and to encourage discussion.

HOUSEHOLD NONRESPONSE: WHAT WE HAVE LEARNED AND A FRAMEWORK FOR FURTHER WORK
I. Nonresponse As an Interagency Issue
Nonresponse affects the quality, cost, and timeliness of all Federal household surveys. Households may not respond to surveys for many reasons, including:
< they may refuse to respond;< they may not be at home when the interviewer calls or arrives; or< they may be away temporarily (for example, on vacation).
Survey costs can increase if more households must be contacted to collect the same number ofcompleted cases, or if multiple visits must be made to the same households to complete the interview. Survey quality can decrease if the number of completed cases falls, especially if respondents differ fromnonrespondents. Both timeliness and quality can be affected if more, and more complex, adjustmentsmust be made in post-collection processing (such as adjusting survey weights) and the adjustments donot fully compensate for the differences between respondents and nonrespondents. Because of thesepotential effects, survey managers expend considerable effort designing their data collection instruments,altering their collection mode, and refining their field methods trying to maintain, as well as improve,response rates.
This paper focuses on nonresponse in six large, continuing household surveys: the CurrentPopulation Survey (CPS), the Consumer Expenditure (CE) Diary and Quarterly Surveys (CED andCEQ), the National Health Interview Survey (NHIS), the National Crime Victimization Survey(NCVS), and the Survey of Income and Program Participation (SIPP). Analyzing nonresponse inthese surveys requires interagency coordination. Although the Census Bureau collects the data for all ofthem, five are sponsored by other agencies, including the Bureau of Labor Statistics, the NationalCenter for Health Statistics, and the Bureau of Justice Statistics.
These surveys provide data for key national social and economic statistics. They underpin theConsumer Price Index, the national unemployment rate, a national social indicator for the rate ofvictimization for selected crimes of violence and crimes of theft, the official measure of poverty, andeventually, the proposed new measure of poverty. Some of these six surveys also provide criticalinformation on the characteristics of victims and the consequences of victimization, the amount anddistribution of illness and health services received, and the extent of participation in government incomeand social programs. Data users and policy makers should be concerned about nonresponse becauseit may directly affect the quality of the data.
Measuring nonresponse rates across surveys and over time is an interagency task. The mostrecent study of nonresponse rates in Federal surveys was conducted by a subcommittee of the FederalCommittee on Statistical Methodology, itself an interagency group. Its review of nonresponse in 26
1 Other participating agencies include the Bureau of Labor Statistics, the Bureau of Justice Statistics, andthe National Center for Health Statistics.
2 The Census Bureau measures survey nonresponse for each interviewing cycle. Nonresponse categoriesinclude refusals, no one at home, temporarily absent, and other, for eligible units. (Ineligible units include, forexample, vacant addresses.) Nonresponse rates are the number of nonresponding units divided by the number of
eligible units.
2
federally sponsored demographic surveys between 1981 and 1991 concluded that their response ratesdid not seem to decline (Johnson et al. and Shettle et al.). Although the study was comprehensive, itwas a one-time assessment of levels and trends in nonresponse. There now is nearly a decade of newinformation to review. In addition, there is the widely held view that, over a 20-year period, "responserates are declining, and have been doing so for some time" (Groves and Couper 1998). Finally, whilenonresponse rates remained relatively low in some Federal surveys in the 1990s, it was recognized thatmany survey managers and sponsors were putting increasing effort and resources into attempts toreduce nonresponse.
To address current nonresponse issues in these six surveys, the Bureau of Census and severalof its survey sponsors1 formed the Interagency Household Survey Nonresponse Group (IHSNG) in theSpring of 1997. This paper reports on the IHSNG’s initial project.
A. Recent Trends in Nonresponse Rates, 1990-1997
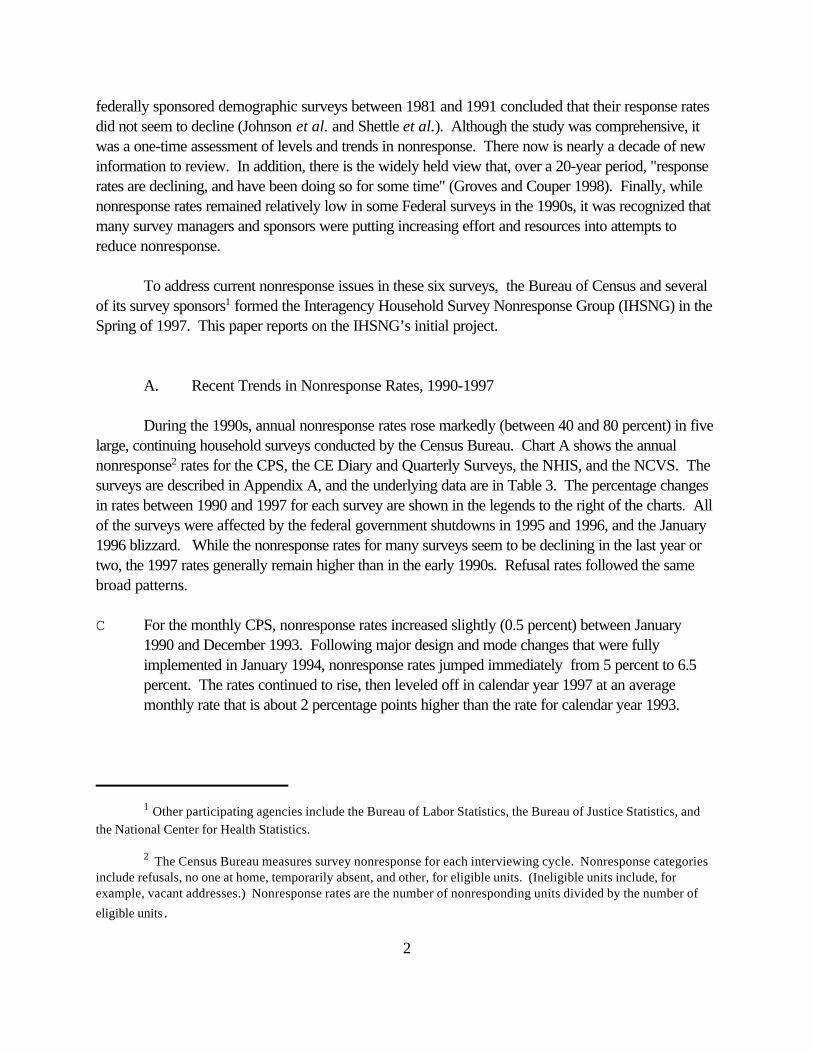
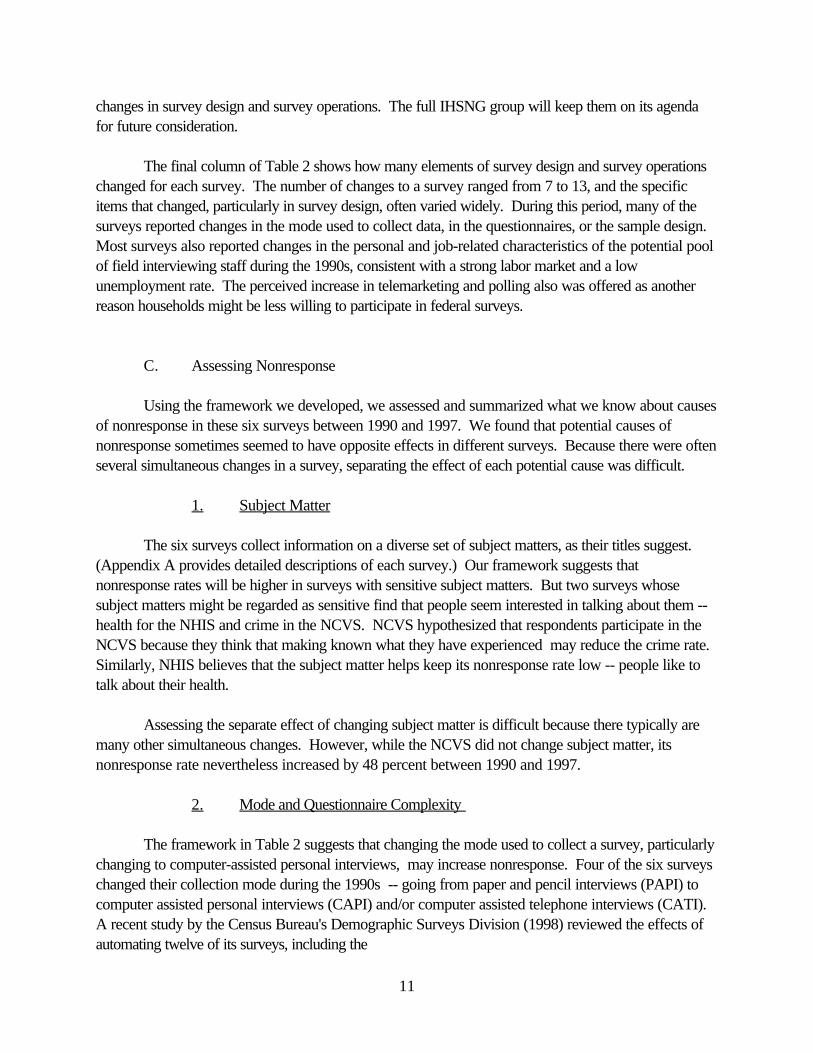
During the 1990s, annual nonresponse rates rose markedly (between 40 and 80 percent) in fivelarge, continuing household surveys conducted by the Census Bureau. Chart A shows the annualnonresponse2 rates for the CPS, the CE Diary and Quarterly Surveys, the NHIS, and the NCVS. Thesurveys are described in Appendix A, and the underlying data are in Table 3. The percentage changesin rates between 1990 and 1997 for each survey are shown in the legends to the right of the charts. Allof the surveys were affected by the federal government shutdowns in 1995 and 1996, and the January1996 blizzard. While the nonresponse rates for many surveys seem to be declining in the last year ortwo, the 1997 rates generally remain higher than in the early 1990s. Refusal rates followed the samebroad patterns.
C For the monthly CPS, nonresponse rates increased slightly (0.5 percent) between January1990 and December 1993. Following major design and mode changes that were fullyimplemented in January 1994, nonresponse rates jumped immediately from 5 percent to 6.5percent. The rates continued to rise, then leveled off in calendar year 1997 at an averagemonthly rate that is about 2 percentage points higher than the rate for calendar year 1993.

3
< For the CE Diary and Quarterly Surveys, as with most surveys of consumption, nonresponserates have always been higher than in the other three surveys. During the 1990s, that differencewidened. Nonresponse rates that had been around 14% since the 1980s began rising in 1994. By 1997, the nonresponse rates were 19% for CE Quarterly Survey and 23% for the CE DiarySurvey.
3
0.0
5.0
10.0
15.0
20.0
25.0
30.0
1 2 3 4 5 6 7 8 9 10
Interview
Per
cen
t
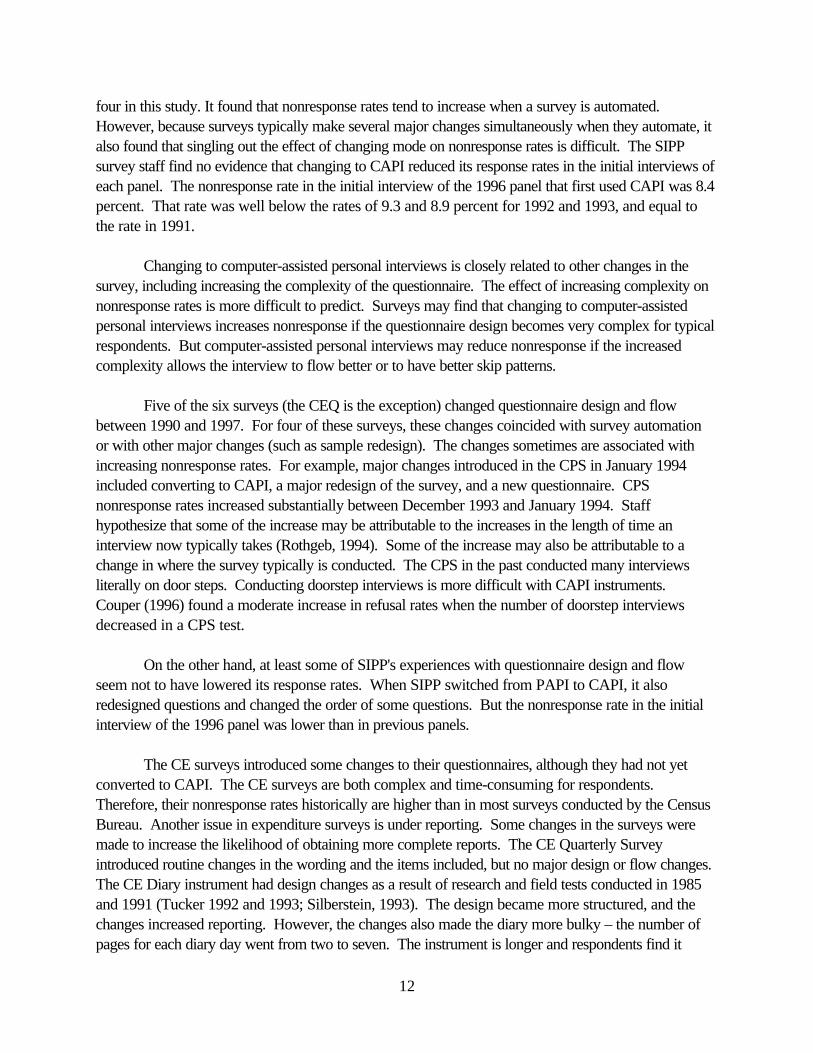
1990
1991
1992
1993
1996
Chart BSIPP nonresponse rates by panel, 1990 - 1997
0
5
10
15
20
25
30
1990 1991 1992 1993 1994 1995 1996 1997
Per
cen
t
CPS 60%
NCVS 48%
NHIS 64%
CE - Quarterly 39%
CE - Diary 76%
Chart ANonresponse rates by Survey, 1990-1997
Percentage change in the nonresponse rate from 1990 to 1997.
4
< For the NHIS, the annual nonresponse rate during 1990 - 1997 was 5.3 percent. This was anoticeable increase from 1970-1989, when the average was 3.7 percent.
< For the NCVS, annual nonresponse rates increased from about 3 percent to 5 percent between1990 and 1997.
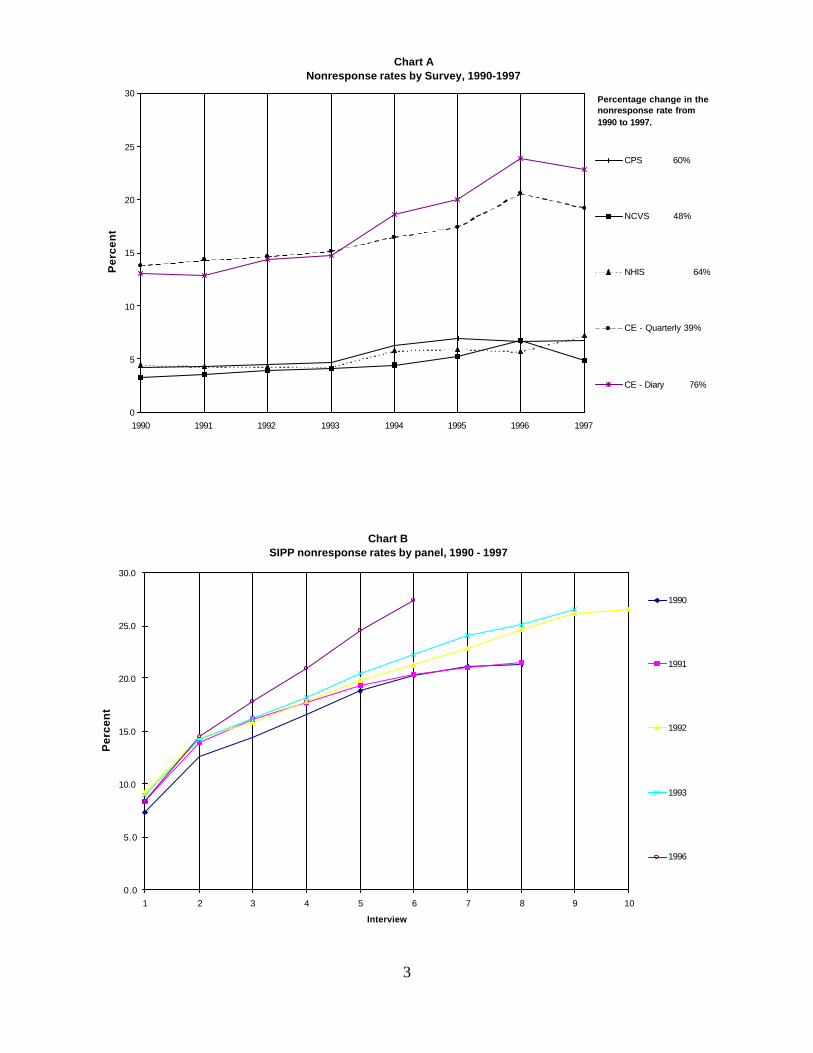
Chart B shows nonresponse rates over the same period for another large, continuing surveyconducted by the Census Bureau, the Survey of Income and Program Participation (SIPP). Rates areshown separately for its 1990 through 1993 panels and for its 1996 panel (no panels were introducedin 1994, 1995, or 1997). Nonresponse rates for the initial interview (or wave) of each panel rose from1990 through 1993. Nonresponse rates for all SIPP panels typically rise quickly with successiveinterviews.
B. Making Appropriate Comparisons
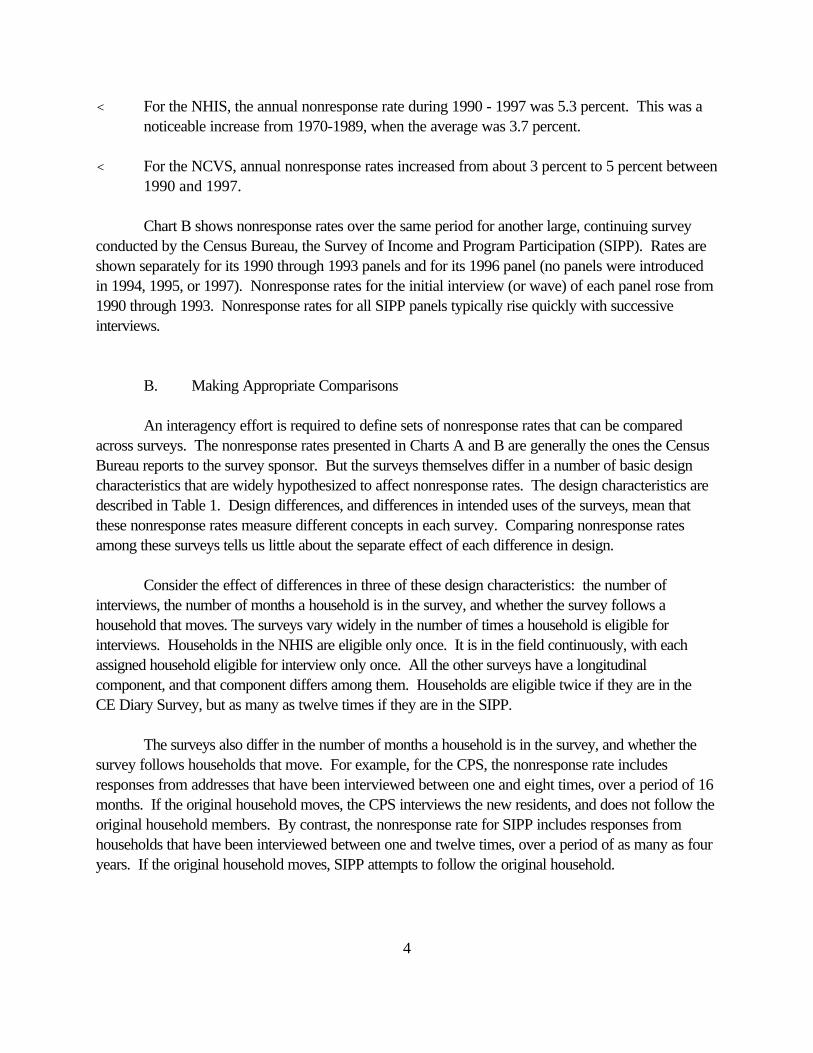
An interagency effort is required to define sets of nonresponse rates that can be comparedacross surveys. The nonresponse rates presented in Charts A and B are generally the ones the CensusBureau reports to the survey sponsor. But the surveys themselves differ in a number of basic designcharacteristics that are widely hypothesized to affect nonresponse rates. The design characteristics aredescribed in Table 1. Design differences, and differences in intended uses of the surveys, mean thatthese nonresponse rates measure different concepts in each survey. Comparing nonresponse ratesamong these surveys tells us little about the separate effect of each difference in design.
Consider the effect of differences in three of these design characteristics: the number ofinterviews, the number of months a household is in the survey, and whether the survey follows ahousehold that moves. The surveys vary widely in the number of times a household is eligible forinterviews. Households in the NHIS are eligible only once. It is in the field continuously, with eachassigned household eligible for interview only once. All the other surveys have a longitudinalcomponent, and that component differs among them. Households are eligible twice if they are in theCE Diary Survey, but as many as twelve times if they are in the SIPP.
The surveys also differ in the number of months a household is in the survey, and whether thesurvey follows households that move. For example, for the CPS, the nonresponse rate includesresponses from addresses that have been interviewed between one and eight times, over a period of 16months. If the original household moves, the CPS interviews the new residents, and does not follow theoriginal household members. By contrast, the nonresponse rate for SIPP includes responses fromhouseholds that have been interviewed between one and twelve times, over a period of as many as fouryears. If the original household moves, SIPP attempts to follow the original household.
5
Table 1
Differences in Design Characteristics of Selected Household Surveys
Design Characteristic CED CEQ CPS NCVS NHIS SIPP
Number of Interviews 2 5 8 7 1 12
Months in survey 0.5 13 16 36 --- 48
Mover Follow-Up No No No No --- Yes
Survey Mode PAPI PAPI CAPI/CATI PAPI/CATI CAPI CAPI
Respondent Rules for Basic Survey
Any Household Member or Self Response Any Any Any Self Any Self
Age Limit on Respondent 16+ 16+ 15+ 12+ 18+ 15+
Response for Entire Household or Each Member Entire Entire Each Each Each Each
Self Response Required No No No YesYes for AdultSection Yes
Proxies Accepted No No No No No Yes
PAPICAPICATI
Paper and pencil (personal) interviewComputer-assisted personal interviewComputer-assisted telephone interview
II. Interagency Analysis of Nonresponse in Six Large, Continuing Federal Surveys
Nonresponse is a multi-faceted concept and many of the factors hypothesized to affect itinteract with one another. This complexity makes nonresponse a difficult issue for any single agency toaddress in isolation. IHSNG, as an interagency group, can draw on more resources, and can attempt abroader and more systematic review than any one survey or agency could manage on its own. Byworking together, IHSNG hoped to identify knowledge that carries across these six surveys, identifygaps that remain, develop methods to rank those gaps, and propose combined research strategies to fillthem. We also expected to benefit from routine and focused opportunities to share insights about keyaspects of our survey processes.
6
As a first step, we reviewed group members' research and the broader research literature onnonresponse (including, for example, Groves and Couper 1998). We realized that we did not have aunified framework for thinking about nonresponse issues in a cross-survey, interagency context. Drawing on the existing literature, we developed a new framework and used it to assess what we knowabout nonresponse in these six surveys. What we found surprised us. Potential causes of nonresponsesometimes seemed to have opposite effects in different surveys. Separating the effect of each potentialcause was difficult because there often were several simultaneous changes. The difficulties weencountered in making these assessments led us to the recommendations in the next section.
A. A New Interagency Approach to Improving Nonresponse
IHSNG initially took a case study approach, drawing together hypotheses and evidence aboutnonresponse in these six large, continuing household surveys. The surveys share enough similarities tobenefit from a combined, interagency review. After looking at each survey individually, IHSNG soughtconsistent trends or reasons for nonresponse across surveys. The evidence generally came from theCensus Bureau’s real time operations, rather than from controlled experiments designed to testhypotheses about nonresponse. Each of the six surveys had done some research in an effort to explainits nonresponse rate, and several had changed practices and methodology to try to affect their responserates. The review, however, validated Groves and Couper's (1998) concerns that case studiescommonly have too many survey components changing simultaneously to provide conclusive tests ofhypotheses. We also realized that we did not have a unified framework for forming and testinghypotheses in our applied survey work. Without a unified and consistent framework, we can not besure whether the research and practices tackled just the easy causes or the core causes. Nor can wereadily assess their success or failure, or generalize their applicability across surveys.
B. A Framework for Thinking About Nonresponse
The IHSNG subgroup developed its own framework for thinking about possible sources ofnonresponse in these six surveys. This framework divides the components of nonresponse into fourmajor areas:
< survey design, < survey operations, < interviewer characteristics, < and social, economic, and political environment.
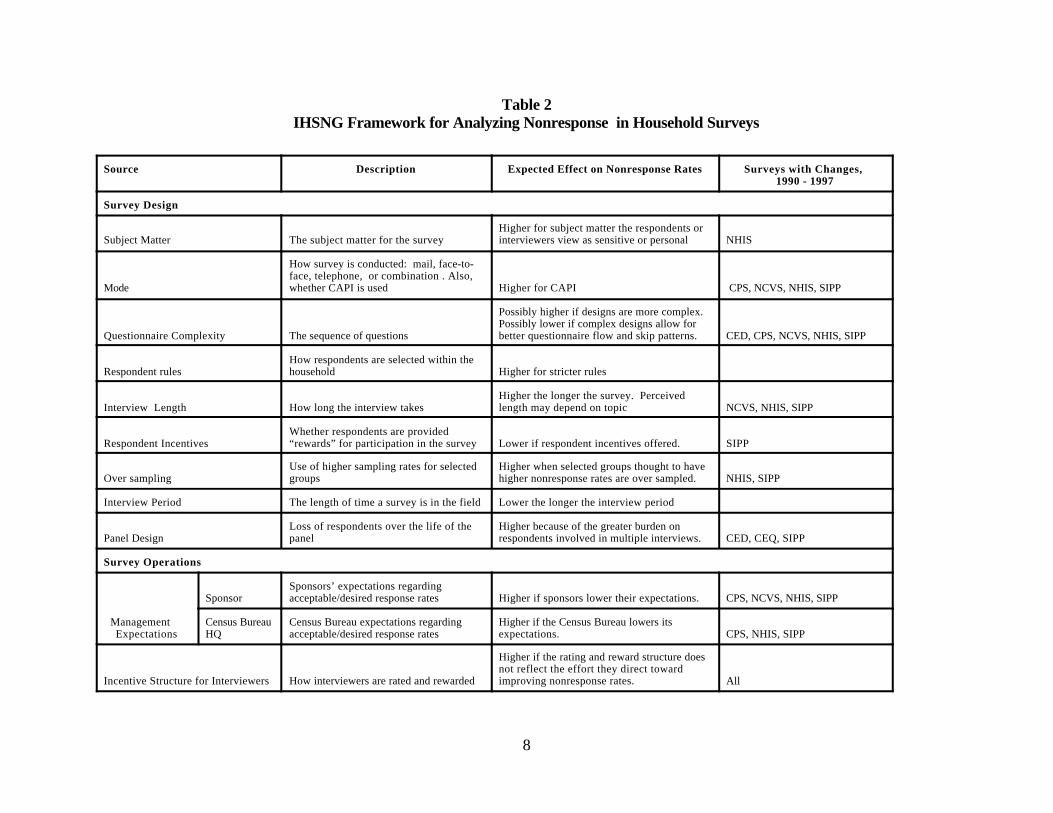
We show in Table 2 the specific issues within each broad area that the group believed mightaffect nonresponse rates, and our hypotheses about the direction of the effect. This initial reportfocuses on only two areas -- survey design and survey operations. Detailed differences in surveydesigns were highlighted in Table 1. These areas are directly under the control of the survey sponsorsand the Bureau of the Census. Focusing on these areas allowed us to draw on the research that

7
agencies had already undertaken and presented to the IHSNG group. The remaining two areas --interviewer characteristics and the social, economic, and political environment -- clearly also areimportant in explaining nonresponse (see, for example, Harris-Kojetin and Tucker). These areas areshaded in Table 2. Changes in these areas may lead to
8
Table 2IHSNG Framework for Analyzing Nonresponse in Household Surveys
Source Description Expected Effect on Nonresponse Rates Surveys with Changes, 1990 - 1997
Survey Design
Subject Matter The subject matter for the surveyHigher for subject matter the respondents orinterviewers view as sensitive or personal NHIS
Mode
How survey is conducted: mail, face-to-face, telephone, or combination . Also,whether CAPI is used Higher for CAPI CPS, NCVS, NHIS, SIPP
Questionnaire Complexity The sequence of questions
Possibly higher if designs are more complex.Possibly lower if complex designs allow forbetter questionnaire flow and skip patterns. CED, CPS, NCVS, NHIS, SIPP
Respondent rulesHow respondents are selected within the household Higher for stricter rules
Interview Length How long the interview takesHigher the longer the survey. Perceivedlength may depend on topic NCVS, NHIS, SIPP
Respondent IncentivesWhether respondents are provided“rewards” for participation in the survey Lower if respondent incentives offered. SIPP
Over samplingUse of higher sampling rates for selectedgroups
Higher when selected groups thought to havehigher nonresponse rates are over sampled. NHIS, SIPP
Interview Period The length of time a survey is in the field Lower the longer the interview period
Panel Design Loss of respondents over the life of thepanel
Higher because of the greater burden onrespondents involved in multiple interviews. CED, CEQ, SIPP
Survey Operations
Management Expectations
SponsorSponsors’ expectations regardingacceptable/desired response rates Higher if sponsors lower their expectations. CPS, NCVS, NHIS, SIPP
Census BureauHQ
Census Bureau expectations regardingacceptable/desired response rates
Higher if the Census Bureau lowers itsexpectations. CPS, NHIS, SIPP
Incentive Structure for Interviewers How interviewers are rated and rewarded
Higher if the rating and reward structure doesnot reflect the effort they direct towardimproving nonresponse rates. All
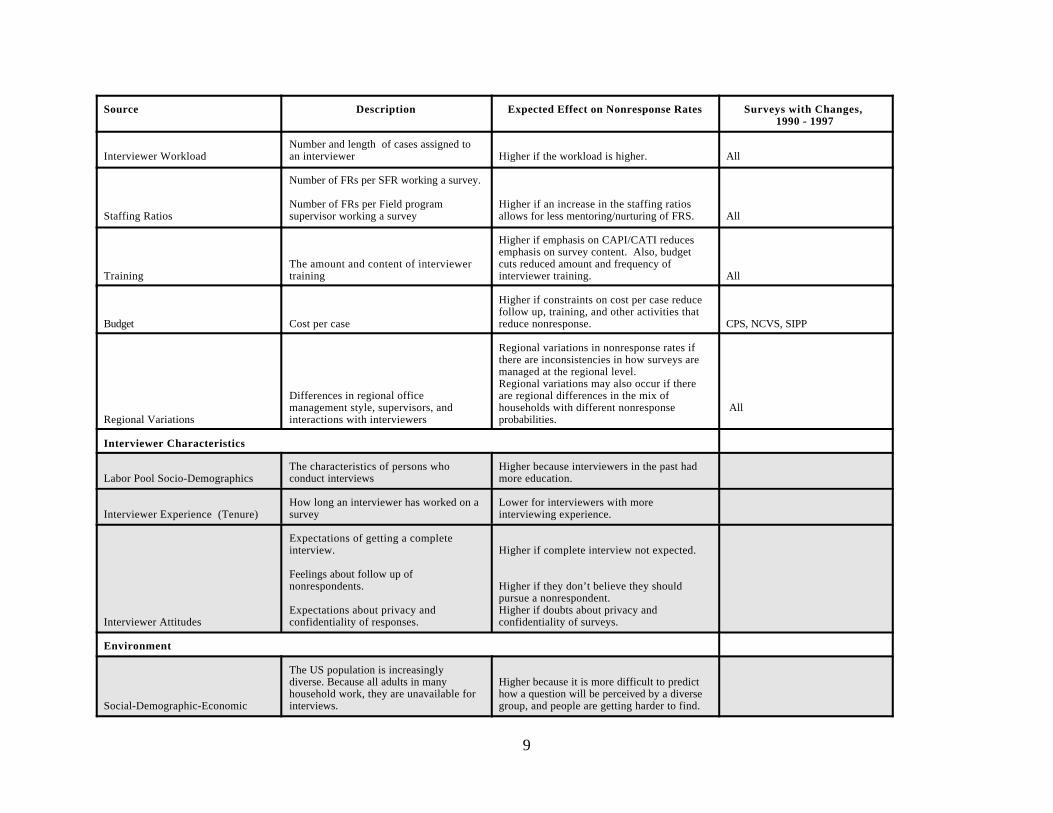
Source Description Expected Effect on Nonresponse Rates Surveys with Changes, 1990 - 1997
9
Interviewer WorkloadNumber and length of cases assigned toan interviewer Higher if the workload is higher. All
Staffing Ratios
Number of FRs per SFR working a survey.
Number of FRs per Field programsupervisor working a survey
Higher if an increase in the staffing ratiosallows for less mentoring/nurturing of FRS. All
Training The amount and content of interviewertraining
Higher if emphasis on CAPI/CATI reducesemphasis on survey content. Also, budgetcuts reduced amount and frequency ofinterviewer training. All
Budget Cost per case
Higher if constraints on cost per case reducefollow up, training, and other activities thatreduce nonresponse. CPS, NCVS, SIPP
Regional Variations
Differences in regional officemanagement style, supervisors, andinteractions with interviewers
Regional variations in nonresponse rates ifthere are inconsistencies in how surveys aremanaged at the regional level. Regional variations may also occur if thereare regional differences in the mix ofhouseholds with different nonresponseprobabilities.
All
Interviewer Characteristics
Labor Pool Socio-DemographicsThe characteristics of persons whoconduct interviews
Higher because interviewers in the past hadmore education.
Interviewer Experience (Tenure)How long an interviewer has worked on asurvey
Lower for interviewers with moreinterviewing experience.
Interviewer Attitudes
Expectations of getting a completeinterview.
Feelings about follow up ofnonrespondents.
Expectations about privacy andconfidentiality of responses.
Higher if complete interview not expected.
Higher if they don’t believe they shouldpursue a nonrespondent. Higher if doubts about privacy andconfidentiality of surveys.
Environment
Social-Demographic-Economic
The US population is increasinglydiverse. Because all adults in manyhousehold work, they are unavailable forinterviews.
Higher because it is more difficult to predicthow a question will be perceived by a diversegroup, and people are getting harder to find.
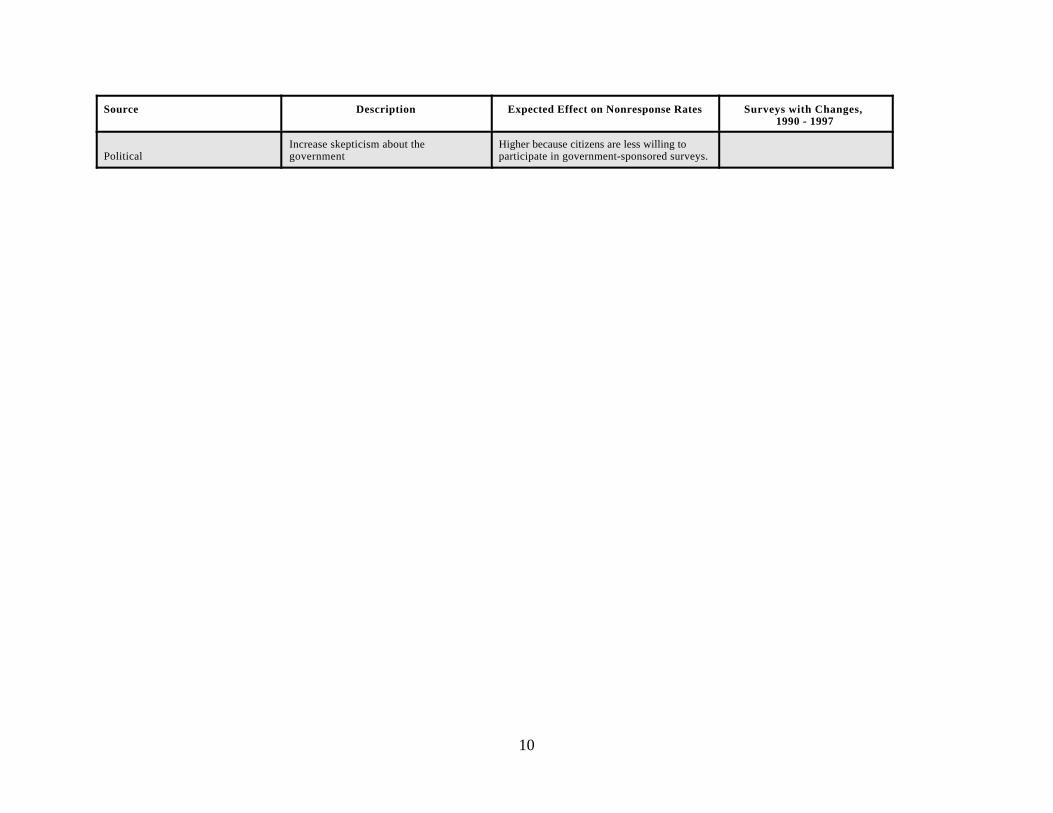
Source Description Expected Effect on Nonresponse Rates Surveys with Changes, 1990 - 1997
10
PoliticalIncrease skepticism about thegovernment
Higher because citizens are less willing toparticipate in government-sponsored surveys.
11
changes in survey design and survey operations. The full IHSNG group will keep them on its agendafor future consideration.
The final column of Table 2 shows how many elements of survey design and survey operationschanged for each survey. The number of changes to a survey ranged from 7 to 13, and the specificitems that changed, particularly in survey design, often varied widely. During this period, many of thesurveys reported changes in the mode used to collect data, in the questionnaires, or the sample design. Most surveys also reported changes in the personal and job-related characteristics of the potential poolof field interviewing staff during the 1990s, consistent with a strong labor market and a lowunemployment rate. The perceived increase in telemarketing and polling also was offered as anotherreason households might be less willing to participate in federal surveys.
C. Assessing Nonresponse
Using the framework we developed, we assessed and summarized what we know about causesof nonresponse in these six surveys between 1990 and 1997. We found that potential causes ofnonresponse sometimes seemed to have opposite effects in different surveys. Because there were oftenseveral simultaneous changes in a survey, separating the effect of each potential cause was difficult.
1. Subject Matter
The six surveys collect information on a diverse set of subject matters, as their titles suggest. (Appendix A provides detailed descriptions of each survey.) Our framework suggests thatnonresponse rates will be higher in surveys with sensitive subject matters. But two surveys whosesubject matters might be regarded as sensitive find that people seem interested in talking about them --health for the NHIS and crime in the NCVS. NCVS hypothesized that respondents participate in theNCVS because they think that making known what they have experienced may reduce the crime rate. Similarly, NHIS believes that the subject matter helps keep its nonresponse rate low -- people like totalk about their health.
Assessing the separate effect of changing subject matter is difficult because there typically aremany other simultaneous changes. However, while the NCVS did not change subject matter, itsnonresponse rate nevertheless increased by 48 percent between 1990 and 1997.
2. Mode and Questionnaire Complexity
The framework in Table 2 suggests that changing the mode used to collect a survey, particularlychanging to computer-assisted personal interviews, may increase nonresponse. Four of the six surveyschanged their collection mode during the 1990s -- going from paper and pencil interviews (PAPI) tocomputer assisted personal interviews (CAPI) and/or computer assisted telephone interviews (CATI). A recent study by the Census Bureau's Demographic Surveys Division (1998) reviewed the effects ofautomating twelve of its surveys, including the
12
four in this study. It found that nonresponse rates tend to increase when a survey is automated. However, because surveys typically make several major changes simultaneously when they automate, italso found that singling out the effect of changing mode on nonresponse rates is difficult. The SIPPsurvey staff find no evidence that changing to CAPI reduced its response rates in the initial interviews ofeach panel. The nonresponse rate in the initial interview of the 1996 panel that first used CAPI was 8.4percent. That rate was well below the rates of 9.3 and 8.9 percent for 1992 and 1993, and equal tothe rate in 1991.
Changing to computer-assisted personal interviews is closely related to other changes in thesurvey, including increasing the complexity of the questionnaire. The effect of increasing complexity onnonresponse rates is more difficult to predict. Surveys may find that changing to computer-assistedpersonal interviews increases nonresponse if the questionnaire design becomes very complex for typicalrespondents. But computer-assisted personal interviews may reduce nonresponse if the increasedcomplexity allows the interview to flow better or to have better skip patterns.
Five of the six surveys (the CEQ is the exception) changed questionnaire design and flowbetween 1990 and 1997. For four of these surveys, these changes coincided with survey automationor with other major changes (such as sample redesign). The changes sometimes are associated withincreasing nonresponse rates. For example, major changes introduced in the CPS in January 1994included converting to CAPI, a major redesign of the survey, and a new questionnaire. CPSnonresponse rates increased substantially between December 1993 and January 1994. Staffhypothesize that some of the increase may be attributable to the increases in the length of time aninterview now typically takes (Rothgeb, 1994). Some of the increase may also be attributable to achange in where the survey typically is conducted. The CPS in the past conducted many interviewsliterally on door steps. Conducting doorstep interviews is more difficult with CAPI instruments. Couper (1996) found a moderate increase in refusal rates when the number of doorstep interviewsdecreased in a CPS test.
On the other hand, at least some of SIPP's experiences with questionnaire design and flowseem not to have lowered its response rates. When SIPP switched from PAPI to CAPI, it alsoredesigned questions and changed the order of some questions. But the nonresponse rate in the initialinterview of the 1996 panel was lower than in previous panels.
The CE surveys introduced some changes to their questionnaires, although they had not yetconverted to CAPI. The CE surveys are both complex and time-consuming for respondents. Therefore, their nonresponse rates historically are higher than in most surveys conducted by the CensusBureau. Another issue in expenditure surveys is under reporting. Some changes in the surveys weremade to increase the likelihood of obtaining more complete reports. The CE Quarterly Surveyintroduced routine changes in the wording and the items included, but no major design or flow changes. The CE Diary instrument had design changes as a result of research and field tests conducted in 1985and 1991 (Tucker 1992 and 1993; Silberstein, 1993). The design became more structured, and thechanges increased reporting. However, the changes also made the diary more bulky – the number ofpages for each diary day went from two to seven. The instrument is longer and respondents find it

13
harder to locate the proper place to enter their expenses. This factor may have had an effect onnonresponse especially for the second diary
14
week. The 1994-1997 noninterview rates for week 2 were, on average, 3 percentage points greaterthan the rates for week 1. However, a direct relationship cannot be assessed since the instrumentchanges occurred three years earlier than the rise in nonresponse.
3. Interview Length
One long-held belief is that nonresponse rates increase as the length of time each interviewtakes to complete increases. The survey methodology literature, however, finds little relationshipbetween the length of the interview and the response rate (Bogen 1996). We found that the evidencealso is mixed for the two surveys (NHIS and SIPP) whose interview length changed significantly duringthe 1990s.
When the NHIS added more special topical supplements than usual in 1994 and 1995, theinterview lengthened by 45 - 65 minutes, and its nonresponse rates also increased sharply. TheseNHIS supplements were complex to administer, and so large that they had to be split between twobooklets in addition to the core questionnaire booklet. There were fewer supplements in 1996, andnone in 1997. The NHIS nonresponse rate increased from 4.2 percent in 1993 to 7.2 percent in 1997. But during the same period, the NHIS also introduced a new sample and changed the mode it uses tocollect data.
SIPP’s experience differed from NHIS. When the SIPP adult interview lengthened in the 1996panel, there was no evidence that the nonresponse rate increased. However, SIPP made severalsimultaneous changes, including raising its expectations about the nonresponse rates that could beachieved. This makes it difficult to separate out the effect of interview length.
4. Respondent Incentives
Respondents typically receive no compensation or other concrete reward for participating in asurvey. Giving respondents incentives for participating may increase their response rates. SIPPexperimented with respondent incentives during the 1990s. The Census Bureau recognized in 1995that nonresponse could rise to an unacceptable level by the end of the 1996 panel. There was alsoevidence that low income households left SIPP at a higher rate than other income types (Sae-Ung andWinters, 1998). A plausible means of maintaining higher response rates in general and in particular forlow income households was to offer incentives to SIPP sample households. An experiment to offer atoken of appreciation to a subsample of SIPP sample cases at initial contact of the 1996 panel wasapproved by OMB. Results show that the $20 incentive significantly reduces the overall initial contactnonresponse rates and nonresponse rates in the high poverty stratum. There is some evidence that thebeneficial effects of the incentives continues into later waves of the 1996 panel. The design of the SIPPexperiment and more detailed results are given in James (1997) and Mack et al. (1998). This result isconsistent with findings in incentive literature (Willimack,1995; Berlin, 1992; Butler, 1991; and Ferber,1974).
5. Oversampling
15
Both NHIS and SIPP changed their oversampling strategy during the 1990s. In the 1985-1994 NHIS sample design, Black persons were oversampled. In 1995, a new sample design was introduced in NHIS which included oversampling households in areas with higher proportions of Blacksand/or Hispanic members. In addition, some households were designated as "screener households"and were interviewed only when they contained Black and/or Hispanic persons. Project managersexpected this new 1990-based sample to have a neutral effect on unweighted response rates. The1995 rate of 5.9 percent was about the same as the 1994 rate of 5.8 percent.
SIPP found that it had higher nonresponse rates in key population subgroups, such as personsin families with incomes below the poverty level. In response to analysts' concerns that these highernonresponse rates for key subgroups diminished the usefulness of the SIPP data to meet its goals, theCensus Bureau made an effort to oversample the low income population. SIPP survey designersdecided to make use of the 1990 decennial census information available on the sampling frame to assignthe universe of addresses into two strata, one with a higher proportion of poverty households. Bureaustatisticians selected a sample disproportionately higher in the high poverty stratum. Respondents insome areas received incentives (Huggins and King, 1997). Because oversampling and incentives wereintroduced simultaneously in SIPP, it is difficult to isolate the effects of oversampling. In areas wheresample cases did not receive incentives, the high and low poverty strata had nonresponse rates thatwere about the same (9.28% vs 8.98%). However, in areas that received the $20 incentive, the highpoverty stratum had lower nonresponse rates at first contact than the low poverty strata (5.94% vs8.15%), and these differences were statistically significant (James, 1997).
6. Panel Design
The nonresponse rate in panel surveys may be related to the number of times the samehousehold is interviewed. This relationship (panel attrition) may occur for several reasons. Panelsurveys place a greater burden on respondents than do one-time surveys. Households who initiallyparticipate may decide not to respond to some of the subsequent interviews. Households who initiallyrefuse to participate are unlikely to change their mind when asked to participate in subsequentinterviews. Surveys also differ in the emphasis they place in subsequent waves on attempting to contactthese households. SIPP is required to interview households rather than addresses, but is not alwayssuccessful in finding find new addresses for households who move. For all five of the surveys with apanel component, there was some increase in panel attrition between 1990 and 1997.
Procedures for following households that move affect panel attrition in SIPP. SIPP's panelattrition increased between the 1990 and the 1991-1993 panels. A detailed analysis of the increase innonresponse in the subsequent waves of these panels showed that it was due to reduced success inlocating a household that moved, and not to an increase in nonresponse among households who had notmoved (King, 1995). This led to several changes in field procedures for handling households thatmoved in the 1996 panel (Waite, et al., 1997). As a result, panel attrition due to difficulties in followinghouseholds that move is lower in the 1996 panel than in the 1991-1993 panels. However, panelattrition among households that did not move is higher in the 1996 panel.
3Complete participation rates are computed for units eligible at the first interview and still eligible at the lastpanel wave. The rates represent the percentage of eligible units that are still respondents at the final interview andcompleted all the panel interviews.
16
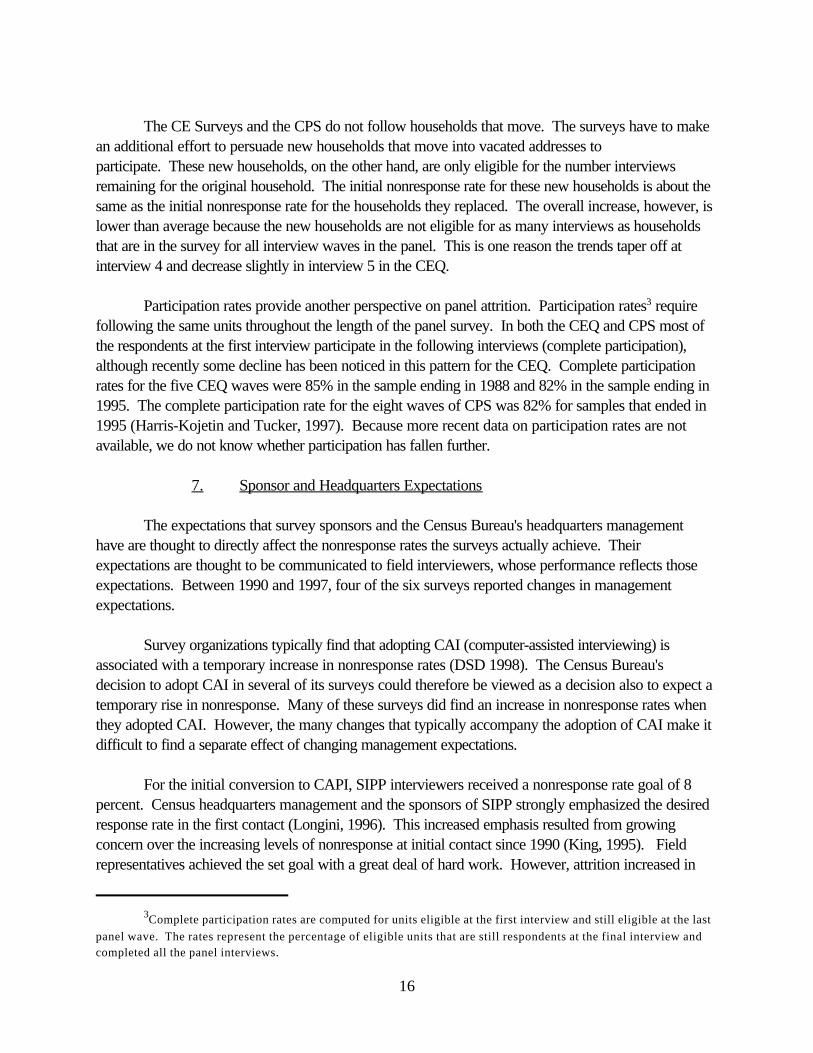
The CE Surveys and the CPS do not follow households that move. The surveys have to makean additional effort to persuade new households that move into vacated addresses to participate. These new households, on the other hand, are only eligible for the number interviewsremaining for the original household. The initial nonresponse rate for these new households is about thesame as the initial nonresponse rate for the households they replaced. The overall increase, however, islower than average because the new households are not eligible for as many interviews as householdsthat are in the survey for all interview waves in the panel. This is one reason the trends taper off atinterview 4 and decrease slightly in interview 5 in the CEQ.
Participation rates provide another perspective on panel attrition. Participation rates3 requirefollowing the same units throughout the length of the panel survey. In both the CEQ and CPS most ofthe respondents at the first interview participate in the following interviews (complete participation),although recently some decline has been noticed in this pattern for the CEQ. Complete participationrates for the five CEQ waves were 85% in the sample ending in 1988 and 82% in the sample ending in1995. The complete participation rate for the eight waves of CPS was 82% for samples that ended in1995 (Harris-Kojetin and Tucker, 1997). Because more recent data on participation rates are notavailable, we do not know whether participation has fallen further.
7. Sponsor and Headquarters Expectations
The expectations that survey sponsors and the Census Bureau's headquarters managementhave are thought to directly affect the nonresponse rates the surveys actually achieve. Theirexpectations are thought to be communicated to field interviewers, whose performance reflects thoseexpectations. Between 1990 and 1997, four of the six surveys reported changes in managementexpectations.
Survey organizations typically find that adopting CAI (computer-assisted interviewing) isassociated with a temporary increase in nonresponse rates (DSD 1998). The Census Bureau'sdecision to adopt CAI in several of its surveys could therefore be viewed as a decision also to expect atemporary rise in nonresponse. Many of these surveys did find an increase in nonresponse rates whenthey adopted CAI. However, the many changes that typically accompany the adoption of CAI make itdifficult to find a separate effect of changing management expectations.
For the initial conversion to CAPI, SIPP interviewers received a nonresponse rate goal of 8percent. Census headquarters management and the sponsors of SIPP strongly emphasized the desiredresponse rate in the first contact (Longini, 1996). This increased emphasis resulted from growingconcern over the increasing levels of nonresponse at initial contact since 1990 (King, 1995). Fieldrepresentatives achieved the set goal with a great deal of hard work. However, attrition increased in
17
subsequent waves, reaching levels higher than before. Some speculate that the demand for a highresponse rate in the first contact brought in more reluctant participants than before and that thesereluctant respondents left the survey shortly after the first contact.
8. Incentive Structure for Interviewers
The interviewer's job is multi-faceted. If some aspects of their jobs are better compensatedthan others, interviewers may well focus on them, at the expense of others. All of the surveys reporteda change in the incentive structure for interviewers between 1990 and 1997, although there is somedisagreement over whether these changes reflect the effects of the change in interviewing environmentor themselves have contributed to the increase in nonresponse rates. For example, up until recently,SIPP interviewers were evaluated on their household nonresponse rate and production time. Locatinghouseholds that moved was given lower priority than keeping refusal rates low. For the 1996 panel,nonresponse rates for households who moved were included in the interviewer's rating to reinforce thefact that locating these households is as important as keeping a reluctant sample household participating. This change may be contributing to the different patterns of nonresponse cases we see in the 1996panel (Waite et al., 1997). Rewarding interviewers for finding a household that moved or bringing anonresponding household back into sample has been proposed but there are no plans to implement thisproposal at this time.
The Census Bureau recently introduced a pilot goalsharing project for CPS. Interviewersreceive a bonus payout when regional cost and nonresponse rates decline. While preliminarygoalsharing data show a decrease in nonresponse rates during the 3-month pilot, the results of thisproject should be closely reviewed over time, and as the project is extended to other surveys.
9. Interviewer Workload
Higher workloads for interviewers might lead to higher nonresponse rates. Interviewers mayfeel they can not spend the time required to secure participation by a reluctant household, but must goon to the next household or the next survey. All of the surveys reported an increase in interviewerworkloads during the 1990s. For instance, the 1994 and 1995 NHIS data collection included fieldingimmunization and disability supplements. These supplements were complex to administer, and so largethat they had to be split between two booklets in addition to the core questionnaire booklet. Theinterviewers' caseloads were not reduced, even though these supplements added another 45 to 65minutes to the interviewing time for each household. One hypothesis is that the increased workloadmay have contributed to the increase in NHIS nonresponse rates in 1994 and 1995. However, whenthere was a shorter NHIS questionnaire in 1996, the expected decrease in nonresponse rates to theearlier level did not occur.
10. Training
18
As interviewers have more training and gain familiarity with CAPI, nonresponse rates would beexpected to fall. However, none of the surveys that adopted CAI have yet observed a return to pre-CAI nonresponse rates.
11. Budget
Surveys all have limited resources. Many other aspects of the survey compete for scarce staffand financial resources, and sponsors and managers may set different priorities in different surveys, or at different times. Changes in the project budget, or in the portion of it allocated to reducingnonresponse rates, clearly may affect nonresponse rates. For example, some survey sponsors have attimes decided to accept the initial nonresponse obtained, rather than incurring the expense of additionalfollow up.
III. A Framework for the Future
The full IHSNG group initially reviewed the nonresponse literature and the Census Bureau’srecent experiences with six large and continuing surveys. We found that nonresponse is indeed acurrent problem for these surveys. The subgroup formed to synthesize that work and prepare thisreport found that the surveys often had contradictory experiences, making it difficult to drawconclusions even when the analysis was limited to two major sources of nonresponse for this relativelysimilar set of surveys. These difficulties led us to a series of recommendations. We need to develop anew framework for analyzing critical aspects of nonresponse that our standard tools and framework donot address.
< Define consistent sets of core nonresponse concepts and statistics. We need to determine theminimum common core sets of nonresponse statistics that we can now calculate for eachsurvey, and across surveys, and begin producing them routinely. Each set of rates should beclearly defined, to ensure that we always make nonresponse rate comparisons usingcomparable, and appropriate, statistics. As planned information systems come on line, we needto determine the new nonresponse statistics they will allow us to calculate, and add those to ourroutine reports. As new systems are developed, we need to be sure that they will continue toproduce the nonresponse rates we need, and to try to add to our capabilities.
< Develop an expanded set of consistent and appropriate concepts and statistics. The minimumset of nonresponse statistics should include the annual and initial-contact rates for the sample asa whole. The expanded set should also include nonresponse statistics appropriate to the goalsof each survey. Examples of such statistics include nonresponse rates for key populationsubgroups, for key data items, and for geographic areas, such as region, primary sampling unit,or state. The set could also include related statistics, such as attrition and cooperation rates.
< Create a single database. We need to develop one consistent and integrated database onnonresponse rates. This database could be part of a larger, consistent and integrated
19
management information system. Survey managers need better tools to gain information aboutnonresponse and to manage it in their surveys. Some of their current tools simply need to beimproved, while others need to be modified substantially. But new tools also are required. Such a system could be built incrementally. When existing survey reporting systems aremodified, modifications could be chosen that make the separate survey systems more similar toeach other, or to a common standard.
< Continue an interagency approach. The IHSNG interagency approach works, and should becontinued. The interagency, cross-survey approach provided new, and occasionally provocative, insights. Although some members of IHSNG initially were skeptical about theneed to spend resources reviewing nonresponse issues, and about the group’s ability to tacklethem, we believe it succeeded. Our experiences developing this report suggest that an on-going interagency group can foster the development of cost-effective strategies for creating andsharing knowledge about key nonresponse issues.
The full IHSNG group should continue, functioning as a steering committee that meets at leastquarterly. The full IHSNG group should form multiple, sequential subgroups charged withidentifying, developing, and implementing the new tools and frameworks for tacklingnonresponse that this initial report begins to outline.
Critical to the interagency group's success is commitment by the participating agencies.Agencies must decide that the time needed for group members to participate in the IHSNGsteering committees and task forces, to follow through on this set of recommendations, and todevelop new recommendations, is part of the group members' jobs.
A. Consistent Definitions of Nonresponse
Comparisons of nonresponse rates in different surveys, such as in the first part of this study,often present a single measure, regardless of differences in the design or purpose of the surveys. Butnonresponse rates can be calculated in a variety of ways that depend on the design and uses of thesurvey. It may be more appropriate to report not just one, but a set, of carefully defined nonresponserates.
This is not a new conclusion. A similar conclusion appeared in a 1994 paper reporting on anearlier interagency review of nonresponse in federal household surveys (Johnson, Botman, andBasiotis). That paper pointed to similar statements in a 1982 study. Most recently, the AmericanAssociation for Public Opinion Research (AAPOR) issued a report, Standard Definitions: FinalDispositions of Case Codes and Outcome Rates for RDD Telephone Surveys and In-PersonHousehold Surveys (1998), which observed that in current practice, "the same names are used todescribe fundamentally different rates and different names are sometimes applied to the same rates." The report recommends specific ways of calculating and presenting response rates from household and
20
telephone surveys. Groves and Couper (1998) also provide detailed descriptions of concepts anddefinitions of nonresponse rates.
In compiling the nonresponse rates we presented earlier in this paper, we encountered some ofthe same concerns raised in the preceding paragraph. As we showed in Table 1, the nonresponse ratespresented in Chart A compare surveys with different designs and intended uses. Those differencesdetermine first, the nonresponse measures appropriate to understanding each survey, and second, themeasures that can be compared across all six surveys.
Design differences mean that the nonresponse rates in Charts A and B measure differentconcepts in each survey. For example, for the CPS, the rate includes responses from addresses thathave been interviewed between one and eight times, over a period of 16 months. If the
21
original household moves, the CPS interviews the new residents, and does not follow the originalhousehold members. By contrast, the rate for SIPP includes responses from households that have beeninterviewed between one and twelve times, over a period of as many as four years. If the originalhousehold moves, SIPP attempts to follow the original household. Comparing these nonresponse ratestells us little about the separate effect of potential sources of nonresponse, such as the calendar time ahousehold is in a survey, the number of interviews, or the survey's procedures for following householdsthat move. Some surveys, such as the NCVS and NHIS, ultimately calculate person-based statistics. For such surveys, we need to add person-level nonresponse rates to have the information we need toevaluate a key dimension of survey quality.
We focus on one additional nonresponse measure below to illustrate how choice of measurecan affect cross-survey comparisons. Of course, we could have chosen many other measures, andcross-survey comparisons based on any one of them might lead us to distinctly different conclusionsabout nonresponse and its causes Because this analysis is preliminary, and draws on just one of manyalternative definitions, we do not make recommendations for changing survey practices in this initialreport. Instead, we focus on ways to use information we already have to generate selected additionalnonresponse rates. These rates can provide some of the insights we would need to recommendchanges in survey practices.
< We recommend that the full IHSNG group consider charging a subgroup with identifying sets ofnonresponse rates appropriate to each survey, and sets of nonresponse rates appropriate inmaking comparisons across surveys, that should be routinely produced. We also recommendthat the full IHSNG group consider charging a subsequent subgroup with evaluating the newmeasures as they are produced.
B. Initial-Contact Household Nonresponse Rates
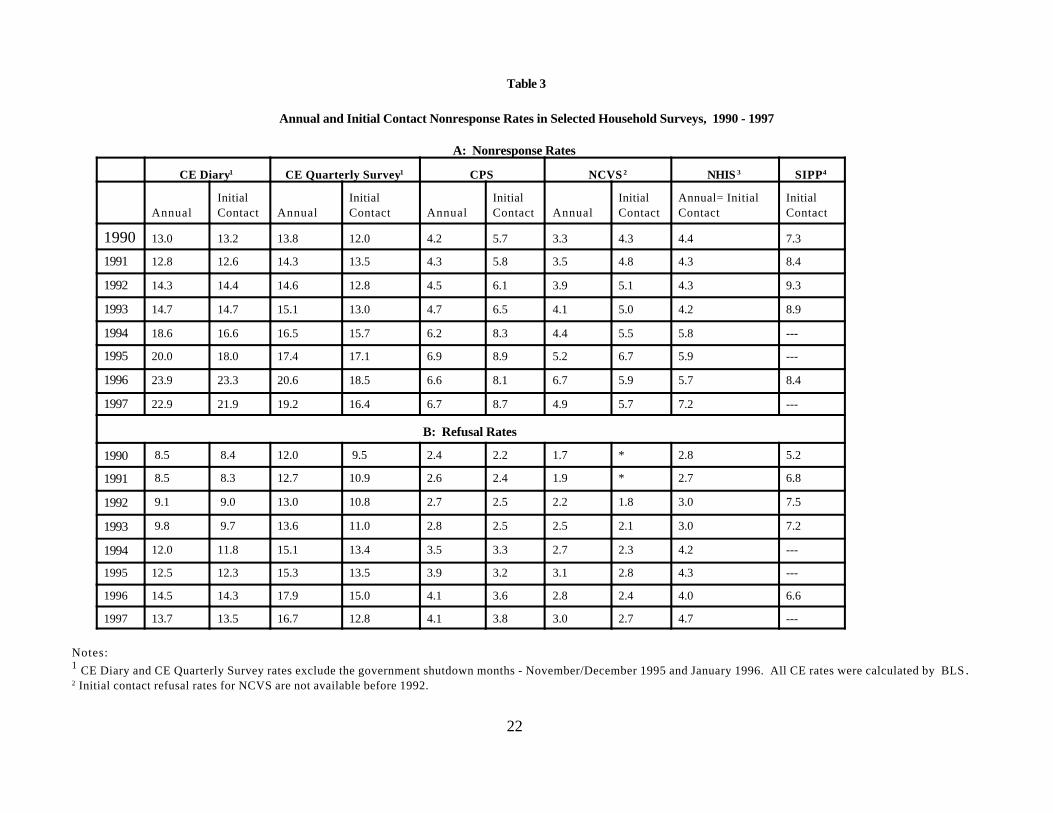
The additional nonresponse measure we examine in this report is the household-level initial-contact nonresponse rate. It is measured the first time the household is contacted for a particularsurvey. Because the initial-contact nonresponse rate is not affected by many of the differences in thepanel characteristics of these surveys, comparing them may give a clearer picture of the joint effects ofmode, questionnaire length and design, and field management. The initial-contact rates and the annualnonresponse rates in Chart A are shown in Table 3. The SIPP initial-contact rates and nonresponserates for subsequent interviews in each panel, presented in Chart B, are shown in Table 4. The initial-contact nonresponse rates, like the annual nonresponse rates, increased through the years for all sixsurveys.
22
Table 3
Annual and Initial Contact Nonresponse Rates in Selected Household Surveys, 1990 - 1997
A: Nonresponse Rates
CE Diary1 CE Quarterly Survey1 CPS NCVS 2 NHIS 3 SIPP4
AnnualInitialContact Annual
InitialContact Annual
InitialContact Annual
InitialContact
Annual= InitialContact
InitialContact
1990 13.0 13.2 13.8 12.0 4.2 5.7 3.3 4.3 4.4 7.3
1991 12.8 12.6 14.3 13.5 4.3 5.8 3.5 4.8 4.3 8.4
1992 14.3 14.4 14.6 12.8 4.5 6.1 3.9 5.1 4.3 9.3
1993 14.7 14.7 15.1 13.0 4.7 6.5 4.1 5.0 4.2 8.9
1994 18.6 16.6 16.5 15.7 6.2 8.3 4.4 5.5 5.8 ---
1995 20.0 18.0 17.4 17.1 6.9 8.9 5.2 6.7 5.9 ---
1996 23.9 23.3 20.6 18.5 6.6 8.1 6.7 5.9 5.7 8.4
1997 22.9 21.9 19.2 16.4 6.7 8.7 4.9 5.7 7.2 ---
B: Refusal Rates
1990 8.5 8.4 12.0 9.5 2.4 2.2 1.7 * 2.8 5.2
1991 8.5 8.3 12.7 10.9 2.6 2.4 1.9 * 2.7 6.8
1992 9.1 9.0 13.0 10.8 2.7 2.5 2.2 1.8 3.0 7.5
1993 9.8 9.7 13.6 11.0 2.8 2.5 2.5 2.1 3.0 7.2
1994 12.0 11.8 15.1 13.4 3.5 3.3 2.7 2.3 4.2 ---
1995 12.5 12.3 15.3 13.5 3.9 3.2 3.1 2.8 4.3 ---
1996 14.5 14.3 17.9 15.0 4.1 3.6 2.8 2.4 4.0 6.6
1997 13.7 13.5 16.7 12.8 4.1 3.8 3.0 2.7 4.7 ---
Notes:1 CE Diary and CE Quarterly Survey rates exclude the government shutdown months - November/December 1995 and January 1996. All CE rates were calculated by BLS .2 Initial contact refusal rates for NCVS are not available before 1992.

23
3 Households in the NHIS are only sampled once, so the annual and initial contact rates are the same. All NHIS rates were calculated by NCHS.4 SIPP did not initiate panels in 1994, 1995, or 1997.

24
Table 4
SIPP Nonresponse Rates by Interview Number (Wave)1990-1997
Interview Number
1 2 3 4 5 6 7 8 9 10
1990 7.3 12.6 14.4 16.5 18.8 20.2 21.1 21.3
1991 8.4 13.9 16.1 17.7 19.3 20.3 21.0 21.4
1992 9.2 14.4 15.8 17.8 19.8 21.2 22.9 24.7 26.2 26.6
1993 8.9 14.2 16.2 18.2 20.4 22.2 24.1 25.1 26.5
1994 -------
1995 -------
1996 8.4 14.5 17.8 20.9 24.6 27.4
1997 -------
The annual and initial-contact nonresponse rates clearly measure different things. However, therelationship between them is different for different surveys. (The exception is for the NHIS, becausehouseholds are only contacted once, and the two rates are the same.)
< For SIPP, the initial contact nonresponse rate is always less than the rate for subsequent interviews. Because SIPP is sometimes regarded as a survey with nonresponse problems, comparing its initialcontact rate with those of other surveys helps focus attention on potential sources of that problem. Although its nonresponse rates at initial contact are higher than most of those for NHIS and NCVS,they are close to the CPS rates, and below the rates for the CE Quarterly and Diary Surveys. It isSIPP's nonresponse rates for subsequent interviews that are higher than for other surveys, not thenonresponse rates for its initial interviews.
< For the CE Diary and Quarterly Surveys, the initial contact nonresponse rates are less than theannual nonresponse rates.
< For CPS and NCVS, the initial contact nonresponse rates are greater than the annual nonresponserates. This is not the relationship that might be expected in panel surveys where the annual ratesinclude households that have been in the survey samples as many as eight times over a 16-monthperiod (CPS) or seven times over a 36-month period (NCVS).
It is not clear why the relationships between the annual and the initial-contact nonresponse ratesdiffer among surveys. There may be important differences among the surveys in their designs and
25
procedures, in addition to the differences listed in Table 1. The surveys differ, for example, in whether theyre-contact households that were not interviewed in the initial period, whether all interviews are conducted inperson, and the amount of time interviewers have to try to get a response in each round of interviewing. Inaddition, the number of eligible households may vary as addresses move in and out of scope. This meansthat the denominator of the nonresponse rate also varies over time.
Comparing the annual and initial-contact nonresponse rates raises many important questions. Fullyexploring these comparisons is beyond the scope of this initial report, but should be addressed as part ofthe recommended task of defining appropriate and consistent nonresponse rates. The differences we foundemphasize how important it is to understand whether the surveys whose nonresponse rates we arecomparing really are comparable surveys, how hard it is to draw conclusions from case studies, and howmuch information could be gained from improved experimental designs.
C. Beyond Aggregate Household Nonresponse Rates
Because users of all six surveys are concerned about aggregate statistics derived from the entiresample, they also are concerned about the nonresponse rate for the entire sample. But users of mostsurveys also are concerned about critical statistics that apply to a subset of the sample, or to a subset of thedata. Nonresponse rates for the entire sample do not provide the information users need to evaluate thebias, or the potential for bias, in such critical statistics.
The critical statistics include estimates for key subgroups of the population, for people who move,for persons rather than households, and for specific data items. Initial-contact nonresponse rates providedistinct and new insights about some likely sources of nonresponse. But, as the preceding section madeclear, they address only a few of the potential sources of nonresponse in our survey designs and practices. Neither annual nor initial contact nonresponse rates, measured at the household level, provide informationabout these additional nonresponse concerns. To address them, several additional sets of nonresponserates could be produced and compared more routinely. This section discusses a few illustrative examples. We recommend that the full IHSNG group consider charging a short-term subgroup with developing aspecific proposal.
1. Nonresponse for Key Subgroups
For many surveys, the statistics of interest include comparisons between population subgroups, aswell as national averages. For example, the CPS is often used to estimate differences in the income andemployment status of sex and race groups. If nonresponse rates differ among these subgroups, the estimateof the differences in, say, mean income between men and women, may be biased. Groves and Couper1998 provide detailed analyses of the way differential nonresponse may bias many statistics of interest.
For some surveys, there is a substantial body of research on differential nonresponse. CPS andSIPP have looked at detailed categories of nonresponse. In response to its initial findings, for example,
26
SIPP altered its sample design to oversample key population subgroups (defined by income and age). However, cross-survey comparisons of such nonresponse rates are not routine.
2. Nonresponse for Households who Move
SIPP is the only one of these six surveys that is required to follow households that move. Suchfollow up is critical to one of its key missions, tracking income, employment, and program participation overtime. However, its cumulative nonresponse in interviews two through ten, shown in Table 4, rises tobetween 20 and 30 percent. SIPP has devoted substantial research into its follow up procedures and otherpossible causes for its high nonresponse rates for subsequent interviews. Presenting separate interview-specific rates for nonresponse due to its inability to locate households who move helps identify which ofseveral possible causes of nonresponse is most likely, and would most benefit from research, review, orrevised methods.
3. Nonresponse for Persons
Many key statistics produced from these six surveys are measured at the level of the individual, notthe household unit. The quality of these statistics depends on the nonresponse rate for persons as well ason the nonresponse rate for households. For example, nonresponse at the person level is graduallybecoming a concern for NCVS, although nonresponse at the household level is not. The person-levelnonresponse rate has grown from under 4% in 1990 to 10% in 1997. Reasons for this increase are notclear. There have been no known changes in procedures or training of the interviewers that would accountfor this increase.
There are several hypotheses about this increase. One hypothesis is that there is a tradeoffbetween the household and person nonresponse rates. Interviewers may accept person nonresponse inorder to keep a household participating in the survey. If so, placing more stress on obtaining person-levelresponses may turn out to increase household nonresponse rates. Another hypothesis is the NCVS' strictrules on selecting respondents. The NCVS requires each person in the household over the age of 12 to beinterviewed. It does not collect a general "household" response, as in the CPS, nor are any proxyresponses accepted (although they are in most surveys). Finally, the increase in the person-levelnonresponse rate may reflect the way interviewers are evaluated. Household-level nonresponse rates arepart of the evaluation criteria for interviewers, but person-level nonresponse rates are not.
4. Item nonresponse
Item nonresponse affects critical statistics produced by several surveys. For example, nonresponseon labor force questions in the CPS can affect the quality of the unemployment rate, and nonresponse onincome items in the March supplement can affect estimates of the proportion of the population with incomesbelow the poverty level. Nonresponse on these questions was enough of a concern that reducing item
27
nonresponse was one measure of quality in a new goalsharing pilot project the Census Bureau is conductingin one regional office. Item nonresponse may also be of concern for the other surveys. The NHIS, forexample, is used as a sampling frame for some other surveys, and missing information on such items asnames, addresses, and Social Security numbers may cause problems for the surveys linked to the NHIS. But item nonresponse rates are not currently part of the set of nonresponse measures that are routinelycompared across surveys. Nor are they generally part of the evaluation criteria for interviewers.
D. Readily available and consistent information
One of the easiest ways to increase our knowledge about nonresponse in our surveys is to haveinformation on nonresponse readily available. Several of the surveys in this study have a consistent andintegrated database, updated at each data collection. They routinely produce reports on their individualnonresponse rates (often in much greater variety and detail than presented in this report) and other surveyquality and process measures. Such systems help them make information on nonresponse rates readilyavailable to their national and regional office managers, and their sponsors. However, the structure andlocation of these databases differ, possibly reflecting circumstances specific to each survey. Also thesystems generally are not available to persons working on other surveys. Other surveys use less formalsystems for collecting and calculating their nonresponse rates. The systems are not always set up tocalculate readily a variety of nonresponse rates. For example, in preparing this report, we found that thesedifferent systems made it hard for us to calculate all the nonresponse rates quickly, to verify readily howthey had been calculated, and to verify our transcriptions.
While it may not be possible to move immediately to a single, consolidated, uniform database,opportunities continually arise to modify our current systems. For example, a new management informationsystem for the Census Bureau’s field activities is scheduled to become available in 1999. The currentsystems each survey now uses may well have to be modified to take advantage of the new information itwill provide, or the forms in which it will provide it. Such opportunities lead to us to two morerecommendations for the full IHSNG group to consider:
< When existing survey reporting systems are modified, choose modifications that make the separatesurvey systems more similar to each other, or to a common standard.
< One immediate task the continuing IHSNG group, or a dedicated task force reporting to it, shouldconsider is determining the minimum common core sets of nonresponse statistics that the newsystem will allow us to calculate for each survey, and across surveys.
E. An On-going Agenda for Interagency Research and Cooperation
The experiences of the IHSNG subgroup preparing this report illustrate the benefits of interagencyresearch and cooperation. Group members had each conducted research on nonresponse in their surveys. But there typically are few routine opportunities to meet with people representing all the facets of the surveyprocess to focus on one topic -- nonresponse – or to compare experiences across surveys. Theinteragency IHSNG group provides such an on-going, focused, experience. The resulting interagency

28
review led us to realize that we cannot yet reach firm conclusions about the sources of nonresponse, orabout clear steps to address it. First, we need more consistent, and in some cases, different, informationabout specific kinds of nonresponse. To provide that information, we recommend:
< Continue the Interagency Household Survey Nonresponse Group. Charts A and B show thatnonresponse is an issue for all six participating surveys. Group members all benefitted from theopportunity for focused, continuing conversations with a broad group of survey professionalsrepresenting all parts of the survey process, in the sponsoring and producing agencies.
The full group might function as a steering group that meets quarterly. Together with managementof the producing and sponsoring agencies, it would set a long-run agenda and charge subgroups ortask forces with specific responsibilities. The agenda, and the responsibilities of these subgroups ortask forces, could draw on the recommendations made throughout this report. The subgroup'sexperience shows that short-run task forces charged with specific responsibilities are an effectiveand efficient way to summarize and share knowledge, and to develop proposals for specific nextsteps.
The task forces will be more effective if participating agencies recognize membership in the steeringcommittee and task forces as important -- if perhaps short-run -- components of group members'sjobs. Otherwise, the group runs the risk of members' time being spread too thin, making it difficultto maintain focus or momentum.
< Coordinate with the Interagency Establishment Survey Nonresponse Group. Both groups areestablished and have prepared initial reports. Both groups will benefit from identifying commonissues, sharing what they learn, and, if appropriate, undertaking joint tasks.
29
References
Berlin, M., L. Mohadjer, and J. Waksberg, (1992), “An Experiment in Monetary Incentives”, Proceedingsof the Survey Research Section of the American Statistical Association, pp. 393-398.
Bushery, John M. , Lynn Weidman, Steven M. Briley, and Susan Ciochetto, “Using CATI in the CurrentPopulation Survey”, Presented at the 1987 American Statistical Association Meetings.
Bogen, K. (1996), “The Effect of Questionnaire Length on Response Rates – A Review of the Literature,”paper presented at the American Association of Public Opinion Research meeting, and in ASAProceedings of the Survey Research Methods Section.
Butler, D. (1991), “SIPP 87: Gift Experiment Results”, Internal Census Bureau Memorandum dated April2 to R. Singh.
Demographic Surveys Division, U. S. Census Bureau, Automated Data Collection: How Have theDemographic Surveys Fared thus Far?, April 1998.
Ferber, R. and S. Sudman (1974), “Effects of Compensation in Consumer Expenditure Studies”, Annals ofEconomic and Social Measurement, pp. 319-331.
Groves, Robert M. and Couper, Mick P. (1998) Nonresponse in Household Interview Surveys, Wiley,p. 176.
Harris-Kojetin, Brian A. and Tucker, Clyde (1997) “Longitudinal Nonresponse in the Current PopulationSurvey (CPS), Paper presented at the 8th International Workshop on Household Non-Response,Mannheim, Germany.
Huggins, Vicki J. and Karen E. King, (1997) “Evaluation of Oversampling the Low Income Population inthe 1996 Survey of Income and Program Participation”, 1997 Proceedings of the Survey Methods Sectionof the American Statistical Association.
James, Tracy L., (1997) “ Results of the Wave 1 Incentive Experiment in the 1996 Survey of Income andProgram Participation”, 1997 Proceedings of the Survey Methods Section of the American StatisticalAssociation.
Johnson, A.E., Botman, S. L., and Basiotis, P. (1994) “Nonresponse in Federal demographic surveys:1981-1991.” Proceedings of the Section on Survey Research Methods, Vol. II, American StatisticalAssociation, Alexandria, VA., pp. 983-988. Kalton, Graham et al. (1998) SIPP Quality Profile, 3rd ed., U. S. Department of Commerce.
30
King, Karen E. (1995) “SIPP 1986-1993: Monitoring the Effects of Telephone Interviewing - An Analysisof Type A and Type D Noninterview Rates”, U. S. Census Bureau Memorandum For The Record, dated2/16/95.
Longini, Michael J. (1996), “Guidelines for the SIPP Wave 1 Field Representative PerformanceStandards”, U.S. Census Bureau Memorandum for All Regional Directors, date 3/15/96, SIPP OfficeMemorandum No. 96-15.
Mack, Stephen P., Vicki Huggins, Donald Keathley, Mahdi Sundukchi (1998) “Do Monetary IncentivesImprove Response Rates in the Survey of Income and Program Participation?” Forthcoming 1998Proceedings of the Survey Methods Section of the American Statistical Association.
Rothgeb, Jennifer M., “Revisions to the CPS questionnaire: Effects on Data Quality”, CPS OverlapAnalysis Team Technical Report 2, April 6, 1994.
Sae-Ung, Smanchai and Franklin Winters (1998), “Analysis of Nonresponse Effects on Income andPoverty Time Series Data From SIPP”, Forthcoming 1998 Proceedings of the Survey Methods Section ofthe American Statistical Association.
Shoemaker, Harland H. Jr., “Results from the Current Population Survey CATI Phase-in Project”,Presented at the 1993 American Statistical Association Meetings.
Silberstein, Adriana R. (1993) “Part-Set Cuing in Diary Surveys” Proceedings of the Survey MethodsSection of the American Statistical Association, 398-403.
Thompson, Jenny and Richard McGuinness, “CATI/CAPI Analyses: CCO Versus CPS -- Analysis ofType A Differences (CC_ALYS-30)”, Memorandum for Donna Kostanich on May 17, 1994.
Tucker, Clyde (1992) “The Estimation of Instrument Effects on Data Quality in the Consumer ExpenditureDiary Survey”, Journal of Official Statistics, 8, 41-61.
Tucker, Clyde (1993) “The Effects of Format Changes on Reporting in the 1991 Consumer ExpenditureDiary Survey”, Proceedings of the Survey Methods Section of the American Statistical Association,
Waite, Preston Jay, Vicki Huggins, and Stephen Mack, (1997), “Assessment of Efforts to ReduceNonresponse Bias: 1996 Survey of Income and Program Participation”, Prepared for presentation at the8th International Workshop on Household Survey Nonresponse held in Mannheim, Germany, September24-26, 1997.
Willimack, D. H. Schuman, B. Pennel, and J. Lepkowski, (1995), “Nonmonetary Incentives in Face-toface Surveys”, Public Opinion Quarterly, Vol. 59, 78-92.
31
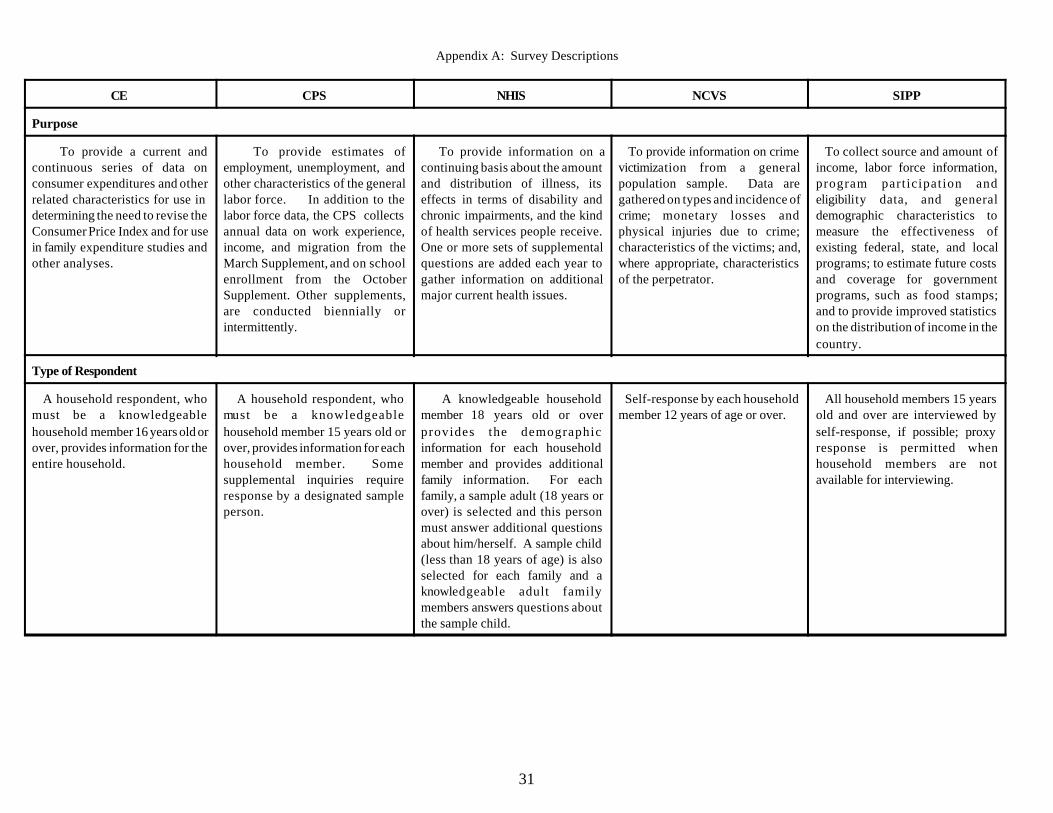
Appendix A: Survey Descriptions
CE CPS NHIS NCVS SIPP
Purpose
To provide a current andcontinuous series of data onconsumer expenditures and otherrelated characteristics for use indetermining the need to revise theConsumer Price Index and for usein family expenditure studies andother analyses.
To provide estimates ofemployment, unemployment, andother characteristics of the generallabor force. In addition to thelabor force data, the CPS collectsannual data on work experience,income, and migration from theMarch Supplement, and on schoolenrollment from the OctoberSupplement. Other supplements,are conducted biennially orintermittently.
To provide information on acontinuing basis about the amountand distribution of illness, itseffects in terms of disability andchronic impairments, and the kindof health services people receive.One or more sets of supplementalquestions are added each year togather information on additionalmajor current health issues.
To provide information on crimevictimization from a generalpopulation sample. Data aregathered on types and incidence ofcrime; monetary losses andphysical injuries due to crime;characteristics of the victims; and,where appropriate, characteristicsof the perpetrator.
To collect source and amount ofincome, labor force information,program participation andeligibility data, and generaldemographic characteristics tomeasure the effectiveness ofexisting federal, state, and localprograms; to estimate future costsand coverage for governmentprograms, such as food stamps;and to provide improved statisticson the distribution of income in thecountry.
Type of Respondent
A household respondent, whomust be a knowledgeablehousehold member 16 years old orover, provides information for theentire household.
A household respondent, whomust be a knowledgeablehousehold member 15 years old orover, provides information for eachhousehold member. Somesupplemental inquiries requireresponse by a designated sampleperson.
A knowledgeable householdmember 18 years old or overprovides the demographicinformation for each householdmember and provides additionalfamily information. For eachfamily, a sample adult (18 years orover) is selected and this personmust answer additional questionsabout him/herself. A sample child(less than 18 years of age) is alsoselected for each family and aknowledgeable adult familymembers answers questions aboutthe sample child.
Self-response by each householdmember 12 years of age or over.
All household members 15 yearsold and over are interviewed byself-response, if possible; proxyresponse is permitted whenhousehold members are notavailable for interviewing.
CE CPS NHIS NCVS SIPP
32
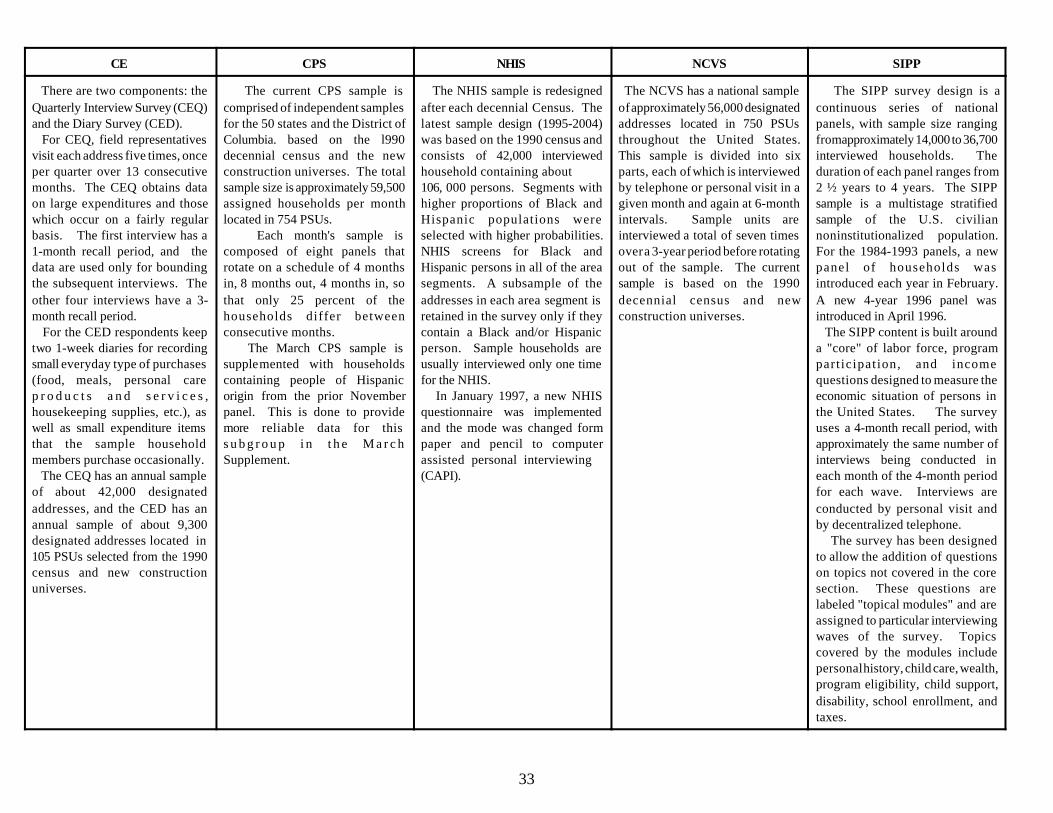
Survey Design and Sample Size
CE CPS NHIS NCVS SIPP
33
There are two components: theQuarterly Interview Survey (CEQ)and the Diary Survey (CED). For CEQ, field representativesvisit each address five times, onceper quarter over 13 consecutivemonths. The CEQ obtains dataon large expenditures and thosewhich occur on a fairly regularbasis. The first interview has a1-month recall period, and thedata are used only for boundingthe subsequent interviews. Theother four interviews have a 3-month recall period. For the CED respondents keeptwo 1-week diaries for recordingsmall everyday type of purchases(food, meals, personal carep r o d u c t s a n d s e r v i c e s ,housekeeping supplies, etc.), aswell as small expenditure itemsthat the sample householdmembers purchase occasionally. The CEQ has an annual sampleof about 42,000 designatedaddresses, and the CED has anannual sample of about 9,300designated addresses located in105 PSUs selected from the 1990census and new constructionuniverses.
The current CPS sample iscomprised of independent samplesfor the 50 states and the District ofColumbia. based on the l990decennial census and the newconstruction universes. The totalsample size is approximately 59,500assigned households per monthlocated in 754 PSUs. Each month's sample iscomposed of eight panels thatrotate on a schedule of 4 monthsin, 8 months out, 4 months in, sothat only 25 percent of thehouseholds differ betweenconsecutive months. The March CPS sample issupplemented with householdscontaining people of Hispanicorigin from the prior Novemberpanel. This is done to providemore reliable data for thiss u b g r o u p i n t h e M a r c hSupplement.
The NHIS sample is redesignedafter each decennial Census. Thelatest sample design (1995-2004)was based on the 1990 census andconsists of 42,000 interviewedhousehold containing about 106, 000 persons. Segments withhigher proportions of Black andHispanic populations wereselected with higher probabilities.NHIS screens for Black andHispanic persons in all of the areasegments. A subsample of theaddresses in each area segment isretained in the survey only if theycontain a Black and/or Hispanicperson. Sample households areusually interviewed only one timefor the NHIS. In January 1997, a new NHISquestionnaire was implementedand the mode was changed formpaper and pencil to computerassisted personal interviewing (CAPI).
The NCVS has a national sampleof approximately 56,000 designatedaddresses located in 750 PSUsthroughout the United States.This sample is divided into sixparts, each of which is interviewedby telephone or personal visit in agiven month and again at 6-monthintervals. Sample units areinterviewed a total of seven timesover a 3-year period before rotatingout of the sample. The currentsample is based on the 1990decennial census and newconstruction universes.
The SIPP survey design is acontinuous series of nationalpanels, with sample size rangingfrom approximately 14,000 to 36,700interviewed households. Theduration of each panel ranges from2 ½ years to 4 years. The SIPPsample is a multistage stratifiedsample of the U.S. civiliannoninstitutionalized population.For the 1984-1993 panels, a newpanel of households wasintroduced each year in February.A new 4-year 1996 panel wasintroduced in April 1996. The SIPP content is built arounda "core" of labor force, programparticipation, and incomequestions designed to measure theeconomic situation of persons inthe United States. The surveyuses a 4-month recall period, withapproximately the same number ofinterviews being conducted ineach month of the 4-month periodfor each wave. Interviews areconducted by personal visit andby decentralized telephone. The survey has been designedto allow the addition of questionson topics not covered in the coresection. These questions arelabeled "topical modules" and areassigned to particular interviewingwaves of the survey. Topicscovered by the modules includepersonal history, child care, wealth,program eligibility, child support,disability, school enrollment, andtaxes.