hot dry rock geothermal reservoir testing: 1978 to 1980
TRANSCRIPT

Journal of Volcanology and Geothermal Research, 15 (1983) 59--99 59 Elsevier Scientific Publishing Company, Amsterdam -- Printed In The Netherlands
H O T D R Y R O C K G E O T H E R M A L R E S E R V O I R T E S T I N G : 1 9 7 8 T O 1 9 8 0
Z.V. DASH, H.D. MURPHY, R.L. AAMODT, R.G. AGUILAR, D.W. BROWN, D.A. COUNCE, H.N. FISHER, C.O. GRIGSBY, H. KEPPLER, A.W. LAUGHLIN, R.M. POTTER, J.W. TESTER, P.E. TRUJILLO, Jr., and G. ZYVOLOSKI
Los Alamos National Laboratory, Los AMmos, NM 87544 (U.S.A.)
(Received May 4, 1982)
ABSTRACT
Dash, Z.V., Murphy, H.D., Aamodt , R.L., Aguilar, R.G., Brown, D.W., Counce, D.A., Fisher, H.N., Grigsby, C.O., Keppler, H., Laughlin, A.W., Potter, R.M., Tester, J.W., Trujillo, P.E., Jr., and Zyvoloski, G., 1983. Hot dry rock geothermal reservoir testing: 1978 to 1980. In: G. Heiken and F. Goff (Editors), Geothermal Energy from Hot Dry Rock. J. Volcanol. Geotherm. Res., 15: 59--99.
The Phase I Hot Dry Rock Geothermal Energy reservoirs at the Fenton Hill field site grew continuously during Run Segments 2 through 5 (January 1978 to December 1980). Reservoir growth was caused not only by pressurization and hydraulic fracturing, but also by heat-extraction and thermal-contraction effects. Reservoir heat-transfer area grew from 8000 to 50,000 m 2 and reservoir fracture volume grew from 11 to 266 m 3. Despite this reservoir growth, the water loss rate increased only 30%, under similar pressure environ- ments. For comparable temperature and pressure conditions, the flow impedance ( a mea- sure of the resistance to circulation of water through the reservoir) remained essentially unchanged, and if reproduced in the Phase II reservoir under development, could result in "self pumping". Geochemical and seismic hazards have been nonexistent in the Phase I reservoirs. The produced water is relatively low in total dissolved solids and shows little tendency for corrosion or scaling. The largest microearthquake associated with heat extrac- tion measures less than minus one on the extrapolated Richter scale.
INTRODUCTION
T h e bas ic i d e a in e x t r a c t i n g e n e r g y f r o m h o t d r y r o c k ( H D R ) is t o f o r m a m a n - m a d e g e o t h e r m a l r e s e r v o i r b y d r i l l i n g i n t o h i g h - t e m p e r a t u r e , l o w - p e r m e - a b i l i t y r o c k a n d h y d r a u l i c a l l y f r a c t u r i n g i t . A c i r c u l a t i o n l o o p is t h e n f o r m e d b y d r i l l i n g a s e c o n d h o l e a n d f o r c i n g w a t e r to s w e e p h e a t f r o m t h e r o c k sur- f a ce in t h e f r a c t u r e d r e g i o n b e t w e e n t h e w e l l b o r e s . T h e h o t w a t e r p r o d u c e d a t t h e s u r f a c e is u s e d f o r g e n e r a t i n g e l e c t r i c i t y o r s p a c e h e a t i n g .
T h e H D R r e s e r v o i r s a t F e n t o n Hil l a re l o c a t e d in t h e J e m e z M o u n t a i n s o f n o r t h e r n N e w M e x i c o as s h o w n in F ig . 1. Whi l e t h e f o c u s o f t h i s r e p o r t is u p o n t h e P h a s e I r e s e r v o i r , e s s e n t i a l l y a r e s e a r c h s y s t e m t h a t uses we l l s EE-1 a n d
*Prepared under the auspices of the Division of Geothermal Energy, U.S. Departmant of Energy.

6O
JENEZ NOU#TA/#S
CALDERA
: E N T O N \ 4 , HILL • \ , \ /
CALDERA
• LOS ALAMOS
JEMEZ ;PRtNG~ 260 ' C
GEOTHERMAL SYSTEM (UNION OIL CO)
EZ FAULT ZONE
SAN YSIDRO
N
\ SANTA FE •
0 I0 20kin L_ J J
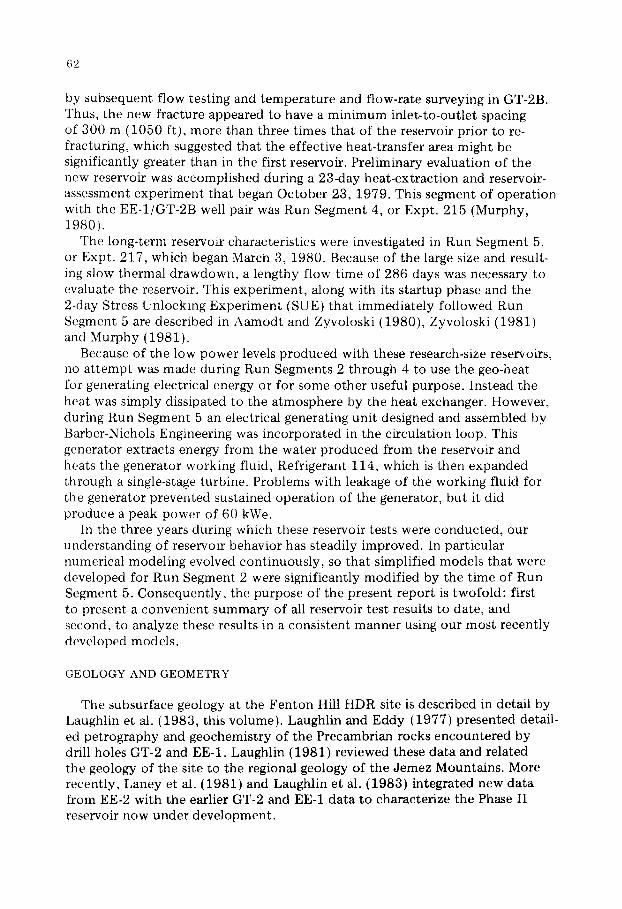
Fig. 1. Loca t ion of Fen ton Hill Hot Dry Rock site in the Jemez Mountains of nor thern New Mexico (Figure f rom Gof f et al., 1981).
GT-2, occasional reference will be made to the Phase II or engineering reser- voir. The two wells for the Phase II reservoir, EE-2 and EE-3, were completed in August 1981, but the hydraulic fracturing and much additional work must be done before the Phase II reservoir and its circulation loop can be activated.
The first deep borehole of the Phase I reservoir, Geothermal Test-2 (GT-2) was drilled in granitic rock to a depth of 2.929 km (9610 ft) where the temper- ature was 197°C (386°F). A series of hydraulic fracturing experiments was then performed in GT-2. Energy Extraction-1 (EE-1) was drilled toward the largest of the GT-2 fractures in an effort to complete the heat-extraction system. The intent was to produce a large vertical spacing between the inlet and outlet loca- tions in order to maximize the effective heat-transfer area while still achieving reasonably low flow impedance. Low flow impedance is required for high rates of heat extraction as the working pressure drop is limited by tectonic stress considerations; excessive pressures normally result in greater downhole water losses. After trying several methods of improving the communication between the boreholes, an acceptable connection was achieved by side-tracking GT-2 at 2.5 km and redrilling it towards the top of a large fracture centered at about 2.75 km in EE-1. Several paths were drilled and eventually one, which penetrat- ed several major natural joints or natural fractures, but probably did not inter- sect the major fracture, was obtained. This path had low enough flow resistance to proceed with a heat-extraction test. The combination of the original GT-2

61
wellbore and the redrilled path is referred to as the GT-2B wellbore. In subse- quent testing of the reservoir, EE-1 was used as the injection well and GT-2 as the production or extraction well.
Reservoir performance was first evaluated by a 75-day period of closed-loop operation from January 28 to April 13, 1978. The assessment of this first reser- voir in EE-1 and GT-2B is referred to.as "Run Segment 2", or the "75-day test". (Run Segment 1 consisted of a 4-day precursor experiment conducted in September 1977.) Hot water from GT-2B was directed to a water-to-air heat exchanger where the water was cooled to 25°C before reinjection. Make-up water, required to replace downhole losses to the rock surrounding the fracture, was added to the cooled water and pumped down EE-1, and then through the fracture system. Heat was transferred to the circulating water by thermal conduction through the nearly impervious rock adjacent to the fracture surfaces. The average thermal power extracted during Run Segment 2 was 3.1 MW, evaluated at the surface. The flow impedance, a measure of the pressure loss through the reservoir per unit flow rate, initially 1.7 GPa s/m 3 (15 psi/gpm), decreased by a factor of five as thermal contraction and continued pressuriza- tion resulted in the opening of natural joints that provided additional communi- cation with the producing well. Water losses to the rock surrounding the fracture steadily diminished, and eventually this loss rate was about 1% of the injected rate. The geochemistry of the produced fluid was benign, and the seismic effects associated with heat extraction were immeasurably small. How- ever, the relatively rapid thermal drawdown of the produced water, from 175 to 85°C (345 to 185°F), indicated that the effective heat-transfer area was small, about 8000 m 2 (86,000 ft2), and essentially confined in a fractured region between the main injection and production zones in the EE-1 and GT-2B wells (Murphy et al., 1977; Tester and Albright, 1979; Murphy and Tester, 1979).
Run Segment 3 (Expt. 186), the High Back-Pressure Flow Experiment (Brown, in prep.) was run during September and October 1978 for 28 days. The purpose of this experiment was to evaluate reservoir flow characteristics at high mean-pressure levels. The high back pressure was induced by throttling the production well. As a consequence of these higher operating pressures, the flow impedance was reduced several fold, but as discussed later, the effective heat-transfer area remained nearly the same.
It was discovered during Run Segment 3 that, as a result of deteriorated casing cement, the water injected into EE-1 was flowing in the annulus to depths as shallow as 700 m (2500 ft). This posed a potential danger to the ground-water aquifers and caused high water losses. To alleviate these problems, and also to investigate the feasibility of creating a larger fracture from the same wellbores, the EE-1 casing was recemented near its casing bot tom at 2.93 km (9600 ft). An enlarged reservoir was then formed by ex- tending a hydraulic fracture from an initiation depth of 2.93 km {9620 ft) in EE-1, about 200 m deeper than the first fracture in EE-1. The resulting large fracture propagated upward to at least 2.6 km (8600 ft), as determined
62
by subsequent flow testing and temperature and flow-rate surveying in GT-2B. Thus, the new fracture appeared to have a minimum inlet-to-outlet spacing of 300 m (1050 ft), more than three times that of the reservoir prior to re- fracturing, which suggested that the effective heat-transfer area might be significantly greater than in the first reservoir. Preliminary evaluation of the new reservoir was accomplished during a 23-day heat-extraction and reservoir- assessment experiment that began October 23, 1979. This segment of operation with the EE-1/GT-2B well pair was Run Segment 4, or Expt. 215 (Murphy, 1980).
The long-term reservoir characteristics were investigated in Run Segment 5, or Expt. 217, which began March 3, 1980. Because of the large size and result- mg slow thermal drawdown, a lengthy flow time of 286 days was necessary to evaluate the reservoir. This experiment, along with its startup phase and the 2-day Stress Unlocking Experiment {SUE) that immediately followed Run Segment 5 are described in Aamodt and Zyvoloski (1980), Zyvoloski (1981) and Murphy (1981).
Because of the low power levels produced with these research-size reservoirs, no at tempt was made during Run Segments 2 through 4 to use the geo-heat for generating electrical energy or for some other useful purpose. Instead the heat was simply dissipated to the atmosphere by the heat exchanger. However, during Run Segment 5 an electrical generating unit designed and assembled by Barber-Nichols Engineering was incorporated in the circulation loop. This generator extracts energy from the water produced from the reservoir and heats the generator working fluid, Refrigerant 114, which is then expanded through a single-stage turbine. Problems with leakage of the working fluid for the generator prevented sustained operation of the generator, but it did produce a peak power of 60 kWe.
In the three years during which these reservoir tests were conducted, our understanding of reservoir behavior has steadily improved. In particular numerical modeling evolved continuously, so that simplified models that were developed for Run Segment 2 were significantly modified by the time of Run Segment 5. Consequently, the purpose of the present report is twofold: first to present a convenient summary of all reservoir test results to date, and second, to analyze these results in a consistent manner using our most recently developed models.
GEOLOGY AND GEOMETRY
The subsurface geology at the Fenton Hill HDR site is described in detail by Laughlin et al. (1983, this volume). Laughlin and Eddy (1977) presented detail- ed petrography and geochemistry of the Precambrian rocks encountered by drill holes GT-2 and EE-1. Laughlin {1981) reviewed these data and related the geology of the site to the regional geology of the Jemez Mountains. More recently, Laney et al. (1981) and Laughlin et al. (1983) integrated new data from EE-2 with the earlier GT-2 and EE-1 data to characterize the Phase II reservoir now under development.
63
Our knowledge of the Precambrian rocks, which comprise the Phase I reser- voir, results from a synthesis of petrographic, geochemical, and structural data collected on cores and cuttings from GT-2 and EE-1 and the results of geo- physical logging in the two wellbores. From this synthesis, it is evident that the Precambrian rocks are both compositionally and structurally very diverse and complex. As discussed below, however , the Phase I system was developed in a single, large, homogeneous rock unit within this complex.
The biotite granodiorite, like the other Precambrian rocks at Fenton Hill, contains many joints or natural fractures which are seen at 0.01 to 0.1 m intervals in cores and are recognized on certain geophysical logs. These joints are almost invariably sealed by a variety of minerals including calcite, alkali feldspar, epidote, and quartz. The sealing processes have been so effective that intrinsic permeability and water losses during flow tests have been extremely low. Apparently seismic activity, which commonly keeps joints open in natural hydrothermal systems, has been too low in the Fenton Hill area to reopen the sealed fractures.
As mentioned in the introduction, reservoirs were created in the biotite granodiorite at a depth interval of 2.6 to 3.0 km by hydraulically fracturing well EE-1 and sidetracking (deviating) well GT-2 to pass through the fractured region. In our early concept it was believed that the deviated path of GT-2, called GT-2B, failed to intersect the hydraulic fracture directly, but did at least intersect several joints inclined from the vertical, which provided flow com- munication from the hydraulic fractures initiated from EE-1.
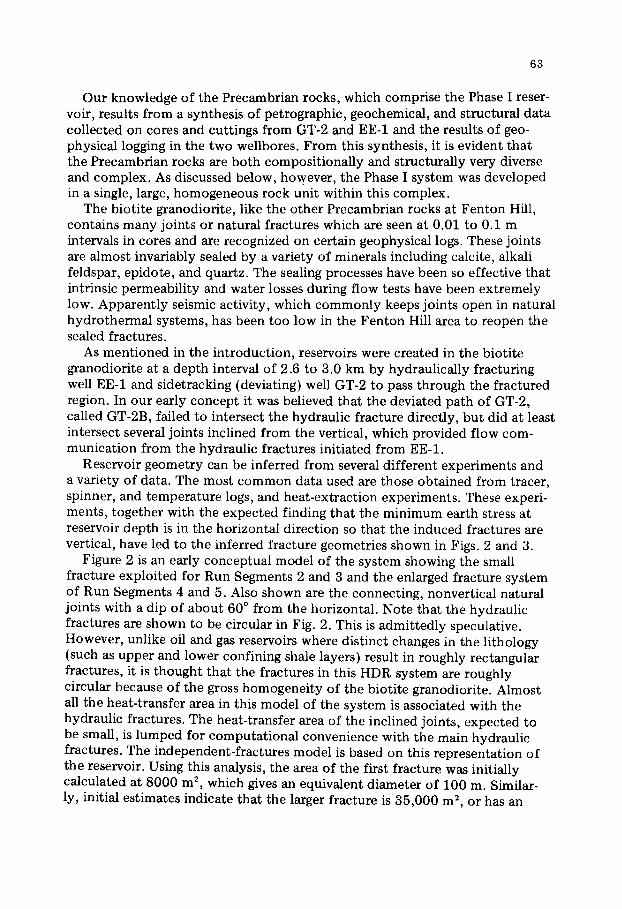
Reservoir geometry can be inferred from several different experiments and a variety of data. The most common data used are those obtained from tracer, spinner, and temperature logs, and heat-extraction experiments. These experi- ments, together with the expected finding that the minimum earth stress at reservoir depth is in the horizontal direction so that the induced fractures are vertical, have led to the inferred fracture geometries shown in Figs. 2 and 3.
Figure 2 is an early conceptual model of the system showing the small fracture exploited for Run Segments 2 and 3 and the enlarged fracture system of Run Segments 4 and 5. Also shown are the connecting, nonvertical natural joints with a dip of about 60 ° from the horizontal. Note that the hydraulic fractures are shown to be circular in Fig. 2. This is admittedly speculative. However, unlike oil and gas reservoirs where distinct changes in the lithology {such as upper and lower confining shale layers) result in roughly rectangular fractures, it is thought that the fractures in this HDR system are roughly circular because of the gross homogeneity of the biotite granodiorite. Almost all the heat-transfer area in this model of the system is associated with the hydraulic fractures. The heat-transfer area of the inclined joints, expected to be small, is lumped for computational convenience with the main hydraulic fractures. The independent-fractures model is based on this representation of the reservoir. Using this analysis, the area of the first fracture was initially calculated at 8000 m 2, which gives an equivalent diameter of 100 m. Similar- ly, initial estimates indicate that the larger fracture is 35,000 m 2, or has an

244 (80(
64
¢ONOEt OF
RECENEN EE-I/GT-
,fYSTEA/
OR NATURAL JOINTS
/
:IRST FRACTURE
30 (lOq
OND FRACTURE
!0')
Fig. 2. Inferred reservoir geometry used in independent-fractures model.
equivalent d i ame t e r of a b o u t 200 m. I t should be n o t e d t ha t fol lowing con- ven t iona l prac t ice in the oil and gas indus t ry , all reservoir areas in this r epor t , whe the r to ta l f rac tu re area or effect ive hea t - t rans fe r area, are for one side o f a f rac ture only. In o the r words , if a h y p o t h e t i c a l f rac ture were circular wi th radius R , the q u o t e d area would be nR ~, no t 2nR 2. Consequen t ly , the heat- t ransfer areas q u o t e d should ac tual ly be doub led to a ccoun t for the t w o sur- faces involved.
Figure 3 depic ts a second c o n c e p t o f the f rac tu re sys t em tha t is charac te r - ized by a mu l t i t ude of vert ical ly or ien ted f ractures . This s impl i f ied view of the mul t ip le cracks does no t show the actual GT-2 and EE-1 pos i t ioning which is shown m o r e realistically in Fig. 2. This view evolved af ter t e m p e r a t u r e draw- down and recovery curves in b o t h wel lbores , f r o m Run Segments 4 and 5,
GT-2
65
FRACTURE INTERS
2708m (8885'
~fJJ jJS f J
FRACTURE INTERSECTIONS
, i - - 2930m (962 0')
Fig. 3. Concept of reservoir geometry used for multiple-fracture model.
were analyzed in detail. The multiple-fracture model, using this geometry, gave a total heat-transfer area for the reservoir of 45,000 m 2 .
HEAT PRODUCTION AND HEAT-TRANSFER MODELING
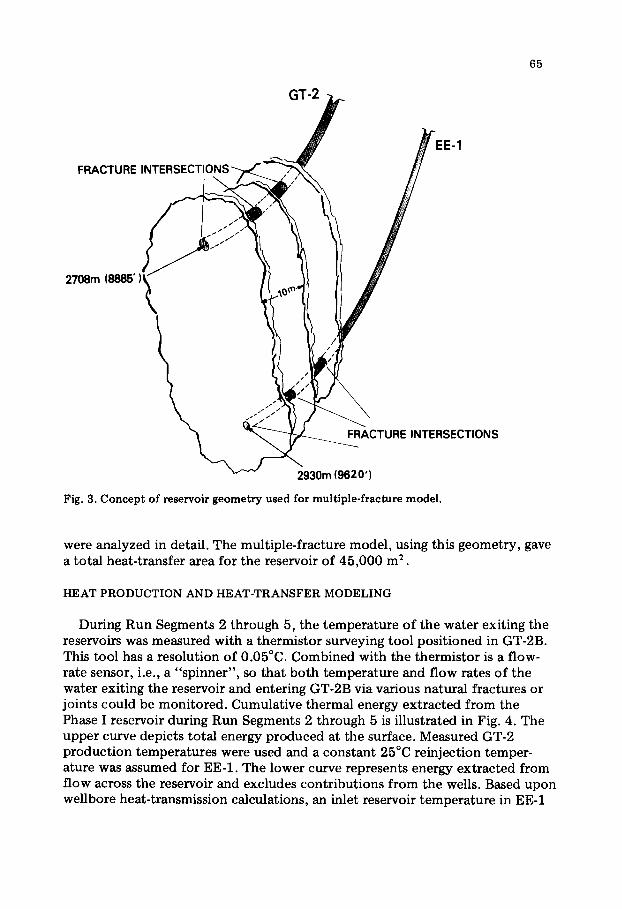
During Run Segments 2 through 5, the temperature of the water exiting the reservoirs was measured with a thermistor surveying tool posit ioned in GT-2B. This tool has a resolution of 0.05°C. Combined with the thermistor is a flow- rate sensor, i.e., a "spinner" , so that both temperature and flow rates of the water exiting the reservoir and entering GT-2B via various natural fractures or joints could be monitored. Cumulative thermal energy extracted from the Phase I reservoir during Run Segments 2 through 5 is illustrated in Fig. 4. The upper curve depicts total energy produced at the surface. Measured GT-2 product ion temperatures were used and a constant 25°C reinjection temper- ature was assumed for EE-1. The lower curve represents energy extracted from flow across the reservoir and excludes contr ibut ions from the wells. Based upon wellbore heat-transmission calculations, an inlet reservoir temperature in EE-1

66
NUN 1 (100~- * ~ I - - c r q M F N T •
O9 - " O T A , ENERt: ' , EY, T R A U I E D RESERVOIR A N D WEI BORIS 0 >- <~ I + RESERVOIR EN[RG'~ { }N , >( D .7~ CO
- ©
t~ Q
/ -V- < X RUN ~ ~1- . / ~_
50OF- ~ ~ RUN SEGMENT 4 " / " X
Cg ~ ~ RUN ~ SEGMENT :~ "4z w~>- SEGMENT ?
' [/2 z I r -
F-
1978 197'4
C A L E N D A R Y E A R
1980
Fig. 4. Cumulative thermal energy extracted from the Phase I reservoirs, Run Segments 2 through 5.
of about 65°C was used when measured downhole temperatures were unavail- able. The outlet reservoir temperature was taken from GT-2 temperature logs measured at 2590 m (8500 ft). Average thermal energy extracted at the sur- face was 3.1 MW for Run Segment 2, 2.1 MW for Run Segment 3, 2.8 MW for Run Segment 4, and 2.3 MW during Run Segment 5.
Although Run Segment 2 produced thermal energy at the greatest rate, thermal drawdown was quite severe. After 75 days of operation the GT-2 reser- voir temperature had dropped from 175 to 85°C. Temperatures during Run Segment 3 ranged from 135 to 98.5°C, while temperatures during Run Seg- ment 4 remained almost constant at 153°C. Finally during Run Segment 5 the initial reservoir temperature of 156°C climbed to about 158°C after 60 days then dropped to about 149°C by the experiment's end (286 days).
The rate of decline, or drawdown, of these temperatures, when analyzed with the heat-transfer models briefly described below, permits estimates of the effective heat-transfer areas of the reservoirs. We say effective because some parts of the total area are either inaccessible to, or inefficiently bathed by, the water flow because of fluid dynamic and geometrical considerations (McFarland and Murphy, 1976).
Heat-transfer modeling of the reservoirs has been performed with two numerical models. Both models use two-dimensional simulators in which heat is transported by conduction within the rock to the fractures. The most recent- ly developed model, which we call the multiple-fracture model, is based upon the concept of reservoir geometry depicted in Fig. 3 and assumes that the fractures are parallel rectangles and that flow is distributed uniformly along
67
the bot tom of each fracture and uniformly withdrawn from the top of each fracture. The flow is thus one-dimensional, and the streamlines are straight vertical lines. Consequently, fluid-dynamic considerations do not directly enter into the heat-extraction process -- the sweep efficiency is implicitly assumed to be 100%. However, a rigorous two-dimensional heat-conduction solution is incorporated for the rock between the fractures, and this permits valid con- sideration of thermal-interaction effects between the fractures. In contrast, the older model (the independent-fractures model) based upon Fig. 2, assumes that the fractures are circular {but other assumptions are permissible) and allows proper local positioning of the inlet and outlets, i.e. the point-like intersection of the injection well with the fracture can be modeled, as can the intersection of the main hydraulic fractures and the slanting joints that provide the connections to GT-2B. However, as was cautioned earlier, while the fluid- dynamic effects of the joints/outlets can be faithfully modeled, the heat- transfer effect of the joints cannot; the area of the joints must be lumped with the main fractures. In view of this more faithful representation of inlet and outlets, and the fact that a complete two-dimensional solution to the Navier-Stokes fluid-dynamic equations is incorporated, the independent-frac- tures model results in a more realistic assessment of the effect of fluid dynam- ics and sweep efficiencies upon heat extraction. The penalty, however, is that in the present two-dimensional version of the code, thermal interaction, as the temperature waves in the rock between fractures overlap, cannot be realistically represented, as it is with the multiple-fracture model.
In the most recently conducted experiment, Run Segment 5, it was con- cluded that while both models are now only two-dimensional, both models predicted reasonably well the overall thermal drawdown. This agreement gives pause to the development of more complicated and expensive three- dimensional models, but nevertheless we are currently developing such models for future reservoirs. In the meantime, we present below our reanalysis of Run Segments 2 through 5 with the most up-to-date, two-dimensional versions of both models. As will be demonstrated, this reanalysis shows that growth of the heat-exchange area occurs not only from pressurization and hydraulic fractur- ing, as might be expected, but also as a consequence of thermal cooling and thermal stress cracking. Reservoir growth due to thermal cracking during heat extraction was predicted as early as 1972 by Harlow and Pracht, but this is the first time we have been able to detect such growth in the actual drawdown behavior.
Independent-fractures modeling
Because of previous detailed descriptions (McFarland and Murphy, 1976; Murphy et al., 1981), only a brief, nonmathematical description is needed here. The independent-fractures model numerically solves five coupled partial differential equations. The first three equations are for the fluid dynamics within a fracture. Two-dimensional flow parallel to the fracture plane is

68
considered and the equations of conservation of mass and conservation of momentum are satisfied. The fluid dynamic equations allow dependence of water properties, particularly viscosity, upon temperature and pressure. Ad- vection, viscous drag, and buoyancy terms (McFarland and Murphy, 1976) are included in the momentum equations. The remaining two equations account for conservation of energy in both the water and the surrounding rock. The rock is assumed impermeable so that the water is confined to the fractures, and consequently a small error is introduced because of the down- hole water losses. The energy equations incorporate convection, conduction, and transient heat-storage terms. Because heat conduction within the rock is primarily orthogonal to the fracture plane, only one-dimensional conduction need be considered. Consequently, while the physical situation being modeled appears three-dimensional, the numerics need consider at most two-dimensional equations. Based upon in situ measurements the thermal conductivity of the rock was taken as 2.9 Wm -1K -I . Water properties were taken from steam-table compilations.
The first application of this model was to the first reservoir, when only the smaller hydraulic fracture shown to the right in Fig. 2 existed. This reservoir was tested extensively during Run Segment 2, occasionally referred to as the 75-day test {Tester and Albright, 1979}. Based upon spinner and temperature surveys in the production well, the depths of the intersections of the produc- tion well with the slanting joints were estimated as well as the flow rates communicated by each joint. In the calculations, the actual temporal variations of production and injection flow rates were utilized. The fracture inlet temper- ature was estimated with a separate wellbore heat-transmission calculation (Zyvoloski, 1980). With this information, estimates of the thermal drawdown were calculated with the model for various trial values of fracture radii and vertical position of the fracture inlet. It could not be assumed that the inlet was located at the center of the fracture because the earth stresses increase with depth, so that during its creation the fracture probably grew preferential- ly in the upward direction. A fracture radius of 60 m with an inlet located 25 m above the fracture bot tom resulted in a good fit to the measurements, and, as shown in Fig. 5, the computed thermal behavior was in good agreement with the measured temperature. The temperature shown is the mixed mean reservoir-outlet temperature. That is, the mean outlet temperature is taken as the mean of the joint-outlet temperatures measured in the production well, averaged, or weighted, by the flow-rate fraction in each joint. This mean outlet- temperature measurement is considered as the best measure of the overall thermal performance of the reservoir and is used, for this model, to describe not only the old reservoir, but also below, the enlarged, two-fracture reservoir. However, as will be indicated later, one of the strengths of the newer, multiple- fracture model, is that the temperatures of the individual joints, as well as the mean temperature, are also modeled realistically. A radius of 60 m, as indicat- ed by the fit to the data in Fig. 5, implies a total fracture area (on one side) of 11,000 m:; however, because of hydrodynamic-flow sweep inefficiencies

69
200 i i i i i i i
160
o
LIJ 120
W
a. 80 I L l
I.--
40
_ _ ; I _ 0 0 60 70 80
- - e e e e e
- - o e o
• o e e e e o o o o o e , o o o e • oe
• oo MEASURED DRAWDOWN
- -THEORY, FRACTURE RADIUS = 60 rn EFFECTIVE AREA 8000 m z
i ] I I [ I0 20 .30 40 50
TIME (days)
Fig . 5. C o m p u t e r m o d e l c o m p a r i s o n w i t h f i e ld d a t a f o r a s ing le f r a c t u r e f o r R u n S e g m e n t 2.
the net area effective in heat exchange was only 8000 m 2 during Run Segment 2. Unlike the newer model, we were unable, with the independent-fractures model, to obtain a clear-cut indication of thermal growth from the drawdown data of Run Segment 2. The very low rate of drawdown in the later period of the test prevented resolution of any potential area increase.
Six months after the conclusion of Run Segment 2, Run Segment 3 (the so-called high back-pressure experiment) was conducted in October of 1978. The purpose was to examine reservoir behavior under conditions of high mean-fracture pressure. The test duration was short, less than one month, but the thermal drawdown suggested that, according to the independent- fractures model, the effective heat area was nearly the same. However, flow- rate (spinner) surveys in GT-2 indicated that because of the higher pressure level most of the flow was entering GT-2B at positions that averaged 25 m deeper than during Run Segment 2. In effect the reservoir flow paths were shortened by 25 m, some 25%. A reduction of at least 25% in heat-transfer area would have been expected because this vertical shortening would also result in horizontal contraction of the streamlines, and yet the area estimated from actual drawdown was about the same. It was concluded that while pressurization did indeed result in partial short circuiting of the streamlines, it also resulted in a notable decrease in impedance, which afforded better fluid sweep and bathing of the remaining area. This impedance change is described in more detail in the Section "Impedance characteristics".
As described in the introduction, the Phase I reservoir was enlarged during the fracturing operations of 1979. For the independent-fractures model the enlarged reservoir is portrayed as two fractures, the old one operative in Run Segments 2 and 3, and a new and larger one shown to the left in Fig. 2. The enlarged reservoir was evaluated during Run Segment 4 (Brown, in prep.), and Run Segment 5 (Zyvoloski, 1981). To summarize the Run Segment 4 studies, it was found that the old fracture had an effective heat-transfer area of
70
15 ,000 m 2 and the new f rac tu re had an effect ive area o f at least 30 ,000 m 2 . We say at least because the hea t - ex t rac t ion per iod was on ly 23 days, far t o o shor t to result in significant dep le t ion of the new fracture . The area d e t e r m i n e d in Run Segmen t 4 for the old f rac tu re was at least twice tha t d e t e r m i n e d in Run S e g m e n t 2. This t rend of increasing area, as observed in b o t h Run Seg- men t s 3 and 4, is n o w a t t r i bu t ed to t he rm a l s t ress-cracking ef fec ts (Murphy , 1979) as well as to the high reservoir pressures which were used in these run segments .
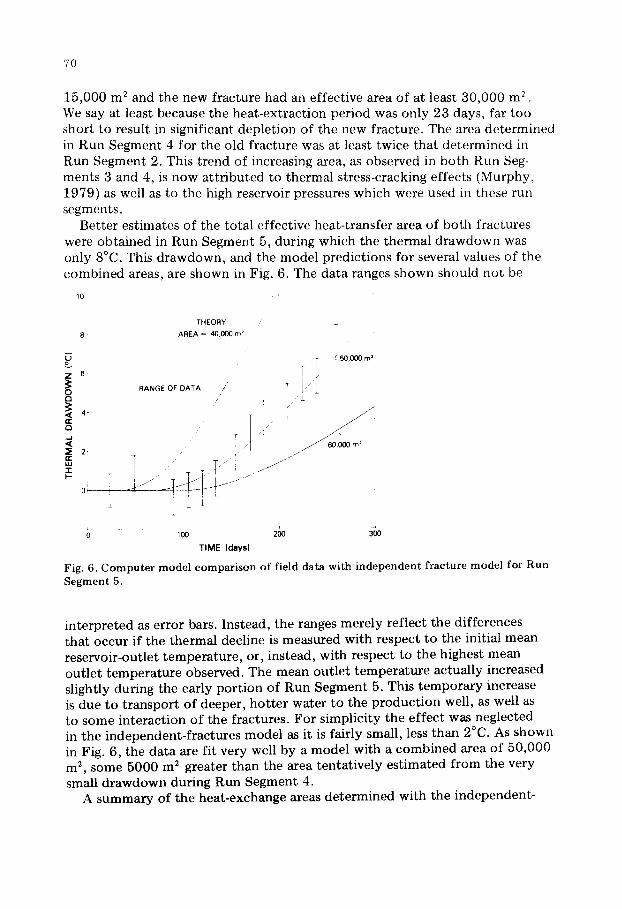
Be t te r es t imates of the to ta l ef fec t ive hea t - t ransfe r area o f bo th f rac tures were ob t a ined in Run S egm en t 5, dur ing which the t he rma l d r a w d o w n was only 8°C. This d r a w d o w n , and the mode l p red ic t ions for several values o f the c o m b i n e d areas, are shown in Fig. 6. The da ta ranges shown should no t be
10~
8
Z 6
O
< 4 n.. ,m
2~
w "r" I -
0i
THEORY
AREA = 4 0 . 0 0 0 m2
RANGE OF DATA
3 -
50,000 m ~
/ J 60,000 m ~ / j
0 100 200 3~00
TIME (days)
Fig. 6. C o m p u t e r m o d e l c o m p a r i s o n o f f ie ld d a t a w i t h i n d e p e n d e n t f r a c t u r e m o d e l for R u n
S e g m e n t 5.
i n t e rp r e t ed as e r ror bars. Ins tead , the ranges mere ly ref lec t the d i f fe rences tha t occur if the t he rma l decline is measu red wi th respec t to the initial m e a n reservoi r -ou t le t t e m p e r a t u r e , or, ins tead, wi th respec t to the highest m e a n ou t l e t t e m p e r a t u r e observed. The mean ou t l e t t e m p e r a t u r e ac tua l ly increased slightly dur ing the ear ly po r t i on o f Run S e g m e n t 5. This t e m p o r a r y increase is due to t r a n s p o r t o f deeper , h o t t e r wa te r to the p r o d u c t i o n well, as well as to s o m e in te rac t ion o f the f rac tures . For s impl ic i ty the e f fec t was neglec ted in the i ndependen t - f r ac tu r e s mode l as it is fair ly small , less than 2°C. As shown in Fig. 6, the da ta are fi t very well by a m o d e l wi th a c o m b i n e d area o f 50 ,000 m 2, some 5000 m 2 grea ter than the area t en ta t ive ly e s t ima ted f r o m the very small d r a w d o w n dur ing Run S e g m e n t 4.
A s u m m a r y of the hea t -exchange areas d e t e r m i n e d wi th the i ndependen t -

71
fractures model is presented in Fig. 7. As can be seen, a steady increase, from 8000 to 50,000 m 2 , is indicated. This trend is supported not only by the newer modeling discussed next, but also by reservoir tracer experiments presented in the following section.
75,000
E - - 50.000 <
u_ z
25000 I
INDEPENDENT FRACTURES MODEL
PRESSURIZATION AND
HEAT EXTRACTION RUN SEGMENT 3--D,,
HEAT EXTRACTION RUN SEGMENT 2
TO ?
i
t HEAT EXTRACTION I
L. 1 PRESSURIZATION RUN SEGMENT 5
AND HEAT EXTRACTIOn__. RUN SEGMENT 4 _ _ _ / _
I I
PRESSURIZATION I
i ~ _ MHF EXPTS I 195 AND 203 I PRESSURIZATION
) . . . . . . . . . ..I ~ STRESS UNLOCKING EXPT
I I I I I I I
. . . . . J
,978 I 1970 r ,9~0 I C A L E N D A R Y E A R
Fig. 7. Heat transfer area growth determined by the independent fractures mode] in the Phase I reservoirs during Run Segments 2 through 5.
Multiple-fracture modeling
The mean reservoir-outlet temperature as measured at 2620 m (8600 ft) in GT-2B during Run Segment 2, is replotted in Fig. 8 along with model fits that invoke an increasing heat exchange area. Run Segment 2 was modeled with a single crack and the following procedure was used to fit the data:
(a) The measured GT-2B flow rate and estimated reservoir inlet temperature were programmed as functions of time.
(b) The initial fracture area was adjusted to obtain the best fit at early times. (c) The fracture area was allowed to increase so as to provide a good fit to
the remaining data. For computational simplicity, the area increase was assumed to occur in discrete steps rather than in a smooth, say piece-wise linear, fashion.
The resulting step increases in the area necessary to fit the data are also shown in Fig. 8.
For the high back-pressure experiment, Run Segment 3, measured down- hole inlet temperatures are available, as are measured GT-2B flow rates. The same procedure as described above was fol lowed to fit the drawdown and infer heat-exchange areas using a single fracture. The results are presented in Fig. 9.

72
1RO
O
i i
o
16 o
~4o
f FMPERATURE
o
~ 120
w
su[
i~kiN .%~GMFNT '
O DA A,26kr~ ( A [ CUt ATIONS WITH AR~A INCREASE ~,~ITHI/HT AREA INCREASF
20 000
\
2(1 ,10 60
TIME (DAYS~
Fig. 8. Computer model comparisons of field data with programmed increases in heat transfer area for Run Segment 2.
The cases of constant or increasing area are compared. As indicated earlier, the independent-fractures model was not able to detect any increase in the effective heat-transfer area during actual drawdown. The present analysis indicates that the heat-transfer area could have increased by a factor of two during either Run Segment 2 or 3. Furthermore, this analysis assumes that the temperature of any new area is close to that of the existing reservoir. If the new area is being produced by thermal stress effects, it most likely occurs in the coldest portions of the reservoir, and its temperature would consequently be less than the aver- age reservoir temperature. The actual area increases would even be larger than estimated here.
Similar modeling was carried out for Run Segments 4 and 5 using three cracks with 10 m spacing. Selection of three cracks was based on anomalies present in the EE-1 and GT-2B temperature and flow rate (spinner) surveys. Figure 10 summarizes the growth of the heat-exchange area, according to the multiple-fractures model, throughout Phase I. The general similarity with the summary of the independent-fractures model, Fig. 7, is noted, but there are

73
140 / I I I I I
q~
O RUN SEGMENT 3 O DATA AT 2.6km CALCULATIONS ; WITH AREA INCREASE
120 ~ E M P ~ WITHOUT INCREAS'EA~REA
TEMPERATURE
\ o \
\
15,000
Z" E
<
<
10,000 u. u') g
b~
<
5,000 ~j a . w
8 0 I I _____L_ I k J 10 20 30
TIME (DAYS) Fig. 9. Computer model comparisons of field data with programmed increases in heat transfer area for Run Segment 3.
differences in detail. The initial area of 7500 m s was established by many pressurizations and some cooling. This area grew to 15,000 m s in Run Seg- ment 2. As indicated earlier the high back-pressure of Run Segment 3 caused a redistribution of f low resulting in fluid dynamic short-circuiting. However, unlike the independent-fractures model, the new model indicates that the initial heat-exchange area was actually less than that of Run Segment 2, start- ing at 6000 mS; but it then grew to 12,000 m s during the 28-day test. The sys- tem was pressurized to high pressures several times during Expts. 203 and 155 (massive hydraulic-fracturing experiments) and Run Segment 4 but no area or volume measurements were made until Run Segment 4. After Run Segment 4, the EE-1 temperature logs indicated that between 6000 and 9000 m 2 had been added to the lower part of the reservoir by the recementing and pressuri- zation prior to and during Run Segment 4. This increased the measured heat- exchange area to between 21,000 and 24,000 m s . The area measurements dur-

74
MULTIPLE FRACTURE MODEL
HEAT EXTRAC]ION PRESSURIZATION
ANo RU~SEOM~NT~ 1
<~ PRESSURIZATION AND
~uJ HEAT EXTRACTION L._ RUN SEGMENT 3-1' ~I---
Z <[ PRESSURIZATION eC I MHF EXPTS ~- HEAT EXTRACTION I 195 AND 203
25000 ~- RUN SEGMEN] 2 ,I - - -
. . . . . . . . .
+
C A L E N D A R Y E A R
Fig. 10. Heat transfer area growth determined by model fits to drawdown data and wellbore temperature logs in the Phase I reservoirs during Run Segments 2 through 5.
ing Run Segment 5 are somewhat uncertain, but our best estimate of the heat-exchange area at the end of Run Segment 5 is at least 45,000 m 2 . The lack of recovery of the outlet temperature indicates that the additional area is in the depleted upper half of the reservoir or was partly added to the lower half as Run Segment 5 proceeded. The increase in heat-exchange area during Run Segment 5, from about 24,000 m 2 to at least 45,000 m 2 is at tr ibuted to thermal stress cracking alone. Unlike the previously noted area increases which occurred during run segments in which there were operating pressures higher than the minimum earth stress, Run Segment 5 was conducted at pressures less than the earth stress throughout , so the area increase is not due to further hydraulic fracturing, but to thermal stress-induced fracturing.
Comparison o f effective heat-exchange areas with other reservoir areas
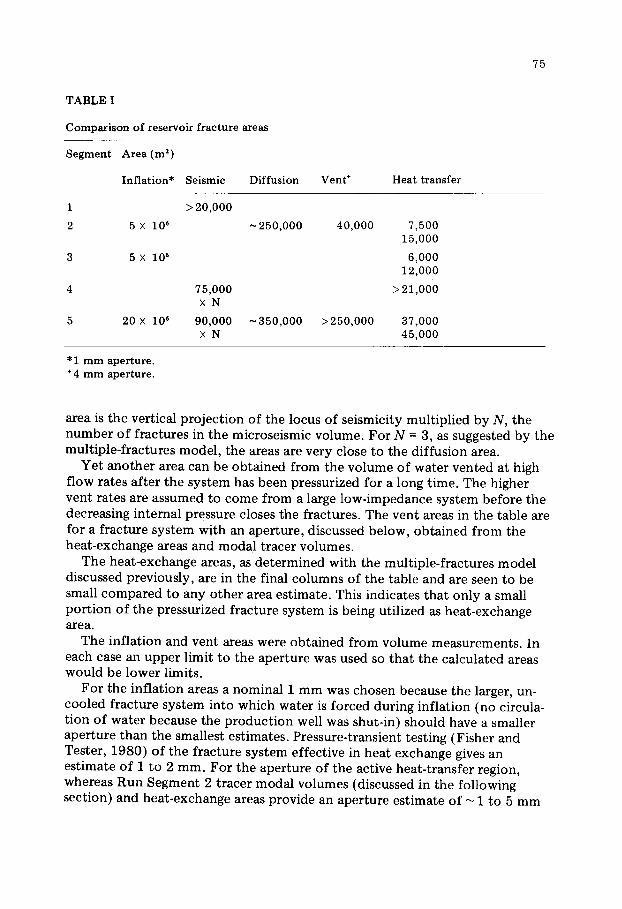
Throughout the development of the reservoir, the heat-exchange area has remained small compared to areas obtained from other methods. Table I lists some of these area estimates. The extremely large inflation areas based upon fracture pressurization and inflation are obtained from total injected volumes divided by the effective opening, or aperture, of the fractures. These apertures are discussed below. The actual area associated with the inflation volume could be larger, as some of the water must be in small-scale porosi ty with smaller apertures. Most of this area cannot be expected to participate in heat exchange.
The diffusion area is obtained mainly from water-loss data. The assumptions used to obtain this area are discussed in Fisher and Tester (1980}. The seismic
75
TABLE I
Comparison of reservoir fracture areas
Segment Area (m')
Inflation* Seismic Diffusion Vent + Heat transfer
1 > 20,000
2 5 × 10⁶ ~250,000 40,000 7,500 15,000
3 5 × 10⁶ 6,000 12,000
4 75,000 >21,000 ×N
5 20 × 106 90,000 ~350,000 >250,000 37,000 × N 45,000
• 1 mm aperture. + 4 mm aperture.
area is the vert ical p ro j ec t i on of the locus of se ismici ty mul t ip l ied by N, the n u m b e r o f f rac tures in the microse ismic vo lume. Fo r N = 3, as suggested by the mul t ip le - f rac tu res mode l , the areas are very close to the d i f fus ion area.
Ye t a n o t h e r a rea can be ob t a ined f rom the v o l u m e o f wa te r ven ted at high f low rates a f t e r the s y s t em has been pressur ized for a long t ime. The higher ven t ra tes are a s sumed to c o m e f r o m a large low- impedance sys t em befo re the decreasing in terna l pressure closes the f ractures . The ven t areas in the table are fo r a f rac tu re s y s t e m wi th an aper tu re , discussed be low, ob t a ined f r o m the hea t - exchange areas and m o d a l t racer vo lumes .
The hea t -exchange areas, as d e t e r m i n e d wi th the mul t ip le - f rac tures mode l discussed previous ly , are in the final co lumns of the table and are seen to be small c o m p a r e d to any o the r area es t imate . This indicates t ha t on ly a small po r t i on o f the pressur ized f rac tu re sys t em is being uti l ized as hea t -exchange area.
The inf la t ion and vent areas were ob t a ined f r o m vo lume measu remen t s . In each case an u p p e r l imit to the aper tu re was used so t ha t the ca lcula ted areas would be lower l imits.
F o r the inf la t ion areas a nomina l 1 m m was chosen because the larger, un- coo led f rac tu re sys t em into which wa te r is forced dur ing inf la t ion (no circula- t ion o f wa t e r because the p r o d u c t i o n well was shut-in) should have a smal ler ape r tu r e t han the smallest es t imates . Pressure- t rans ient tes t ing (Fisher and Tester , 1980) o f the f rac tu re s y s t em ef fec t ive in hea t exchange gives an es t imate o f 1 to 2 m m . F o r the aper tu re o f the act ive hea t - t rans fe r region, whereas Run Segmen t 2 t racer m o d a l vo lumes (discussed in the fo l lowing sect ion) and hea t -exchange areas p rov ide an aper tu re es t imate o f ~ 1 to 5 m m

76
for the heat-exchange region. Consequently, a nominal 1 mm was chosen for the larger and, essentially, still undeveloped reservoir.
Turning now to the area estimate based upon the venting volume, the apertures associated with the low-impedance vent volume should be the same as or smaller than the apertures off the internally depleted, active heat transfer regions of the reservoirs. The largest aperture estimates for the depleted reser- voir were obtained at the end of Run Segment 5 when the modal volume and heat-exchange areas gave apertures of about 4 mm.
TRACER STUDIES AND FRACTURE VOLUME GROWTH
The main objectives of reservoir tracer studies are to assess the volume changes associated with the creation of the Phase I system and to determine dynamic behavior of the system volume as the system undergoes long-term heat extraction. Two tracers were used in these studies. The first is a visible dye, sodium fluorescein, which is monitored in the produced fluid with a UV spectrophotometer. The other tracer, radioactive 82Br {half life equals 36 h) present as ammonium bromide (NH4S2Br), is monitored in the produced fluid with a flow-through gamma counter specially fabricated for this use. The radio- active tracer is not temperature-sensitive and therefore does not undergo thermal decomposition as does the Na-fluorescein in the higher-temperature portions of the reservoir. Flow conditions and preliminary results of tracer tests from the Phase I system are presented in Table II. In this table, the definitions of modal volume, integral mean volume and variance are the same as those presented by Tester et al. (1979). The fracture modal volume is simply the volume of fluid produced at GT-2B between the time the tracer pulse was in- jected and the time the peak tracer concentration appeared in the produced fluid. The wellbore volumes are subtracted from the total volume produced to give the true fracture modal volumes. The integrated mean volume is obtain- ed by integrating the tracer concentration-time curve at the reservoir exit. As described below, the modal volume is considered the most reliable indicator of reservoir volume change. Large changes in the modal volume are observed after the hydraulic fracturing of the system between Run Segments 3 and 4 and during the Stress Unlocking Experiment (SUE), which followed Run Seg- ment 5. SUE was conducted on December 9 and 10, 1980, and the volume change was evaluated with a tracer experiment on December 12, 1980 (Murphy, 1981).
The integral mean volumes show a regular increase during Segment 2; how- ever, the integral mean is strongly affected by the volume of fluid produced during a given experiment. During Run Segments 2 and 4, the length of time a given experiment could be run was determined largely by the limit of detec- tion of Na-fluorescein. The highly increased sensitivity of the method for analyzing 82Br over that for Na-fluorescein is responsible for longer tails on the Br-tracer experiments. Dye-tracer experiments typically end when the dye concentrations in the produced fluid can no longer be measured {typically

77
< 1400 m 3 total produced volume at GT-2B). Bromine-tracer experiments, on the other hand, have continued to 4140 m 3 without completely reaching background. Integration of the long tails of the concentration-time curves biases both the integral mean volume and the variance to higher values. To eliminate the effect of this bias, Tester et al. (1979) truncate the integration when 90% of the tracer has been recovered. Variances of the distributions were calculated for the fully integrated distribution and the 90% trimmed mean, and these values are given in Table II. The variances for the full and the 90% trimmed distributions still show the effects of the long tails; however, the flow distribution associated with low back-pressure operation does not change drastically even after the hydraulic-fracturing episodes. This fact is most clear- ly shown in Fig. 11 where normalized tracer concentrations from Run Segment
VOLUME (gal)
0 200000 400000 600000 800000 1000000 1200000 0.20 , , , ,
z O . . . . 4 / 1 5 / 8 0 FLUORESCEIN I -
0.15 t- ]/ i 5/9/80 828r
w z ........... 9 / : 3 / 8 0 82Br
o 't! D 0.10 . . . . . . 12 /2 /80 82Br(pre-bUE)-
g } , \ \ . , - - - 12112180 82Brlpost SUE) < '~,,.. ~,,.-~
o '.-i.-,.'k~,<::Nr~ z 't ' - ~ ' q ' " 3 " \ 0.05 ' , , ~ ~ = : _ _ _ / ~ _ _
0.00 l i ~ L _ _
1,000 2.,000 3,000 4,000
P R O D U C T P O N V O L U M E ( m 3)
Fig. 11. Variat ion of normalized tracer concent ra t ions with produced vo lume of fluid.
5 are plotted vs produced volume (the volume produced from the time of reservoir injection). Because of the inconsistency in the calculated integral mean volumes, the concentration normalization is performed relative to the modal volume, ~z:
o o
Co =Ci/[~ f CidV] o
The really significant difference among the Segment 5 tracer experiments shown in Fig. 11 is the drastic increase in modal volume due to the SUE experiment. However, the mode also increases regularly with time due to heat extraction.

78
TABLE II
Summary of f luorescein dye and S2Br tracer expe r imen t s in the Phase I EE-1/GT-2B fracture systen"
Exper imen t
~ ~ ~ . ~ ~ ~ ' ~
Original reservoir Segment 2 (75 day)
Phase 1-1 (2 /9 /78) 8 8.8 1.1 8.0 7.25 7.57 1.30 69 150 Phase 1-2 (3 /1 /78) 28 8.5 1.1 26.1 13.1 7.57 0.60 65 110 Phase 1-3 (3 /23/78) 50 6.6 1.1 57.2 13.9 7.57 0.75 71 95 Phase 1-4 (4 /7 /78) 65 5.9 1.1 75.7 15.5 7.57 0.18 >65 90
Segment 3 (28 day) Phase 1-5 (9 /28 /78) i 10 9.3 9.7 9.0 7.7 7.57 3.17 60 111 Phase 1-6 (10 /13 /78) h 25 9.3 9.7 26.3 9.3 11.36 3.17 74 98 Phase 1-7 (10 /16 /78) k 28 9.3 1.7 ~ 3 0 . 0 15.7 11.36 4.28 33 e
Enlarged reservoir Segment 4 (23 day)
215-1 (10 /26 /79) - - 17.2 1.1 1.3 6.4 11.36 8.70 13 (25) f 153 215-2 (10 /29 /79) 0 17.2 10.3 6.1 8.1 11.36 14.00 18 154 215-3 (11/2 /79) 2 9.3 1.1 9.5 6.6 45.42 1.13 27 153 215-4 {11/12/79) 12 9.3 1.1 16.2 6.4 45.42 1.27 25 153
Segment 5 (282 day) 217-A1 (4 /16/80) 38 9.8 1.3 13.1 6.2 45.42 0.90 217-A2 (5/9/80-Br) j 61 9.5 1.3 26.5 5.9 38.4mCi ] 0.50 217-A3 (9/3/80-Br) 178 8.8 1.3 74.0 5.7 383.0mCi 0.38 PreSUE 217-A4
(12/2/80-Br) 268 8.5 1.1 121.0 5.1 519.0mCi 2.30 ° Pos tSUE 217-A5
(12/12/80-Br) 278 8.4 1.3 126.0 8.1 377.0mCi 0.90 °
>57 158 - - 1 5 8
- - 1 5 4
149
149
a l g a l = 3 . 7 8 5 1 i t e r s = 3 . 7 8 5 x 10 Sm s" b l gpm = 6.31 × 10 ~ liters/s = 6.31 × 10 -s mS/s. c Includes diffusional loss and leaks. dpe*-I = D/ul = inverse dispersional Peclet number for single 1-D zone fit. e S p e c t r o p h o t o m e t e r error possibly explains low recovery. f 25% recovered after swi tch to high backpressure in GT-2B. gSurface pressures no t buoyancy corrected.

79
0
II
34.4 25.6 29.3 0.65 0.44 0.591 11.4 ± 1.1 2.29 37.5 28.9 30.9 0.62 0.43 0.942 17.0 ± 1.5 7.16 54.7 45.1 46.3 0.51 0.42 0.944 22.7 ± 2.3 12.90 56.2 48.4 49.2 0.47 0.39 1.120 26.5 ± 2.7 16.40
+ 5.7 33.1 24.7 26.6 0.75 0.56 0.358 3 . 8 - - 1.9 1.01 56.5 46.5 48.1 0.45 0.36 0.306 11.4 ± 1.5 3.36 49.6 40.5 41.8 0.49 0.38 0.347 20.8 ± 1.9 3.70
10
2.5
207.0 192.0 184.0 0.26 0.22 0.195 136.0 ± 19 469 -- 230.0 211.0 209.0 0.17 0.12 0.360 144.0 ± 19 619 -- 262.0 216.0 243.0 0.38 0.34 0.281 121.0 ± 11 570 0.37 283.0 236.0 263.0 0.32 0.28 0.310 129.0 ± 11 662 2.24
404.4 341.1 500.0 0.45 0.44 0.760 155.0 ± 10 1440 5.9 1100.0 1072.0 941.0 0.53 0.52 -- 161 .0± 4 3030 m 9.9 1311.0 1245.0 1274.0 0.56 0.54 - - 178.0 -+ 4 4140 TM 27.1
581.0 n 541.0 525.0 0.40 0.38 -- 187 .0± 10 1310 n 39.9
1118.0 n 965.0 1009.0 0.46 0.42 -- 266 .0± 4 2690 n 41.2
120
151
h V o l u m e cor rec t ion added 7.344 m ~ (1940 gal) to e l iminate negative volumes (early arrivals). i Vo lume cor rec t ion added 3.937 m 3 (1040 gal) to e l iminate negative volumes (early arrivals). J Tracer used S2Br in place of Na-fluorescein. k10 /26 /78 test actually during exp. 190 at LBP. 1 Millicurie (mCi) s t rength of feed at injection. mCor re sponds to first arrival of tracer. n E x p e r i m e n t t e rmina ted before tail o f d is t r ibut ion. ° Inc ludes annulus leak.

80
Apparently the volume of the system increases systematically even though the shape of the distribution remains fairly unchanged even after the Stress Unlock. ing Experiment (see Table II).
A complete review of the tracer-test data from Segments 2 through 5 has revealed pertinent information regarding the growth of the reservoir due to heat extraction and pressurization effects. The reservoir growth due to heat extraction is, to be precise, really a thermal-contraction effect .... as the rock surrounding the fractures shrinks, the fractures, and consequently, the mea- sured volumes, expand. Ultimately, we would like to correlate measured tracer volumes with effective heat-transfer surface. In addition, the interpretation of tracer volume changes could be used to develop improved methods of reservoir operation -- for example, remedial pressurization for stress relief such as SUE, or a huff-puff operation mode in contrast to our normal (stress-constrained) continuous mode of extracting heat.
Figure 12 is a linear plot of modal-volume increase (A V) as a function of
T H E R M A L ENERGY, M W t t ) D A Y S o 1 oo 200 T f r
oR! / /
L~ ~ / ~ FREE THERMAL EXPANSION
/ z
/
300 400 500 " T -
TOA~=115m ~
POST SUE SEG 5
/ ,NCREAS'NG / "
/ 1 / _ _ _ / _ LOW BACK PRESSURE, : .: / NORMALRESERVO'R ] NORMALLY CON, TRA,NED
/~E~.OPE RATING ENVELOPE I / RESERVO
20!
/ y • RUN SEG 5 ENLARGED RESERVOIR -- / \ ~ O RUN SEG 2 ORIGINAL RESERVOIR
o<:~ ! ~ ~ • RUN SEG 3 (HBPt : / • i ~ • RUN SEG 4 (LBP4-MHF) i
/ •
o ............................................. ..................................................................................... Xo-- A E { T H E R M A L ENERGY E X T R A C T E D , 10 ,2 J)
Fig. 12. Increase in t racer m o d a l vo lume as a f u n c t i o n of t he rma l energy ex t r ac t ed .
net thermal energy* extracted from the reservoir (AE) while Fig. 13 shows the same data on a logarithmic scale. Essentially identical linear behavior is observed for the low back-pressure experiment, Run Segment 2, of the original reservoir and the low back-pressure experiment, Run Segment 5, of the enlarged system. In spite of nonlinear coupled effects of thermal contrac-
*Excludes energy c o n t r i b u t i o n s f rom the wellbores.

100
E
(,3 <
o z
8
THERMAL ENERGY, MW (t) - DAYS 100 1000
. . . . . . I ' / . . . . . . . I /
/
FREE THERMAL VOLUME - - J / o
(P )r J s.9, Id~y.//
/ /
/ /
/ /
NORMAL OPERATIN G ENVELOPE
POST SUE • SEG.5
/ ,0 j - • - .,~'~NORMALLY
/ RESERVOIR
' / / / "
1 / I I I I I I I I l L _ _ I
CONSTRAINED
• RUN SEG. 5 LBP O RUN SEG. 2 LBP • RUN SEG. 4 (MHF+LBP) • RUN SEG. 3 (HBP)
I I ~ I [ I 100
A E (THERMAL ENERGY EXTRACTED, 10 TM J )
Fig. 13. Increase in tracer modal vo lume as a func t ion o f thermal energy extracted .
81
tion, pore and fracture inflation due to sustained pressurization, and local irreversibilities resulting in fracture propagation, a simple correlation between
V and ~ E exists. Furthermore, this simple relationship persists even in the presence of the confining stresses surrounding the active reservoir, which in- duce a constrained behavior. The slope of the line for low back-pressure is only about 10% of what would be expected for free thermal expansion (~ V = [Olv/(PC)r ] A E ) in a stress-free environment. Values of ~v = 24 × 10 -6 K -1, Cr = 1000 J/kgK and p = 2700 kg/m a were used to represent the granite matrix. For practical purposes, the region between the low-pressure data and the free thermal volume lines defines an envelope of reservoir-operating conditions. As stresses are relieved, for example during the stress-unlocking experiment at the end of Run Segment 5, or the high back-pressure test of the original reser- voir (Run Segment 3), or the high-pressure, hydraulic-fracturing stage at beginning of Run Segment 4, one moves away from the normally constrained condition toward the free thermal expansion line.
Perhaps the most promising aspect of the tracer tests is their potential for

82
300F
% 2oo~
© >
©
PRESSURIZATION AND HEAT EXTRACTION RUN
PRESSURIZATION AND HEAT SEGMENT 4 ~I t
EXTRACTION RUN SEGMENT .t
r " PRESSURIZATION 7= . . . .
HEAT ~ MHF EXPTS
'~ 00 !- 1 -~X TRuANCTIOIsEGMENT ~ J-J/ . . . . . '13 195 AND 203 '
1978 1979 CALENDAR YEAR
HEAT EXTRACTION RUN SEGMENT 5
/ f "
/
1980
Fig. 14. G r o w t h o f tracer modal vo lume in the Phase I reservoirs during R u n Segments 2 through 5.
estimating the effective heat-transfer surface area of a reservoir. This becomes clear when the modal volume (plotted vs time in Fig. 14) is compared to the corresponding heat-transfer area (plotted vs time in Figs. 7 and 10); the similarities of the growth of area and volume are quite striking. This can be quantified by considering the relationships between area, volume and aperture (or effective fracture opening). The volume, V, is simply the product of the area, A, and the mean aperture, w:
V = A X w
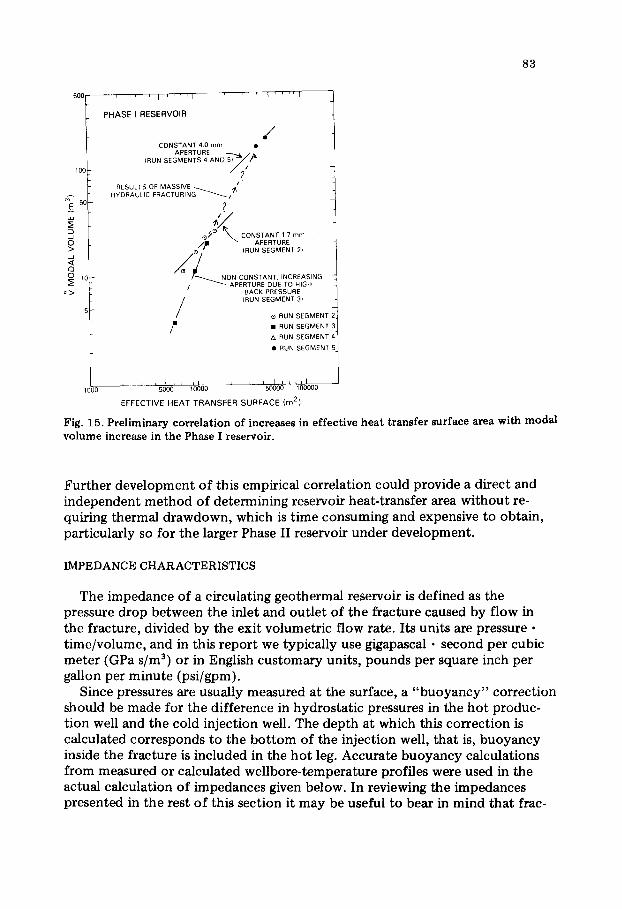
During heat extraction and/or pressurization, the area and aperture can both vary; therefore, the volume is a function of two variables rather than one. For constant aperture, the tracer volumes should scale directly with heat-transfer area. A suggestion of this behavior is seen in the data from Run Segment 2, shown in Fig. 15, where the area vs modal-volume curve has an intercept that corresponds to a constant 1.7-mm aperture. Subsequent pressurization has apparently increased the aperture. Because only minimum estimates of the heat-transfer area are available for two of the measured volumes in Run Seg- ments 4 and 5, not all of the tracer data can be used in this figure. It is likely that the data from Run Segment 5 would also fall upon a line of constant aperture, in which case, the mean fracture aperture would be roughly 4 mm. There is insufficient information available to provide upper bounds for the heat-transfer area from Run Segment 5, so the correlation between heat- transfer area and modal volume is inferred by analogy with Run Segment 2.
83
500 ' I ' ' ' ' I
10(
s0
O >
r'-, (::3
o>
' I ' ' ' ' 1
PHASE I RESERVOIR
,,/ CONSTANT 4.0 rnm
APERTURE [RUN SEGMENTS 4 AND
- ?
RESULTS OF MASSIVE ~ t HYDRAULIC FRACTURING ~ / ~
?
Q~" CONSTANT 1.7 mm APERTURE
@ ' 1 IRUN SEGMENT 2)
Z / ~ NON-CONSTANT, INCREASING / ~ APERTURE DUE TO HIGH
BACK PRESSURE (RUN SEGMENT 3)
O RUN SEGMENT : / 11 : RUN SEGMENT 3
RUN SEGMENT 4
• RUN SEGMENT
t j , ~ , , , , I , , i I a ~ L IL ~000 5OOO ~0000 50OOO 1OO0OO
EFFECTIVE H E A T TRANSFER SURFACE (m 2)
Fig. 15. Preliminary correlation of increases in effective heat transfer surface area with modal vo lume increase in the Phase I reservoir.
Further development of this empirical correlation could provide a direct and independent method of determining reservoir heat-transfer area without re- quiring thermal drawdown, which is time consuming and expensive to obtain, particularly so for the larger Phase II reservoir under development.
IMPEDANCE CHARACTERISTICS
The impedance of a circulating geothermal reservoir is defined as the pressure drop between the inlet and outlet of the fracture caused by f low in the fracture, divided by the exit volumetric flow rate. Its units are pressure • t ime/volume, and in this report we typically use gigapascal • second per cubic meter (GPa s/m 3) or in English customary units, pounds per square inch per gallon per minute (psi/gpm).
Since pressures are usually measured at the surface, a "buoyancy" correction should be made for the difference in hydrostatic pressures in the hot produc- tion well and the cold injection well. The depth at which this correction is calculated corresponds to the bot tom of the injection well, that is, buoyancy inside the fracture is included in the hot leg. Accurate buoyancy calculations from measured or calculated wellbore-temperature profiles were used in the actual calculation of impedances given below. In reviewing the impedances presented in the rest o f this section it may be useful to bear in mind that frac-

84
ture impedances o f a b o u t 1 GPa s /m 3 are cons ide red desirable. Fo r example , in the d e e p e r and h o t t e r Phase II reservoir being c o m p l e t e d now, such a low value of i m p e d a n c e could ac tua l ly resul t in " s e l f - p u m p i n g " of the reservoir because of b u o y a n c y effects .
Run Segment 2
Flow th rough the r o c k b e t w e e n the wel lbores takes place t h rough na tura l weaknesses in the rock . Since each we l lbore m a y in tersec t m a n y such fea tures , there are n u m e r o u s en t r ance and exi t regions, as shown in Tables I I I and IV.
TABLE III
Position and magnitude of relative EE-1 injection flows, Run Segment 2
Cable depth interval Cable depth interval Flow fraction (m) (ft)
2073--2179 6800--7150 0.05 2271--2377 7450--7800 0.06 2484--2530 8150--8300 0.01 2606--2652 8550--8700 0.01 2652-2896 8700--9500 0.81 2896--2957 9500--9700 0.05
Total 1.00
TABLE IV
Position and magnitude of GT-2B exit flows, Run Segment 2
GT-2 Laboratory cable depth Flow Absolute flow fraction
(m) (ft) (gpm) (m3/s)
2660--2661 8726-8729 0.38 92 0.0058 2671-2672 8764-8765 0.05 12 0.00075 2686-2688 8812--8820 0.20 48 0.00303 2705-2706 8876-8879 0.12 29 0.00183 2719 8920 0.25 61 0.00385
Total 1.00 242 0.0153
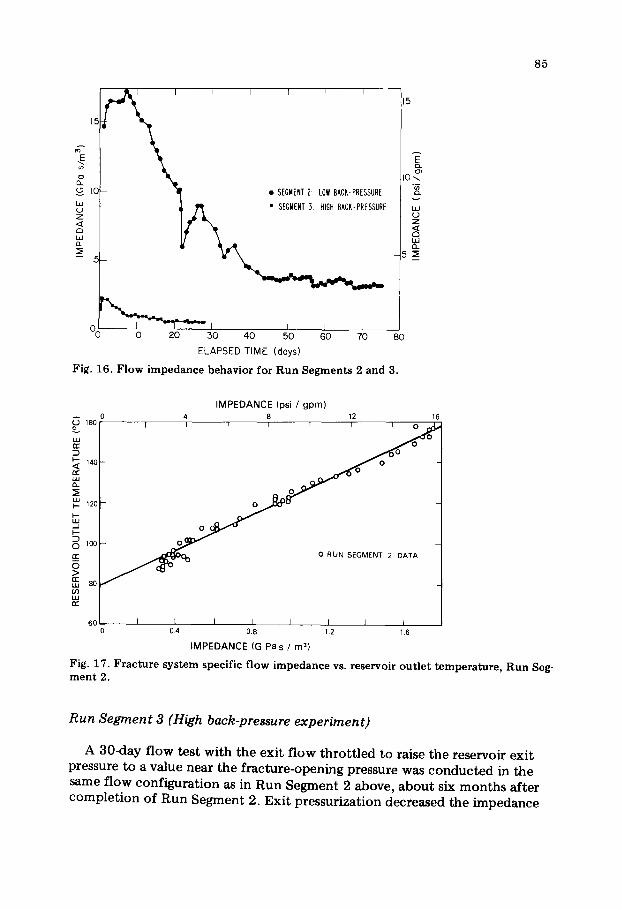
S tep changes in f low were observed dur ing the tes t ( the largest was 0 . 00126 m3/s or 20 gpm) , p r o b a b l y co r r e spond ing to shear stress rel ief b y relat ive m o t i o n o f the r o c k faces a long a f low pa th . T h e overall t r end of the f low i m p e d a n c e was d o w n w a r d , as shown in Fig. 16. This i m p e d a n c e change cor re la t ed l inear ly wi th the ex i t t e m p e r a t u r e , as seen in Fig. 17, i.e., f r ac tu re wid th increased as the r o c k coo led and sh rank and f r ac tu re c losure stress decreased.
8 5
~ I q ] r I [
~-" 151 n ° ~
I0 • SEGMENT 2. LOW BACK-PRESSURE
~ o ~ ~ . , _ I j , ! 0 I0 20 30 40 50 60 70
ELAPSED TIME (days)
Fig. 16 . F l o w i m p e d a n c e behav ior for R u n S e g m e n t s 2 and 3.
15
80
I0.~
LsJ
Z
la.I
o• 180
140
120
_J
o ~ 10o l I o > ~ 80 (,9
60
IMPEDANCE (psi / gpm) 4 8 12 16
i I I I I ] I O ~ ~ o O o
, / ~ 0 0 0 0 RUN SEGMENT 2 DATA
I [ I I I J ] I 0.4 0.8 1.2 1.6
IMPEDANCE (G pa s / m 3)
Fig. 17 . Fracture s y s t e m spec i f i c f l o w i m p e d a n c e vs. reservoir o u t l e t t empera ture , R u n Seg- m e n t 2.
Run Segment 3 (High back-pressure experiment)
A 30-day f low test with the exit f low throttled to raise the reservoir exit pressure to a value near the fracture-opening pressure was conducted in the same flow configuration as in Run Segment 2 above, about six months after completion of Run Segment 2. Exit pressurization decreased the impedance
86
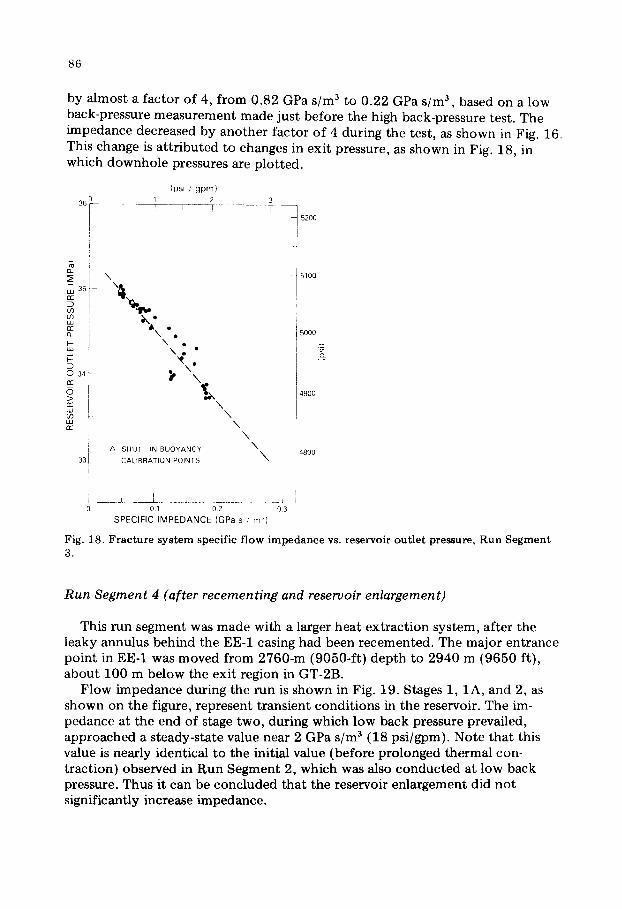
by almost a factor of 4, from 0.82 GPa s/m 3 to 0.22 GPa s/m 3, based on a low back-pressure measurement made just before the high back-pressure test. The impedance decreased by another factor of 4 during the test, as shown in Fig. 16. This change is at t r ibuted to changes in exit pressure, as shown in Fig. 18, in which downhole pressures are plotted.
(psi / g p m ) ~_ 1 2 3
36 I ] ] ~ - - ' ~ . . . . . . 7 . . . . 7 - - - -
2 i
35 i \ ~ : ,
uJ
\ o ..a \ • •
D \ o 34 ; t \ r~
2' 2 w \
N Z~ SHUT IN BUOYANCY \ i \
331 CAt,BRAT,ON PO,NTS
! i'
0 01 02 03 SPECIF IC I M P E D A N C E (GPa s ,' m 3)
5200
I
5100
4 5000
I
I - -
4900
4800
Fig. 18. Fracture system specific flow impedance vs. reservoir outlet pressure, Run Segment 3.
Run Segment 4 (after recementing and reservoir enlargement)
This run segment was made with a larger heat extract ion system, after the leaky annulus behind the EE-1 casing had been recemented. The major entrance point in EE-1 was moved from 2760-m (9050-ft) depth to 2940 m (9650 ft), about 100 m below the exit region in GT-2B.
Flow impedance during the run is shown in Fig. 19. Stages 1, 1A, and 2, as shown on the figure, represent transient conditions in the reservoir. The im- pedance at the end of stage two, during which low back pressure prevailed, approached a steady-state value near 2 GPa s/m 3 (18 psi/gpm). Note that this value is nearly identical to the initial value (before prolonged thermal con- traction) observed in Run Segment 2, which was also conducted at low back pressure. Thus it can be concluded that the reservoir enlargement did not significantly increase impedance.

87
]0.0
8.0
6 0 w ¢,D z g ~ 4.C
2.0
NOVEMBER
151 LTI 191 LIII Its[ IlSl ,oo L ~
L= LOW BACK-PRESSURE
H = HIGH BACK-PRESSURE 80
• CORRECTED FOR BUOYANCY
OCTOBER
1241 I~1 1281 13Ol I I
- - _ l
I t I
.q ~ J oJ
~I ~ ~ I (.9
t I f
I
[3[
- , . , • UNCORRECTED
'STAGe 4
0 i i l J i 0 4 8 12 16 20
TIME (days)
Fig. 19. Flow impedance behavior for Run Segment 4.
Z
4O 0 w Q_
-- 20
0 24
A short high back-pressure run was conducted as stage three. The impedance dropped by a factor greater than 2 when the GTo2B pressure was raised, to ~ 0 . 8 0 GPa s/m ~ (7.5 psi/gpm), and subsequently recovered to a steady-state value of 1.85 GPa s/m 3 (17 psi/gpm) after the back pressure was reduced. This impedance remained remarkably constant during the rest of Run Segment 4. This may be attributed to the relatively small amount of cooling over the fracture face during this test, together with the constant pressure conditions.
Run Segment 5 (286 day flow test)
After an initial transient decline, the impedance during this run segment remained essentially constant at 1.75 GPa s/m 3 (15.5 psi/gpm), as shown in Fig. 20. Despite the evidence for area and volume growth cited earlier, no evi- dence of impedance change due to cooling of the rock was observed, and the impedance was essentially constant at the same value as in the last half of Run Segment 4.
Stress Unlocking Experiment (SUE)
At the end of Run Segment 5, GT-2 was shut-in and the entire system pressurized to approximately 15 MPa in order to facilitate readjustment of the reservoir rocks to the new system of stresses, which had been generated by cooling the reservoir. Numerous microseismic signals were observed (Murphy, 1981) , indicating that such readjustment was taking place, and the fracture

88
impedance, under the same low back-pressure conditions as in the 286-day test, was decreased to 0.90 GPa s/m 3 (8.2 psi/gpm) as determined by a subsequent flow test.
Discussion
Figure 20 summarizes the impedance history over Segments 2 through 5 and the SUE experiment. Impedance is dependent on fracture aperture, w, Theoretically, it decreases as 1/w 3 in both laminar and turbulent flow. Aper-
40
4 . o - ~ ~ , ~ o s ~ i ~4
3O
cJ~
20 z
L L i
1,0 ~
_ ~ . . . . . . . . . . . . t - -__ 1978 1979 1980
CALENDAR YEAR
Fig. 20. F l o w i m p e d a n c e b e h a v i o r in t h e P h a s e I r e s e r v o i r s d u r i n g R u n S e g m e n t s 2 t h r o u g h 5.
L I I 30!
z <
ture may be increased in several ways: (1) by pressurization of the fracture; (2) cooling of the surrounding rock; (3) dissolution of minerals lining the crack by chemical treatment of the fluid; and (4) by geometric changes result- ing from relative displacement of one fracture face with respect to the other. Run Segments 2 and 3 were especially useful in demonstrating the correlation between impedance and pressure and temperature. The impedance changes observed after SUE were probably due to additional "self-propping" caused by slippage along the fracture faces near the exit or by other pressure-induced geometric changes.
WATER LOSSES
The water loss of an HDR system is very important because this water must
89
be provided from some outside source. This information can be vital for en- vironmental as well as economic reasons. The water-loss rate, that is, the rate at which water permeates the rock formation surrounding the fracture system, is the difference between the injection rate and the produced, or recovered, rate at GT-2B. This loss rate is a strong function of system pressures and flow rate and would also be expected to be a function of reservoir size.
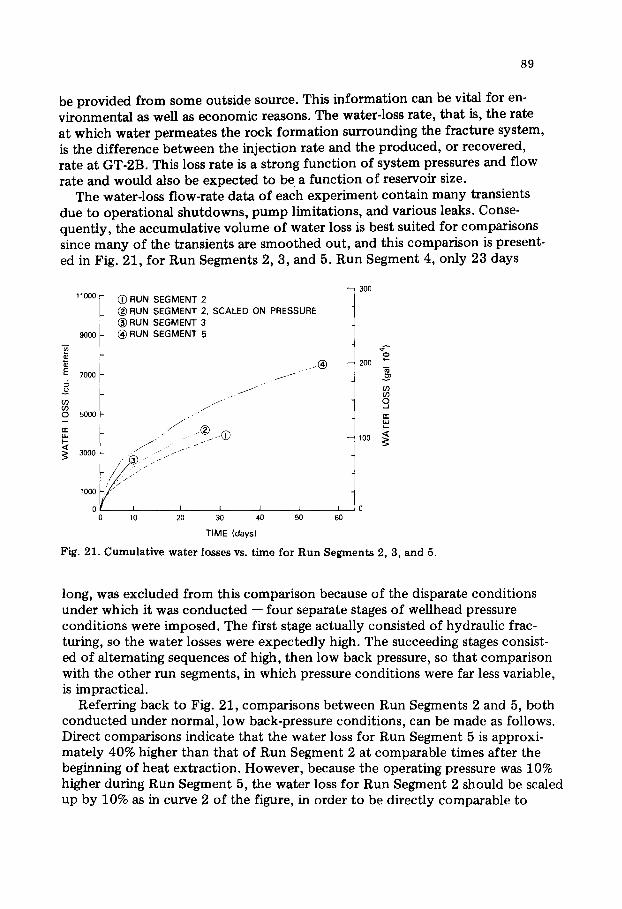
The water-loss flow-rate data of each experiment contain many transients due to operational shutdowns, pump limitations, and various leaks. Conse- quently, the accumulative volume of water loss is best suited for comparisons since many of the transients are smoothed out, and this comparison is present- ed in Fig. 21, for Run Segments 2, 3, and 5. Run Segment 4, only 23 days
11000
9000
E 7o00
~D S) 5000
t~ uJ <
3000
1000
0
(~) RUN SEGMENT 2 ® RUN SEGMENT 2, SCALED ON PRESSURE (~) RUN SEGMENT 3 (~ RUN SEGMENT 5
. . J
~ . . f f j j /
I I
10 20 I 1
30 40
TIME ( d a y s )
. . ~ ( ~
50
-- ~ 300
200
er
100
I 0 60
Fig. 21. Cumulat ive water losses vs. t ime for Run Segments 2 , 3 , a n d 5 .
long, was excluded from this comparison because of the disparate conditions under which it was conducted -- four separate stages of wellhead pressure conditions were imposed. The first stage actually consisted of hydraulic frac- turing, so the water losses were expectedly high. The succeeding stages consist- ed of alternating sequences of high, then low back pressure, so that comparison with the other run segments, in which pressure conditions were far less variable, is impractical.
Referring back to Fig. 21, comparisons between Run Segments 2 and 5, both conducted under normal, low back-pressure conditions, can be made as follows. Direct comparisons indicate that the water loss for Run Segment 5 is approxi- mately 40% higher than that of Run Segment 2 at comparable times after the beginning of heat extraction. However, because the operating pressure was 10% higher during Run Segment 5, the water loss for Run Segment 2 should be scaled up by 10% as in curve 2 of the figure, in order to be directly comparable to

90
Run Segment 5. Then it is seen that the Run Segment 5 water loss is only 30% higher than Run Segment 2, despite a several-fold increase in heat-transfer area and volume. An obvious conclusion is that the heat-exchange system utilizes only a small por t ion of a much larger fracture system that controls water loss. This large, potential fracture system was not altered to any large extent by the MHF experiments of Segment 4. In fact this was seen near the conclusion of the heat-transfer section, where it was noted that the heat-transfer area was small compared with the other areas indicated by seismic, inflation, or venting measurements. Fur thermore, in comparison to the heat-transfer areas these other areas did not grow significantly f rom Run Segments 2 through 5.
At the end of Run Segment 2 the actual water loss rate was only 1 × 10 -4 m3/s, about 1% of the total flow rate circulated through the reservoir. However, this extremely low loss rate was due to the gradual decrease in surface pressure after 30 days. The loss rate extrapolated to the end of the experiment and by model fits to the first 30 days is 7 × 10 -4 m3/s. At the end of Run Segment 5 the loss rate was 6 X 10 -4 m3/s, about 10% of the circulated flow rate. The Run Segment 3 losses are slightly larger than those of Segment 2, which is consistent with the fact that both EE-1 and GT-2B were pressured in Run Seg- ment 3. At the end of Run Segment 3 the loss rate was 1.3 × 10 -3 m3/s, about 14% of the circulating rate.
The use of a pressure-dependent, water-loss diffusion model Tester and A1- bright (1979); Murphy (1980); Tester et al. (1979) confirm these comparisons. The theoretical fits to the data are most sensitive to two parameters: (a) a = A x/k~, which is evaluated at starting or hydrostatic pressure (where A is the diffusion area, k the permeability, and/3 the system compressibility); and (b) C, a constant that determines the pressure dependence of a (Tester et al., 1979). This parameter is best interpreted as the reciprocal of the sum of the confining stress and a fracture modulus. Values of a and C, obtained from numerical modeling, are tabulated in Table V.
Similar to the water losses, the a for Run Segment 5 is ~ 30% higher than that of Run Segment 2 and probably reflects the addition of the lower half of the reservoir. The value of C was determined mainly by one flow transient in Run Segment 5. The range of C -1 indicated in the table reflects the lack of sensitivity to this parameter. Short-term transients, even in the water losses, measure some local parameters. It is possible that the response of lower half of the reservoir is determined by a larger componen t of in situ stress.
T A B L E V
Water- loss d i f fus ion p a r a m e t e r s
R u n S e g m e n t ~ ( m 3 M P a -1'2) C -1 (MPa)
2 1.4 × 10 -6 9.3 3 1.4 × 10 -6 to 2.8 × 10 -6 9.3 5 1.9 × 10 -6 1 3 . 3 ~ C- ' < 20.0

91
SEISMICITY
Seismic monitoring was conducted for all the run segments. The objectives of this monitoring are: (1) evaluation of potential seismic risks associated with HDR geothermal energy extraction; and (2) use of microseismic events to infer reservoir geometry. Continuous monitoring was conducted with a sur- face seismic array, for all Run Segments, and during portions of Run Segments 4 and 5, and the stress unlocking experiment, with downhole geophone packages positioned in the reservoir vicinity. The surface array consisted of six stations within 750 m (1/2 mile) of the site, five borehole stations located within 10 km of the site, and the Los Alamos National Laboratory regional n e t - the nearest of which is located at 10 km. The sensitivity of this surface array ex- tended to Richter earthquake magnitudes of 0 to - 1 . 5 and is limited by the nearly 3 km of vertical separation and the large seismic attenuation of the near-surface sediments and volcanics. Each downhole geophone package con- sists of 12 geophones, 4 each in the x-, y-, and z-direction axes. Typically the sensitivity of these downhole packages extends to local magnitudes on the extrapolated Richter scale as low as --6. For both Run Segments 4 and 5 a single downhole package was positioned in EE-2, which was drilled for the Phase II reservoir, and used simply as an observation well in these experiments. During the stress unlocking experiment an additional geophone package was positioned in the production well GT-2B.
Addressing seismic hazards first, there apparently are none. The largest event detected in Run Segment 4 with the downhole package had a magnitude of--1.5 . The energy release of a - 1 . 5 magnitude microseismic event is roughly equivalent to that of a 10-kg mass dropped 3 m. Furthermore, this event occurred during the high back-pressure stage; during the low back- pressure stage, more typical of ordinary heat-extraction conditions, the largest event was - 3 . During the 286-day Run Segment 5, 13 microearth- quakes ranging between - 1 . 5 and 0.5 were recorded by the surface seismic array. These events were located about 200 m north of EE-2 at a depth of about 1 km. The events are not related to Run Segment 5 activities, but rather to the drilling of EE-2 and 3. They began about 11 days after EE-2 began losing large amounts [as much as 2 X 10 .2 m3/s (450,000 gal per day)] of drilling fluids at the lithologic boundary separating the sediments and volcanics from the Precambrian crystalline rocks below. This fluid loss was caused by a casing failure during the drilling operation. The related seismic events subsided about 60 days after the casing was repaired, but before that about 3 X 10⁴ m 3 (8,000,000 gal) of fluid were pumped into the unconformi- ty. It is believed this fluid triggered the release of tectonic stress in that portion of the basement adjacent to the unconformity. The cumulative seismic- energy release of these events was about that of a magnitude 0.75 earthquake. We reiterate that even these small events are related to drilling, not reservoir operations.
We turn now to the other task, which is to use microseismic event locations

92
to predict in a quantitative fashion the geometry of the resulting 3-dimensional temperature field with time as heat is extracted. Discussions with electric utility representatives have made clear the fact that commercial use of future reservoirs requires firm estimates of expected useful lifetime. Up to now our firmest estimates are based upon modeling of thermal drawdown, which re- quires long and expensive testing. Only through the experience gained from numerous past experiments can this testing period be bypassed. Recourse to measured thermal drawdown in the recovery well of a large reservoir with a calculated useful lifetime of 10 or more years would add an overwhelming financial burden.
An examination of the various methods we have employed to measure and characterize these systems reveals only two at this time with the potential of providing this needed information. The first of these, discussed earlier, in- volves measurement of fracture volumes with tracers and correlating volumes with heat exchange areas. The second method is microseismic mapping, which is discussed in the remainder of this section.
Past observations of the microseismic response associated with the creation and operation of our HDR reservoirs can be summarized as follows:
(1) Microseismic activity is always present during initial fracturing. (2) There exists a pressure and volume threshold for microseismic activity;
above this threshold pressure, related to the minimum earth stress, significant microseismic activity can be generated when the amount of fluid injected exceeds 2/3 the maximum previous injected volume.
(3) The events observed during the initial stage of pressurization in general are clustered in a vertical zone striking NNW. We will refer to this as the planar- event region.
(4) Continued pressurization and water-loss diffusion results in microseismic events occurring considerable distances (~> 500 m) away from both the in- jection point and the planar event zone. This will be referred to as the non- planar-event region.
(5) The location of the zone of heat removal occupies a small portion of the planar-event region.
(6) The surrounding volume of rock space defined by the nonplanar seismic events is not an important part of the active HDR system with the present wellbore geometry but plays an important role in water loss and/or storage in the reservoir.
(7) There is only very low-level seismic activity associated with the removal of heat during normal operation of the Phase I reservoir. Apparently thermal depletion, accompanied by rock shrinkage, has rendered the heat-exchange region aseismic.
(8) Pressurization of the partially drawndown reservoir during SUE resulted in significant seismic activity starting at pressures and injected volume lower than those observed with pressurization of uncooled systems. This thermal stress/pressurization augmentation of microseismicity appears to originate in regions just outside and peripheral to the active heat-exchange regions.

93
The vertical dimension of the planar-event region that bounds the aseismic zone and that extends from ~ 2820 to 2950 m, coincides quite closely with the location of the region of significant thermal drawdown determined from the latest EE-1 thermal-recovery survey shown in Fig. 22. Figure 23 shows
TEMPERATURE (°C)
90 100 110 120 130 140 1~0
EE-1 TEMPERATURE PROFILE
2500
2600
2700
2800
2900
300G
APPROXIMATE EXTENT OF EE 1/GT-2B
MAIN FRACTURE FLOW PATH FLUID PRODUCTIOIk
. ~ ] / / ~ \ ZONE (GT-2B)
ZONE OF SEGMENT 2 ~z"/,.~ I ~ l ,
l I
~25m ~ '¢ "~- \ ~
SE,SM,C
~ ~1 i ,~ / " ~FLUID INJECTION
_OCATION OF THE PLANAR MICROSEISMIC EVENTS IN THE TEMPERATURE FIELD OF THE MAIN FRACTURE SYSTEM
Fig. 22. Recovery temperature survey in EE-1 (7/10/81) showing correlation of the region of thermal drawdown with the planar event and aseismic regions.
plan and elevation maps of the hypocenters of the SUE events displaying the more likely of two sets of solutions. Murphy (1981) provides analysis of the location methods applied to the information obtained from both geophone stations operated during the experiment. Of particular interest is the aseismic region centered about the EE-1 well-to-reservoir injection location. Its location and general size (diameter ~ 100 m) are suggestive of an area that may be attributed, for Run Segment 5, to the cooled region centered about the cold- water injection location. Assume now that the severe thermal contraction resulting from heat-extraction stress relieves the rock to such an extent that subsequent pressurization produces no further failure. The separation of the SUE microseismic-event sequence into 1-h intervals, as shown in Figs. 24 to 26 allows further examination of this hypothesis. The upper figures labeled

94
PROJECTION PLANES USED FOR THE PLOTS OF THE HYPOCENTERS /
L~
200 "~ p'r" . ~ ,r;-
dP A
k •
J
GT 2B GEOPHONE STATION N
2700n TVD
-- 200r ~ ~
EE 1 NJECT ON SITE
ASEISMIC REGION
\
/ /
/ J
EE 2 GEOPHONE STATION (2920m TVD)
Fig. 23. Elevation view (left) and plan view (right) of microseismic events located by two station method during SUE.
(16 : 4 2 k17:44) on Fig. 24 show the events during the first hour of pressuriza- tion. In the plan view (Fig. 24,-upper right) the grouping of the events occurs m a rather narrow, linear fashion. The trend or strike of this group in a slightly west of north direction is consistent with that obtained from earlier experiments. Of still greater interest is the grouping of events in a narrow band just outside of the boundary of the aseismic region as can be seen in the elevation view (Fig. 24, upper left). These events that occur over a ~ 150-m depth interval, must lie in a near-vertical planar zone whose extension passes quite close to the reservoir injection and recovery Sites.
The next time sequence {Fig. 24, 17 : 4 8 - - 1 8 : 50) shows a growth in the lateral extent of the linear event group. Also apparent is the appearance of a cluster of events separated from the main group. The elevation view again locates those events which were in the linear group (plan view, lower right} in the same narrow band. The cluster of events is located adjacent to the band but outside of the planar feature. One might assume that this is activity associated with the expanding pressure field moving out away from the heat- transfer system. The next time. interval (Fig. 25, 18 : 5 6 - - 1 9 : 37) continues the sequence. The off-plane group activity has moved upwards as has some of the

1 7 : 4 8 - - 1 8 : 5 0
N
N
i
N
1 6 : 4 2 - - 1 7 : 4 4
UP
UP
N
E
95
Fig. 24. Elevation view (left) and plan view (right) maps of microseismic activity during the first and the second one-hour intervals (Dec. 9, 1981). =
planar activity. The fourth sequence (Fig. 25, 19 : 5 9 - 21 : 00) has the planar activity dying away, along with the appearance of a new cluster group lying higher and further away. The plan view (lower right) of these several regions suggests their parallel nature. The fifth sequence (Fig. 26, 21 : 02--22 : 04) is more difficult to explain in that a fewer number of events occurred and the second cluster is missing. The final sequence (Fig. 26, 22 : 09--23 : 10) still shows activity in the zone adjacent to the aseismic zone and also the reappear- ance of the second cluster.

96
18:56-- 19:37 UP
\\
\
. 1 ,,~= ° :
N
\ ,
~ E
19:59 --21:00
UP
Z j
N
\
/ / /
/ /
Fig. 25. Elevation view (left) and plan view (right) maps of microseismic activity during the third and the fourth one-hour recording intervals of SUE (Dec. 9, 1981).
It is interesting to consider whether stress relieving of the aseismic zone due to extensive cooling has increased the stresses in the surrounding region. Such stresses could be released by a pressure wave moving outwards from the in- jection point, through the aseismic zone and then into the stressed region.
If this interpretation of the seismic history of SUE is indeed correct, it holds great promise as a means of following both the extent and location of the
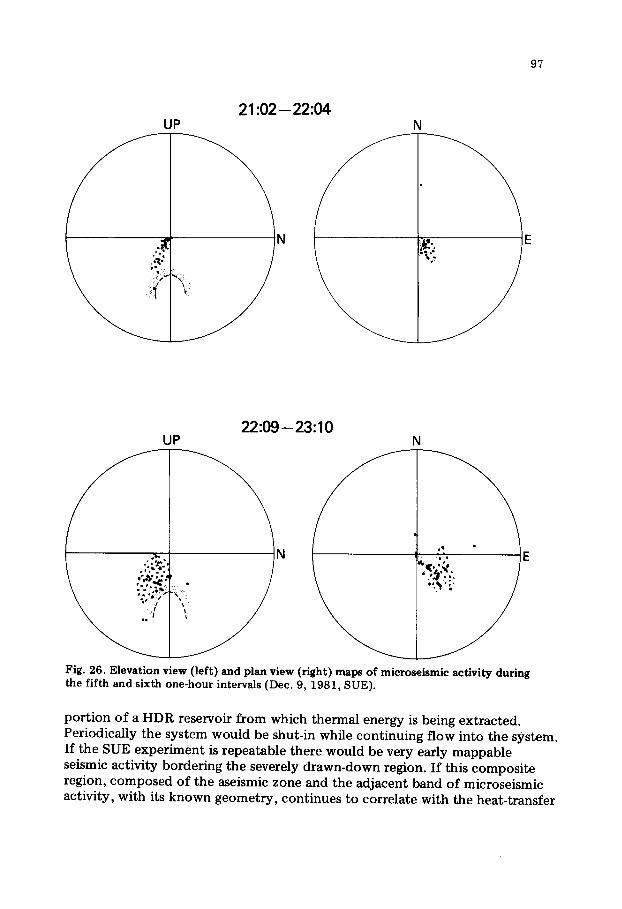
97
21:02-- 22:04 UP
N
;i=!i ~ !~'~ ! \ :,," ",;. /
N
, E
22:09--23:10 UP
~ N
N
Fig. 26. Elevation view (left) and plan view (right) maps of microseismic activity during the fifth and sixth one-hour intervals (Dec. 9, 1981, SUE).
port ion of a HDR reservoir from which thermal energy is being extracted. Periodically the system would be shut-in while continuing flow into the system. If the SUE experiment is repeatable there would be very early mappable seismic activity bordering the severely drawn-down region. If this composite region, composed of the aseismic zone and the adjacent band of microseismic activity, with its known geometry, continues to correlate with the heat-transfer
98
area derived from temperature recovery surveys in EE-1, then its identification by microseismic mapping techniques may provide the long sought predictive tool needed in HDR reservoir engineering.
CONCLUSIONS
The reservoirs of the Phase I HDR geothermal energy system have exhibited growth through all segments of operation. This growth resulted from pressuriza- tion, cooling (thermal contraction), and fracture-face displacement or move- ment. During the early time experiments (Run Segments 2 and 3) thermal draw- down was significant due to the small size of the reservoir involved (90°C for Segment 2 and 37°C for Segment 3). In the later experiments drawdown was much less significant due to the larger reservoir. No drawdown was observed during Segment 4, and during Segment 5 operations the reservoir sustained only an 8°C thermal drawdown after 286 days. Modeling of the Phase I reservoirs led to an estimated heat-transfer area of 8000 m 2 for Run Segment 2, while by the end of Run Segment 5 the heat-transfer area was estimated to be 45,000 to 50,000 m 2, about six times larger. Measured tracer volumes suggested a fracture area of 80,000 m 2 by the end of Segment 5. Modal volume of the reservoir has grown from 11 to 266 m 3 through the course of Phase I experiments.
Water losses were very encouraging because, for comparable operating pres- sure conditions, only a 30% increase of water loss was observed for a six-fold increase in heat-transfer area. The impedance remained constant throughout Run Segment 5 at about 1.6 GPa s/m 3. This is in contrast with the Run Seg- ment 2 reservoir that exhibited a sharp decline in the impedance, presumably due to the large thermal drawdown that the system experienced. If an im- pedance similar to that experienced during Run Segment 5 occurs in the Phase II reservoir under development, the system could essentially be self-pumping.
Seismic activity in the Phase I reservoirs has been insignificant. Events associated with heat extraction have measured less than minus one on the extrapolated Richter scale. Seismic mapping during pressurization and hydraulic fracturing gives areas several times greater than those calculated by modeling of heat exchange, indicating that fluid has access to only a small portion of the potentially available reservoir. During the stress unlocking experiment, however, the locked-in thermal stresses induced in the heat exchange area were released by rapid pressurization and the seismic events so triggered resulted in a reservoir area much closer to the heat exchange area.
REFERENCES
Aamodt, L. and Zyvoloski, G., 1980. Report on phase 1, segment 5, stage 1 (start up of experiment 217). Los Alamos Natl. Lab., G-5 Intern. Rep., Tech. Memo #5, 31 pp.
Brown, D.W. (Editor), 1983. Results of expt. 186, the high back-pressure flow experiment. Los Alamos Natl. Lab. Rep. LA-8941-HDR (to be published).

99
Fisher, H.N. and Tester, J.W., 1980. The pressure transient testing of a man-made fractured geothermal reservoir: An examination of fracture versus matrix dominated flow effect. Los Alamos Natl. Lab. Rep., LA-8535-MS, 33 pp.
Harlow, F.H. and Pracht, W.E., 1972. A theoretical study of geothermal enerKv extraction. J. Geophys. Res., 77: 7038--7048.
Laney, R., Laughlin, A.W. and Aldrich, M.J., Jr., 1981. Geology and geochemistry of sam- ples from Los Alamos National Laboratory HDR Well EE-2, Fenton Hill, New Mexico. Los Alamos Natl. Lab. Rep., LA-8923-MS, 32 pp.
Laughlin, A.W., 1981. The geothermal system of the Jemez Mountains, New Mexico and its exploration. In: L. Rybach and L.J.P. Muffler (Editors), Geothermal Systems: Principals and Case Histories. Wiley, New York, N.Y., pp. 295--320.
Laughlin, A.W. and Eddy, A.C., 1977. Petrography and geochemistry of Precambrian rocks from GT-2 and EE-1. Los Alamos Natl. Lab. Rep., LA-6930-MS, 50 pp.
Laughlin, A.W., Eddy, A.C., Laney, R. and Aldrich, M.J., Jr., 1983. Geology of the Fenton Hill, New Mexico Hot Dry Rock Site. In: G. Heiken and F. Goff (Editors), Geothermal Energy from Hot Dry Rock. J. Volcanol. Geotherm. Res., 15: 21--41.
McFarland, R.D. and Murphy, H.D., 1976. Extracting energy from hydraulically fractured geothermal reservoir. In: Proc. 11th Intersociety Energy Conversion Engineering Confer- ence, State Line, Nevada, September 12-17, 1976.
Murphy, H.D., 1979. Thermal stress cracking and the enhancement of heat extraction from fractured geothermal reservoirs. Geotherm. Energy, 7: 22--29.
Murphy, H.D. (Editor), 1980. Preliminary evaluation of the second hot dry rock geothermal energy reservoir: Results of phase I, run segment 4. Los Alamos Natl. Lab. Rep., LA- 8354-MS, 88 pp.
Murphy, H.D. (Editor), 1981. Relaxation of geothermal stresses induced by heat production. Los Alamos Natl. Lab. Rep., LA-8954-MS, 33 pp.
Murphy, H.D. and Tester, J.W., 1979. Heat production from a geothermal reservoir formed by hydraulic fracturing -- comparison of field and theoretical results. Paper SPE 8265 presented at 54th Annual Mtg. of Soc. Pet. Eng. of AIME, Las Vegas, Nevada, September 23--26, 1979.
Murphy, H.D., Lawton, R.G., Tester, J.W., Potter, R.M., Brown, D.W. and Aamodt, R.L., 1977. Preliminary assessment of a geothermal energy reservoir formed by hydraulic fracturing. Soc. Pet. Eng. J., 17: 317--326.
Murphy, H.D., Tester, J.W., Grigsby, C.O. and Potter, R.M., 1981. Energy extraction from fractured geothermal reservoirs in low permeability crystalline rock. J. Geophys. Res., 86: 7145--7158.
Tester, J.W. and Albright, J.N. (Editors), 1979. Hot dry rock energy extraction field test: 75 days of operation of a prototype reservoir at Fenton Hill. Los Alamos Natl. Lab. Rep., LA-7771-MS, 104 pp.
Tester, J.W., Potter, R.M. and Bivins, R.L., 1979. Interwell tracer analysis of a hydraulically fractured granitic geothermal reservoir. Paper SPE 8270 presented at 54th Annual Mtg. of Soc. Pet. Eng. of AIME, Las Vegas, NV, September 23--26, 1979, 12 pp.
Zyvoloski, G., 1980. Bottom-hole temperatures and pressures for experiment 217. Los Alamos Natl. Lab. G-5 Intern. Rep., Tech. Memo #11, 2 pp.
Zyvoloski, G. (Editor), 1981. Evaluation of the second hot dry rock geothermal energy reservoir: Result of phase I, run segment 5. Los Alamos Natl. Lab. Rep., LA-9840-HDR, 94 pp.