geothermal field and reservoir monitoring - home - springer · g geothermal field and reservoir...
TRANSCRIPT

G
Geothermal Field and ReservoirMonitoring
Trevor M. HuntGNS Science, Wairakei Geothermal ResearchCentre, Taupo, New Zealand
Article Outline
GlossaryDefinition of the Subject and Its ImportanceIntroductionPurposes and Principles of MonitoringDown-Hole MonitoringSurface MonitoringFuture DirectionsBibliography
Glossary
Anchorgrouting
Concrete pumped into the rocksaround the upper part of the wellto anchor the well and well cellarto the near-surface rockformations.
Aquiclude A geological formation(or formations) which will nottransmit water; a barrier tovertical movement of geothermalfluid.
Aquifer
A geological formation(or formations) which containswater or geothermal fluid and willallow fluid movement.
Baseline Data set acquired beforeexploitation begins, againstwhich any future measurementsare compared.
Benchmark Permanent survey mark, oftenconsisting of a stainless steel pinset in a concrete block or in theconcrete base of a pipelinesupport.
Bleed Awell that is throttled back to aminimum flow is said to be “onbleed.” It is often risky tocompletely shut down ageothermal production wellbecause it may be difficult torestart. Bleeding also keeps thewellbore heated which minimizescorrosion.
Deep liquidlevel
Boundary between the two-phaseand deep liquid zones.
Deep liquidzone
Region of single phase liquidconditions below a two-phase(liquid and vapor) zone.
Developer Company or organization whichlocates or uses geothermal energyfor domestic or industrialpurposes.
Dryout The process whereby liquidsaturation in the pores decreases
# Springer Science+Business Media LLC 2017R.A. Meyers (ed.), Encyclopedia of Sustainability Science and Technology,DOI 10.1007/978-1-4939-2493-6_298-3

and the vapor saturationincreases, as a result of a decreasein pressure.
Epicenter The point on the Earth’s surfacedirectly above the hypocenter orfocus of an earthquake.
Geothermalsystem
A body of hot water and rockwithin the Earth.
Go-devil A tool for determining wellboreclearances or for scraping outobstructions from a well orpipeline.
Groundwater Water, generally cold and ofmeteoric origin, which resides innear-surface aquifers and is oftenused for domestic and industrialpurposes.
High-temperaturesystem
A geothermal system, or partthereof, containing fluid having atemperature greater than 150 �C;c.f. low-temperature system inwhich the temperature is less than150 �C. Note, however, that thistemperature value is arbitrary andthat different authorities adoptdifferent values or divide therange into low, intermediate, andhigh temperature.
Hypocenter The focus or focal point of anearthquake (x, y, z) c.f. epicenter(x, y).
Injection(syn.reinjection)
The process of returningwastewater from a geothermalpower station or industrialprocess back into the ground.This generally occurs around theedges of the field and may not beinto the production aquifer fromwhich fluid is drawn off to thepower station.
Injectionaquifer
The formation into whichinjected fluid is put. Generallythis has high porosity andpermeability.
Liquid-dominatedsystem
A geothermal system, or partthereof, in which the pressure ishydrostatically controlled;
c.f. steam (vapor)-dominatedsystem, where the pressure issteam-static.
Make-upwell
Well drilled to replace productionlost from an existing productionwell, due to decreases in fluidtemperature or pressure.
Perchedaquifer
An aquifer of limited lateralextent which is separated from anunderlying body of groundwaterby unsaturated rock.
Permeability A measure of the capacity of ageological rock formation totransmit a fluid.
Productionzone
That region (depth) of thegeothermal reservoir from whichmost of the production of fluidoccurs.
Reservoir The region of a geothermalsystem from which geothermalfluid is withdrawn or is capable ofbeing withdrawn.
Residual(liquid)saturation
The amount of liquid that remainsin the pores (as % of porevolume) which decreases inpressure will not vaporize. Theliquid saturation level belowwhich vaporization of liquid willnot occur.
Steam zone A region of the reservoir in whichsteam (vapor) is the pressure-controlling phase.
Trigger point A measured value at which it isconsidered action needs to betaken to prevent or avoid somedetrimental occurrencehappening, or exceeding somepredetermined limit.
Two (2)-phase zone
A region where the liquid andvapor (steam) phases of watercoexist in pores or fractures.
Vadose zone The region of unsaturated rockand soil between the groundsurface and the shallowgroundwater level.
Wastewater
2 Geothermal Field and Reservoir Monitoring

Geothermal water from whichenergy has been extracted and isno longer required. This may beseparated water or steam whichhas passed through turbines or abinary plant and been condensed.
Definition of the Subject and ItsImportance
Geothermal systems are dynamic entities in whichthe liquid and vapor phases of water are the mainmobile constituents. In their natural state these aregenerally in a quasi steady-state condition, whenconsidered over a long period of time(>1000 years). However, when fluid is withdrawnfor the purpose of extracting energy then changesmay occur within the system. These changes canresult in a variety of environmental effects someof which are undesirable and so to manage theextraction of energy in a sustainable and environ-mentally responsible way it is necessary to mon-itor the changes. By monitoring the changes withtime it is possible to understand and model theeffects these changes may have on the environ-ment and take steps to minimize any undesirableeffects in a timely manner. Changes may also haveengineering implications for a geothermal devel-opment, especially for a power station. One exam-ple is a decrease in the pressure of steam suppliedto the station that may necessitate replacement ofthe original turbines by those designed to operateat lower pressures. At the start of production atWairakei (New Zealand) in 1958, the high-pressure (HP) turbine inlet pressure was1.25 MPa, but by the late 1970s the pressure hadfallen to about 0.7 MPa, and the HP turbines weretaken offline and the wells derated to intermediatepressure [1]. Another example is a change inenthalpy due to a change in the steam-water ratiothat may affect the efficiency of a modular binaryplant designed for a specific steam-water mixture.
Introduction
In a typical high-temperature geothermal systemused for electrical power generation, a large massof hot water is withdrawn from an area and thecooler, waste water is injected in a different loca-tion, and this can give rise to significant changeswithin the system and at the surface. However, inlow-temperature systems or where only heat(no mass) is extracted, the changes may be smalland negligible.
Purposes and Principles of Monitoring
Purposes of MonitoringWhere significant changes occur, or it is antici-pated they might occur, a developed geothermalsystem will be monitored to:
1. Obtain data on which rational and informedresource management decisions can be madeby developers and regulatory authorities.
2. Verify that management decisions are havingthe desired outcomes.
3. Enable the public to have confidence in theenvironmental management process.
4. Assist in building up knowledge of geothermalsystems and how to develop them in a sustain-able and environmentally responsible way.
Basic PrinciplesIdeally, monitoring begins before developmentstarts so that a good baseline is obtained. It is notpossible to go back in time, so many differenteventualities need to be considered and a fullyintegrated monitoring program needs to be devel-oped and begun before large-scale productionsstarts.
Monitoring should be conducted at a frequencysufficient to enable natural variations to be distin-guished from exploitation-induced changes.
The data collected needs to be interpreted andregularly compared with predetermined “triggerpoints.” No change may be as important as somechange, and is not a valid reason for stoppingmonitoring, although the frequency of
Geothermal Field and Reservoir Monitoring 3
measurement may be reduced after a long periodof no change.
Data need to be reliable. Equipment should becalibrated regularly and operated by a competentperson. Since monitoring may continue over along period of time, it is important that the sametechniques are used such that a valid comparisoncan be made between early and recent data.
Monitoring Program PlanningA geothermal monitoring program is likely toextend for several decades, therefore all observa-tions and measurements need to be carefullydocumented in a suitable archive. During thistime there will probably be staff changes andtherefore there needs to be a written set of instruc-tions about how and when measurements will bemade, so that measurements at different times arecompatible with each other. Monitoring sites needto be clearly marked and monitoring facilities(e.g., groundwater monitor wells) need to bemaintained. Experience has shown that large-scale geothermal developments often start as asmall development and increase in size incremen-tally. Furthermore, as production wells declinenew wells are drilled to maintain steam quantitiesdeliverable to the power station. These engineer-ing activities may result in monitoring sites beingaltered or destroyed, so it is important that thebaseline data set has sufficient redundancy toallow for such loss without seriously compromis-ing its integrity.
Interpretation of Monitoring DataGenerally the process of collecting monitoringdata is relatively easy, however, correct interpre-tation of the results may be difficult. Often the firstproblem in interpretation is separating natural var-iations from those induced by utilization of thefield. Further complexities may be introduced byother human activities, for example, pumping ofwater supply wells for irrigation or drinking waterfor animals, and diversion or damming of riversmay cause groundwater level changes. The effectsof some anthropogenic changes may be difficult tomeasure or even estimate. Another significantproblem is that what is measured inside a drillholemay not represent what is occurring in the rock
outside the drillhole, because as fluid passes fromthe rock into the hole it may change in character.
Down-Hole Monitoring
A variety of down-hole monitoring techniqueshave been developed, many originating from theoil industry, to determine reservoir changes. Ide-ally, down-hole monitoring is undertaken in non-producing wells, or production wells that are shutdown or on “bleed.” However, making the mea-surements is the simplest part of the processbecause often the casing configuration of thewell can strongly influence the data obtained andneeds to be taken into account. Furthermore, thereis a problem in that conditions within a wellboremay be different from those in the rock outside thewellbore.
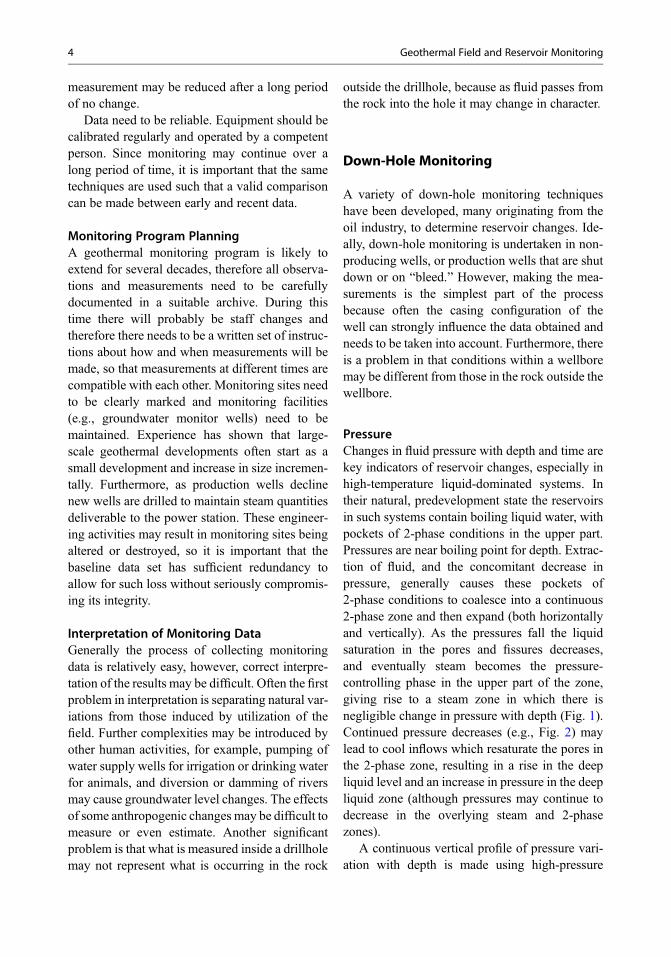
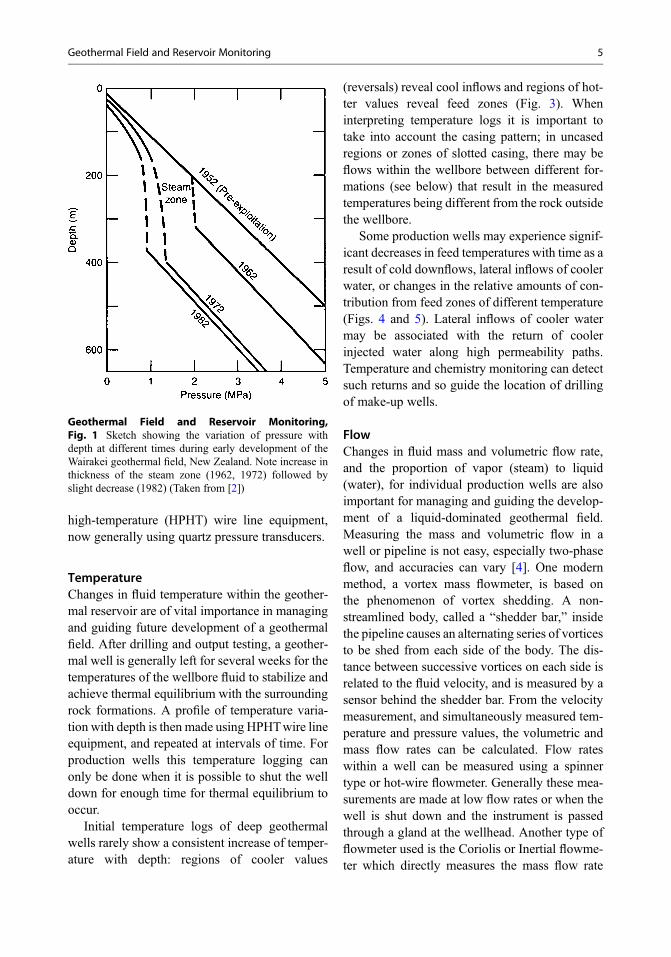
PressureChanges in fluid pressure with depth and time arekey indicators of reservoir changes, especially inhigh-temperature liquid-dominated systems. Intheir natural, predevelopment state the reservoirsin such systems contain boiling liquid water, withpockets of 2-phase conditions in the upper part.Pressures are near boiling point for depth. Extrac-tion of fluid, and the concomitant decrease inpressure, generally causes these pockets of2-phase conditions to coalesce into a continuous2-phase zone and then expand (both horizontallyand vertically). As the pressures fall the liquidsaturation in the pores and fissures decreases,and eventually steam becomes the pressure-controlling phase in the upper part of the zone,giving rise to a steam zone in which there isnegligible change in pressure with depth (Fig. 1).Continued pressure decreases (e.g., Fig. 2) maylead to cool inflows which resaturate the pores inthe 2-phase zone, resulting in a rise in the deepliquid level and an increase in pressure in the deepliquid zone (although pressures may continue todecrease in the overlying steam and 2-phasezones).
A continuous vertical profile of pressure vari-ation with depth is made using high-pressure
4 Geothermal Field and Reservoir Monitoring
high-temperature (HPHT) wire line equipment,now generally using quartz pressure transducers.
TemperatureChanges in fluid temperature within the geother-mal reservoir are of vital importance in managingand guiding future development of a geothermalfield. After drilling and output testing, a geother-mal well is generally left for several weeks for thetemperatures of the wellbore fluid to stabilize andachieve thermal equilibrium with the surroundingrock formations. A profile of temperature varia-tion with depth is then made using HPHTwire lineequipment, and repeated at intervals of time. Forproduction wells this temperature logging canonly be done when it is possible to shut the welldown for enough time for thermal equilibrium tooccur.
Initial temperature logs of deep geothermalwells rarely show a consistent increase of temper-ature with depth: regions of cooler values
(reversals) reveal cool inflows and regions of hot-ter values reveal feed zones (Fig. 3). Wheninterpreting temperature logs it is important totake into account the casing pattern; in uncasedregions or zones of slotted casing, there may beflows within the wellbore between different for-mations (see below) that result in the measuredtemperatures being different from the rock outsidethe wellbore.
Some production wells may experience signif-icant decreases in feed temperatures with time as aresult of cold downflows, lateral inflows of coolerwater, or changes in the relative amounts of con-tribution from feed zones of different temperature(Figs. 4 and 5). Lateral inflows of cooler watermay be associated with the return of coolerinjected water along high permeability paths.Temperature and chemistry monitoring can detectsuch returns and so guide the location of drillingof make-up wells.
FlowChanges in fluid mass and volumetric flow rate,and the proportion of vapor (steam) to liquid(water), for individual production wells are alsoimportant for managing and guiding the develop-ment of a liquid-dominated geothermal field.Measuring the mass and volumetric flow in awell or pipeline is not easy, especially two-phaseflow, and accuracies can vary [4]. One modernmethod, a vortex mass flowmeter, is based onthe phenomenon of vortex shedding. A non-streamlined body, called a “shedder bar,” insidethe pipeline causes an alternating series of vorticesto be shed from each side of the body. The dis-tance between successive vortices on each side isrelated to the fluid velocity, and is measured by asensor behind the shedder bar. From the velocitymeasurement, and simultaneously measured tem-perature and pressure values, the volumetric andmass flow rates can be calculated. Flow rateswithin a well can be measured using a spinnertype or hot-wire flowmeter. Generally these mea-surements are made at low flow rates or when thewell is shut down and the instrument is passedthrough a gland at the wellhead. Another type offlowmeter used is the Coriolis or Inertial flowme-ter which directly measures the mass flow rate
Geothermal Field and Reservoir Monitoring,Fig. 1 Sketch showing the variation of pressure withdepth at different times during early development of theWairakei geothermal field, New Zealand. Note increase inthickness of the steam zone (1962, 1972) followed byslight decrease (1982) (Taken from [2])
Geothermal Field and Reservoir Monitoring 5
[5]. It has one or more bent, straight, or U-shapedvibrating tubes in the fluid stream, and as the fluidpasses through the tubes, they twist. The amountof tube twisting is directly proportional to massflow. This meter can also be used for heat mea-surement of low-pressure, superheated steam. Thechief advantage of a Coriolis flowmeter is in pro-viding highly accurate measurements of massflow rate without flow conditioning or accessorydevices such as pressure or temperaturemeasurement.
Fluid flow within a wellbore may be complex.In a flowing production well there may be severalfeed zones at different depths, each contributing tothe total flow measured at the wellhead. In a non-flowing geothermal well, the high aspect ratio ofthe cased part of the wellbore precludes thermallygenerated fluid movement. However, in an open(uncased) or slotted region of the well there maybe fluid movement between formations havingdifferent temperatures and physical properties;fluid may exit from one aquifer, travel up ordown the wellbore, and enter another (thief
zone). Repeated wire line flowmeter measure-ments may be made to detect changes in flowfrom the different feed zones over time, or beforeand after maintenance on a well, and for findingholes in casing that have developed due tocorrosion.
Fluid flow within the rock matrix can be mea-sured using chemical tracers introduced into awell and their arrival time and concentration mea-sured in other wells (see below).
Generally, for a high-temperature geothermalfield the mass flow rates will decline, and (forliquid-dominated wells) the enthalpy will increaseover time, unless injection returns cause anincrease in mass flow and decline in enthalpy.
Casing IntegrityOver a period of time, steel well casing and pip-ing, and concrete anchor grouting can becomedamaged as a result of corrosion (stress orfatigue), scaling, or ground deformation. Corro-sion may occur on the inner surface of the casingas a result of acidic fluids flowing up from deep
Geothermal Field and Reservoir Monitoring,Fig. 2 Changes in deep liquid pressure with time inWairakei geothermal field. Pressure: 1 bar = 0.1 MPa.
Testing of exploration wells began in the early 1950s andproduction started in 1958. Well WK224 (top) lies outsidethe field (Taken from [3])
6 Geothermal Field and Reservoir Monitoring

feed zones, or it may occur on the outer surface ofthe casing and attack grouting as a result of acidicfluids being present in a formation through whichthe well passes [6, 7]. Corrosion is present in mostgeothermal wells, even low-temperature and low-enthalpy wells, but is generally more of a problemin deep, high-temperature, and high-enthalpywells tapping CO2-rich and acidic fluids. Mechan-ical deformation (breaks, buckling) may occur inwells subject to significant grounddeformation [8].
Casing damage is detected by running amechanical caliper tool with flexible fingers upand down the hole, or by running a “Go-devil”tool down the hole. Detailed determination of thedamage may then be investigated using a video
camera or a sonic borehole televiewer. Damage tonear-surface (<10m depth) casing can be repairedby excavating a pit around the well and replacingthe damaged casing. To repair deeper damage itmay be necessary to run new liner of smallerdiameter inside the damaged production casing,apply casing patches or install expandable casing.
Fluid ChemistryThe chemical composition of geothermal produc-tion fluids may change with time due to dilutionand cooling of the reservoir fluids, resultingmainly from the invasion of cool and less-mineralized waters (Fig. 6). Regular measurementof the chemistry of liquid and vapor samples offluids from selected wells provides information
0 50 100−2,000
−1,500
−1,000
−500
0
500
150
Temperature (∞C)
Ele
vati
on
(m
asl)
200 250 300
TH1 TH5 TH8
TH13
TH15
TH16
TH14
TH6
TH7
TH2
TH2 1999
Geothermal Field andReservoir Monitoring,Fig. 3 Variation oftemperature with depth inexploration drillholes inTauhara geothermal field,New Zealand. Note thedifferences between wellsand that in some wells(especially TH2, between�100 and �200 m) thereare temperature reversalsdue to cool inflows
Geothermal Field and Reservoir Monitoring 7

about changes in the reservoir. The data are alsoused to examine the need for and effectiveness ofchemical dosing to prevent corrosion, and to
monitor mineral deposition in the wells andpipework. However, interpretation of chemicalchanges is not necessarily straightforwardbecause the chemistry of production fluids mayvary between wells, and as the relative amounts ofproduction from each well change with time (dueto supply requirements) so the total chemistrymay appear to change.
Samples of geothermal fluid may be takeneither from within the wellbore (i.e., down-hole)or at the surface. Down-hole samples are takenusing a special sampling device that captures thegeothermal fluid in its in situ, undisturbed state;i.e., before phase separation, irreversible thermalcycles, or chemical reactions have occurred [10,11]. Samples are usually taken at different depthsin a well to determine the changes that occur as thefluid ascends the well. At the surface, a smallsample of the two-phase geothermal fluid isdrawn off from the flowing well and passedthrough a small separator which separates theliquid (water) from the vapor (steam). The liquid(water) fraction is then cooled by passing itthrough a water-cooled coil and analyzed by stan-
dard techniques. The vapor (steam) fraction ispassed into an evacuated glass flask containing acaustic solution to absorb acidic gases (carbon
Geothermal Field and Reservoir Monitoring,Fig. 4 Sketch showing variation of temperature withdepth in some wells (Eastern borefield), at different timesduring early development of theWairakei geothermal field,New Zealand (Taken from [2])
1955120
140
160
180
200
220
240
1965 1975
Te Mihi production wells
WB production wells
WB wellswith cooldownflow
Year
Tem
per
atu
re (
∞C)
1985 1995 2005
Geothermal Field andReservoir Monitoring,Fig. 5 Changes inproduction temperatureswith time in Wairakeigeothermal field. WBWestern borefield. Note thelarge decrease intemperature of fluid fromwells having cooldownflows, whereas otherproduction wells haveexperienced only a smalltemperature decline andtemperatures have remainednear constant since about1975 (Taken from [3])
8 Geothermal Field and Reservoir Monitoring

dioxide, hydrogen sulfide); the solution is thenanalyzed by titration. Trace gases (Ar, He, N)remain in the top of the flask and are removedand analyzed using a gas chromatograph [12].
In high-temperature liquid-dominated geother-mal systems, chloride is a major chemical speciesand an important indicator of changes in the res-ervoir fluid. A decrease in the chloride content
may indicate dilution due to an influx of coldgroundwater (Fig. 7), and an increase may indi-cate injection returns.
In fields where the geothermal fluid resides orpasses through limestone, the fluid may becomesaturated in calcium carbonate (CaCO3), whichprecipitates as calcite in the wellbores and pipe-lines as temperatures and pressures decline. This
19601,000
1,200
1,400
1,600
Other
West
East
Total
1970 1980 1990 2000
Year
Cl’
(g/t)
Geothermal Field andReservoir Monitoring,Fig. 6 Changes with timein average chloride content(corrected for aquifer steamloss) of production fluidfrom different parts ofWairakei geothermal field.“West” and “East” refer toWestern and Easternborefields, respectively;“other” refers to the Te Mihiborefield, from whereproduction began in theearly 1980s (Taken from[9])
Geothermal Field andReservoir Monitoring,Fig. 7 Changes with timeof the average chloridecontent of production wellfluid (ClP) at Wairakei(upper) and in the amountof cold inflow (%) into theproduction zone computedfrom the chloride changes(lower). The increase in thechloride value after 2000 isattributed to a largerproportion of deep watercoming from a newproduction area (Te Mihi)and to more injected water(beginning 1995) reachingthe production wells (Takenfrom [9])
Geothermal Field and Reservoir Monitoring 9

precipitate, known as scaling, is a serious problembecause it reduces the fluid flow and particles ofprecipitate may flake off and enter the turbinescausing damage. Monitoring of the carbonatehelps identify problem wells and enable scalingrates to be determined.
Tracer TestsAlthough primarily used for reservoir characteri-zation purposes, tracer tests [13–15] may be usedfor reservoir management, particularly if majorchanges are made in the development of a field.A tracer test involves inserting a finite slug of achemical or radioactive material (“tracer”) into aninjection well and measuring the time for it toappear, and its concentration, in production andmonitoring wells. Tracer tests to evaluate the flowpatterns between injection and producing wellsare common practice in oil and gas field opera-tions. A wide variety of chemical tracers havebeen used including: hydrofluorocarbons(tetrafluoroethane, trifluoromethane), naphthalenedisulfonate, noble gases (neon, xenon), potassiumhalides (KBr, KI), rhodamine WT, and fluores-cein. Fluorescein is the most commonly usedtracer in liquid-dominated geothermal reservoirsbecause it is sufficiently stable to be used in res-ervoirs as hot as 250 �C; it has a detection limit ofapproximately ten parts per trillion using conven-tional spectrofluorimetry; and can be detectedusing a simple, inexpensive, and easily operatedfilter fluorometer. Iodine 131 has been used as aradioactive tracer [16]. Some tracers travel pref-erentially in the vapor (steam) phase, others in theliquid (water) phase. By repeating tracer tests itmay be possible to determine changes in fluidflow paths, particularly “short circuiting” ofinjected fluids from new injection wells directlyto production wells.
Surface Monitoring
Flow RateMonitoring fluid flow rates at the wellhead ofproduction and injection wells is a basic monitor-ing tool which can indicate changes in the perfor-mance of individual wells and of total field
performance. Sudden unexpected changes inflow rate from an individual well may indicatedamage to the well casing. Gradual decreases inflow rate may indicate a fall in reservoir pressurein the vicinity of the well feed zone(s), or a changein the relative contributions of supply from differ-ent feed zones.
Ground Surface MovementsIn a few geothermal fields, notably some of thosein New Zealand, there have been significantground subsidence (up to 15 m) and horizontaldeformation (up to 2 m) associated withproduction.
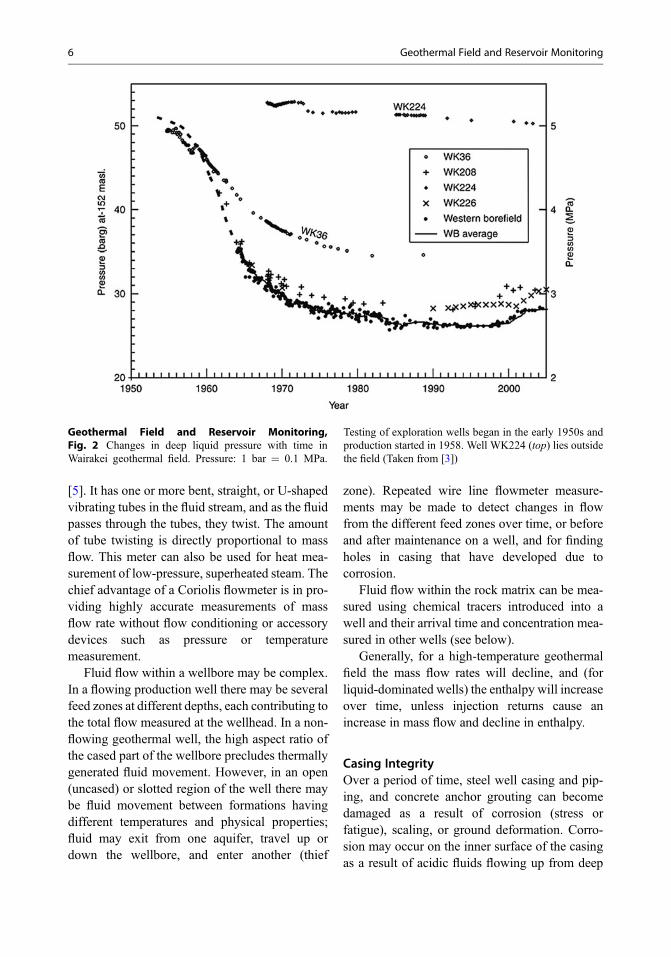
At Wairakei field (New Zealand), deformationwas originally noticed when concrete drainsbecame broken, and subsequently pipework hasbeen mounted on roller supports to accommodatemovement, although from time to time it has beennecessary to remove and insert sections of pipe.Vertical deformation is measured by repeat sur-veys using an optical level to measure changes inelevation between permanent reference pointssuch as benchmarks, referenced to a stable pointoutside the field. The frequency of surveysdepends on the rate of subsidence and the locationof the subsidence area. At Wairakei, the mainsteam lines are leveled every 2 years, and thewhole field about every 4 years. In some fields,where there are not extensive amounts of surfacevegetation, it has been possible to determine sub-sidence using interferometric synthetic apertureradar (InSAR) [17–20]. At Wairakei-Tauharafield (New Zealand) there have been small areasof intense subsidence within the field since mea-surements began shortly after production startedin 1958 [21]. In this field the subsidence hasoccurred mainly in about four localized “subsi-dence bowls,” but over the remainder of the fieldthe subsidence has been less than 1 m (Fig. 8). Atthe center of the main subsidence bowl the rate ofsubsidence increased to a maximum of over450 mm/year in the late 1970s but has sincedecreased to about 50 mm/year (Fig. 8). The loca-tion of the bowls and their centers does not corre-spond to areas of maximum production; the centerof the main subsidence bowl lies about 500 mfrom the original area of production. The cause
10 Geothermal Field and Reservoir Monitoring
of the subsidence at Wairakei-Tauhara and Ohaakiis associated with draining, and consequent com-paction, of rocks of locally high compressibilitywithin formations above the reservoir, due to adecrease in pressure within the steam zone in theupper part of the reservoir. Casing deformationindicates these rocks lie at about 100–300 mdepth. However, the reason for the localized dis-tribution of high compressibility in these rocksremains a puzzle; other parts of the same forma-tions do not have high compressibility. At Mokaifield (New Zealand), there has been subsidence ofup to 0.20 m around the injection wells, associatedwith cooling and thermal contraction of rocks inthe injection aquifer.
Horizontal deformation is measured using the-odolites or Geodimeters to measure changes inangles or distances between permanent referencepoints, or using global positioning system (GPS)techniques. Generally the reference points arepermanent markers specifically installed for thepurpose. At Ohaaki field (New Zealand), these
consist of a concrete post made from a drainagepipe (approximately 600 mm diameter), mountedvertically, set in a concrete pad, and filled withconcrete. A threaded pipe is set in the upper sur-face of the post to allow a theodolite, Geodimeter,or a target to be mounted on the post. At Wairakei-Tauhara field (New Zealand), the largest horizon-tal movement rates have been 25–30 mm/year andhave occurred at the edges of the main subsidencebowl where the lateral changes in subsidence (tilt)have been the greatest [21]. The horizontal move-ment vectors generally point toward the center ofthe subsidence bowls (Fig. 9). The overall patternof horizontal movement has not changed greatlywith time, but the rates of movement havedeclined as the subsidence rates have decreased.
GroundwaterNear the ground surface above most geothermalreservoirs there is generally a complex sequenceof groundwater aquifers containing cold or warmwaters (and in places hot water and steam) which
Geothermal Field and Reservoir Monitoring,Fig. 8 Ground subsidence (left; m) and subsidence rates(right; mm/year for 2001–2005) at Wairakei-Tauhara geo-thermal field, New Zealand. Dots indicate survey points.
Note that the intense subsidence is confined to severalisolated subsidence bowls: Main; SS Spa Sights, RRRakanui Road (Taken from [21])
Geothermal Field and Reservoir Monitoring 11

are often a source of potable water or used forindustrial and domestic purposes (heating,
cleaning). The aquifers are usually separatedfrom each other by aquicludes.
Geothermal Field andReservoir Monitoring,Fig. 9 Horizontaldeformation vectors(arrows) at subsidencebowls in the Wairakei-Tauhara geothermal field.Solid contours indicate ratesof ground subsidence(mm/year) determined atbenchmarks (open circles).Note the vectors point to thecenter of the subsidencebowl, and have greatestamplitude on the flanks ofthe bowl (Taken from [21])
12 Geothermal Field and Reservoir Monitoring

These shallow aquifers can be affected by pro-duction from the deeper geothermal reservoir andhence many regulatory authorities require waterlevels, water chemistry, and temperatures in theaquifers to be monitored periodically. Monitoringis usually done using shallow wells drilled specif-ically for the purpose. These holes are generallyabout 3–5 cm diameter and are generally drilledvertically using a small truck-mounted auger. Theholes usually have solid casing in the VadoseZone and slotted or screened casing from thewater table to the bottom. Where several ground-water aquifers are present several monitor holesare drilled and care is taken in each to adopt acasing pattern that monitors a specific aquifer andensures that the well does not result in interactionbetween separate aquifers, i.e., draining of anupper into a lower aquifer. In places where theground temperature is less than about 50�C, plas-tic (PVC or ABS) casing is used, but for groundtemperatures greater than this value steel casing isused. The open area of the screened casing shouldapproximate the natural porosity of the rock for-mation, and the slots should widen inward tominimize plugging of the slots by fine formationmaterial. Over a long period of time, fine silt anddebris migrate through the screened casing andare deposited at the bottom of the hole; so the holeis generally drilled 5–10 m deeper than the naturalwater table.
Water levels are measured using a simple elec-tric circuit device lowered down the well; this ispowered by a small battery and contact with thewater closes the circuit. Alternatively, a waterlevel recorder can be installed which is comprisedof a pressure transducer coupled to a data logger.Measurements are generally made at set timesduring the year to determine and correct for sea-sonal variations.
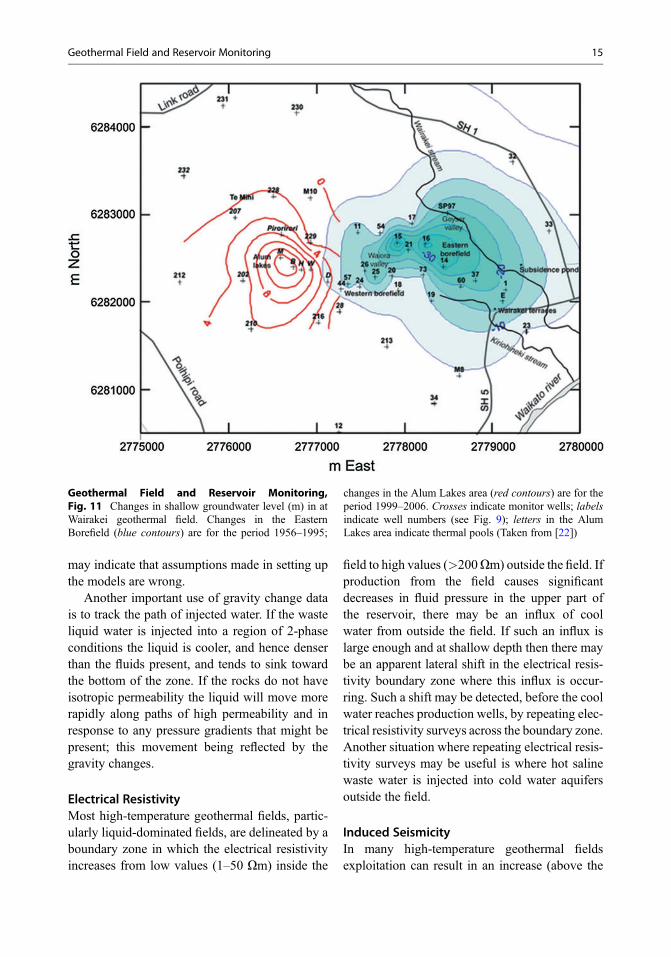
Changes in groundwater level (piezometricsurface) can occur as a result of pressure declinesin the deep geothermal reservoir. At Wairakei(New Zealand), decreases in groundwater levelof up to 30 m have been recorded in the EasternBorefield, an area where thermal features were fedby conduits from the deep reservoir [22] (Fig. 10).As pressures in the upper part of the reservoirdecreased, the flow of geothermal fluid up
conduits to the surface declined and eventuallyceased. This allowed shallow groundwater todrain down the conduits, resulting in local regionsof depression of the groundwater surface(Fig. 11). In some cases, where the near-surfacegeology is complex, these changes can be local-ized, especially where perched groundwater aqui-fers are present [23].
The temperature of groundwater is measured inshallowmonitor holes using a digital thermometerand probe. Sometimes the temperature is mea-sured not only at the water surface but also deeperin the monitor hole, to enable a temperature profilein the water to be obtained.
Samples for chemical analysis are obtainedfrom groundwater monitor holes after waterlevel and temperature measurements have beenmade. However, care must be taken not to samplestagnant water in these holes; only after 5–10wellbore volumes of water have been removedand naturally replaced should a sample be col-lected. Removal of stagnant water and collectionof the samples is generally done using a smallportable electric pump. Parameters that are usu-ally measured are: pH, chloride, lithium, sodium,potassium, magnesium, sulfate (SO4), total silica(SiO2), total bicarbonate (HCO3), and fluoride. Inaddition, measurements of stable isotopes d18O,d2H, and tritium are sometimes made.
MicrogravityExploitation of high-temperature geothermalresources usually involves withdrawing fluidfrom one area (production area) and, after usingit to generate electricity or provide heat, injectingthe liquid back into the ground in another area(injection area). This generally results in changesin mass (and corresponding density changes) inthese areas, and hence small changes in the forceof gravity at the surface (Figs. 12 and 13). Theamount of gravity change in the production areawill be related mainly to the amount of recharge,and to changes in the proportions of liquid waterand steam in the production zone.
The changes in gravity are measured at perma-nent reference points such as survey benchmarksthroughout and beyond the field boundaries usinga portable gravity meter. Generally a relative type
Geothermal Field and Reservoir Monitoring 13

of gravity meter is used which measures differ-ences in gravity from a stable, reference pointoutside the geothermal field, although in someinstances absolute gravity meters have beenemployed. Measurement precision is generally5–10 mGal (5–10� 10�8 m/s2). A baseline surveyis made at 50–150 points prior to exploitation, andthe survey repeated at intervals of 2–5 years after-ward. Within each survey, corrections are madefor the gravitational effects of changes in theposition of the Moon and Sun (Earth tide) andfor tares (jumps in zero point of the meterresulting from knocks). In determining the gravitydifferences between surveys (gravity changes) thedata are corrected for the gravitational effects ofground elevation changes (subsidence), gravitychanges at the reference point, and changes ingroundwater level and temperature.
From the gravity changes it is possible to deter-mine a field-wide value for recharge by numericalintegration of the changes and application ofGauss’s theorem [25]. This method is completelyindependent of any assumptions about fluid den-sity, depth of production, permeability, or poros-ity; its accuracy is limited only by the precision of
the gravity measurements, and errors inherent inthe integration of the data. Gravity change mea-surements also may provide: field-wide and localvalues for recharge of fluid into a geothermalsystem; information about changes in saturationin different parts of the two-phase zone; a test ofcomplex, three-dimensional, numerical reservoirsimulation models for exploitation of a field [26,27]; information about the location and movementof injected fluid [28]; and estimates of reservoirparameters such as permeability (k), permeability-thickness (kh), and storativity (fch) [29].
Gravity change data can also be used to dis-criminate between two (or more) numerical reser-voir simulation models for exploitation of a field.Such models are important in guiding develop-ment of a field. The models for high-temperatureliquid-dominated fields predict the developmentand extension of 2-phase conditions and subse-quent changes in saturation (and hence densityand gravity changes) which involve assumptionsabout the geometry of the field, various reservoirproperties, and behavior of the field during exploi-tation. Discrepancies between the theoretical(model-derived) and measured gravity changes
Geothermal Field and Reservoir Monitoring, Fig. 10 Changes in shallow groundwater level with time in the EasternBorefield at Wairakei geothermal field (Taken from [22])
14 Geothermal Field and Reservoir Monitoring
may indicate that assumptions made in setting upthe models are wrong.
Another important use of gravity change datais to track the path of injected water. If the wasteliquid water is injected into a region of 2-phaseconditions the liquid is cooler, and hence denserthan the fluids present, and tends to sink towardthe bottom of the zone. If the rocks do not haveisotropic permeability the liquid will move morerapidly along paths of high permeability and inresponse to any pressure gradients that might bepresent; this movement being reflected by thegravity changes.
Electrical ResistivityMost high-temperature geothermal fields, partic-ularly liquid-dominated fields, are delineated by aboundary zone in which the electrical resistivityincreases from low values (1–50 Om) inside the
field to high values (>200Om) outside the field. Ifproduction from the field causes significantdecreases in fluid pressure in the upper part ofthe reservoir, there may be an influx of coolwater from outside the field. If such an influx islarge enough and at shallow depth then there maybe an apparent lateral shift in the electrical resis-tivity boundary zone where this influx is occur-ring. Such a shift may be detected, before the coolwater reaches production wells, by repeating elec-trical resistivity surveys across the boundary zone.Another situation where repeating electrical resis-tivity surveys may be useful is where hot salinewaste water is injected into cold water aquifersoutside the field.
Induced SeismicityIn many high-temperature geothermal fieldsexploitation can result in an increase (above the
Geothermal Field and Reservoir Monitoring,Fig. 11 Changes in shallow groundwater level (m) in atWairakei geothermal field. Changes in the EasternBorefield (blue contours) are for the period 1956–1995;
changes in the Alum Lakes area (red contours) are for theperiod 1999–2006. Crosses indicate monitor wells; labelsindicate well numbers (see Fig. 9); letters in the AlumLakes area indicate thermal pools (Taken from [22])
Geothermal Field and Reservoir Monitoring 15

normal background) in the number of small mag-nitude earthquakes (micro-earthquakes) withinthe field (Fig. 14) [30]. Induced seismicity occursin both liquid- and vapor-dominated high-temperature fields, and in enhanced geothermalsystems, but has rarely been observed in low-temperature fields. The increase is caused mainlyby injection because when injection starts or isincreased the number of local micro-earthquakesincreases, and when injection decreases or isstopped the number of small earthquakesdecreases [30, 31]. The main cause of the micro-earthquakes is high wellhead injection pressuresthat increase the pore pressure at depth, particu-larly in existing fractures, which allows move-ment to suddenly release stress and generate anearthquake. Thermal stress associated with theinjection of cool waste water into a hot fluidaquifer may also trigger earthquakes in the vicin-ity of the injection wells.
The micro-seismicity is generally monitoredby an array of seismometers (vertical- or three-
component) placed in shallow drillholes(to minimize the effects of anthropogenic“noise”). Usually the signals from each seismom-eter are telemetered in real time to a centralrecording apparatus – this ensures consistent rel-ative timing of the signals which is critical fordetermining the location (hypocenter and epicen-ter) of the earthquake. The hypocenter of eachseismic event is then computed from the relativetime differences of the arrival of the shock wave ateach seismometer, assuming a specific local seis-mic velocity model [32]. The seismic velocitymodel is calculated either by inverting the seismicdata collected over a period of time [33], or fromexplosions set off in drillholes. The magnitudes ofthe micro-earthquakes within the geothermal fieldare determined by comparison with the magni-tudes of large local events as determined bynational or regional seismic networks.
During a 4½ year period in which the mass ofwater injected at the Geysers field increased anddecreased (due to seasonal power loading), the
Geothermal Field and Reservoir Monitoring,Fig. 12 Changes in gravity (mgal) associated with pro-duction at Wairakei geothermal field, New Zealand.Benchmarks A97 and AA13 lie in the Eastern borefield
from which most production was obtained between 1958and the 1980s. Note the increase in gravity since the late1970s, associated with resaturation of the production aqui-fer (Taken from [24])
16 Geothermal Field and Reservoir Monitoring

number of events measured by a detailed seismicnetwork (Fig. 15) appeared to be related moreclosely to the injection rates rather than (steam)production rates [34].
Real-time monitoring of micro-seismicity canbe used to minimize the felt intensity of shakingby reducing or stopping injection if the number ofevents exceeds certain predetermined thresholds –this is known as “traffic light control” of injection[30, 35].
Thermal FeaturesMany geothermal fields, especially high-temperature liquid-dominated fields, aremanifested at the surface by natural thermal fea-tures such as geysers, hot pools, hot springs, mudpools, fumaroles, and areas of thermal ground.Changes in these features with time during pro-duction from the field can indicate changes in the
geothermal reservoir from which fluid is beingwithdrawn, although in some cases it may bedifficult to separate natural changes fromproduction-induced changes. A wide variety ofthermal features can be monitored, however, themost sensitive and easiest to monitor are geysers,hot pools, and hot springs.
GeysersGeysers occur in high-temperature geothermalfields. They are the most spectacular and themost valued of natural thermal features (for cul-tural and economic reasons) and are the mostsensitive to production-induced changes in a geo-thermal system. Geysers are generally monitoredby measuring changes in the eruption period (timebetween the start of successive eruptions), usuallyby a simple device that continuously measures thetemperature of water in a channel leading from thegeyser. Increases in the eruption period of geysersmay be indicative of pressure decreases in thereservoir: increases in the eruption period of twogeysers at Wairakei field were measured (Fig. 16)prior to their demise during the time of pre-production well testing (test dischargeperiod) [36].
It is difficult to measure the volume of eruptedwater because of flashing to steam during theeruption, and evaporation from or absorptioninto the rocks surrounding the vent after theerupted water has fallen to the ground. If thegeyser erupts frequently, it is feasible to measureeruption height by using a video camera; however,the volume and height of geyser eruptions oftenvary naturally due to wind gusts and to seasonalchanges in rainfall.
Springs and Hot PoolsHot springs and hot pools are also associatedmainly with high-temperature geothermal fieldsand have important cultural and economic value[37]. Regular or continuous monitoring of thetemperature, chemistry and flow rate of hotsprings, and the temperature and water level inhot pools are generally made. Decreases in theseparameters are also indicative of changes whichmay lead to the demise of these features.
0
Gravity change (mgal)
Productionarea
Injectionarea
0
0
50
100
00
0
0
1 km
25−25 50
IncreaseDecrease
−50
−50
75−100 −75 100 125
Geothermal Field and Reservoir Monitoring,Fig. 13 Gravity changes at Mokai geothermal field,New Zealand, between 1997 and 2004. Open circles indi-cate measurement points; contour interval 25 mgal(25 � 10�8 m/s2). Data has been corrected for the effectsof small amounts of ground subsidence
Geothermal Field and Reservoir Monitoring 17

Geothermal Field andReservoir Monitoring,Fig. 14 Cross sectionthrough the Geysers field(California, USA) showinglocations of earthquakes(black dots) during a12-month period. Injectionwells are shown in blue.Earthquake hypocentersand wells within 2000 ft(600 m) of the section linehave been projected ontothe cross section. Note thatthe earthquake hypocentersextend to depths greatlybelow the bottom of someinjection wells (Taken from[34])
Mar
-95
Mar
-96
Mar
-97
Mar
-98
Mar
-99
Dec
-98
Dec
-97
Dec
-96
Dec
-95
Dec
-94
Sep
t-94
0.0
0
50
100
Eve
nts
/mo
nth
150
200
250
Bill
ion
of
po
un
ds/
Mo
1.0
2.0
3.0
4.0
5.0
6.0
7.0
Sep
t-95
Sep
t-96
Sep
t-97
Sep
t-98
June
-98
Steam producedWater injectedUnocal eventsUSGS events
June
-97
June
-96
June
-95
Geothermal Field and Reservoir Monitoring, Fig. 15 Comparison of changes in the number of seismic eventsdetected with variation in the amount of injection at the Geysers field, USA (Graph taken from [34])
18 Geothermal Field and Reservoir Monitoring

The temperature of water emerging from theground in hot springs and in pools is measuredusing a variety of commercially available devicesemploying thermistors or thermocouples. Thetemperature data are often measured continuouslyand captured in a data logger. The flow rate ofsprings and the rate of outflow from hot pools aregenerally measured by constructing a channel totake all the water from the feature and pass itthrough a V-notch weir. The basic principle isthat flow rate is directly related to the waterdepth above the bottom of the V. The V-notchdesign causes small changes in flow rate to havea large change in depth allowing more accuratemeasurement than with a rectangular weir. Fromthe measurement of the height of the waterflowing through the V-notch and the angle ofthe V, the flow rate can be calculated. However,the value obtained may need to be adjusted to takeinto account rainfall and evaporation from thesurface of the pool and channel before the waterreaches the V-notch. To monitor changes in thechemistry of the water, samples are taken and
analyzed in a laboratory; usually chloride contentis the main chemical species measured. If flowinto a hot pool decreases sufficiently such thatevaporation exceeds inflow, then the water levelin the pool may fall below the overflow and thewater level may temporarily or permanently fall.A difficulty in interpreting temperature and flowrate data is separating natural changes fromproduction-induced changes; this can be mini-mized by taking the measurements at a frequencysufficient to determine natural changes caused bychanges in rainfall and groundwater level.
At Wairakei geothermal field, the flow ratefrom hot springs in Geyser Valley declined(Fig. 17) during the time of preproduction testdischarges of exploration wells in the Waiora Val-ley [36]. Initially, the changes were small andisolated and were thought to be caused by naturalclimatic variations. It was not until much later thatit was recognized that the changes to the hotsprings were associated with changes in the deepreservoir resulting from fluid withdrawal somedistance away. A decline in thermal features in
Geothermal Field and Reservoir Monitoring,Fig. 16 Changes in length of eruption period (T/T0) oftwo geysers in Geyser Valley at Wairakei geothermal field(New Zealand) during the time of preproduction test dis-charges. Eruption periods are normalized to T0= 12.5 h for
the Great Wairakei Geyser, and T0 = 39 min for the BridalVeil Geyser. Rainfall data are monthly running totals ofrainfall in the previous 12 months. Note the steady increasein length of eruption period with time (Taken from [36])
Geothermal Field and Reservoir Monitoring 19

producing high-temperature geothermal fieldsappears to be associated mainly with a decline inreservoir pressure. As the pressure declines, soalso does the amount of geothermal fluid reachingthe surface and hence the thermal features declinein size and vigor. If pressures fall further then thefeatures may die and the flow may reverse, withcold groundwater flowing down into the reservoir;once this situation has occurred it may take a longtime to resurrect the features. Monitoring ofchanges to hot springs and hot pools may enabledeclines to be recognized quickly and remedialaction taken.
Future Directions
Reservoir monitoring will probably expand inscope and increase in frequency in the futurebecause regulatory authorities are generallybecoming more concerned about environmentaleffects. There are also commercial and economiceffects which may result in more monitoring.Monitoring data help improve numerical simula-tion models which developers use to identify thepotential effects of changes in production andinjection. The modeling is not only for planningand operational purposes but also to help secureloan funding for future expansion at the mostfavorable interest rates because bankers seek toreduce risk, and monitoring and modeling help inthe reduction of risk.
Geothermal Field and Reservoir Monitoring,Fig. 17 Changes in outflow rate and water level withtime in some hot pools at Geyser Valley, Wairakei. Notehow, as well testing proceeded, the outflow rates declined
and the springs stopped flowing. In the pools associatedwith springs SP 29 and SP 113, the water level droppedbelow the outlet until water stopped flowing and they driedup (Taken from [36])
20 Geothermal Field and Reservoir Monitoring

Significant improvements in monitoring arelikely to be the development of down-hole instru-mentation capable of withstanding high tempera-tures for long periods of time. However, theproblem of relating what is measured in a drillholeto what is occurring in the rock outside the holewill still remain.
Bibliography
Primary Literature1. Thain IA, Carey BS (2009) Fifty years of geothermal
power generation at Wairakei. Geothermics38(1):48–63
2. Allis RG, Hunt TM (1986) Analysis of exploitationinduced gravity changes at Wairakei geothermal field.Geophysics 51:1647–1660
3. Bixley PF, Clotworthy AW, Mannington WI(2009) Evolution of the Wairakei geothermal reservoirduring 50 years of production. Geothermics38(1):145–154
4. Yoder JL (1998) Using meters to measure steam flow.http://www.flowresearch.com/articles/Plant_Engineering_0498.pdf
5. Mattar WM (2005) Advances in Coriolis technologyresolve tough pipeline flow measurement challenges.Pipeline Gas J (July 2005.) http://www.pipelineandgasjournal.com
6. Bixley PF, Wilson DM (1985) Rapid casing corrosionin high temperature liquid dominated geothermal fields.In: Proceedings of the 10th Workshop on GeothermalReservoir Engineering, Stanford, pp 35–40
7. Bowyer D, Bignall G, Hunt T (2008) Formation andneutralization of corrosive fluids in the shallow injec-tion aquifer, Rotokawa geothermal field, New Zealand.GRC Trans 32:201–205
8. Bixley PF, Hattersley SD (1983) Long term casingperformance of Wairakei production wells. In: Proceed-ings of the 5th NZ Geothermal Workshop, Auckland,pp 257–263
9. Glover RB, Mroczek EK (2009) Chemical changes innatural features and well discharges in response to pro-duction at Wairakei, New Zealand. Geothermics38(1):117–133
10. Klyen LE (1973) A vessel for collecting subsurfacewater samples from geothermal drillholes.Geothermics 2:57–60
11. Arnórsson S, Bjarnason JÖ, Giroud N, Gunnarsson I,Stefánsson A (2006) Sampling and analysis of geo-thermal fluids. Geofluids 6(3):203–216
12. Grob RL, Barry EF (2004) Modern practice of gaschromatography, 4th edn. Wiley-Interscience,New York, 1064 pp. ISBN-10: 0471229830, ISBN-13: 978-0471229834
13. Rose PE, Apperson KD, Johnson SD, Adams MC(1997) Numerical simulation of a tracer test at Dixie
Valley, Nevada. In: Proceedings of the 22ndWorkshopon Geothermal Reservoir Engineering, Stanford,pp 169–176
14. Adams MC, Beall JJ, Enedy SL, Hirtz PN, Kilbourn P,Koenig BA, Kunzman R, Smith JL (2001) Hydrofluor-ocarbons as geothermal vapor-phase tracers.Geothermics 30(6):747–775
15. Hirtz PN, Kunzman RJ, Broaddus MK, Barbitta JA(2001) Developments in tracer flow testing for geo-thermal production engineering. Geothermics30(6):727–745
16. McCabe WJ, Barry BJ, Manning MR (1983) Radioac-tive tracers in geothermal underground water flowstudies. Geothermics 12:83–110
17. Massonnet D, Holzer T, Vadon H (1997) Land subsi-dence caused by the East Mesa geothermal field, Cal-ifornia, observed using SAR interferometry. GeophysRes Lett 24:901–904
18. Massonnet D, Feigl KL (1998) Radar interferometryand its application to changes in the earth’s surface.Rev Geophys 36:441–500
19. Hsing-Chung C, Linlin G, Rizos C (2005) InSAR andmathematical modelling for measuring surface defor-mation due to geothermal water extraction inNew Zealand. In: Proceedings of the 2005 I.-E. International Geoscience and Remote SensingSymposium, vol 3, pp 1587–1589
20. Hole JK, Bromley CJ, Stevens NF, Wadge G (2007)Subsidence in the geothermal fields of the Taupo Vol-canic Zone, New Zealand from 1996 to 2005 mea-sured by InSAR. J Volcanol Geotherm Res166:125–146
21. Allis RG, Bromley CJ, Currie S (2009) Update onsubsidence at the Wairakei-Tauhara geothermal sys-tem. Geothermics 38(1):169–180
22. Bromley CJ (2009) Groundwater changes in theWairakei-Tauhara geothermal system. Geothermics38(1):134–144
23. Bromley CJ, Hunt TM, Morris C (1993) Cold down-flows of groundwater at Ohaaki Geothermal Field;preliminary results. In: Proceedings of the 15thNew Zealand Geothermal Workshop, Auckland,pp 181–186
24. Hunt TM, Bromley CJ, Risk GF, Sherburn S,Soengkono S (2009) Geophysical investigations ofthe Wairakei field. Geothermics 38(1):85–97
25. Hunt TM (1970) Gravity changes at Wairakei geother-mal field, New Zealand. Geol Soc Am Bull81:529–536
26. Atkinson PG, Pedersen JR (1988) Using precisiongravity data in geothermal reservoir engineeringmodelling studies. In: Proceedings of the 13th Work-shop on Geothermal Reservoir Engineering, Stanford,pp 35–40
27. Hunt TM, Allis RG, Blakely MR, O’Sullivan MJ(1990) Testing reservoir simulation models for theBroadlands geothermal field using precision gravitydata. Geoth Resour Counc Trans 14:1287–1294
Geothermal Field and Reservoir Monitoring 21

28. Hunt TM (2005) Using repeat microgravity measure-ments to track reinjection in a liquid-dominated field.In: Proceedings of the World Geothermal Congress2005 (CD). Paper No. 1117
29. Hunt TM, Kissling WM (1994) Determination of res-ervoir properties at Wairakei geothermal field usinggravity change measurements. J Volcanol GeothermRes 63:129–143
30. Majer EL, Baria R, Stark M, Oates S, Bommer J,Smith B, Asanuma H (2007) Induced seismicity asso-ciated with enhanced geothermal systems.Geothermics 36:185–222
31. Sherburn S, Allis RG, Clotworthy A (1990) Micro-seismic activity at Wairakei and Ohaaki geothermalfields. In: Proceedings of the 12th NZ GeothermalWorkshop, Auckland, pp 51–55
32. Stein S, Wysession M (2002) An introduction to seis-mology, earthquakes, and earth structure. Wiley-Blackwell, Oxford, 512 pp. ISBN: 978-0-86542-078-6
33. Zuccaa JJ, Hutchingsa LJ, Kasameyera PW(1994) Seismic velocity and attenuation structure ofthe Geysers geothermal field, California. Geothermics23(2):111–126
34. Bommer JJ, Oates S, Cepeda JM, Lindholm C, Bird J,Torres R, Marroquín G, Rivas J (2006) Control ofhazard due to seismicity induced by a hot fracturedrock geothermal project. Eng Geol 83:287–306
35. Smith B, Beall J, StarkM (2000) Induced seismicity inthe SEGeysers field, California, USA. In: Proceedingsof the World Geothermal Congress 2000, Kyushu-Tohuku, Japan, pp 2887–2892
36. White PA, Hunt TM (1996) Simple modelling of theeffects of exploitation on hot springs, Geyser Valley,Wairakei, New Zealand. Geothermics 34:184–204
37. Cataldi R, Hodgson SF, Lund JW (1999) Stories froma heated earth. Geothermal Resources Council and the
International Geothermal Association, Sacramento,California, 569 pp. ISBN 0-934412-19-7
Books and ReviewsArmstead HCH (1980) Geothermal energy: its past, pre-
sent and future contributions to the energy needs ofman. E & F.N. Spon, London
Dickson MH, Fanelli M (2003) Geothermal energy utili-zation and technology. UNESCO Publishing, Paris,205 pp. ISBN 92-3-103915-6
DiPippo R (2008) Geothermal power plants: principles,applications, case studies and environmental impact,2 edn. Butterworth-Heinemann, Oxford,520 pp. ISBN: 978-0-7506-8620-4
Ellis AJ, Mahon WAJ (1977) Chemistry and geothermalsystems. Academic, New York, 392 pp. ISBN:0-12-237450-9
Grant MA, Donaldson IG, Bixley PF (1982) Geothermalreservoir engineering. Academic, New York,369 pp. ISBN: 0-12-295620-6
Hunt TM (2001) Five lectures on environmental effects ofgeothermal utilization. Report 2000–1, United NationsUniversity, Reykjavik, Iceland, 109 pp. ISBN: 9979-68-070-9. http://os.is/Apps/WebObjects/Orkustofnun.woa/swdocument/2056/Trevor03.pdf
Kruger P, Otte C (1973) Geothermal energy: resources,production, stimulation. Stanford University Press,California, 360 pp
Rybach L, Muffler LJP (1981) Geothermal systems: prin-ciples and case histories. Wiley, New York
Thorhallsson S (2003) Geothermal well operation andmaintenance. IGC2003 – Short Course September2003:195–217. http://unugtp.is/Apps/WebObjects/Orkustofnun.woa/swdocument/539/13Sverrir.pdf
22 Geothermal Field and Reservoir Monitoring