hope bay project - miningnorth.com
TRANSCRIPT

The business of sustainability
Hope Bay Project 2019 Socio-economic Monitoring Program
July 2020
Project No.: 0510704-0008

www.erm.com Version: C.1 Project No.: 0510704-0008 Client: TMAC Resources Inc. July 2020
July 2020
Hope Bay Project 2019 Socio-economic Monitoring Program
ERM Consultants Canada Ltd.
1111 West Hastings Street, 15th Floor Vancouver, BC Canada V6E 2J3 T: +1 604 689 9460 F: +1 604 687 4277
© Copyright 2020 by ERM Worldwide Group Ltd and/or its affiliates (“ERM”). All rights reserved. No part of this work may be reproduced or transmitted in any form, or by any means, without the prior written permission of ERM.

EXECUTIVE SUMMARY
The Hope Bay Project includes the Doris Mine (in operation), the Madrid-Boston (Phase 2) Project (under construction), and other mineral exploration and development within the Hope Bay Greenstone Belt. The Hope Bay Socio-economic Monitoring Program (SEMP) is conducted annually in compliance with the Terms and Conditions for socio-economic monitoring and reporting, as applicable to the Doris Mine (Amendment No. 2 of Project Certificate No. 003) and the Madrid-Boston Project (Project Certificate No. 009) issued by the Nunavut Impact Review Board (NIRB). The objectives of the SEMP include, among others, to verify the accuracy of socio-economic impact predictions made in the Doris North Final Environmental Impact Assessment (FEIS) and Madrid-Boston FEIS and to determine the effectiveness of planned mitigation measures.
The SEMP consists of 60 socio-economic indicators. TMAC provided data for 42 indicators. The remaining community-level indicators required data from other sources, including the Government of Canada (GC), Government of Nunavut (GN), Nunavut Housing Corporation (NHC), Royal Canadian Mounted Police (RCMP), and Nunavut Arctic College (NAC).
KEY RESULTS FROM THE HOPE BAY SEMP FOR 2019 INCLUDE THE FOLLOWING:
ECONOMIC DEVELOPMENT
TMAC paid $10.8 million directly to the Kitikmeot Inuit Association (KIA), Nunavut Tunngavik Incorporated (NTI) and the Kitikmeot Corporation to promote the social, economic, and cultural well-being of Inuit in Nunavut.
TMAC paid $1.6 million directly to the GN in territorial taxes that support the provision of government programs and services.
CONTRACTING AND BUSINESS EXPENDITURES
The Project had a positive effect on businesses in the Kitikmeot represented by an increase of 35% in procurement from Inuit owned businesses.
An estimated 45% of the total value of contracts awarded by TMAC was awarded to Inuit businesses:
$204.1 million in contracts awarded to businesses
$91.5 million in contracts awarded to Inuit owned businesses
EMPLOYMENT
TMAC and contractors hired up to 760 workers with an average workforce effort of 1,987 hours per worker.
PROJECT EMPLOYMENT SINCE 2013:
Up to 63 Kitikmeot Inuit (8% of total workforce) and
15 Inuit from outside of the Kitikmeot (2% of total workforce) worked at the Project.
Level of employment by Kitikmeot community was highest in Cambridge Bay:
The share of workforce effort by women increased by
70%. TMAC has been successful at hiring more women and increasing the number of hours worked by women as the Project advances. As a percentage of total effort:
TMAC paid salaries totaling $30.8 million ( 40% compared to 2018)
o Of that, $2.5 million ( 31% compared to 2018) was paid to Inuit workers.
0
100
200
300
400
500
600
700
800
Q2-
3Q
4Q
1Q
2Q
3Q
4Q
1Q
2Q
3Q
4Q
1Q
2Q
3Q
4Q
1Q
2Q
3Q
4Q
1Q
2Q
3Q
4Q
1Q
2Q
3Q
4
2013 2014 2015 2016 2017 2018 2019
Average on Site (workers at any one time) Total on Site (individual workers)
33
17
14
5
2
Cambridge Bay
Gjoa haven
Kugluktuk
Taloyoak
Kuggaruk
11% •Women
3% •Inuit Women

EXECUTIVE SUMMARY (continued)
Employee turnover rate for TMAC’s direct employees was 26% for all employees and 35% for Inuit employees.
There was one lost time incidence and 76 minor injuries.
TMAC provided 158 hours of general training to Inuit workers, 458 hours of health & safety related training, and 7,754 hours of work-related training.
There was one apprenticeship in Heavy Duty Mechanics with the Project held by an Inuit employee.
Inuit employees held a mix of unskilled and semi-skilled positions, while being underrepresented in skilled, professional and management positions.
By department, Inuit employees worked in site operations and site services, and to a lesser degree in exploration, environment and corporate.
TMAC recruited 35 Inuit in 2019; of that 12 were previously employed in other community roles while 23 were unemployed.
POPULATION DEMOGRAPHICS
TMAC employees did not migrate to the Kitikmeot region or to communities closest to the Project.
The Project does not appear to be a driver for population growth.
COMMUNITY INFRASTRUCTURE AND PUBLIC SERVICES
The demand for public housing continues to be significant in the Kitikmeot. In 2019, there was one less person on the public housing waitlist in Cambridge Bay, no change to the number of people on the waitlist in Kugluktuk, and an increase in the number of people on the waitlist in the remaining communities:
143128
112 111 107
52% 54%
70%
38%
52%
0%
10%
20%
30%
40%
50%
60%
70%
80%
0
20
40
60
80
100
120
140
160
CambridgeBay
Gjoa Haven Kugaaruk Kugluktuk Taloyoak
Number of People on the Public Housing Waitlist
Waitlist as a Percentage of Available Stock
There were three new approvals under the Nunavut Down Payment Assistance Program (NDAP) in 2019/20 in Cambridge Bay. Housing status of Project employees is unknown; the housing status survey is to be developed in the coming years.
Project use of GN emergency services continues to be negligible with no utilization in 2019.
The demand for police services generally increased in Kitikmeot communities, with the exception of Taloyoak. In 2019, there were 5,313 police calls in the region:
INDIVIDUAL AND COMMUNITY HEALTH AND WELLNESS
Twelve Inuit left TMAC employment in 2019. Reasons for leaving included:
Financial literacy training has not been provided due to lack of interest.
The site’s Country Food Kitchen continues to be open and available to Project workers.
MANAGEMENT RESPONSE
Enabled by the provisions of the IIBA, TMAC will continue to:
Encourage Kitikmeot Inuit to seek Project employment.
Support the development of skills and worker readiness for employment by working with the KIA, GN, and NAC.
Encourage contractors to rely on Inuit workers, and demonstrate a preference for Kitikmeot Qualified Businesses and other contractors with Inuit content.
1,566773
274
2,035
665
1%-8%
-20%
47%
14%
-30%
-20%
-10%
0%
10%
20%
30%
40%
50%
60%
0
500
1,000
1,500
2,000
2,500
Cambridge Bay Gjoa Haven Kugaaruk Kugluktuk Taloyoak
Number of Police Calls in 2019 % Change from 2018 to 2019
4 •end of contract
2 •terminations due to work performance
2 •terminations due to missing work rotations
3 •resignations due to family commitments
1 •resignation to seek promotion in another job

www.erm.com Version: C.1 Project No.: 0510704-0008 Client: TMAC Resources Inc. July 2020 Page iii
HOPE BAY PROJECT 2019 Socio-economic Monitoring Program
ACKNOWLEDGEMENTS
ACKNOWLEDGEMENTS
This report was prepared for TMAC Resources Inc. (TMAC) by Klaudia Sieminska (BA, MA), Dr. Kent Gustavson (BSc, MSc, PhD), and Pablo McDonald (BScEng) of ERM Consultants Canada Ltd. (ERM). Project management was provided by Nicole Bishop (BSc). Marc Wen (MSc, RPBio) was the Partner-in-Charge. The help and information provided by Alex Buchan, Julia Micks, Ikey Evalik and others of TMAC is gratefully acknowledged.

www.erm.com Version: C.1 Project No.: 0510704-0008 Client: TMAC Resources Inc. July 2020 Page v
HOPE BAY PROJECT 2019 Socio-economic Monitoring Program
CONTENTS
CONTENTS
EXECUTIVE SUMMARY ............................................................................................................................... I
ACKNOWLEDGEMENTS ............................................................................................................................ III
ACRONYMS AND ABBREVIATIONS ...................................................................................................... XIII
1. INTRODUCTION .............................................................................................................................. 1-1 1.1 Hope Bay Project Overview ............................................................................................................... 1-1 1.2 Description of Socio-economic Monitoring Program .......................................................................... 1-1
1.2.1 Compliance Requirements ............................................................................................... 1-1 1.2.1.1 Nunavut Land Claims Agreement ............................................................... 1-1 1.2.1.2 NIRB Project Certificate .............................................................................. 1-1
1.2.2 Kitikmeot Region Socio-economic Monitoring Committee ................................................ 1-4 1.2.3 Project Socio-economic Management and Mitigation....................................................... 1-5
1.2.3.1 Inuit Impact and Benefit Agreement Implementation Committee ................ 1-5 1.2.3.2 TMAC Social Responsibility ........................................................................ 1-5
1.3 Purpose of this Report ....................................................................................................................... 1-6 1.4 Structure of this Report ...................................................................................................................... 1-7
2. METHODS ........................................................................................................................................ 2-1 2.1 Indicators ........................................................................................................................................... 2-1 2.2 Data Analysis and Interpretation ........................................................................................................ 2-1
2.2.1 Quantitative Data ............................................................................................................. 2-9 2.2.2 Qualitative Information ..................................................................................................... 2-9 2.2.3 Charts, Graphs, and Infographics .................................................................................... 2-9 2.2.4 Community Data Challenges .......................................................................................... 2-10
3. ECONOMIC DEVELOPMENT ......................................................................................................... 3-1 3.1 Growth of Revenues to Inuit Organizations ........................................................................................ 3-1
3.1.1 Predictions ....................................................................................................................... 3-1 3.1.2 Results ............................................................................................................................. 3-1 3.1.3 Interpretation .................................................................................................................... 3-1
3.2 Growth in Revenues to the Government of Nunavut .......................................................................... 3-1 3.2.1 Predictions ....................................................................................................................... 3-1 3.2.2 Results ............................................................................................................................. 3-1 3.2.3 Interpretation .................................................................................................................... 3-1
3.3 Growth in Mining Industry Expenditures ............................................................................................. 3-2 3.3.1 Predictions ....................................................................................................................... 3-2 3.3.2 Results ............................................................................................................................. 3-2 3.3.3 Interpretation .................................................................................................................... 3-2
3.4 Effects Management and Mitigation ................................................................................................... 3-3
4. CONTRACTING AND BUSINESS EXPENDITURES ..................................................................... 4-1 4.1 Procurement Expenditures ................................................................................................................. 4-1
4.1.1 Predictions ....................................................................................................................... 4-1

www.erm.com Version: C.1 Project No.: 0510704-0008 Client: TMAC Resources Inc. July 2020 Page vi
HOPE BAY PROJECT 2019 Socio-economic Monitoring Program
CONTENTS
4.1.2 Results ............................................................................................................................. 4-1 4.1.3 Interpretation .................................................................................................................... 4-1
4.2 Procurement from Nunavut Businesses ............................................................................................. 4-1 4.2.1 Predictions ....................................................................................................................... 4-1 4.2.2 Results ............................................................................................................................. 4-1 4.2.3 Interpretation .................................................................................................................... 4-2
4.3 Procurement from Kitikmeot Businesses ........................................................................................... 4-2 4.3.1 Predictions ....................................................................................................................... 4-2 4.3.2 Results ............................................................................................................................. 4-2 4.3.3 Interpretation .................................................................................................................... 4-2
4.4 Procurement from Inuit Firms ............................................................................................................. 4-3 4.4.1 Predictions ....................................................................................................................... 4-3 4.4.2 Results ............................................................................................................................. 4-3 4.4.3 Interpretation .................................................................................................................... 4-3
4.5 Business Development ...................................................................................................................... 4-3 4.5.1 Predictions ....................................................................................................................... 4-3 4.5.2 Results ............................................................................................................................. 4-3 4.5.3 Interpretation .................................................................................................................... 4-8
4.6 Effects Management and Mitigation ................................................................................................... 4-8
5. EMPLOYMENT ................................................................................................................................ 5-1 5.1 Overall Employment ........................................................................................................................... 5-1
5.1.1 Predictions ....................................................................................................................... 5-1 5.1.2 Results ............................................................................................................................. 5-1 5.1.3 Interpretation .................................................................................................................... 5-1
5.2 Inuit and Kitikmeot Employment ......................................................................................................... 5-3 5.2.1 Predictions ....................................................................................................................... 5-3 5.2.2 Results ............................................................................................................................. 5-3 5.2.3 Interpretation .................................................................................................................... 5-6
5.3 Gender Equity .................................................................................................................................... 5-6 5.3.1 Predictions ....................................................................................................................... 5-6 5.3.2 Results ............................................................................................................................. 5-7 5.3.3 Interpretation .................................................................................................................... 5-7
5.4 Employment Income .......................................................................................................................... 5-8 5.4.1 Predictions ....................................................................................................................... 5-8 5.4.2 Results ............................................................................................................................. 5-8 5.4.3 Interpretation .................................................................................................................... 5-8
5.5 Employee Retention ........................................................................................................................... 5-9 5.5.1 Predictions ....................................................................................................................... 5-9 5.5.2 Results ............................................................................................................................. 5-9 5.5.3 Interpretation .................................................................................................................... 5-9
5.6 Worker Health and Safety ................................................................................................................ 5-10 5.6.1 Predictions ..................................................................................................................... 5-10

www.erm.com Version: C.1 Project No.: 0510704-0008 Client: TMAC Resources Inc. July 2020 Page vii
HOPE BAY PROJECT 2019 Socio-economic Monitoring Program
CONTENTS
5.6.2 Results ........................................................................................................................... 5-10 5.6.3 Interpretation .................................................................................................................. 5-10
5.7 On-the-job Training .......................................................................................................................... 5-11 5.7.1 Predictions ..................................................................................................................... 5-11 5.7.2 Results ........................................................................................................................... 5-11 5.7.3 Interpretation .................................................................................................................. 5-13
5.8 Apprenticeships ................................................................................................................................ 5-14 5.8.1 Predictions ..................................................................................................................... 5-14 5.8.2 Results ........................................................................................................................... 5-14 5.8.3 Interpretation .................................................................................................................. 5-14
5.9 Skill Levels ....................................................................................................................................... 5-14 5.9.1 Predictions ..................................................................................................................... 5-14 5.9.2 Results ........................................................................................................................... 5-14 5.9.3 Interpretation .................................................................................................................. 5-16
5.10 Retention of Skilled Workers in Community Roles ........................................................................... 5-16 5.10.1 Predictions ..................................................................................................................... 5-16 5.10.2 Results ........................................................................................................................... 5-16 5.10.3 Interpretation .................................................................................................................. 5-17
5.11 Effects Management and Mitigation ................................................................................................. 5-17
6. EDUCATION AND TRAINING ......................................................................................................... 6-1 6.1 Availability of Post Secondary Education ........................................................................................... 6-1
6.1.1 Predictions ....................................................................................................................... 6-1 6.1.2 Results ............................................................................................................................. 6-1 6.1.3 Interpretation .................................................................................................................... 6-1
6.2 Participation in Post Secondary Education ........................................................................................ 6-1 6.2.1 Predictions ....................................................................................................................... 6-1 6.2.2 Results ............................................................................................................................. 6-2 6.2.3 Interpretation .................................................................................................................... 6-2
6.3 Investment in Education ..................................................................................................................... 6-3 6.3.1 Predictions ....................................................................................................................... 6-3 6.3.2 Results ............................................................................................................................. 6-3 6.3.3 Interpretation .................................................................................................................... 6-3
6.4 Understanding of Employment Opportunities ..................................................................................... 6-3 6.4.1 Predictions ....................................................................................................................... 6-3 6.4.2 Results ............................................................................................................................. 6-3 6.4.3 Interpretation .................................................................................................................... 6-4
6.5 High-School Participation ................................................................................................................... 6-4 6.5.1 Predictions ....................................................................................................................... 6-4 6.5.2 Results ............................................................................................................................. 6-4 6.5.3 Interpretation .................................................................................................................... 6-7
6.6 High School Completion ..................................................................................................................... 6-7 6.6.1 Predictions ....................................................................................................................... 6-7

www.erm.com Version: C.1 Project No.: 0510704-0008 Client: TMAC Resources Inc. July 2020 Page viii
HOPE BAY PROJECT 2019 Socio-economic Monitoring Program
CONTENTS
6.6.2 Results ............................................................................................................................. 6-7 6.6.3 Interpretation .................................................................................................................... 6-7
6.7 Effects Management and Mitigation ................................................................................................... 6-9
7. POPULATION DEMOGRAPHICS ................................................................................................... 7-1 7.1 Population Stability ............................................................................................................................. 7-1
7.1.1 Predictions ....................................................................................................................... 7-1 7.1.2 Results ............................................................................................................................. 7-1 7.1.3 Interpretation .................................................................................................................... 7-3
7.2 Effects Management and Mitigation ................................................................................................... 7-3
8. COMMUNITY INFRASTRUCTURE AND PUBLIC SERVICES ...................................................... 8-1 8.1 Housing Availability ............................................................................................................................ 8-1
8.1.1 Predictions ....................................................................................................................... 8-1 8.1.2 Results ............................................................................................................................. 8-1 8.1.3 Interpretation .................................................................................................................... 8-2
8.2 Housing Status ................................................................................................................................... 8-2 8.2.1 Predictions ....................................................................................................................... 8-2 8.2.2 Results ............................................................................................................................. 8-2 8.2.3 Interpretation .................................................................................................................... 8-3
8.3 Project Use of Emergency Services ................................................................................................... 8-3 8.3.1 Predictions ....................................................................................................................... 8-3 8.3.2 Results ............................................................................................................................. 8-3 8.3.3 Interpretation .................................................................................................................... 8-3
8.4 Demand for Health and Social Services ............................................................................................. 8-3 8.4.1 Predictions ....................................................................................................................... 8-3 8.4.2 Results ............................................................................................................................. 8-3 8.4.3 Interpretation .................................................................................................................... 8-5
8.5 Demand for Police Services ............................................................................................................... 8-7 8.5.1 Predictions ....................................................................................................................... 8-7 8.5.2 Results ............................................................................................................................. 8-7 8.5.3 Interpretation .................................................................................................................... 8-9
8.6 Effects Management and Mitigation ................................................................................................. 8-11
9. INDIVIDUAL AND COMMUNITY HEALTH AND WELLNESS ....................................................... 9-1 9.1 Work-life Balance ............................................................................................................................... 9-1
9.1.1 Predictions ....................................................................................................................... 9-1 9.1.2 Results ............................................................................................................................. 9-1 9.1.3 Interpretation .................................................................................................................... 9-1
9.2 Household Financial Management ..................................................................................................... 9-2 9.2.1 Predictions ....................................................................................................................... 9-2 9.2.2 Results ............................................................................................................................. 9-2 9.2.3 Interpretation .................................................................................................................... 9-2
9.3 Spending Decisions and Lifestyle Choices ........................................................................................ 9-2

www.erm.com Version: C.1 Project No.: 0510704-0008 Client: TMAC Resources Inc. July 2020 Page ix
HOPE BAY PROJECT 2019 Socio-economic Monitoring Program
CONTENTS
9.3.1 Predictions ....................................................................................................................... 9-2 9.3.2 Results ............................................................................................................................. 9-2 9.3.3 Interpretation .................................................................................................................... 9-8
9.4 Country Foods Consumption ............................................................................................................. 9-8 9.4.1 Predictions ....................................................................................................................... 9-8 9.4.2 Results ............................................................................................................................. 9-8 9.4.3 Interpretation .................................................................................................................... 9-8
9.5 Food Security ..................................................................................................................................... 9-8 9.5.1 Predictions ....................................................................................................................... 9-8 9.5.2 Results ............................................................................................................................. 9-8 9.5.3 Interpretation .................................................................................................................... 9-9
9.6 Household Economic Self-sufficiency .............................................................................................. 9-10 9.6.1 Predictions ..................................................................................................................... 9-10 9.6.2 Results ........................................................................................................................... 9-10 9.6.3 Interpretation .................................................................................................................. 9-12
9.7 Effects Management and Mitigation ................................................................................................. 9-12
10. CONCLUSIONS ............................................................................................................................. 10-1 10.1 Summary of Results ......................................................................................................................... 10-1 10.2 Management Response ................................................................................................................... 10-3
11. REFERENCES ............................................................................................................................... 11-1
APPENDIX A SUMMARY OF PROJECT ACTIVITIES, 2013 TO 2019
List of Tables Table 1.1-1: Construction and Operation Schedule for the Hope Bay Project .................................................. 1-3 Table 2.1-1: Valued Socio-economic Components (VSECs) ............................................................................ 2-2 Table 2.1-2: Socio-economic Indicators ........................................................................................................... 2-3 Table 3.3-1: Project Expenditures (Million Canadian Dollars) .......................................................................... 3-2 Table 3.4-1: Economic Development Management and Mitigation Measures .................................................. 3-3 Table 4.1-1: Total Spend by Category (Million Dollars), 2017 to 2019 ............................................................. 4-1 Table 4.2-1: Contracts Awarded to Nunavut Businesses (Million Dollars), 2017 to 2019 ................................. 4-1 Table 4.3-1: Contracts Awarded to Kitikmeot Businesses (Million Dollars), 2017 to 2019................................ 4-2 Table 4.4-1: Contracts Awarded to Inuit Businesses (Million Dollars), 2017 to 2019 ....................................... 4-3 Table 4.5-1: NTI Registered Inuit-Owned Firms and KQBs in Kitikmeot, 2017 to 2019 ................................... 4-4 Table 4.5-2: Profile of Registered Inuit Firms in the Kitikmeot Region, 2019.................................................... 4-4 Table 4.6-1: Contracting and Business Expenditures Management and Mitigation Measures ......................... 4-8 Table 5.1-1: Workforce Effort by Project Employees and Contractors, 2014 to 2019 ....................................... 5-1 Table 5.2-1: Project Workforce Effort (Employees and Contractors), 2015 to 2019 ......................................... 5-3 Table 5.3-1: Workforce Effort by Women, 2015 to 2019 .................................................................................. 5-7 Table 5.4-1: Total TMAC Payroll (Kitikmeot-based and On-site, Million Dollars), 2015 to 2019 ....................... 5-8
www.erm.com Version: C.1 Project No.: 0510704-0008 Client: TMAC Resources Inc. July 2020 Page x
HOPE BAY PROJECT 2019 Socio-economic Monitoring Program
CONTENTS
Table 5.4-2: Total TMAC Payroll for Inuit Employees by Community, 2017 to 2019 ........................................ 5-8 Table 5.5-1: Turnover Rate for All Employees and for Inuit Employees, 2017 to 2019 .................................... 5-9 Table 5.6-1: Hope Bay Project Lost Time Incidences, 2014 to 2019 .............................................................. 5-10 Table 5.6-2: Hope Bay Project Injuries, 2017 to 2019 .................................................................................... 5-11 Table 5.7-1: On-the-job Training Courses, 2013 to 2017 ............................................................................... 5-11 Table 5.7-2: Training Delivered by TMAC to Non-Inuit Workers in 2018 ........................................................ 5-12 Table 5.7-3: Training Delivered by TMAC to Inuit Workers in 2018 (Hours) ................................................... 5-13 Table 5.7-4: Training Delivered by TMAC to Inuit Workers in 2019 (Hours) ................................................... 5-13 Table 5.9-1: Inuit Workers (Employees and Contractors) by Category, 2018 and 2019 ................................. 5-15 Table 5.9-2: Inuit Workers (Employees and Contractors) by Department, 2016 to 2019 ............................... 5-15 Table 5.11-1: Employment Management and Mitigation Measures ................................................................ 5-18 Table 6.2-1: Enrollment at the NAC by Campus ............................................................................................... 6-2 Table 6.2-2: Enrollment by NAC Program ........................................................................................................ 6-2 Table 6.7-1: Education and Training Management and Mitigation Measures ................................................... 6-9 Table 7.2-1: Population Stability Management and Mitigation Measures ......................................................... 7-3 Table 8.1-1: Number of People on the Public Housing Waitlist – Total and as a Percentage of
Available Public Housing Stock .......................................................................................................... 8-1 Table 8.5-1: Police Calls for Services, 2010 to 2019 ........................................................................................ 8-7 Table 8.6-1: Infrastructure and Public Services Management and Mitigation Measures ................................ 8-11 Table 9.5-1: NFPS – Comparison of 24 Select Food Items Basket, 2014 to 2018 ........................................... 9-9 Table 9.7-1: Health and Wellness Management and Mitigation Measures ..................................................... 9-12
List of Figures Figure 1.1-1: Hope Bay Project Location .......................................................................................................... 1-2 Figure 5.1-1: Number of Project Employees and Contractors, 2013 to 2019 ................................................... 5-2 Figure 5.2-1: Inuit and Kitikmeot Employment (Number of Workers and Percent of Total Workforce),
2018 and 2019 ................................................................................................................................... 5-4 Figure 5.2-2: Kitikmeot Workers (Number and Percent of Total Workforce) by Community,
2018 and 2019 ................................................................................................................................... 5-5 Figure 6.5-1: Public School Enrollment by Community, 2003 to 2017 .............................................................. 6-5 Figure 6.5-2: Kitikmeot Public School Enrollment by Grade, 2003 to 2017 ...................................................... 6-6 Figure 6.6-1: Secondary School Graduates by Community, 2001/02 to 2016/17 ............................................. 6-8 Figure 7.1-1: Population by Community and in the Kitikmeot Region (Estimate and Percentage
Change from Previous Year), 2001 to 2018 ....................................................................................... 7-2 Figure 8.4-1: Health Centre Visits by Community and Region (Total and per Capita), 2003 to 2016 ............... 8-4 Figure 8.4-2: Social Assistance Average Monthly Caseload by Community (Total and per
100,000 Persons), 2004 to 2018 ........................................................................................................ 8-6 Figure 8.5-1: Police Calls for Service (Total and per Capita), 2010 to 2019 ..................................................... 8-8 Figure 8.5-2: Criminal Code Violations for the Kitikmeot Region and by Community (Total Number
and per 100,000 Persons), 2001 to 2017 ......................................................................................... 8-10 Figure 9.3-1: Sale of Alcoholic Beverages in Nunavut, 2004/05 to 2017/18 ..................................................... 9-4
www.erm.com Version: C.1 Project No.: 0510704-0008 Client: TMAC Resources Inc. July 2020 Page xi
HOPE BAY PROJECT 2019 Socio-economic Monitoring Program
CONTENTS
Figure 9.3-2: Impaired Driving Criminal Violations (Total Number and per 100,000 Persons), 2001 to 2017 ...................................................................................................................................... 9-5
Figure 9.3-3: Drug-Related Criminal Violations (Total Number and per 100,000 Persons), 2001 to 2017 ...................................................................................................................................... 9-6
Figure 9.3-4: Assault-Related Criminal Violations (Total Number and per 100,000 Persons), 2001 to 2017 ...................................................................................................................................... 9-7
Figure 9.6-1: Low Income Families and Non-family Persons (Total and as a Percentage of All Families and Non-family Persons), 2004 to 2016............................................................................. 9-11

www.erm.com Version: C.1 Project No.: 0510704-0008 Client: TMAC Resources Inc. July 2020 Page xiii
HOPE BAY PROJECT 2019 Socio-economic Monitoring Program
ACRONYMS AND ABBREVIATIONS
ACRONYMS AND ABBREVIATIONS
the Belt The Hope Bay Belt
CAPEX Capital Expenditures
Care and Maintenance
Project activities consisting of regular site and infrastructure maintenance, and ongoing environmental monitoring to ensure a safe and stable condition. Project development and operation activities are suspended.
CIRNAC Crown-Indigenous Relations and Northern Affairs Canada
CPA Chartered Professional Accountants
CPI Consumer Price Index
Doris Doris Project (also known as the Doris North Project in regulatory approvals and permits)
EFAP Employee and Family Assistance Program
ERM ERM Consultants Canada Ltd.
FAI First Aid Injury
FEIS Final Environmental Impact Statement
GC Government of Canada
GN Government of Nunavut
HR Human Resources
HSLP Health Safety and Loss Prevention
IIBA Inuit Impact and Benefit Agreement
INAC Indigenous and Northern Affairs Canada (now CIRNAC)
Inuit Aboriginal peoples of northern Canada and Greenland. In the context of Nunavut, those with status under the Nunavut Agreement.
IQ Inuit Qaujimajatuqangit
KIA Kitikmeot Inuit Association
KitSEMC Kitikmeot Socio-Economic Monitoring Committee
KQB Kitikmeot Qualified Businesses
MAI Medical Aid Injury
MMC Miramar Mining Corporation. The parent company that owned the Doris Project prior to Hope Bay Mining Limited.
NAC Nunavut Arctic College
NAICS North American Industry Classification System
NBS Nunavut Bureau of Statistics
NDAP Nunavut Down Payment Assistance Program
NFPS Nunavut Food Price Survey

www.erm.com Version: C.1 Project No.: 0510704-0008 Client: TMAC Resources Inc. July 2020 Page xiv
HOPE BAY PROJECT 2019 Socio-economic Monitoring Program
ACRONYMS AND ABBREVIATIONS
NHC Nunavut Housing Corporation
NIRB Nunavut Impact Review Board
Non-KQB Other Kitikmeot-based businesses
NTI Nunavut Tunngavik Incorporated
NWB Nunavut Water Board
Nunavummiut Residents of Nunavut
OPEX Operating Expenditures
Phase 2 (Madrid-Boston) Project
Phase 2 represents the next stage of continued mining operations within the Hope Bay Greenstone Belt, including mining at Madrid North, Madrid South and Boston sites, supported by continued operations at Doris and Roberts Bay.
PME Personal Mobile Equipment
RCMP Royal Canadian Mounted Police
RWI Restricted Work Injury
SEMWG Socio-economic Monitoring Working Group
SEMC Socio-economic Monitoring Committee
SEMP Socio-economic Monitoring Program
the Project Hope Bay Project
TIA Tailings Impoundment Area
TMAC TMAC Resources Inc.
TPD Tonnes per day
VSEC Valued Socio-economic Component

www.erm.com Version: C.1 Project No.: 0510704-0008 Client: TMAC Resources Inc. July 2020 Page 1-1
HOPE BAY PROJECT 2019 Socio-economic Monitoring Program
INTRODUCTION
1. INTRODUCTION
1.1 Hope Bay Project Overview TMAC Resources Inc. (TMAC) holds mineral claims, leases and one Inuit Mineral Exploration Agreement that comprise an approximately 20 × 80 km property (Figure 1.1-1). These mineral holdings comprise the Hope Bay Belt (the Belt), on which the primary gold deposits Doris, Madrid North, Madrid South and Boston are located. The Belt is host to numerous other prospective areas which suggest that economic reserves will continue to be delineated, permitted and developed, creating a multigenerational operation. Through a staged approach, the Hope Bay Project (the Project) is scheduled to achieve mine operations in the Belt through mining at Doris, Madrid North and South, and the Boston deposit.
Following acquisition of the Project by TMAC in March 2013, planning and permitting, advanced exploration and construction activities were focused on bringing Doris into gold production in early 2017. In 2016, the Nunavut Impact Review Board (NIRB) and Nunavut Water Board (NWB) granted an amendment to the Doris North Project Certificate (NIRB Project Certificate 003) and Doris Type A Water Licence (NWB Type A Water Licence 2AM-DOH1323), respectively, to expand mine operations to six years and mine the full Doris deposit. Mining and milling rates were amended to a nominal 1,000 tonnes per day (tpd) to 2,000 tpd. The Madrid-Boston Project includes the construction and operation of commercial mining at the Madrid (North and South) and Boston sites, and the continued operation of Roberts Bay and the Doris site to support mining at Madrid and Boston. The Madrid-Boston Project Final Environmental Impact Statement (FEIS) was submitted to NIRB in December 2017, the FEIS final hearing was held in May 2018, and Project Certificate No. 009 was awarded in November 2018. Water use in 2019 was conducted in accordance with Type A Water Licence 2AM-DOH1323, the Type B Water Licences 2BB-BOS1727 for Boston, the Type B Water Licences 2BB-MAE1727 for Advanced Exploration at Madrid, and the Type B Water Licence 2BE-HOP1222 for regional exploration. Construction of Madrid-Boston began in 2019. A summary of Project activities from 2013 to 2019 is provided in Appendix A. The construction and operation schedule for various components of the Hope Bay Project is provided in Table 1.1-1.
1.2 Description of Socio-economic Monitoring Program
1.2.1 Compliance Requirements
1.2.1.1 Nunavut Land Claims Agreement Article 12 Part 7 of the Nunavut Land Claims Agreement (the Nunavut Agreement) provides for the establishment of a project-specific monitoring program as part of the terms and conditions contained in a NIRB Project Certificate. Subsection 12.7.2 describes the purpose of such a monitoring program as follows:
a. to measure the relevant effects of projects on the ecosystemic and socio-economic environments of the Nunavut Settlement Area;
b. to determine whether and to what extent the land or resource used in question is carried out within the predetermined terms and conditions; and
c. to assess the accuracy of the predictions contained in the project impact statements.
1.2.1.2 NIRB Project Certificate The Socio-economic Monitoring Program (SEMP) for the Doris Project was first designed in 2007 based on the findings of the Final Environmental Impact Statement (FEIS) and to meet the requirements of Condition No. 28 of the Doris North Project Certificate (NIRB No. 003, issued on September 15, 2006 and renewed on April 11, 2013).

!(
!(
!(
!(!(
!(
!(
^̀̂̀
^̀Boston Camp
Madrid Camp Doris Camp
Bathurst Inlet(Kingaok)
Gjoa Haven(Ursuqtuq) Kugaaruk
Taloyoak
Kugluktuk
Omingmaktok(Bay Chimo)
Yellowknife
Cambridge Bay(Ekaluktutiak)
Prince of Wales Island
SomersetIsland
VictoriaIsland
BanksIsland
SouthamptonIsland
NunavutNorthwest Territories
BrodeurPeninsula
BordenPeninsula
DevonIsland
Melville IslandBathurstIsland
Bathurst Inlet
Coronation Gulf
Queen Maud Gulf
Foxe Basin
Amundsen Gulf
Arctic Ocean
McC
lin toc kC
hannel
Gulf of Boothia
Viscount Melville Sound
Parry Channel
80°0'0"W
100°0'0"W
100°0'0"W120°0'0"W
70°0
'0"N
70°0
'0"N
65°0
'0"N
65°0
'0"N
0 150 300
Kilometres
1:8,800,000
Date: March 06, 2019Projection: Canada Lambert Conformal Conic
!( Community
!( Study Community
Kitikmeot Region
Service Layer Credits: Copyright:© 2013 ESRI, i-cubed, GeoEye
Figure 1.1-1: Hope Bay Project Location
GIS # HB-16-044Project No.: 0462113-0008 Client: TMAC RESOURCES INCwww.erm.com

www.erm.com Version: C.1 Project No.: 0510704-0008 Client: TMAC Resources Inc. July 2020 Page 1-3
HOPE BAY PROJECT 2019 Socio-economic Monitoring Program
INTRODUCTION
Table 1.1-1: Construction and Operation Schedule for the Hope Bay Project
Phase Project Year
Calendar Year
Length of Phase (Years)
Description of Activities
Construction 1 - 4 2019 - 2022 4 Roberts Bay: construction of access road (Year 1), marine dock and additional fuel facilities (Year 2 – Year 3)
Doris: expansion of the Doris tailings impoundment area (TIA) and accommodation facility (Year 1)
Madrid North: construction of concentrator and road to Doris TIA (Year 1 – Year 2)
All-weather Road: construction (Year 1 – Year 3) Boston: site preparation and installation of all
infrastructures including process plant (Year 2 – Year 5)
Operation 5 - 14 2023 - 2032 10 Roberts Bay: sealift operations (Year 1 – Year 14) Doris: processing and infrastructure use
(Year 1 – Year 14) Madrid North: mining (Year 1 – 13); ore transport to
Doris process plant (Year 1 -13); ore processing and concentrate transport to Doris process plant (Year 2 – Year 13)
Madrid South: mining (Year 11 – Year 14); ore transport to Doris process plant (Year 11 – Year 14)
All-weather Road: operational (Year 4 – Year 14) Boston: winter access road operating (Year 1 – Year 3);
mining (Year 4 – Year 11); ore transport to Doris process plant (Year 4 – Year 6); and processing ore (Year 5 – Year 11)
Reclamation and Closure
15 - 17 2033 - 2035 3 Roberts Bay: facilities will be operational during closure (Year 15 – Year 17)
Doris: camp and facilities will be operational during closure (Year 15 – Year 17); mine, process plant, and TIA decommissioning (Year 15 – Year 17)
Madrid North: all components decommissioned (Year 15 – Year 17)
Madrid South: all components decommissioned (Year 15 – Year 17)
All-weather Road: road will be operational (Year 15 – Year 16); decommissioning (Year 17)
Boston: all components decommissioned (Year 15 – Year 17)
Temporary Closure
NA NA NA All Sites: Care and maintenance activities, generally consisting of closing down operations, securing infrastructure, removing surplus equipment and supplies, and implementing on-going monitoring and site maintenance activities.
www.erm.com Version: C.1 Project No.: 0510704-0008 Client: TMAC Resources Inc. July 2020 Page 1-4
HOPE BAY PROJECT 2019 Socio-economic Monitoring Program
INTRODUCTION
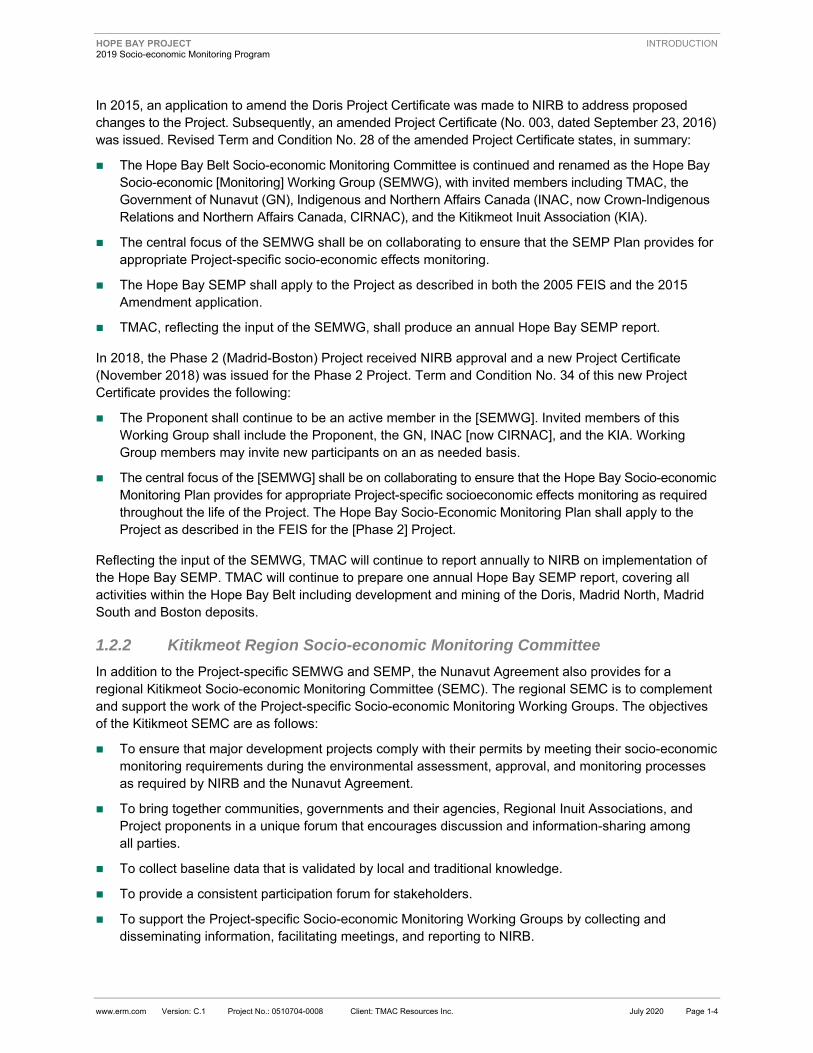
In 2015, an application to amend the Doris Project Certificate was made to NIRB to address proposed changes to the Project. Subsequently, an amended Project Certificate (No. 003, dated September 23, 2016) was issued. Revised Term and Condition No. 28 of the amended Project Certificate states, in summary:
The Hope Bay Belt Socio-economic Monitoring Committee is continued and renamed as the Hope Bay Socio-economic [Monitoring] Working Group (SEMWG), with invited members including TMAC, the Government of Nunavut (GN), Indigenous and Northern Affairs Canada (INAC, now Crown-Indigenous Relations and Northern Affairs Canada, CIRNAC), and the Kitikmeot Inuit Association (KIA).
The central focus of the SEMWG shall be on collaborating to ensure that the SEMP Plan provides for appropriate Project-specific socio-economic effects monitoring.
The Hope Bay SEMP shall apply to the Project as described in both the 2005 FEIS and the 2015 Amendment application.
TMAC, reflecting the input of the SEMWG, shall produce an annual Hope Bay SEMP report.
In 2018, the Phase 2 (Madrid-Boston) Project received NIRB approval and a new Project Certificate (November 2018) was issued for the Phase 2 Project. Term and Condition No. 34 of this new Project Certificate provides the following:
The Proponent shall continue to be an active member in the [SEMWG]. Invited members of this Working Group shall include the Proponent, the GN, INAC [now CIRNAC], and the KIA. Working Group members may invite new participants on an as needed basis.
The central focus of the [SEMWG] shall be on collaborating to ensure that the Hope Bay Socio-economic Monitoring Plan provides for appropriate Project-specific socioeconomic effects monitoring as required throughout the life of the Project. The Hope Bay Socio-Economic Monitoring Plan shall apply to the Project as described in the FEIS for the [Phase 2] Project.
Reflecting the input of the SEMWG, TMAC will continue to report annually to NIRB on implementation of the Hope Bay SEMP. TMAC will continue to prepare one annual Hope Bay SEMP report, covering all activities within the Hope Bay Belt including development and mining of the Doris, Madrid North, Madrid South and Boston deposits.
1.2.2 Kitikmeot Region Socio-economic Monitoring Committee
In addition to the Project-specific SEMWG and SEMP, the Nunavut Agreement also provides for a regional Kitikmeot Socio-economic Monitoring Committee (SEMC). The regional SEMC is to complement and support the work of the Project-specific Socio-economic Monitoring Working Groups. The objectives of the Kitikmeot SEMC are as follows:
To ensure that major development projects comply with their permits by meeting their socio-economic monitoring requirements during the environmental assessment, approval, and monitoring processes as required by NIRB and the Nunavut Agreement.
To bring together communities, governments and their agencies, Regional Inuit Associations, and Project proponents in a unique forum that encourages discussion and information-sharing among all parties.
To collect baseline data that is validated by local and traditional knowledge.
To provide a consistent participation forum for stakeholders.
To support the Project-specific Socio-economic Monitoring Working Groups by collecting and disseminating information, facilitating meetings, and reporting to NIRB.

www.erm.com Version: C.1 Project No.: 0510704-0008 Client: TMAC Resources Inc. July 2020 Page 1-5
HOPE BAY PROJECT 2019 Socio-economic Monitoring Program
INTRODUCTION
In this regard, the Hope Bay SEMP relies on the work of the Kitikmeot SEMC, in particular with respect to data and information for the community-level socio-economic indicators defined for the monitoring program.
1.2.3 Project Socio-economic Management and Mitigation
The Project instituted a number of operational plans, procedures, and standards to better manage and mitigate adverse Project-related socio-economic effects, and to enhance positive effects. These measures stem from both internal corporate requirements and from potential adverse effects identified during the environmental approval processes.
In particular, TMAC is committed to establishing and maintaining the following plans to support the implementation and monitoring of socio-economic mitigation measures for the Project:
The Community Involvement Plan describes how TMAC identifies and engages with community stakeholders, and how they will provide information, solicit feedback, and report on engagement activities and outcomes. The Community Involvement Plan also outlines TMAC’s commitments to workplace conduct, community complaints procedure, workforce communications, local procurement, and other related programs. The Community Involvement Plan provides for community meetings and career awareness sessions in the Kitikmeot region, as well as for participation in regional events organized by third parties.
The Human Resources Plan provides a framework for human resources management including education and training (on-the-job, and through collaboration with regional agencies and institutions), recruitment, hiring, orientation, and compensation. The Human Resources Plan also includes human resource provisions for temporary or final closure.
The Inuit Impact and Benefit Agreement (IIBA) between TMAC and the KIA also provides for the implementation of many socio-economic mitigation measures. In particular, the IIBA provides provisions for Inuit employment, business development and procurement, training, and socio-economic impact monitoring.
1.2.3.1 Inuit Impact and Benefit Agreement Implementation Committee In accordance with Article 26 of the Nunavut Agreement, in March 2015, TMAC entered into a new IIBA with the KIA for the Hope Bay Project. TMAC and the KIA have jointly established an IIBA Implementation Committee whose purpose is to ensure that the provisions of the IIBA are met. The IIBA Implementation Committee meets on a regular basis to consider Inuit employment, contracting, training, and other Project-related matters. Kitikmeot Inuit are key Project stakeholders, and as such, this local IIBA Implementation Committee has been instrumental in addressing a number of real and potential Project impacts to the satisfaction of TMAC and the KIA.
1.2.3.2 TMAC Social Responsibility TMAC has instituted a Corporate Social Responsibility Committee of its Board of Directors. This committee is responsible for establishing and implementing social responsibility policies for TMAC, as well as monitoring company performance against these policies and as compared to applicable laws and regulations. This committee, in conjunction with other TMAC committees, meets periodically and, thus far, the Board of Directors has instituted the following applicable policies and procedures.
Anti-bribery and Anti-corruption Policy
The Anti-bribery and Anti-corruption Policy provides a procedure to ensure that TMAC, including directors, officers, employees, agents, contractors, sub-contractors, and consultants conduct business: in an honest and ethical manner reflecting the highest standards of integrity; in compliance with all laws,

www.erm.com Version: C.1 Project No.: 0510704-0008 Client: TMAC Resources Inc. July 2020 Page 1-6
HOPE BAY PROJECT 2019 Socio-economic Monitoring Program
INTRODUCTION
instruments, rules and regulatory requirements applicable to TMAC; and in a manner that does not contravene anti-bribery and anti-corruption laws that apply to TMAC, including without limitation the Criminal Code (1985) and Corruption of Foreign Public Officials Act (1998).
Code of Ethical Business Conduct
The Code of Ethical Business Conduct sets out acceptable standards of behaviour for TMAC employees working on behalf of the company, including the following: setting a positive work environment; environmental management; managing conflicts of interest; accepting of gifts and entertainment; fair dealing and competitive practices; and public, community, and government relations.
Fitness for Work Policy
The Fitness for Work Policy was established to ensure employees and contractors are fit for work, and are free from any negative impacts from the use or after effects of alcohol and other drugs. It restricts the possession and use of alcohol and drugs at the Project, including provisions for site access and enforcement.
Search and Surveillance Policy
The Search and Surveillance Policy sets out the principles and procedures TMAC will employ to ensure the safety and security of company facilities and personnel through searches and surveillance activities.
Community Complaints Procedure
This procedure provides direction on how to address community complaints. This includes how to document, investigate, and resolve community concerns; a process for members of the community to report concerns related to Project activities and operations; a clear procedure for dealing with concerns; steps to effectively communicate with a community member reporting a concern; and a monitoring mechanism.
Whistleblower Policy
This policy has been put in place to handle complaints, reports or concerns made by an individual regarding questionable accounting practices, violations or suspected violations of any applicable law, or any other suspected wrongdoing according to our Code of Ethical Business Conduct. This policy provides protection to a complainant acting in good faith against any form of retaliation, and provides for a complaint reporting procedure.
1.3 Purpose of this Report The Hope Bay SEMP applies to all of TMAC’s current, planned, and future activities within the Belt, including:
The ongoing mining activities at the Doris site as described in NIRB Amendment No. 2 of Project Certificate No. 003 (dated September 23, 2016);
The Phase 2 (Madrid-Boston) Project, including activities at the Doris, Madrid (North and South) and Boston sites, as described in Project Certificate No. 009 (November 2018);
Ongoing mineral exploration in the Belt; and
Any future amendments or additional development activities within the Belt, in accordance with any associated Terms and Conditions that may be issued for the related Project Certificate(s).
For the above components and activities, the SEMP applies to full life-of-mine including exploration, development, construction, operation, and closure and reclamation.

www.erm.com Version: C.1 Project No.: 0510704-0008 Client: TMAC Resources Inc. July 2020 Page 1-7
HOPE BAY PROJECT 2019 Socio-economic Monitoring Program
INTRODUCTION
The purposes of the SEMP are as follows:
Ensure compliance with conditions of the amended Project Certificate (NIRB No. 003) for the Doris mine and the new Project Certificate (NIRB No. 009) for the Phase 2 (Madrid-Boston) mine;
Ensure compliance with the relevant sections of the Nunavut Agreement, and the relevant directives as outlined in the Environmental Impact Statement Guidelines provided by NIRB (NIRB 2003; AMEC 2007; NIRB 2012);
Fulfill best practices in social responsibility; and
Provide relevant and timely information to community development management.
Specific objectives of the Hope Bay SEMP are to:
Verify the accuracy of the socio-economic impact predictions made in the Doris North Project FEIS (2006), the 2015 Amendment Application for the Doris North Project, and the Madrid-Boston (Phase 2) FEIS (2017), as well as any subsequent impact assessments for other Hope Bay Project components that may be developed within the Belt ;
Review the findings of the SEMP in collaboration with other members of the Hope Bay SEMWG, to identify socio-economic changes in the Kitikmeot communities and consider the potential influence of the Project on these changes;
Determine the effectiveness of mitigation measures, and add or adjust mitigation measures if measures are shown to be ineffective (adaptive management);
Identify any unanticipated effects, and adaptively mitigate as appropriate;
Consider and incorporate, when appropriate, Inuit Qaujimajatuqangit (IQ) into the SEMP, ensuring that, wherever possible, the monitoring program design and methodologies are culturally appropriate;
Provide an annual report to NIRB that will meet the reporting requirements as set out in Amendment No. 2 of Project Certificate No. 003, Project Certificate No. 009, and the Hope Bay SEMWG TOR; and
Periodically review and modify the SEMP to improve its effectiveness, if considered necessary by Hope Bay SEMWG members.
This 2019 Hope Bay SEMP report supersedes the 2018 report and provides the results of the SEMP to date. The report supports the defined purpose and objectives of the Hope Bay SEMP.
1.4 Structure of this Report This report is organized in the following order. Section 2 provides information on the socio-economic indicators and their respective sources, as well as information on the approach to data analysis and interpretation. Section 3 through 9 review and evaluate objectives of the Hope Bay Project as related to economic development, contracting and business expenditures, employment, education and training, population demographics, community infrastructure and public services, as well as individual and community health and wellness. Each objective includes a prediction, results section (data and findings), and interpretation. Predictions are stated with respect to the outgoing activities at the Doris site and several exploration activities, as well as the construction and planned operation activities at Madrid-Boston (the extension and continuation of the Hope Bay Project)1. Finally, Section 10 summarizes results and delivers a management response.
1 The Madrid-Boston Project consists of proposed mine operations at the Madrid North, Madrid South and Boston deposits, and it is part of a staged approach to continuous development of the Hope Bay Project.

www.erm.com Version: C.1 Project No.: 0510704-0008 Client: TMAC Resources Inc. July 2020 Page 2-1
HOPE BAY PROJECT 2019 Socio-economic Monitoring Program
METHODS
2. METHODS
2.1 Indicators The SEMP was originally based on the predicted impacts and mitigation measures as described in the FEIS for the Doris North Project (MMC 2005). This was the basis of the indicators included in the SEMP Plan as originally developed in 2007 and in annual monitoring reports produced since the beginning of construction at Doris (with the first annual report issued in 2012).
The updated SEMP Plan (ERM 2019) considers the 2007 SEMP and the experience of annual reporting to date, including the availability and usefulness of data and indicators. The updated monitoring program also incorporates information from the 2015 Amendment Application for the Doris Project (ERM 2015), and the FEIS for the Madrid-Boston (Phase 2) Project (NIRB 2012; TMAC 2017).
The socio-economic effects assessment of Phase 2 provides the basis for the SEMP indicator framework. Phase 2 components and activities are representative of all Project components and activities that may have socio-economic effects. Indicators have been selected in order to provide information related to the identified potential effects of the Project, so that the monitoring program can determine whether effects occur—and are managed—as predicted.
Table 2.1-1 summarizes the valued socio-economic components (VSECs) for the SEMP, and the potential socio-economic effects associated with each VSEC. Both beneficial and potentially adverse effects are considered and included in the SEMP.
Indicators for the Hope Bay SEMP have been selected as they are one or more of the following (ERM 2019):
Indicators identified in the IIBA between TMAC and the KIA (dated March 2015), including requirements for annual reporting to the IIBA Implementation Committee;
Indicators related to the potential socio-economic effects of the Project, as identified in the Phase 2 FEIS (TMAC 2017);
Core indicators as recently recommended by the GN for Project-specific SEMPs in Nunavut (GN Department of Economic Development & Transportation 2018); and/or
Indicators that provide useful context or otherwise inform the interpretation of the impacts of the Project, including indicators identified by the SEMWG as important to measure.
The selected indicators are used to identify changes in socio-economic conditions that may be of concern, not to fully characterize or explain the reasons behind the observed changes. Changes in monitored elements of the community may result directly or indirectly from Project activities, or may be unrelated to the Project. As is the purpose of a monitoring system, the indicators are used to identify areas of potential concern for further investigation.
Altogether, there are 36 objectives comprising 60 indicators identified for the seven VSECs (Table 2.1-2). This includes both Project indicators (i.e., data to be collected by TMAC) and community indicators (i.e., data to be gathered from community, regional, territorial, and other public sources).
2.2 Data Analysis and Interpretation The following sections outline how data collection (type, frequency, and source), analysis, and interpretation is accomplished. Results for 2018, as well as historical data where available, are presented in Chapters 3 to 9 according to VSEC and the objectives defined for each VSEC.

www.erm.com Version: C.1 Project No.: 0510704-0008 Client: TMAC Resources Inc. July 2020 Page 2-2
HOPE BAY PROJECT 2019 Socio-economic Monitoring Program
METHODS
Table 2.1-1: Valued Socio-economic Components (VSECs)
VSEC and Rationale Predicted Potential Effects
Construction and Operation Closure (Temporary or Final)
Economic Development Project-related employment and procurement will be a driver for economic growth and increased government and Inuit organization revenues
Increased economic growth Reduced economic growth
Contracting and Business Expenditures Project-related procurement of goods and services will create business opportunities and increased income and employment
Opportunities for local businesses
Reduced business opportunities
Employment The Project will create jobs through direct and spin-off employment, resulting in greater labour force capacity and potential competition for labour among employers
Increased employment and income opportunities
Increased labour force capacity (education, skills, experience)
Increased competition for labour
Reduced employment and income opportunities
Education and Training The Project will increase local demand for education and training, and have a positive influence on youths’ outlook on education and future opportunities
Increased demand for education and training programs
Improved perceptions of education and employment benefits
Population Demographics Related to employment opportunities, the Project may result in population migration
Increased in-migration to Kitikmeot communities
Community Infrastructure and Public Services Related to employment opportunities, increasing demand for local housing, infrastructure, and services
Increased demand for housing Increased demand for local
services
Individual and Community Health and Wellness Factors associated with Project employment may affect well-being, including changes to family relationships due to rotational work schedule, changes in spending due to increased income, and changes to traditional harvesting activities and food costs
Changes to family stability (positive and adverse effects)
Changes to family spending (positive and adverse effects)
Changes to food security and cost of living (positive and adverse effects)
Changes to family stability (positive and adverse effects)
www.erm.com Version: C.1 Project No.: 0510704-0008 Client: TMAC Resources Inc. July 2020 Page 2-3
HOPE BAY PROJECT 2019 Socio-economic Monitoring Program
METHODS
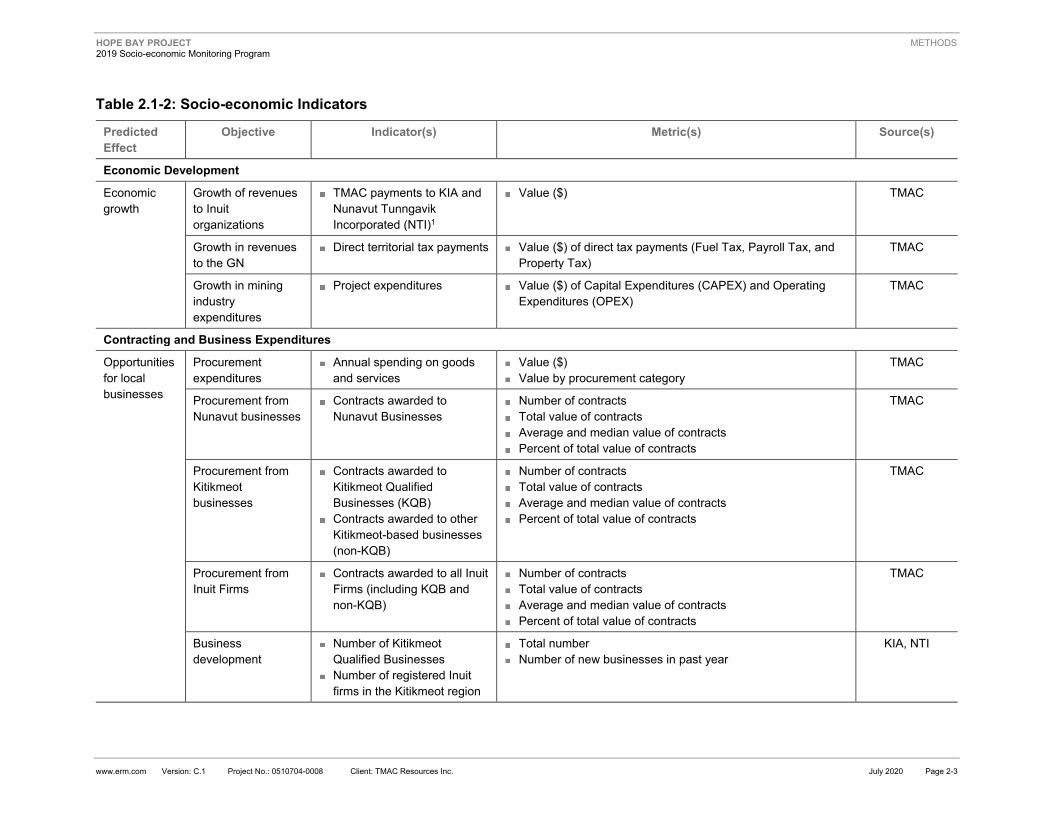
Table 2.1-2: Socio-economic Indicators
Predicted Effect
Objective Indicator(s) Metric(s) Source(s)
Economic Development
Economic growth
Growth of revenues to Inuit organizations
TMAC payments to KIA and Nunavut Tunngavik Incorporated (NTI)1
Value ($) TMAC
Growth in revenues to the GN
Direct territorial tax payments Value ($) of direct tax payments (Fuel Tax, Payroll Tax, and Property Tax)
TMAC
Growth in mining industry expenditures
Project expenditures Value ($) of Capital Expenditures (CAPEX) and Operating Expenditures (OPEX)
TMAC
Contracting and Business Expenditures
Opportunities for local businesses
Procurement expenditures
Annual spending on goods and services
Value ($) Value by procurement category
TMAC
Procurement from Nunavut businesses
Contracts awarded to Nunavut Businesses
Number of contracts Total value of contracts Average and median value of contracts Percent of total value of contracts
TMAC
Procurement from Kitikmeot businesses
Contracts awarded to Kitikmeot Qualified Businesses (KQB)
Contracts awarded to other Kitikmeot-based businesses (non-KQB)
Number of contracts Total value of contracts Average and median value of contracts Percent of total value of contracts
TMAC
Procurement from Inuit Firms
Contracts awarded to all Inuit Firms (including KQB and non-KQB)
Number of contracts Total value of contracts Average and median value of contracts Percent of total value of contracts
TMAC
Business development
Number of Kitikmeot Qualified Businesses
Number of registered Inuit firms in the Kitikmeot region
Total number Number of new businesses in past year
KIA, NTI

www.erm.com Version: C.1 Project No.: 0510704-0008 Client: TMAC Resources Inc. July 2020 Page 2-4
HOPE BAY PROJECT 2019 Socio-economic Monitoring Program
METHODS
Predicted Effect
Objective Indicator(s) Metric(s) Source(s)
Employment
Increased employment and income opportunities
Overall employment Workforce size Total number of Kitikmeot-based and on-site workers (TMAC and contractors)
Annual average number of Kitikmeot-based and on-site workers (TMAC and contractors)
TMAC
Workforce effort Total annual hours worked Average hours per worker
TMAC
Inuit and Kitikmeot employment
Kitikmeot Inuit workforce size (resident of Kitikmeot region)
Kitikmeot Inuit workforce effort
Total number of workers on site (TMAC and contractors) Annual average number of workers on site Total annual hours worked Average hours per worker Employment rate (hours worked by Inuit and Kitikmeot worker
as share of total hours worked)
TMAC
Other Inuit workforce size (not resident of Kitikmeot region)
Other Inuit workforce effort
TMAC
Other regional workforce size (non-Inuit Kitikmeot residents)
Other regional workforce effort
TMAC
Kitikmeot workers by community
Number of workers from each Kitikmeot community (point of hire)
Percent of total Kitikmeot workers
TMAC
Gender equity Workforce effort by women Total hours worked in year Employment rate (hours worked by women as share of total
hours worked)
TMAC
Workforce effort by Inuit women
Total hours worked in year Employment rate (hours worked by Inuit women as share of
total hours worked by Inuit)
TMAC

www.erm.com Version: C.1 Project No.: 0510704-0008 Client: TMAC Resources Inc. July 2020 Page 2-5
HOPE BAY PROJECT 2019 Socio-economic Monitoring Program
METHODS
Predicted Effect
Objective Indicator(s) Metric(s) Source(s)
Increased employment and income opportunities (cont’d)
Employment income Payroll Payroll for Inuit workers
Total value ($) TMAC
Payroll by Kitikmeot community
Total value ($) TMAC
Employee retention Employee turnover rate Non-Inuit employee turnover rate, as represented by total number of non-Inuit departures as share of total number of non-Inuit employees [(period starting + ending number of employees)/2]
Inuit employee turnover rate as represented by total number of Inuit departures as share of total number of Inuit employees
TMAC
Worker health and safety
Lost time incidents Number of lost time incidents Lost workday incident rate
([lost workday cases][200,000]/[hours worked])
TMAC
Utilization of site medic Per capita visits to site medic TMAC
Increased labour force capacity (education, skills, experience)
On-the-job training On-the-job training courses Number of courses and course sessions Number of training hours, by basic category (general, health
and safety, specific)
TMAC
Inuit participation in on-the-job training
Number of training hours for Inuit workers, by basic category (general, health and safety, specific)
Number of training hours for Inuit workers as share (%) of number of training hours for all employees, by basic category
TMAC
Apprenticeships Apprenticeships with the Project
Number of apprenticeships TMAC
Inuit apprentices Number of apprenticeships, as share (%) of total
Skill levels Inuit employees, by job category (skill level)
Number of Inuit employees by job category (e.g., management, professionals, skilled trades, skilled technicians, semi-skilled, unskilled)
Inuit share (%) of total number of employees by job category
TMAC
Inuit employees, by department
Number of Inuit employees by department (e.g., environment, mining, site operations, site services)
Inuit share (%) of total number of employees by department
TMAC

www.erm.com Version: C.1 Project No.: 0510704-0008 Client: TMAC Resources Inc. July 2020 Page 2-6
HOPE BAY PROJECT 2019 Socio-economic Monitoring Program
METHODS
Predicted Effect
Objective Indicator(s) Metric(s) Source(s)
Increased competition for labour
Retention of skilled workers in community roles
Number of skilled workers leaving employment in community for employment at mine
Number of workers employed in local roles immediately prior to accepting employment with Project
TMAC
Education and Training
Increased demand for education and training programs
Availability of post-secondary education
Courses related to employment in mining industry
Number of mining programs/courses offered by Nunavut Arctic College (NAC) in the Kitikmeot region
Number of mining support service programs/ courses offered by NAC in the Kitikmeot region
NAC
Participation in post-secondary education
Enrolment of Kitikmeot students in post-secondary education
Number of students enrolled in past year (NAC and other institutions), total, and by home community
Enrollment by NAC program type
KIA, GN, NAC
Investment in education
Investments in school-based initiatives
Total value ($), including financial, material and in-kind support
TMAC
Improved perceptions of education and employment benefits
Understanding of employment opportunities
Community and student outreach events
Number of community information sessions and/or career awareness sessions
Number of high school information and/or career awareness sessions
Number of sponsored student competitions Number of sponsored student achievement awards
TMAC
High school participation
Public school enrollment, by community
Number enrolled NBS, GN
Public school attendance (truancy) rate
Days attended as percent of total school days NBS, GN
High school completion
High school completion, by community
Total number of graduates NBS, GN

www.erm.com Version: C.1 Project No.: 0510704-0008 Client: TMAC Resources Inc. July 2020 Page 2-7
HOPE BAY PROJECT 2019 Socio-economic Monitoring Program
METHODS
Predicted Effect
Objective Indicator(s) Metric(s) Source(s)
Population Demographics
Increased in-migration to Kitikmeot region
Population stability Population of Kitikmeot communities
Total population, by year Annual change in population
NBS, GN
Migration of employees to/from Kitikmeot communities
Number of direct employees who have relocated to or from a Kitikmeot community in past year (including community of origin/destination)
Net migration of direct employees to LSA communities (Cambridge Bay and Kugluktuk)
Number of direct employees who have relocated to or from the Kitikmeot region in the past year (including community of origin/destination)
TMAC
Community Infrastructure and Public Services
Increased demand for housing
Housing availability Housing need, by community Public housing waitlist as percentage of available public housing stock
NHC
Approved home ownership assistance applications, by community
Number of approved Nunavut Down Payment Assistance Program (NDAP) applications
NHC
Housing status Housing status of project employees
Per housing survey NHC
Increased demand for local services
Project use of emergency services
Use of GN emergency services by the Project
Number of times emergency health services utilized TMAC
Demand for health and social services
Visits to health centres, by community
Number of annual visits Number of annual visits per capita
NBS, GN
Social assistance caseload, by community
Total social assistance average monthly caseload Per capita social assistance average monthly caseload
per capita
NBS, GN; DFS
Demand for police services
Police calls for service, by community
Total number of calls annually Annual calls per capita
RCMP
Criminal violations, by region and community
Total number Rate per capita
NBS, GN

www.erm.com Version: C.1 Project No.: 0510704-0008 Client: TMAC Resources Inc. July 2020 Page 2-8
HOPE BAY PROJECT 2019 Socio-economic Monitoring Program
METHODS
Predicted Effect
Objective Indicator(s) Metric(s) Source(s)
Individual and Community Health and Wellness
Changes to family stability
Work-life balance Ability of Inuit workers to balance employment and family and/or traditional lifestyle
Inuit employee turnover rate (refer to Employment VSEC) TMAC
Inuit workers who report resignation due to homesickness, family commitments, incompatibility with traditional lifestyle, and/or emotional stress factors
TMAC
Utilization of Employee and Family Assistance Program (EFAP)
Number of instances EFAP utilized TMAC
Changes to family spending
Household financial management
Financial management training for workers
Number of workers who attended financial management training
Number of Inuit workers who attended financial management training
TMAC
Spending decisions and lifestyle choices
Sale of alcoholic beverages, by community
Annual dollar value spent on alcoholic beverages Statistics Canada
Types of criminal violations, by region and community
Total number of impaired driving violations, and rate per capita
Total number of drug-related violations, and rate per capita Total number of assault violations, and rate per capita
NBS, GN
Changes to food security and cost of living
Country foods consumption
Consumption of country foods at TMAC camp
Number of workers who use the Country Food Kitchen at site Number of days that TMAC canteen offered country foods
TMAC
Food security Food costs, by community Cost of Nunavut Food Price Survey (NFPS) food basket ($) Inflation rate (cost of basket compared to previous year) Comparison of Kitikmeot region to Nunavut
NBS, GN
Household economic self-sufficiency
Low-income households (families and non-family persons), by community
Nunavut taxfilers with low income NBS, GN
Project employment income Refer to payroll statistics provided under Employment VSEC. TMAC 1 This information is confidential, and requires permission of the KIA and NTI prior to its release. Reporting of this indicator is conditional on TMAC receiving the necessary permissions.

www.erm.com Version: C.1 Project No.: 0510704-0008 Client: TMAC Resources Inc. July 2020 Page 2-9
HOPE BAY PROJECT 2019 Socio-economic Monitoring Program
METHODS
For new or modified SEMP indicators there is a lack of historical data and, therefore, only the most recent observations are provided. This affects consistency of how data for various indicators are reported throughout this document and reduces the possibility for cross-comparison. Going forward and subject to availability, those indicators will be updated annually.
2.2.1 Quantitative Data
Where available, quantitative data are reported and analyzed to investigate changes in socio-economic characteristics over a given time period. Where relevant, data are also used to identify potential or probable links with the Project.
Trend Analysis
Data are statistically evaluated to identify trends. Specific analyses are considered based on each particular data set, with the goal of removing the influence of outliers and focusing on meaningful trends and patterns.
Where trends or specific changes are identified, they are considered in the context of the Project to determine the potential for a cause-and-effect relationship. This includes a review of the Project’s employment numbers, procurement expenditures, training records, and other activities which could directly or indirectly alter the affected VSEC. TMAC expects that correlation and causation may not always be clear. However, the company is committed to identifying potential interactions for discussion with the SEMWG and KitSEMC, and to implementing further study or mitigative actions if warranted.
Community statistics may be influenced by a variety of factors unrelated to the Project, including changes in local resources (e.g., increasing/decreasing social services, healthcare, education, or policing staff), policy directions (e.g., heightened commitment to enforce alcohol regulations), program outcomes (e.g., promoting use of health clinic), and other initiatives. Notable changes, trends, or outliers will be explained where possible.
Industry Averages
Where available, Project data is compared to relevant industry averages. Comparative analysis notes potential disparities in data sources, collection, reliability, or other factors.
2.2.2 Qualitative Information
No qualitative indicators are included in the SEMP at this time. However, qualitative information will be used to evaluate and interpret quantitative data and trends. This may include reports and observations from TMAC, the KIA, the GN, CIRNAC, KitSEMC members, hamlets, and local service providers regarding activities and events in the study communities.
TMAC may also incorporate qualitative information in the absence of quantitative data—for example, if annual data for the above indicators is discontinued or delayed—in an attempt to fill the data gap.
2.2.3 Charts, Graphs, and Infographics
To aid the interpretation and analysis of monitoring data, the reports incorporates visual representations including charts, graphs, and infographics. Visuals are used to highlight key trends and features, and to compare and contrast changes over time.

www.erm.com Version: C.1 Project No.: 0510704-0008 Client: TMAC Resources Inc. July 2020 Page 2-10
HOPE BAY PROJECT 2019 Socio-economic Monitoring Program
METHODS
2.2.4 Community Data Challenges
Communities in Nunavut are small and there are inherent data collection and interpretation challenges. This impacts the extent to which community-level data can be meaningfully provided and interpreted. Some of the main challenges include the following:
Labour force surveys and other regular publications by Statistics Canada typically only include larger cities and metropolitan areas. Iqaluit is typically the only community in Nunavut to be represented in these reports. Therefore, there are generally less socio economic data (annual or more frequently) compared to larger communities in Canada.
The Kitikmeot communities are small, ranging from approximately 900 in Kugaaruk to 1,800 in Cambridge Bay in 2016. Due to confidentiality concerns, statistics are regularly masked (i.e., not disclosed) to protect the identity of individuals within small sub-groups. TMAC’s data about the workforce is similarly protected where confidentiality concerns are identified.
Also reflecting their small size, community-level data (where it is available) is often subject to challenges in determining statistically significant changes. Some datasets from previous years show marked fluctuations in terms of percent-change, although real numbers may be small.
Because the number of individuals involved in providing community-based services is also small, challenges can exist from the disproportionate effects of staff turnover, staff vacancies and individual staff choice in fulfilling roles and responsibilities (such as data collection) that can affect tracking community trends. Whether detected change is real can be more a question of whether there are personnel in the positions, how a public or community service was delivered (i.e., compliance effort), or variations in data collection effort.

www.erm.com Version: C.1 Project No.: 0510704-0008 Client: TMAC Resources Inc. July 2020 Page 3-1
HOPE BAY PROJECT 2019 Socio-economic Monitoring Program
ECONOMIC DEVELOPMENT
3. ECONOMIC DEVELOPMENT
3.1 Growth of Revenues to Inuit Organizations
3.1.1 Predictions
TMAC will make payments to the KIA and the Nunavut Tunngavik Incorporated (NTI) consisting of royalties, exploration and production lease rents, land tenure payments, water compensation, and the Inuit Impact and Benefit Agreement (IIBA) implementation payments. Also, as specified in the IIBA between the KIA and TMAC, TMAC will make payments to the KIA for training and business development. It is predicted that these payments will result in growth of revenue to Inuit-owned organization.
3.1.2 Results
In 2018, TMAC made payments totalling $2.6 million to the KIA and another $7.2 million to the NTI. An estimated $38,400 was paid to the Kitikmeot Corporation. KIA also indirectly benefits through the revenue of its affiliated businesses that provide services to the Project.
In 2019, TMAC made payments totalling $3.8 million to the KIA and another $7.0 million to the NTI.
3.1.3 Interpretation
The mandate of the KIA is to defend, preserve, and promote social, cultural, and economic benefits for Kitikmeot Inuit, while the NTI ensures that the federal and territorial governments fulfill obligations under the Nunavut Agreement with respect to the management of land, water, and wildlife. The Kitikmeot Corporation is responsible for business development activities, employment and training.
In 2018, TMAC made payments of $9.8 million to the KIA and NTI, while in 2019 those payments totalled $10.8 million – representing a 10% increase. These contributions facilitate greater economic activity than would be possible without the Project and help to promote the social, economic, and cultural well-being of Inuit in Nunavut.
3.2 Growth in Revenues to the Government of Nunavut
3.2.1 Predictions
TMAC will pay the Nunavut Payroll Tax, the Nunavut Petroleum Tax, and the Nunavut Property Tax, which in turn will increase revenues to the GN.
3.2.2 Results
In 2018, TMAC made payments totaling $1.3 million to the GN while in 2019 TMAC paid $1.6 million to the GN (of that, payroll taxes to Nunavut totaled $0.6 million in 2019). Additionally, $590,000 was paid in property taxes in 2018.
Additional benefits were from the purchase of diesel fuel by the Project, with tax paid at the wholesale level. In 2018, $79.4 million was spent on diesel and jet fuel, spare parts, and other consumables, compared to $66.3 million in 2017 (TMAC 2018).Information for 2019 was not available at the time of writing this report as it is pending the release of 2019 Year End Financial Statements.
3.2.3 Interpretation
The GN directly received $1.6 million in taxes from the Project, with additional benefits from the collection of Nunavut Petroleum Tax from the wholesale purchase of diesel fuel by the Project (specific dollar value

www.erm.com Version: C.1 Project No.: 0510704-0008 Client: TMAC Resources Inc. July 2020 Page 3-2
HOPE BAY PROJECT 2019 Socio-economic Monitoring Program
ECONOMIC DEVELOPMENT
unknown). The mandate of the GN is to serve as a public government for the Nunavut territory and provide representation and services for Nunavummiut. Payments to the GN help support that mandate and promote the social, economic, and cultural well-being of Inuit in Nunavut.
3.3 Growth in Mining Industry Expenditures
3.3.1 Predictions
Project spending, including Project capital expenditures (CAPEX) and operating expenditures (OPEX), will increase mining industry expenditures in Nunavut and contribute to the economic growth and development in the Kitikmeot region.
3.3.2 Results
Project expenditures have been increasing with the level of on-site activities. CAPEX totalled $72.7 million in 2017, $86.9 million in 2018, and $77.1 million for Q1-Q3 2019 (CAPEX for Q4 not yet available at time of reporting; TMAC 2020).
In 2018, TMAC spent a total of $220.1 million (consisting of costs of production and sales, general and administrative costs, and other accounting losses/expenses) compared to $81.7 million in 2017 (Table 3.3-1). Data for 2019 is available for Q1-Q3 (Table 3.3-1). Spending over the first three quarters of 2019 totalled $190.0 million.
Table 3.3-1: Project Expenditures (Million Canadian Dollars)
2017 2018 2019 (Q1-Q3)
Cost of Sales
Production costs $56.4 $118.6 $102.3
Royalties and selling expenses $1.4 $4.0 $5.2
Depreciation $11.0 $49.6 $52.0
$68.8 $172.2 $159.5
General and Administrative Costs
Salaries and wages $9.2 $7.8 $6.2
Share-base payments $3.2 $6.7 $4.4
Other corporate $3.1 $2.9 $3.1
$15.5 $17.4 $13.7
Other Expenses/Losses (net income) ($2.6) $30.5 $16.8
Total Project Expenditures $81.7 $220.1 $190.0
Source: TMAC (2019a, 2019b)
3.3.3 Interpretation
Project expenditures reached $220.1 million in 2018, representing an increase of 169% over 2017. For 2019, audited financial year end statements were not available at the time of writing the report. Quarterly statements suggest that Project spending for Q1-Q3 totalled $190.0 million. Project expenditures support direct employment opportunities, procurement of goods and services from businesses, as well as numerous spinoff opportunities in the Kitikmeot region.

www.erm.com Version: C.1 Project No.: 0510704-0008 Client: TMAC Resources Inc. July 2020 Page 3-3
HOPE BAY PROJECT 2019 Socio-economic Monitoring Program
ECONOMIC DEVELOPMENT
3.4 Effects Management and Mitigation Table 3.4-1 lists the programs and measures designed to mitigate and manage potential effects related to economic development.
Table 3.4-1: Economic Development Management and Mitigation Measures
Program/ Mitigation Measure
Purpose/Description/Outcome
IIBA The IIBA sets out principles and methods to, among other purposes, maximize Inuit training, employment and business opportunities arising from the operation of the Project, and provide a mechanism through which effective communication and cooperation can take place. Key features of the IIBA include provisions for, among others: setting annual and long-term Inuit training targets; setting annual Inuit employment targets; first opportunity to Kitikmeot Inuit residents for employment, followed by non-resident Inuit; establishment and administration of a Training and Education Fund; promotion of Inuit content in procurement, including requirement to engage Kitikmeot Qualified Businesses for certain types of goods and services; and establishment, under certain conditions, of a Business Development Fund.
TMAC Liaison The TMAC Liaison works with the appropriate TMAC department to, among other responsibilities, assist TMAC to maximize Kitikmeot Qualified Business procurement by identifying businesses interested in procurement opportunities, considering opportunities for capacity building and development, and assisting Kitikmeot Qualified Businesses to access available business opportunities.
Community Involvement Plan
TMAC maintains communications with Kitikmeot communities and shares information to assist in the development of collaborative adaptive management measures, should unanticipated impacts arise and mitigation be required.
Communication TMAC communicates the Project’s schedule to ensure that local governments, local and regional businesses, and other interested institutions/organizations are aware of Project activities as well as any opportunities that can contribute to business growth in the Kitikmeot region.

www.erm.com Version: C.1 Project No.: 0510704-0008 Client: TMAC Resources Inc. July 2020 Page 4-1
HOPE BAY PROJECT 2019 Socio-economic Monitoring Program
CONTRACTING AND BUSINESS EXPENDITURES
4. CONTRACTING AND BUSINESS EXPENDITURES
4.1 Procurement Expenditures
4.1.1 Predictions
The Project will purchase goods and services from businesses in Nunavut and beyond. The provision of business contracts will support economic prosperity and create new economic opportunities.
4.1.2 Results
In 2019, TMAC spent $204.1 million on contracts with businesses from Nunavut and beyond. Of that, 60% was spent on services, 36% on materials and supplies, and 3% on corporate expenses. To compare, for 2018 TMAC spent a total of $182.5 million on contracts while in 2017 it spent $148.1 million (Table 4.1-1).
Table 4.1-1: Total Spend by Category (Million Dollars), 2017 to 2019
Category 2017 2018 2019
Total (Million Dollars) $148.1 $182.5 $204.1
Services - 60% 60%
Materials and Supplies - 36% 36%
Corporate - 3% 3%
4.1.3 Interpretation
Project procurement expenditures increased by 23% between 2017 and 2018 and by 12% between 2018 and 2019. Project expenditures continue to contribute to the economic prosperity in Nunavut and the rest of Canada.
4.2 Procurement from Nunavut Businesses
4.2.1 Predictions
The Project will provide contract and subcontract opportunities to Nunavut businesses. The provision of business contracts will support economic prosperity and create new economic opportunities.
4.2.2 Results
In 2019, TMAC awarded $91.5.0 million in contracts to Nunavut businesses, representing an increase of 35% over the previous year (Table 4.2-1). In general, an estimated 45% of the total value of contracts awarded by TMAC was awarded to Nunavut businesses in 2019.
Table 4.2-1: Contracts Awarded to Nunavut Businesses (Million Dollars), 2017 to 2019
2017 2018 2019
Number of Contracts 15 14 19
Total Value of Contracts $49.0 $68.0 $91.5
Average Value of Contracts $3.3 $4.9 $4.8
Median Value of Contracts $0.7 $2.8 $1.1
Percent of Total 33% 37% 45%

www.erm.com Version: C.1 Project No.: 0510704-0008 Client: TMAC Resources Inc. July 2020 Page 4-2
HOPE BAY PROJECT 2019 Socio-economic Monitoring Program
CONTRACTING AND BUSINESS EXPENDITURES
4.2.3 Interpretation
TMAC continues to procure an increasing share of goods and services from territorial businesses, with more than a third of total value of contracts awarded to businesses in Nunavut.
4.3 Procurement from Kitikmeot Businesses
4.3.1 Predictions
The Project will provide contract and subcontract opportunities to Kitikmeot businesses, including Kitikmeot Qualified Businesses (KQBs) and other Kitikmeot-based businesses (non-KQBs).
4.3.2 Results
In 2019, TMAC awarded 19 contracts worth $91.5 million to KQBs, this being equivalent to all contracts awarded to Nunavut businesses/Inuit owned businesses that year. No contracts were awarded to non-KQBs in 2018 or 2019 (Table 4.3-1).
Table 4.3-1: Contracts Awarded to Kitikmeot Businesses (Million Dollars), 2017 to 2019
KQB Non-KQB
2017 2018 2019 2017 2018 2019
Number of Contracts 12 14 19 3 - -
Total Value of Contracts $48.8 $68.0 $91.5 $0.2 - -
Average Value of Contracts $4.1 $4.9 $4.8 $0.06 - -
Median Value of Contracts $2.1 $2.8 $1.1 $0.04 - -
Percent of Total 33% 37% 45% 0.2% - -
4.3.3 Interpretation
Through the IIBA, TMAC has committed to engaging KQBs in the development and operation of its Doris and Madrid-Boston projects (KIA & TMAC 2015). KQBs are Inuit-owned firms that are located in the Kitikmeot region and recognized by the KIA as a business capable of doing work for TMAC. The KIA determines which Kitikmeot businesses are listed on the KQB Registry based in part on Inuit Content Components as outlined in the IIBA, and other factors KIA may determine are consistent with the KQB Engagement Objective. All other Inuit-owned firms or entities not on the registry are counted separately.
The Project has resulted in substantial business revenue for KQBs, totalling $208.3 million from 2017 to 2019. Non-KQBs benefited $163,433 in contracts in 2017; however, in 2018 no contracts were awarded to non-KQBs. Data collected for previous years is not comparable.
There is also no evidence that existing customers have lost access to necessary goods and services in the Kitikmeot communities due to Project procurement. This concern has not been raised as an issue during TMAC’s ongoing engagement, and TMAC is not aware of this being a negative impact on communities. On the contrary, the Project has contributed to an increase in business activity and capacity in the Kitikmeot region; thus, this is expected to result in improving the overall business base for existing customers. KQB and Inuit-owned firm share of and total contract spend in relation to the Project remains significant. There is no evidence of this placing a strain on regional business service capacity as a result.
In addition to the regular channels through which procurement opportunities are advertised (reaching out to specific suppliers, postings on tendering websites), TMAC also engages with businesses during the

www.erm.com Version: C.1 Project No.: 0510704-0008 Client: TMAC Resources Inc. July 2020 Page 4-3
HOPE BAY PROJECT 2019 Socio-economic Monitoring Program
CONTRACTING AND BUSINESS EXPENDITURES
contractor’s workshop hosted by the Kitikmeot Community Futures Inc. to present opportunities for sealift commitments, as well as participating in the Kitikmeot Trade Show. TMAC regularly engages with and collects feedback from Kitikmeot businesses, organizations and residents (e.g., SOAs, CEDOs, Mayors, community business organizations such as Kitikmeot Community Futures). There have been no reports of businesses not providing services to other businesses or residents due to Project-related procurement.
4.4 Procurement from Inuit Firms
4.4.1 Predictions
The Project will provide contract and subcontract opportunities to Inuit Firms, including KQBs and other non-KQBs.
4.4.2 Results
In 2019, TMAC awarded $91.5 million in contracts to Inuit businesses, representing an increase of 35% over the previous year (Table 4.4-1). In general, an estimated 45% of the total value of contracts awarded by TMAC was awarded to Inuit businesses in 2019.
Table 4.4-1: Contracts Awarded to Inuit Businesses (Million Dollars), 2017 to 2019
Inuit Owned (KQB) Other Inuit Businesses
2017 2018 2019 2017 2018 2019
Number of Contracts 12 14 19 3 - -
Total Value of Contracts $48.8 $68.0 $91.5 $0.2 - -
Average Value of Contracts $4.1 $4.9 $4.8 $0.06 - -
Median Value of Contracts $2.1 $2.8 $1.1 $0.04 - -
Percent of Total 33% 37% 45% 0.2% - -
4.4.3 Interpretation
TMAC continues to procure an increasing share of services from Inuit-owned businesses with more than a third of total spend awarded to Inuit-owned businesses. In 2018 and 2019, all purchases in Nunavut were made in the Kitikmeot from Inuit-owned firms.
4.5 Business Development
4.5.1 Predictions
The Project will provide contract and subcontract opportunities to Kitikmeot businesses and Inuit Firms. This will help existing businesses grow and expand in capacity. Also, new businesses may be created if there is demand for specific services not already available in the Kitikmeot region. This prediction is investigated for KQB and Inuit Firms in the Kitikmeot region.
4.5.2 Results
Table 4.5-1 shows the number of registered Inuit firms in the business registry maintained by NTI and the corresponding number of KQBs for each community (NTI 2020). The data was collected for 2017, 2018 and 2019. Table 4.5-2 shows the detailed registry and KQB data for 2019.

www.erm.com Version: C.1 Project No.: 0510704-0008 Client: TMAC Resources Inc. July 2020 Page 4-4
HOPE BAY PROJECT 2019 Socio-economic Monitoring Program
CONTRACTING AND BUSINESS EXPENDITURES
Kitikmeot Qualified Businesses
The overall number of KQBs was lower in 2019, compared to 2018; the community of Kugaaruk, due to the limited business base, did not have any KQBs in any of the investigated periods. The overall number of KQBs decreased by 10 (or 28%) from the previous year, with fewer KQBs in Cambridge Bay, Kugluktuk and Taloyoak.
Table 4.5-1: NTI Registered Inuit-Owned Firms and KQBs in Kitikmeot, 2017 to 2019
Category 2017 2018 2019
NTI KQB NTI KQB NTI KQB
Total 62 35 71 36 68 26
Cambridge Bay 35 20 41 20 42 16
Gjoa Haven 9 2 8 2 7 2
Kugaaruk 1 - 2 - 1 -
Kugluktuk 10 5 11 5 10 3
Taloyoak 7 3 8 3 7 1
Other (non-Kitikmeot) - 5 1 6 1 4
Source: NTI (2020), TMAC
Notes: Data for 2017, 2018 and 2019 from NTI is based on estimates extracted in March of the following year: March 2018, March 2019 and March 2020.
Table 4.5-2: Profile of Registered Inuit Firms in the Kitikmeot Region, 2019
Business Name Summary Class KQB
Kitikmeot:
Cambridge Bay
5140 Nunavut Ltd. Air Transport, expediting, freight shipping, catering and housekeeping, drilling, blasting, earthworks and earthwork construction, surface mining, underground mining, environment services, tire services, and heavy equipment maintenance.
3
5364 Nunavut Ltd. Plumbing and heating 1
923239 NWT Inc. Holding company 3
Applecross Nunavut Inc. Internet support services, web hosting, communication equipment installation, computer and network cable installation
3
Aurizon Investments Ltd. Real estate investment, residential housing complex and hotel
1
Aurora Energy Solutions Inc. Utility construction company, power line construction, maintenance, repair
3
Geotech Ekutak Ltd. Drilling – surface and subsurface 1
Go Cargo Taxi Limited Taxi and vehicle rentals 1
Hiku Projects Construction 3
Ikaluktutiak Co-operative Ltd. Store, Inns North Hotel and other hotel 2

www.erm.com Version: C.1 Project No.: 0510704-0008 Client: TMAC Resources Inc. July 2020 Page 4-5
HOPE BAY PROJECT 2019 Socio-economic Monitoring Program
CONTRACTING AND BUSINESS EXPENDITURES
Business Name Summary Class KQB
Cambridge Bay (cont’d)
Ikpik Inc. Consulting services 3
Ikuutak Earthworks & Solutions Construction surface drilling and blasting 3
Inukshuk Enterprises Ltd. Construction, cartage, garage, property management, arcade
1
Jago Services Inc. General contractor, electrical contractor, HVAC services, and plumbing and heating services and supplies
3
Kalgans Dis and Dat Inc. Convenience/retail/general store; snow clearing, vehicle rentals
1
Kalvik Enterprises Incorporated Construction, renovations, repairs, rentals 1
Kiilliniq Corporation Ltd. Property management 3
Kingaunmiut Services Ltd. Logistics, fuel, transportation, drilling and construction 1
Kitikmeot Air Ltd. Fixed wing aircraft charter service 3
Kitikmeot BBE Expediting Ltd. Expediting and Logistics 1
Kitikmeot Blasting Services Ltd. Provide explosives and explosive related services 1
Kitikmeot Camp Solutions Limited Camp catering, camp management, camp sales and rental, modular camp structures, potable wastewater treatment plant, and maintenance services
1
Kitikmeot Cementation Mining and Development Ltd.
Underground mine development and training 1
Kitikmeot Cleaning Services Janitorial cleaning and retail 3
Kitikmeot Corporation Business development 3
Kitikmeot Environmental Ltd. Soil remediation and land farming 1
Kitikmeot Expediting Services Ltd. Expediting, airport ground handling and purchasing services
3
Kitikmeot Helicopters Ltd. Helicopter contracting service 1
Kitikmeot Region Properties Inc. Real estate development 3
Kitikmeot Tire Mine Service Ltd. Supply tire and tire services and related products/services
1
Kitnuna Corporation Trade & services 3
Kitnuna Projects General contracting 3
Medic North Nunavut Ltd. Emergency medical services, medical equipment supply
3
NNL Aramark Hospitality Services Ltd. Hospitality services 1
Nuna Logistics Limited Freight hauling, open pit mining, crushing, training services, mine site services and construction, mine site infrastructure rental
1
Nuna West Mining Ltd. Site preparation and infrastructure development, construction management and site earthworks and infrastructure
1

www.erm.com Version: C.1 Project No.: 0510704-0008 Client: TMAC Resources Inc. July 2020 Page 4-6
HOPE BAY PROJECT 2019 Socio-economic Monitoring Program
CONTRACTING AND BUSINESS EXPENDITURES
Business Name Summary Class KQB
Cambridge Bay (cont’d)
Nunavut Arctic Transportation Company
Marine transportation industry 1
Nunavut Resources Corporation Exploration finance, mine-related infrastructure development, regional infrastructure development and financing, investment banking and corporate finance advisory services
3
Otokiak, Amanda Taxi services/rentals 3
Qillaq Construction Inc. Construction and supplier of construction materials, including all trades
3
Umingmak Bed & Breakfast Lodge Bed and breakfast hotel 3
Vandenbrink, Clarissa Gift baskets and event planning 3
Gjoa Haven
4660 Nunavut Ltd. Catering and housekeeping 3
Arktis Piusitippaa Incorporated Engineering, professional consulting services 1
CAP Enterprises Ltd. Expediting, infrastructure planning, construction; earthworks and earthworks construction; environmental services, and heavy equipment
1
Porter, Megal and Aglukkaq Sylvia Hotel accommodations 3
Porter, Stanley Taxi 3
Porter, Wally Renovations, general construction, vehicle rentals, property management
3
Qikiqtaq Co-operative Ltd. Store, Inns North Hotel and other hotel, POL, Post Office
2
Kugaaruk
Koomiut Co-operative Association Store, Inns North Hotel and other hotel 2
Kugluktuk
5296 Nunavut Ltd. Infrastructure planning 3
JMS Supplies Ltd. Retail sales of building supplies, residential furniture, recreational vehicles and outdoor equipment
1
Kikiak Contracting Ltd. Trade and services 1
Kitikmeot Savik Inc. Structural steel supply and installation 3
Kugluktuk Co-operative Ltd. Store, cable TV, poll 2
Metuituk, Darlene Taxi business 3
Ryfan Kitikmeot Ltd. Construction and Contracting 3
Summit Air Kitikmeot Ltd. Air charter services including rotary wing and fixed wing for cargo and passenger transportation
1
Taps Servicing Professional cleaning services 3
Tingmiak Kitikmeot Ltd. Charter cargo and passenger air service 3

www.erm.com Version: C.1 Project No.: 0510704-0008 Client: TMAC Resources Inc. July 2020 Page 4-7
HOPE BAY PROJECT 2019 Socio-economic Monitoring Program
CONTRACTING AND BUSINESS EXPENDITURES
Business Name Summary Class KQB
Taloyoak
Aqsaqniq Airways Ltd. Air transportation, charter services, and medevac 1
Aqsaqniq Ltd. Hotel and restaurant, cable, general contracting 3
Boothia Ventures Ltd. Hotel 3
Lyall Construction Ltd. Gravel hauling and general contracting 3
Matrix Kitikmeot Logistics Ltd. Camps, logistics and aviation management 1
Paleajook Co-operative Ltd. Retail, Inns North Hotel and other hotel, cable TV, Post Office
2
Pizzo-Lyall, John Charles Moving of mail, cargo, and personal effects 3
Other:
Yellowknife
Arctic Coast Enterprise Ltd. Property management, leasing of equipment 3
Kivalliq - Rankin Inlet/ Cambridge Bay
Nunami Stantec Ltd. Environmental science and engineering services 2
Baffin - Iqaluit
Toromont Arctic Ltd. Heavy equipment services and parts, supply of heavy construction equipment and power generation, including sales, service and rental
1
NEAS Group AKA Nunavut Eastern Arctic Shipping Inc.
Marine and marine transport services Marine transportation industry
1
Nunavut Sealink and Supply Inc. Marine and marine transport services 1
Source: NTI (2020), TMAC
Notes: Class 1 – 51%-75% Inuit Ownership Class 2 – 76%-99% Inuit Ownership Class 3 – 100% Inuit Ownership KQB also indicates that the business is on TMAC’s KQB list of vendors.
In 2019, while 13 KQBs were removed from the registry list compared to 2018, 3 KQBs were added. It is believed that several KQBs that were removed from the registry went out of business, while others might have failed to renew the registration.
In November 2019, two subsidiaries of Kitnuna Corporation, wholly owned by KIA/ Kitikmeot Corporation – Kitnuna Petroleum Ltd. and Kitnuna Projects Inc. – also filed for bankruptcy (A. Buchan pers. comm, Nunatsiaq News 2019b). It was known in early 2017 that Kitnuna Corporation was struggling. Kitnuna Petroleum was established in 1960s while Kitnuna Projects existed for 15 years (Nunatsiaq News 2019b).
Registered Inuit-Owned Firms in the Kitikmeot
The overall number of NTI-registered Inuit-owned firms was also lower in 2019, compared to 2018. The number of NTI-registered businesses decreased by one in each of Gjoa Haven, Kugaaruk, Kugluktuk and Taloyoak, and increased by one in Cambridge Bay.

www.erm.com Version: C.1 Project No.: 0510704-0008 Client: TMAC Resources Inc. July 2020 Page 4-8
HOPE BAY PROJECT 2019 Socio-economic Monitoring Program
CONTRACTING AND BUSINESS EXPENDITURES
The development of new businesses in Cambridge Bay in 2018 and 2019 may have been supported by direct and spinoff Project impacts (development at the Doris Mine and TMAC’s initial development activities at Madrid and Boston sites) or by other mining projects and exploration in the region.
A number of businesses provide services not explicitly related to mining but do service the mining industry. Examples include medical and safety services, expediting and logistical services, site management, catering, and janitorial services. A number of these businesses have benefitted from business opportunities associated with the Project.
4.5.3 Interpretation
The Project is believed to have had a positive effect on Kitikmeot business development. In 2018, there were 70 registered Inuit firms in the Kitikmeot region of which 30 were KQBs. However, in 2019, the number of registered Inuit firms in the Kitikmeot region decreased to 67, while the number of KQBs in the Kitikmeot region decreased to 22, with the decrease driven primarily by business closures/bankruptcies unrelated to TMAC’s operation in the Kitikmeot region.
Many businesses in the Kitikmeot region provide mining services. The development of these businesses may have been supported by the Project or by other mining projects and exploration in the region. Additionally, there are businesses whose descriptions are not explicitly related to mining that provide services to the mining industry, including: medical and safety services, expediting and logistical services, site management, catering, and janitorial services. A number of these businesses have benefitted from business opportunities associated with the Project.
4.6 Effects Management and Mitigation Table 4.6-1 lists the programs and measures designed to mitigate and manage potential effects related to contracting and business expenditures.
Table 4.6-1: Contracting and Business Expenditures Management and Mitigation Measures
Program/ Mitigation Measure
Purpose/Description/Outcome
IIBA The IIBA sets out principles and methods to, among other purposes, maximize Inuit training, employment and business opportunities arising from the operation of the Project, and provide a mechanism through which effective communication and cooperation can take place. Key features of the IIBA include provisions for, among others: promotion of Inuit content in procurement, including requirement to engage Kitikmeot Qualified Businesses for certain types of goods and services; bid preparation training program for Inuit; offering contracts open only to Kitikmeot Qualified Businesses; and establishment of a Business Development Fund to invest in building the capacity for Inuit business development in the Kitikmeot region.
TMAC Liaison TMAC Liaison works with the appropriate TMAC department to, among other responsibilities, assist TMAC to maximize Kitikmeot Qualified Business procurement by identifying businesses interested in procurement opportunities, considering opportunities for capacity building and development and assisting Kitikmeot Qualified Businesses to access available business opportunities.
Community Involvement Plan
TMAC maintains communications with Kitikmeot communities and shares information to assist in the development of collaborative adaptive management measures, should unanticipated impacts arise and mitigation be required.

www.erm.com Version: C.1 Project No.: 0510704-0008 Client: TMAC Resources Inc. July 2020 Page 4-9
HOPE BAY PROJECT 2019 Socio-economic Monitoring Program
CONTRACTING AND BUSINESS EXPENDITURES
Program/ Mitigation Measure
Purpose/Description/Outcome
Communication TMAC communicates Project’s schedule to ensure that local governments, local and regional businesses and other interested institutions/organizations are aware of Project activities as well as any opportunities that can contribute to business growth in the Kitikmeot region. TMAC:
provides assistance, feedback, information, and lead time to contractors from the Kitikmeot communities on bids and bidding policies;
requires and monitors local content plans on major bids; waives bond provisions at tender for Inuit owned businesses; provides annual business opportunities forecast; and promotes awareness of procurement opportunities within the Kitikmeot region.

www.erm.com Version: C.1 Project No.: 0510704-0008 Client: TMAC Resources Inc. July 2020 Page 5-1
HOPE BAY PROJECT 2019 Socio-economic Monitoring Program
EMPLOYMENT
5. EMPLOYMENT
5.1 Overall Employment
5.1.1 Predictions
The Project will provide a number of employment opportunities in construction and operation, including employment for on-site and off-site workers, as well as contractors. Success will be reflected by the total workforce size and effort.
5.1.2 Results
Workforce Size
Figure 5.1-1 shows the total and average number of on-site workers for TMAC and contractors. The total number of workers has been increasing with an increase in operating activities and as many as 598 workers in 2017 and 2018, and up to 760 workers in 20192. The average number of on-site workers was highest in 2019 Q4 at 306 workers, an increase of 29% over the previous year (2018 Q4). Off-site employment included three full-time positions in the Cambridge Bay office and seasonal staff, if required. Total TMAC workforce as of December 31, 2019 was 249 workers.
Workforce Effort
Project workforce effort is trending upward with a seven-fold increase over the last six years in the total annual hours worked. The average hours worked per worker was 2,033 in 2018, and 1,987 hours in 2019, both being slightly below a full-time position of 2,080 hours per year (Table 5.1-1).
Table 5.1-1: Workforce Effort by Project Employees and Contractors, 2014 to 2019
2014 2015 2016 2017 2018 2019
Total annual hours worked 195,876 295,284 697,272 815,412 1,126,932 1,333,392
Average hours per worker 1,567 1,588 1,638 1,566 2,034 1,987
5.1.3 Interpretation
Project activities resumed in April 2013 and included site maintenance, environmental compliance monitoring, and exploration work. Relative employment increased in 2014 from 2013 due to the size of the exploration program. In 2014, environmental compliance monitoring work continued. In 2015 and 2016, work at the site increased substantially with focus on a path to production. In 2017, TMAC commenced commercial production at the Doris mine. The total employment has been significantly increasing with an increase in the Project on-site activities and production. Further in 2019, activities at the Boston site, in addition to the Doris North mine operations, took place in September, October and November, further contributing to the total employment impact.
2 Workforce size and effort are calculated using monthly Hope Bay Headcount sheets that track on-site presence of Project employees (both TMAC and contractors). Those estimates also include visitors, and do not take into account employees that may be on leave or otherwise employed but not on site during a reporting period. A new system has been developed for each separate employer that will be better able to track total employment going forward.

Figure 5.1-1: Number of Project Employees and Contractors, 2013 to 2019
www.erm.com Project No.: Client: Graphics: HB-20ERM-006a0519516-0001 TMAC RESOURCES INC.
4125
7
4875
3521
58
90 99 106
146162
178167 171
199
157
234264 268 263
277294 294
306
0
91
21
135
167 177
88
134
244
278 276
406
533
488 501512
598
472
544
576598 590 591
632
702
760
Q2-3 Q4 Q1 Q2 Q3 Q4 Q1 Q2 Q3 Q4 Q1 Q2 Q3 Q4 Q1 Q2 Q3 Q4 Q1 Q2 Q3 Q4 Q1 Q2 Q3 Q4
2013 2014 2015
Num
ber o
f Pro
ject
Em
ploy
ees
and
Con
trac
tors
2016 2017 2018 2019
0
100
200
300
400
500
600
700
800
Average on Site (workers at any one time)Total on Site (individual workers)

www.erm.com Version: C.1 Project No.: 0510704-0008 Client: TMAC Resources Inc. July 2020 Page 5-3
HOPE BAY PROJECT 2019 Socio-economic Monitoring Program
EMPLOYMENT
5.2 Inuit and Kitikmeot Employment
5.2.1 Predictions
The Project will provide employment to residents of the Kitikmeot region. As stipulated in the IIBA, priority to hiring employees at the Hope Bay Project is in the following order: 1) Kitikmeot Inuit and other Nunavut Inuit residents in the Kitikmeot region; 2) all other Kitikmeot and Nunavut Inuit; 3) residents of the Kitikmeot region; and 4) all others. Success will be reflected in the workforce effort by Inuit and Kitikmeot residents and their share of total employment.
5.2.2 Results
Workforce Size
In 2019, there were as many as 63 Kitikmeot Inuit working at the Project, representing 7% to 9% of the total workforce size (Figure 5.2-1). There were also up to 15 Inuit from outside of the Kitikmeot region working at the Project, comprising on average 2% of the total workforce. Other regional workforce consisted of up to two non-Inuit Kitikmeot residents. TMAC workforce as of December 31, 2019 included 33 Inuit workers (26 Kitikmeot Inuit and 7 Kitikmeot Inuit from elsewhere), representing 13% of total TMAC workforce.
Workforce Effort
Total workforce effort by Inuit workers increased by 26% in 2019 compared to 2018, however with very similar composition (Table 5.2-1). Both in 2018 and 2019, workforce effort by Kitikmeot Inuit was 8% of total workforce effort, and 2% for Kitikmeot Inuit living elsewhere. On average, Inuit workforce effort comprised approximately 10% of the total workforce effort.
Table 5.2-1: Project Workforce Effort (Employees and Contractors), 2015 to 2019
2015 2016 2017 2018 2019
Total annual hours worked
Kitikmeot Inuit 27,204 76,920 98,376 87,552 110,220
Kitikmeot Inuit living elsewhere 5,688 12,288 14,040 24,312 29,916
Other regional workforce - - - 2,256 2,496
Average hours per worker
Kitikmeot Inuit - - - 2,009 2,082
Kitikmeot Inuit living elsewhere - - - 2,282 2,195
Other regional workforce - - - 2,256 1,770
Percent of total hours worked
Kitikmeot Inuit 9% 12% 12% 8% 8%
Kitikmeot Inuit living elsewhere 2% 2% 2% 2% 2%
Other regional workforce - - - 0.2% 0.2%
Kitikmeot Workers by Community
By community, up to 33 workers were from Cambridge Bay, 14 from Kugluktuk, 17 from Gjoa Haven, two from Kugaaruk and five from Taloyoak (Figure 5.2-2).

Figure 5.2-1: Inuit and Kitikmeot Employment (Number of Workers and Percent of Total Workforce), 2018 and 2019
www.erm.com Project No.: Client: Graphics: HB-20ERM-006b0519516-0001 TMAC RESOURCES INC.
41
5150
42 4244
47 46
3839 40
4341
47
51
47
52
48
63
57
60 59
54
57
99
6
10 9 1011
1211
1413
1413 13 13
15 1514 14
1513 13
1412
0%
2%
4%
6%
8%
10%
12%
14%
Jan Feb Mar Apr May Jun Jul Aug Sept Oct Nov Dec Jan Feb Mar Apr May Jun Jul Aug Sept Oct Nov Dec
2018 2019
0
10
20
30
40
50
60
70
Percent of Total Workforce
Num
ber
of W
orke
rs
Kitikmeot InuitInuit Living Elsewhere
Kitikmeot Inuit - Percent of TotalInuit Living Elsewhere - Percent of Total
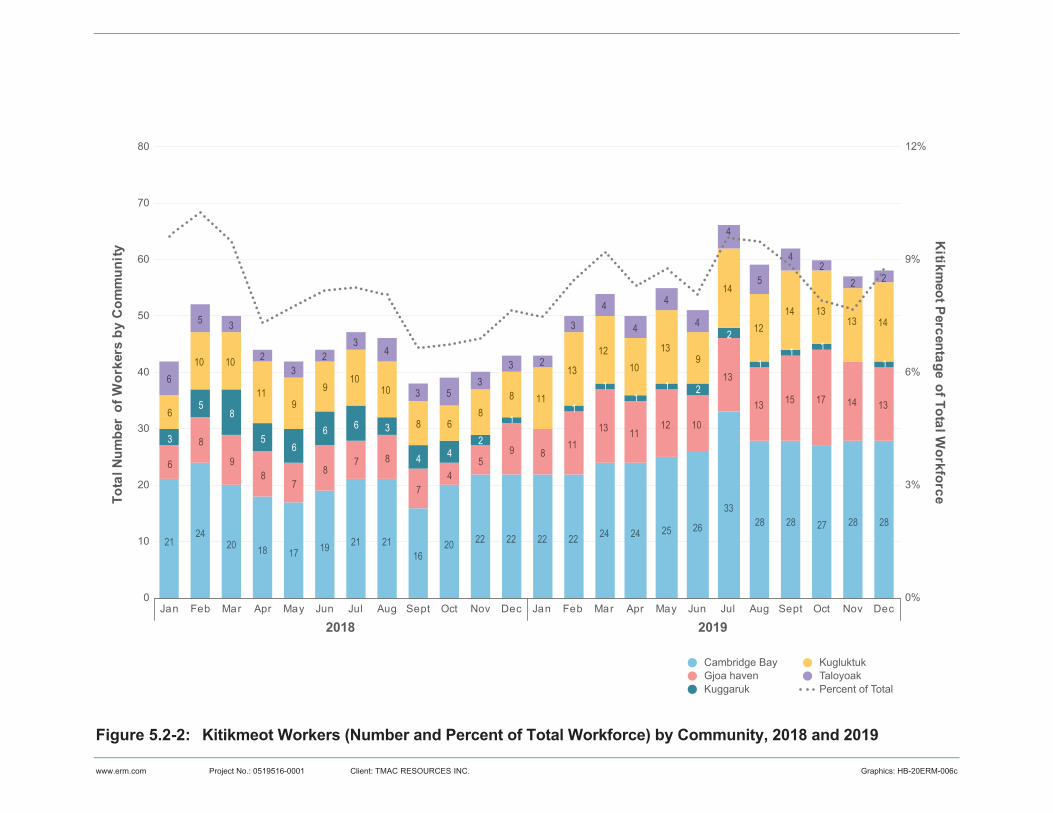
Figure 5.2-2: Kitikmeot Workers (Number and Percent of Total Workforce) by Community, 2018 and 2019
www.erm.com Project No.: Client: Graphics: HB-20ERM-006c0519516-0001 TMAC RESOURCES INC.
Gjoa havenCambridge Bay
TaloyoakKugluktuk
Kuggaruk Percent of Total
2124
20 18 17 19 21 2116
20 22 22 22 22 24 24 25 26
3328 28 27 28 28
6
8
98
78
7 8
74
59 8
1113 11
12 10
13
13 15 17 14 13
3
58
56
6 6 3
4 42
11
11
1 2
2
11 1
1
6
10 10
119
910
10
8 68
8 11
13
1210
139
14
1214 13
13 14
6
5 3
23
23
4
3 53
3 2
3
4
4
4
4
4
5
42
2 2
0%
3%
6%
9%
12%
0
10
20
30
40
50
60
70
80
Kitikm
eot Percentage of Total WorkforceTo
tal N
umbe
r of
Wor
kers
by
Com
mun
ity
Jan Feb Mar Apr May Jun Jul Aug Sept Oct Nov Dec Jan Feb Mar Apr May Jun Jul Aug Sept Oct Nov Dec
2018 2019

www.erm.com Version: C.1 Project No.: 0510704-0008 Client: TMAC Resources Inc. July 2020 Page 5-6
HOPE BAY PROJECT 2019 Socio-economic Monitoring Program
EMPLOYMENT
5.2.3 Interpretation
As affirmed by the IIBA, TMAC is committed to maximize Inuit employment (KIA & TMAC 2015).
In 2018, there were as many as 51 Kitikmeot Inuit working at the Project, representing 7% to 10% of the total workforce size, while in 2019 there were up to 78 Inuit working a the Project, representing 9% to 12% of the total workforce.
In the mining industry, Indigenous peoples are often employed in unskilled and semi-skilled positions. This is also confirmed by collected data for Hope Bay (see Section 5.9). Key barriers to employment include gaps in education and lack of work-related experience both of which make it difficult for potential applicants to meet job requirements for more senior roles. Other barriers to employment include requirement of a criminal record check, lack of motivation, fly-in/fly-out operations that require potential employees to be away from families and traditional activities, and barriers to educational attainment. Related barriers to educational attainment can include low high school attendance, and the need to leave their home community to pursue trades or other post-secondary education.
As noted in the Madrid-Boston Project Final Environmental Impact Statement (TMAC 2017), low high-school attendance can be attributed to:
Lack of legislated or enforceable requirement for children and youth to attend school until a specific age.
Limited encouragement to attend school due to distrust in the school system (colonization, residential schools).
Limited child care services for parents, including teenage parents.
Poverty and struggle to meet basic needs (e.g. food, housing).
Limited employment opportunities in communities, contributing to low motivation for education.
Further, the opportunity to take and pass the trades entrance exams can be a barrier to prospective apprentices, as pre-trades courses and entrance exams are typically conducted in Rankin Inlet, where Nunavut’s only dedicated trades school is located. Within the communities, efforts are sometimes made to provide pre-trades course and administer exams. However, as described in Section 6.1, those opportunities are limited, and the need to leave the community remains a significant barrier to education for many people (TMAC 2017).
Substance abuse continues to be a barrier for some Inuit in obtaining jobs at Hope Bay. Although the test used during required pre-employment medical testing to determine substance use has been changed to verify shorter-term use by a candidate, a small but significant proportion of Inuit candidates continue to test positive.
TMAC continues to engage with the KIA, the SEMWG and the Kitikmeot SEMC to collectively address these longstanding and complex barriers to employment. TMAC has been successful in engaging Inuit as part of the Project workforce and will continue its efforts to increase the share of Inuit employment. Some contractors have employed a smaller proportion of Inuit, and TMAC expects that they will significantly improve employment of Inuit. Through the provisions of the IIBA regarding the use of KQBs, it is expected that the employment of Inuit by contractors will increase.
5.3 Gender Equity
5.3.1 Predictions
TMAC is committed to gender equality. Women will be encouraged to enter into the non-traditional role of working in the mining sector. Success will be reflected in the workforce effort by women and Inuit women and their share of total employment.
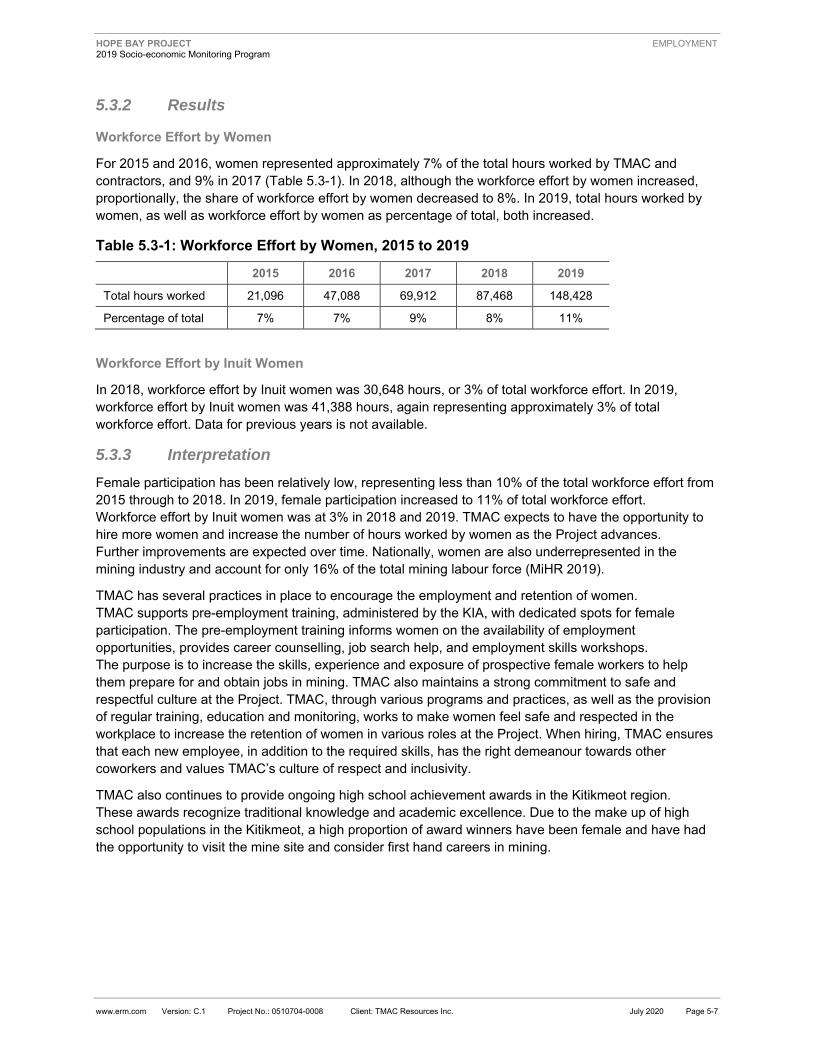
www.erm.com Version: C.1 Project No.: 0510704-0008 Client: TMAC Resources Inc. July 2020 Page 5-7
HOPE BAY PROJECT 2019 Socio-economic Monitoring Program
EMPLOYMENT
5.3.2 Results
Workforce Effort by Women
For 2015 and 2016, women represented approximately 7% of the total hours worked by TMAC and contractors, and 9% in 2017 (Table 5.3-1). In 2018, although the workforce effort by women increased, proportionally, the share of workforce effort by women decreased to 8%. In 2019, total hours worked by women, as well as workforce effort by women as percentage of total, both increased.
Table 5.3-1: Workforce Effort by Women, 2015 to 2019
2015 2016 2017 2018 2019
Total hours worked 21,096 47,088 69,912 87,468 148,428
Percentage of total 7% 7% 9% 8% 11%
Workforce Effort by Inuit Women
In 2018, workforce effort by Inuit women was 30,648 hours, or 3% of total workforce effort. In 2019, workforce effort by Inuit women was 41,388 hours, again representing approximately 3% of total workforce effort. Data for previous years is not available.
5.3.3 Interpretation
Female participation has been relatively low, representing less than 10% of the total workforce effort from 2015 through to 2018. In 2019, female participation increased to 11% of total workforce effort. Workforce effort by Inuit women was at 3% in 2018 and 2019. TMAC expects to have the opportunity to hire more women and increase the number of hours worked by women as the Project advances. Further improvements are expected over time. Nationally, women are also underrepresented in the mining industry and account for only 16% of the total mining labour force (MiHR 2019).
TMAC has several practices in place to encourage the employment and retention of women. TMAC supports pre-employment training, administered by the KIA, with dedicated spots for female participation. The pre-employment training informs women on the availability of employment opportunities, provides career counselling, job search help, and employment skills workshops. The purpose is to increase the skills, experience and exposure of prospective female workers to help them prepare for and obtain jobs in mining. TMAC also maintains a strong commitment to safe and respectful culture at the Project. TMAC, through various programs and practices, as well as the provision of regular training, education and monitoring, works to make women feel safe and respected in the workplace to increase the retention of women in various roles at the Project. When hiring, TMAC ensures that each new employee, in addition to the required skills, has the right demeanour towards other coworkers and values TMAC’s culture of respect and inclusivity.
TMAC also continues to provide ongoing high school achievement awards in the Kitikmeot region. These awards recognize traditional knowledge and academic excellence. Due to the make up of high school populations in the Kitikmeot, a high proportion of award winners have been female and have had the opportunity to visit the mine site and consider first hand careers in mining.

www.erm.com Version: C.1 Project No.: 0510704-0008 Client: TMAC Resources Inc. July 2020 Page 5-8
HOPE BAY PROJECT 2019 Socio-economic Monitoring Program
EMPLOYMENT
5.4 Employment Income
5.4.1 Predictions
Direct personal income from the Project is expected to result in economic benefits to the Kitikmeot region. Furthermore, an equitable distribution of income among the Kitikmeot communities is desired.
5.4.2 Results
Total Payroll
Table 5.4-1 summarizes TMAC payroll for 2015 to 2019 for all Kitikmeot-based and on-site employees (IIBA and non-IIBA), as well as Inuit workers (Kitikmeot residents). Note that this excludes TMAC payroll for Yellowknife and Toronto based employees, as well as payroll of on-site contractors. As evident, total payroll substantially increased with the commencement of Project production, supporting the financial security of Project workers. In 2019, total payroll reached $30.8 million (representing an increase of 40% over the previous year). Of that, $2.5 million was paid to Inuit workers.
Table 5.4-1: Total TMAC Payroll (Kitikmeot-based and On-site, Million Dollars), 2015 to 2019
2015 2016 2017 2018 2019
TMAC Payroll $1.3 $5.1 $15.5 $22.0 $30.8
Payroll for Inuit Workers $0.6 $0.7 $1.4 $1.9 $2.5
Source: A. Buchan, pers. comm.
Payroll by Kitikmeot Community
Data by community are not reported for 2013 to 2016 because of the need to protect confidentiality; however, the majority of direct employment income earned in the Kitikmeot communities was by Cambridge Bay residents, followed by Kugluktuk. For 2017 and 2018, data are separately reported for Cambridge Bay, Kugluktuk, the eastern communities (Gjoa Haven, Taloyoak and Kugaaruk), as well as for Inuit that are not residents of Nunavut (Table 5.4-2). For 2019, income data was only available for all Kitikmeot Inuit (not by community) and other Inuit.
Table 5.4-2: Total TMAC Payroll for Inuit Employees by Community, 2017 to 2019
Community 2017 2018 2019
Cambridge Bay $748,000 $763,300 N/A
Kugluktuk $220,000 $273,000 N/A
Rest of Kitikmeot $173,000 $347,000 $1,824,897*
Outside Kitikmeot $257,000 $564,000 $729,416
Total $1,398,000 $1,947,300 $2,554,313
Note: N/A – Data not available. *Data for the entire Kitikmeot Region.
5.4.3 Interpretation
Total TMAC payroll continues to provide substantial personal income benefits to employees. The payroll estimate provided here excludes on-site contractors. In 2015 and 2016, there was significant use of contractors for construction, which resulted in a larger share of total Project payroll benefits being realized through contractors; the exact amount of income including contractors, however, is unknown. With the

www.erm.com Version: C.1 Project No.: 0510704-0008 Client: TMAC Resources Inc. July 2020 Page 5-9
HOPE BAY PROJECT 2019 Socio-economic Monitoring Program
EMPLOYMENT
start of operation in 2017, the share of contractor employment decreased as the number of direct TMAC employees increased. The Project makes significant contributions to incomes in the Kitikmeot region, increasing considerably from previous years with the start of operation. In 2019, total income increased by 40% over the previous year, while income paid to Inuit workers increased by 31% - this increase in income reflects an increase in total and Inuit workforce effort by TMAC employees at Hope Bay.
5.5 Employee Retention
5.5.1 Predictions
Some workers and their families may find rotational employment stressful, leading to termination of employment (voluntary turnover). Low turnover rates for non-Inuit and Inuit employees are desired.
5.5.2 Results
Employee turnover rate is calculated as the number of permanent employee terminations divided by the number of permanent employees at the end of the period. Data for 2017 and 2018 are provided by quarter, while turnover rates for 2019 are provided for the year. Annual turnover rate for all employees was 35% in 2017 and 17% in 2018. For Inuit employees, it was 105% for 2017 and 43% for 2018. For 2019, turnover rate for all permanent employees was 26% while it was 35% for Inuit employees (Table 5.5-1). Further, in 2019, the turnover rate was 22% for non-Inuit males and 3% for non-Inuit females.
Table 5.5-1: Turnover Rate for All Employees and for Inuit Employees, 2017 to 2019
2017 2018 2019
Q1 Q2 Q3 Q4 Overall Q1 Q2 Q3 Q4 Overall Overall
All Permanent Employees
7% 10% 7% 12% 35% 6% 6% 4% 4% 17% 26%
Inuit Employees 11% 45% 24% 32% 105% 9% 8% 12% 13% 43% 35%
Note: Data includes only TMAC employees.
5.5.3 Interpretation
Turnover rate in the mining industry averages at 10%, with 5% representing terminations and layoffs, 3% representing voluntary turnover and 2% representing retirement (MiHR 2017). However, remote mining operations experience turnover higher than industry average due to the remote and rotational nature of the work. Turnover rates for Inuit workers tend to be higher; however, there was an improvement in 2019. Turnover rate for all employees increased in 2019. Challenges in employee retention in the mining industry are not uncommon for remote camps with rotational schedules and are often attributed to the remoteness of the mine and the need of long commute, as well as emotional stress resulting from being away from family and friends.
TMAC was able to successfully reduce the turnover rates of Inuit workers over the last three years. The programs and measures that help to reduce employee turnover rates include:
developing career plans for each employee
monitoring compensation rates and offering competitive compensation to retain workers
providing HR services on-site
providing a competitive medical benefit program
engaging with workers when off-shift/off-site

www.erm.com Version: C.1 Project No.: 0510704-0008 Client: TMAC Resources Inc. July 2020 Page 5-10
HOPE BAY PROJECT 2019 Socio-economic Monitoring Program
EMPLOYMENT
maintaining frequent and effective communications with employees to continue implementation of measures to retain workers in their roles
providing support for social activities while on-site to engage workers after hours
providing IIBA training and a deeper understanding of the operating business, and
providing cultural support and cultural orientation undertaken by all staff and offered on continuous basis
5.6 Worker Health and Safety
5.6.1 Predictions
Project-related workplace accidents measured as lost time incidents and utilization of site medic should be minimal in number and severity.
5.6.2 Results
Lost Time Incidents
Number of lost time incidences and the lost workday incident rate are shown in Table 5.6-1. The number of lost time incidents was highest in 2017 with six incidents and the highest incident rate of 97.9. In addition to lost time incidents, there were seven modified work days in 2017. In 2018 and 2019, there was only one lost time incident each year.
Table 5.6-1: Hope Bay Project Lost Time Incidences, 2014 to 2019
Year Number of Lost Time Incidences
Total Lost Time (days)
Lost Workday Incident Rate
2014 3 58 59.2
2015 0 0 0.0
2016 1 1 0.3
2017 6 399 97.9
2018 1 68 12.1
2019 1 N/A 0.1
Note: Lost work incident rate is the number of lost workday cases times 200,000 divided by hours worked; it returns the number of days lost from work due to work related injury or illness for every 100 employees. N/A – Data not available.
Utilization of Site Medic
In 2019, there were 76 injuries that required medical or first aid, representing a slight increase over previous years (Table 5.6-2).
5.6.3 Interpretation
The number of lost time incidents was highest in 2017 at six, decreasing to one incident in 2018 and 2019. In 2019, there was a large number of visits to the site medic. These visits were not only due to injuries, which were relatively low in number, but associated with a broad engagement of the medics (for health information, consultations, etc.).
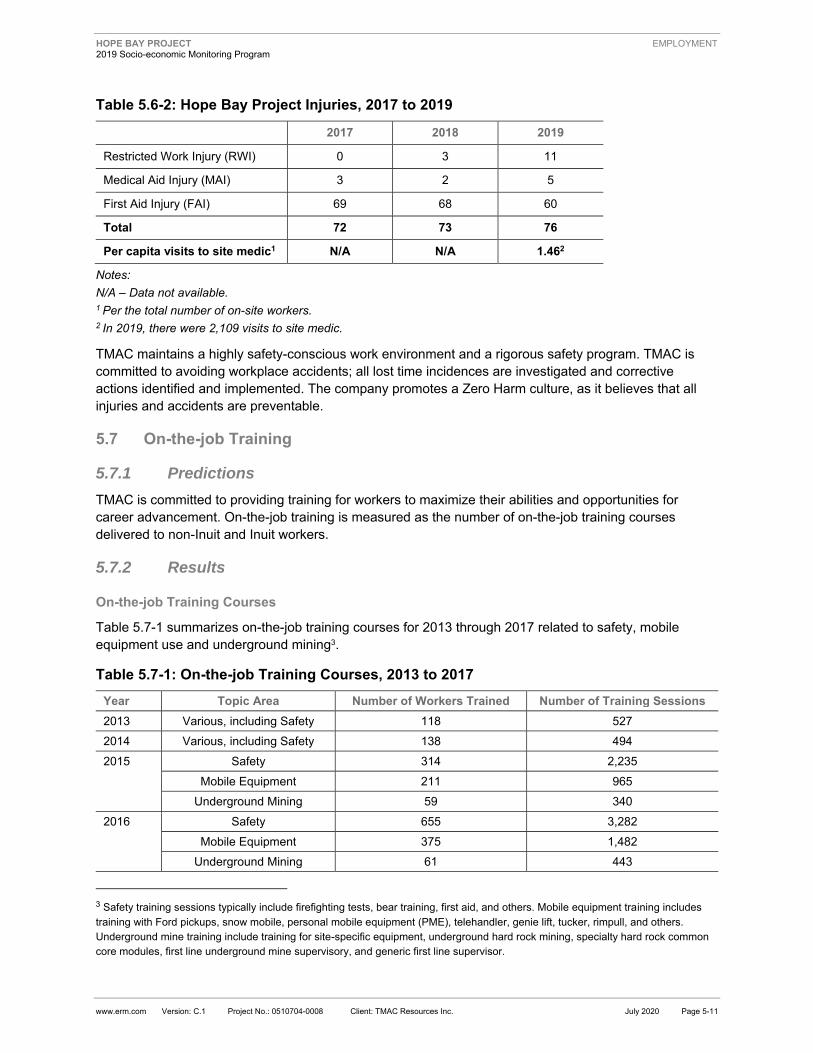
www.erm.com Version: C.1 Project No.: 0510704-0008 Client: TMAC Resources Inc. July 2020 Page 5-11
HOPE BAY PROJECT 2019 Socio-economic Monitoring Program
EMPLOYMENT
Table 5.6-2: Hope Bay Project Injuries, 2017 to 2019
2017 2018 2019
Restricted Work Injury (RWI) 0 3 11
Medical Aid Injury (MAI) 3 2 5
First Aid Injury (FAI) 69 68 60
Total 72 73 76
Per capita visits to site medic1 N/A N/A 1.462
Notes: N/A – Data not available. 1 Per the total number of on-site workers. 2 In 2019, there were 2,109 visits to site medic.
TMAC maintains a highly safety-conscious work environment and a rigorous safety program. TMAC is committed to avoiding workplace accidents; all lost time incidences are investigated and corrective actions identified and implemented. The company promotes a Zero Harm culture, as it believes that all injuries and accidents are preventable.
5.7 On-the-job Training
5.7.1 Predictions
TMAC is committed to providing training for workers to maximize their abilities and opportunities for career advancement. On-the-job training is measured as the number of on-the-job training courses delivered to non-Inuit and Inuit workers.
5.7.2 Results
On-the-job Training Courses
Table 5.7-1 summarizes on-the-job training courses for 2013 through 2017 related to safety, mobile equipment use and underground mining3.
Table 5.7-1: On-the-job Training Courses, 2013 to 2017 Year Topic Area Number of Workers Trained Number of Training Sessions 2013 Various, including Safety 118 527 2014 Various, including Safety 138 494 2015 Safety 314 2,235
Mobile Equipment 211 965 Underground Mining 59 340
2016 Safety 655 3,282 Mobile Equipment 375 1,482
Underground Mining 61 443
3 Safety training sessions typically include firefighting tests, bear training, first aid, and others. Mobile equipment training includes training with Ford pickups, snow mobile, personal mobile equipment (PME), telehandler, genie lift, tucker, rimpull, and others. Underground mine training include training for site-specific equipment, underground hard rock mining, specialty hard rock common core modules, first line underground mine supervisory, and generic first line supervisor.

www.erm.com Version: C.1 Project No.: 0510704-0008 Client: TMAC Resources Inc. July 2020 Page 5-12
HOPE BAY PROJECT 2019 Socio-economic Monitoring Program
EMPLOYMENT
Year Topic Area Number of Workers Trained Number of Training Sessions 2017 Safety 1,458 3,809
Mobile Equipment 501 1,440 Underground Mining 118 342
In 2018, TMAC delivered 7,343 hours of training to non-Inuit individuals that consisted of site general orientation, mill and mine orientation, light vehicle and mobile equipment operation, as well as general training4 (Table 5.7-2). In addition, 1,218 hours of HR-related training was delivered to Project employees. HR-related training consisted of Social Media Policy, Cultural Awareness Training, Respectful Workplace Policy Presentation, Fitness for Work Policy Presentation, and Niagara Supervisory training.
Table 5.7-2: Training Delivered by TMAC to Non-Inuit Workers in 2018 Type Number of Workers Trained Hours of Training Site Orientation 553 2,765
Mill Orientation 91 455
Mine Orientation 27 125
General 183 1,464
Light Vehicle 245 980
Mobile Equipment 177 708
WHMIS 423 846
Total 1,699 7,343
Additional training was delivered by contractors and included general, health and safety and job-specific training.
In 2019, TMAC hired three summer students (one to work in Human Resources in Cambridge Bay, and, two to work in Exploration and Environment). There was also one Nunavut Arctic College work practicum student supported in Cambridge Bay office. At the time this report was prepared, specific training data for non-Inuit workers is not available for 2019.
Inuit Participation in On-the-job Training Courses
TMAC remains committed to the ongoing training of workers in keeping with their interests to maximize their abilities and opportunities for career development. In 2018, TMAC provided 133 hours of general training to Inuit workers, 213.5 hours of health & safety related training, and 8,290 hours of work-related training5 (Table 5.7-3). Seventeen individual Career Development Plans were developed for TMAC Inuit employees. In addition, 44 hours of HR-related training was delivered to Project employees. HR-related training consisted of Social Media Policy, Cultural Awareness Training, Respectful Workplace Policy Presentation, and Fitness for Work Policy Presentation.
4 General training included Lock Out / Tag Out, Confined Space, Fall Arrest, Respirator Care and Use, and similar. 5 General training included site and mill orientation. Health and safety training included fall arrest, confine space, chemical awareness, emergency response, first aid, lock out tag out, WHMIS refresher, respirator care and maintenance, mill evacuation, and caustic review. Work-related (specific) training included: batch ILR resin, breaking reagent containing lines, cleaning magnet, conveyor safety, crushing circuit, reagent circuit, sample collection, sodium cyanide mix, site drivers, kubota light vehicle, pick up, aerial work platform, mine cat, scissor lift, aircraft ground crew, aircraft ramp, tele handler, loaders, skid steer, snow mobile, waste management, fork lift, reach stacker, aircraft de-icing, fuel transfer sealift, and overhead crane.

www.erm.com Version: C.1 Project No.: 0510704-0008 Client: TMAC Resources Inc. July 2020 Page 5-13
HOPE BAY PROJECT 2019 Socio-economic Monitoring Program
EMPLOYMENT
Table 5.7-3: Training Delivered by TMAC to Inuit Workers in 2018 (Hours)
Department General Health and Safety Specific
Electrical 7 10 290
Environment 15 0 62
Exploration 5 96 4
Maintenance 0 2 100
Mill 96 86 5,976
Site Services 10 19.5 1,808
Warehouse 0 0 50
Total 133 213.5 8,290
In 2019, TMAC provided 158 hours of general training, this included site and mill orientation; 458 hours of health and safety training and 7,754 hours of jobs-specific training (Table 5.7-4).6 In total, 8,370 hours of training were provided to Inuit workers in 2019, representing a small decrease (3%) in overall training for Inuit workers over the previous year.
Additional training was delivered by contractors and included job shadowing and job-specific training.
Table 5.7-4: Training Delivered by TMAC to Inuit Workers in 2019 (Hours)
Department General Health & Safety Specific
Mill 36 86 5,975
Other 122 372 1,779
Total 158 458 7,754
5.7.3 Interpretation
A substantial amount of on-the-job training has been provided to Project workers, including Inuit workers. Training is based on operational requirements, job needs and existing skills.
Through the IIBA, TMAC is committed to maximizing Inuit training arising from the Hope Bay Project. Training opportunities may include on-the-job technical training and skills development in a variety of areas such as underground mining, surface operations, mill processing, geotechnical, and environmental. TMAC will also allow trades training on-site. Additionally, the IIBA commits TMAC to developing Career Development Plans for all Inuit employees (KIA & TMAC 2015).
6 Health and safety training, non-mill related, included fall arrest, confine space, chemical awareness, emergency response, first aid, lock out, tag out, WHMIS refresher, resp. care & maintenance, mill evacuation, caustic review, and bear deterrent. Jobs-specific training, while consisting mostly of mill related training, also included batch ILR resin, breaking reagent containing lines, cleaning magnet, conveyor safety, crushing circuit, reagent circuit, sample collection, sodium cyanide mix, site drivers, light vehicles, heavy equipment, snow mobile, overhead crane, aircraft ground crew, aircraft ramp, aircraft de-icing, waste management, and fuel transfer sealift.
www.erm.com Version: C.1 Project No.: 0510704-0008 Client: TMAC Resources Inc. July 2020 Page 5-14
HOPE BAY PROJECT 2019 Socio-economic Monitoring Program
EMPLOYMENT
5.8 Apprenticeships
5.8.1 Predictions
There is no specific Project prediction identified as related to apprenticeship positions for non-Inuit and Inuit. However, apprenticeship position might be offered at the Project, leading to an increase in transferable skills.
5.8.2 Results
No apprenticeship roles were awarded in 2013, 2014, or 2015. However, in 2015 TMAC provided in-kind support to Geotech Egutak to deliver their diamond drill-training program. Similarly, no apprenticeships were offered in 2016 or 2017. In 2018, a warehousing apprenticeship was identified for an Inuit employee of TMAC and efforts have been made with the GN and the Government of Alberta to register this applicant. In 2019, there was one apprenticeship in Heavy Duty Mechanics with the Project held by an Inuit employee. TMAC is looking at opportunities for long-term trades training and apprenticeships at the site.
5.8.3 Interpretation
Two apprenticeship positions have been created thus far for TMAC’s direct employees – one in 2018 in Warehousing and one in 2019 in Heavy Duty Mechanics. Both apprenticeships were held by Inuit employees. Efforts have been made but have been hampered due to the challenges registering apprenticeships in other jurisdictions when the apprenticeship is not registered in Nunavut.
5.9 Skill Levels
5.9.1 Predictions
The Project is expected to provide employment opportunities to Inuit. Although it is desirable to realize employment across a range of job categories, it is expected that Inuit employment will, at least initially, be concentrated in positions reflecting current labour force experience.
5.9.2 Results
Inuit Employees by Job Category
Table 5.9-1 provides a summary of skill level of Inuit workers employed by TMAC, Kitikmeot Camp Solutions and Nuna West in 2018. All three companies achieved Inuit participation as a share of total employment. Inuit comprised 11% of all TMAC’s employees, 45% of Kitikmeot Camp Solutions employees, and 25% of Nuna West employees. Additionally, Inuit share of workforce was 9% at GeoTech and 5% at Kitikmeot Cementation; skill level information was not available for these two subcontractors.
Skill level data for Inuit workers in 2019 was available for TMAC’s direct hires only. As shown, Inuit employees held a mix of unskilled and semi-skilled positions, while being underrepresented in skilled, professional and management positions.
Inuit Employees by Department
In 2013, after the acquisition by TMAC, most employment, including Kitikmeot Inuit employment, was concentrated between two job categories: geology and environment. The distribution of TMAC employees between these two categories was approximately equal. All other employment was contract-related.
In October of 2013, two Inuit employees were permanently employed in Community and External Affairs, and the balance of TMAC Inuit employees were employed in geology and environment.

www.erm.com Version: C.1 Project No.: 0510704-0008 Client: TMAC Resources Inc. July 2020 Page 5-15
HOPE BAY PROJECT 2019 Socio-economic Monitoring Program
EMPLOYMENT
Table 5.9-1: Inuit Workers (Employees and Contractors) by Category, 2018 and 2019
Job Category
2018 2019
TMAC Kitikmeot Camp Solutions
Nuna West TMAC
Inuit Employees
Inuit Share (est.)
Inuit Employees
Inuit Share
Inuit Employees
Inuit Share
Inuit Employees
Inuit Share
Unskilled 14 100% 9 100% 0 0% 21 100%
Semi Skilled 15 65% 23 48% 0 0% 14 19%
Skilled 5 3% 2 14% 27 26% 1 1%
Professional 2 4% 0 0% 0 0% 2 3%
Management 1 2% 0 0% 0 0% 1 4%
Total 37 12% 34 45% 27 25% 39 14%
Note: Skill levels are consistent with the National Occupation Classification system for skill level classifications A through D except for the “unskilled” category. The unskilled category serves as a temporary classification as people are hired and trained on the job. Most Inuit employees in the unskilled category are part of TMAC’s Inuit Trainee Program or a similar short-term program with one of TMAC’s contractors. For 2018, estimates include all Inuit workers hired in 2018. Consequently, ‘Inuit Share’ is the share of all Inuit hired in 2018 as a percentage of all employees hired in 2018. However, it is important to note that some employees resigned or were dismissed and the resulting share of active Inuit employees, as a percentage of total employment, might be different. Additionally, the Inuit share of total employment based on the number of workers for contractors is higher than the share based on the number of hours worked, because employment tenure is typically shorter for Inuit workers compared to non-Inuit workers due to resignations or terminations. For 2019, data was only available for TMAC Inuit workers and includes active employees (as of Q4 2019).
In 2015, Inuit workers employed by TMAC and TMAC’s contractors worked mainly in site services, exploration, and environment. For site services, the number of Inuit workers varied from three to 17 at any one time; for exploration, there were between two and 14 workers; for environment, there were three or fewer workers at any one time. Inuit workers employed directly by TMAC worked in environment and External and Community Relations, with as many as five employees in environment and three in External and Community Relations in peak months.
From 2016 through to 2019, the number of Inuit workers in each job category is shown in Table 5.9-2. In 2016, most Inuit workers were in construction and site services, followed by underground mining and exploration. In 2017 and 2018, with the initiation of production, most Inuit workers were in site operations and site services, and to a lesser degree in exploration and underground mining. Further, in 2018, TMAC began recruitment for the Surface Operations Trainee positions. These include working within the Site Services, Waste Management and Power House departments. In 2019, Inuit workers at TMAC worked mostly in site services and site operations.
Table 5.9-2: Inuit Workers (Employees and Contractors) by Department, 2016 to 2019
Job Category Number of Inuit Workers Inuit Share of Total
2016 2017 2018 (est.) 2019 2018 (est.) 2019
Logistics 3 0 0 0 0% N/A
Exploration 9 1 10 4 13% N/A
Construction 23 0 0 0 0% N/A

www.erm.com Version: C.1 Project No.: 0510704-0008 Client: TMAC Resources Inc. July 2020 Page 5-16
HOPE BAY PROJECT 2019 Socio-economic Monitoring Program
EMPLOYMENT
Job Category Number of Inuit Workers Inuit Share of Total
2016 2017 2018 (est.) 2019 2018 (est.) 2019
Site Operations 7 30 15 15 8% N/A
Site Services 32 56 71 9 37% N/A
Mining 11 15 9 0 5% N/A
Environment 3 2 5 5 56% N/A
External and Community Relations 3 3 3 4 N/A N/A
Health and Safety, Other 0 0 0 0 0% N/A
Total 91 107 113 37 16% 14%
Notes: Includes all active and inactive employees. 2016, 2017 and 2018 data is based on employment for TMAC, Geotech, Nuna West, Kitikmeot Camp Supplies, and Kitikmeot Cementation; 2019 data is based on TMAC’s direct employment only. N/A-Not available.
5.9.3 Interpretation In general, Inuit employees hold a mix of unskilled, semi-skilled and skilled positions, while being underrepresented in professional and management positions. This is consistent with predictions for this indicator. By departments, Inuit employees mostly worked in site services, followed by site operations, exploration and mining.
The range of duties performed by Inuit reflects the labour force experience, the lack of training programs within the region that are available to the labour force, on-the-job training efforts by TMAC, and Project needs. TMAC expects this to evolve over time as Inuit obtain relevant knowledge, skills and experience to increasingly participate in the diverse employment opportunities available at the Project.
5.10 Retention of Skilled Workers in Community Roles
5.10.1 Predictions The Project is expected to offer relatively well-paying jobs and will require workers with skills and experience also required by other employers in local and regional communities. As a result, local and regional employers may find it difficult to find workers with the necessary skills. However, it is also predicted that those with a full-time job may be reluctant to leave it for a job at the Project because of the perceived relative short-term duration of mine work and/or the requirement to be away from home for work rotations.
5.10.2 Results There were no previous hamlet employees working for the Project in 2013 or 2014. In 2015 and 2016, there was a number of on-site contract staff with extensive heavy equipment experience, some of whom have worked for the Hamlets of Kugluktuk and Cambridge Bay on a casual basis. It is possible that some on-site contract staff may have previously been employed as drivers for hamlet water and sewer services. There were no known previous hamlet employees working for the Project in 2017. For 2013 through 2017, data on other local and regional businesses and their ability to retain workers were not collected.
Four Inuit workers hired at the Project in 2018 were previously in casual or on-call roles, mainly in Water and Sewer Departments at Hamlets. Common explanation provided for leaving employment in community for employment at the mine was under-employed (not getting enough hours of work).

www.erm.com Version: C.1 Project No.: 0510704-0008 Client: TMAC Resources Inc. July 2020 Page 5-17
HOPE BAY PROJECT 2019 Socio-economic Monitoring Program
EMPLOYMENT
In 2019, of 35 Inuit recruited by TMAC:
Twelve Inuit hires were employed in different roles at the time of being hired by TMAC – three worked for local coop retail while nine worked in roles within local Hamlets; and
Two Inuit hires were enrolled in Nunavut Arctic College programming (i.e., Adult Basic Education).
5.10.3 Interpretation The Project has a positive impact on unemployment in the Kitikmeot communities. Prior to 2018, few skilled workers left employment in their community for employment at the mine. This implies that workers hired by the Project were from the pool of unemployed. In 2018, the reason cited for leaving community employment was working less than full-time. In 2019, while 12 Inuit (or 34%) hired by TMAC that year were previously employed in other community roles, 23 Inuit (or 66%) were previously unemployed. TMAC continues to positively contribute to the employment rate of Inuit workers. Workers leaving current employment for Project-related employment can also indicate that TMAC is becoming an employer of choice within the region.
While TMAC is aware that some businesses and the hamlets lost workers to employment at the Project, most Kitikmeot hires on the Project were previously unemployed and TMAC has not recently heard of any community concerns of the Project taking workers. TMAC regularly engages with and collects feedback from Kitikmeot communities to monitor this issue. Feedback collected from previous Hamlet workers indicates that they were typically in casual positions with their Hamlet – on an “as and when work is available” basis that limited how much they could work, thus lacking job security. For example, such casual positions involved being on-call to drive a water truck if extra shifts were needed at some time or the permanent Hamlet driver was sick or on leave. Being hired by TMAC increased the amount those individuals could work and also brought them into permanent positions with greater benefits. In general, it is very rare for TMAC to hire a person who already has a full-time permanent job with a Hamlet.
5.11 Effects Management and Mitigation Table 5.11-1 lists the programs and measures designed to mitigate and manage potential effects related to employment.

www.erm.com Version: C.1 Project No.: 0510704-0008 Client: TMAC Resources Inc. July 2020 Page 5-18
HOPE BAY PROJECT 2019 Socio-economic Monitoring Program
EMPLOYMENT
Table 5.11-1: Employment Management and Mitigation Measures
Program/ Mitigation Measure
Purpose/Description/Outcome
IIBA The IIBA sets out principles and methods to, among other purposes, maximize Inuit training, employment and business opportunities arising from the operation of the Project, and provide a mechanism through which effective communication and cooperation can take place. Key features of the IIBA related to employment include provisions for, among others: setting annual Inuit employment targets; and first opportunity to resident Kitikmeot Inuit for employment, followed by non-resident Inuit.
Human Resources Plan
The Human Resources Plan supports the provisions of the IIBA and, more broadly, provides a framework for human resources management at the Hope Bay Project which ensures that the needs of all TMAC personnel are addressed throughout the life of the Project. The Plan addresses human resources, Inuit employment, education and orientation and employee wellness. In conjunction with the IIBA, specific measures include, among others: to build cultural awareness and enforce harassment policies; promote awareness of employment opportunities within Kitikmeot communities; collaborate with training institutions; develop and implement a recruitment strategy; career development plans for Inuit employees; collaborate and partner with relevant agencies and contractors to ensure skill requirements are being met; and collaborate with education and training providers to develop training programs geared toward the long-term employment of women in non-traditional occupations.
Community Involvement Plan
TMAC maintains communications with Kitikmeot communities and shares information to assist in the development of collaborative adaptive management measures, should unanticipated impacts arise and mitigation be required. TMAC also hosts a community information and career awareness session in all Kitikmeot communities at least annually. Information is provided to communities on: labour needs of the Project; skills, behaviours and qualifications required for employment at the Project; available training opportunities and educational support programs; and career opportunities in related fields.
Health and Safety Management Plan
The purpose of this plan is to detail the Health Safety and Loss Prevention (HSLP) policies and systems adopted by TMAC and to provide the framework for their implementation. The TMAC Management Team is committed to providing a healthy and safe working environment for all personnel. The objectives are: to have all personnel appropriately trained, responsible and accountable for safety management; to incorporate industry best practice for health and safety standards in the engineering, design and processes implemented at all workplaces; to comply with all relevant standards and codes of practice, and regulatory requirements; and to provide effective training, efficient communication and continuous review of occupational health and safety practices.
Communication with GN
TMAC provides the GN updated information regarding the labour force needs of the Project.

www.erm.com Version: C.1 Project No.: 0510704-0008 Client: TMAC Resources Inc. July 2020 Page 6-1
HOPE BAY PROJECT 2019 Socio-economic Monitoring Program
EDUCATION AND TRAINING
6. EDUCATION AND TRAINING
6.1 Availability of Post Secondary Education
6.1.1 Predictions
The Project could improve the availability of post-secondary education in the Kitikmeot region. Residents and youth seeking to take advantage of Project related employment could increase the demand for post-secondary education, increasing the ability of Nunavut Arctic College (NAC) to provide more courses and programs targeting employment in the mining industry.
6.1.2 Results
In the Kitikmeot region, post-secondary education is offered by the NAC, with a central campus is in Cambridge Bay. NAC is responsible for all college programming and provides programs in all Kitikmeot communities through Community Learning Centres. Programs offered through the NAC include trades, certificates and diplomas, career development, academic studies, and continuing education.
According to the published 2020-2021 program, the Kitikmeot NAC campus is not currently offering any mining-related courses (Acbayaan 2020). For the 2020-2021 school year, pre-trades courses are offered in the Kugaaruk, and apprenticeship including electrical are offered in Rankin Inlet; courses in environmental technology are offered in Iqaluit.
In 2019-2020 school year, trades courses such as electrician, underground miner certificate, and pre-apprenticeships were offered in Rankin Inlet, while diploma in environmental technology was offered in Pond Inlet and Iqaluit. Certified underground mine training curriculum was developed in partnership with Val d’Or College through the Sanatuliqsarvik Trades School. However it was noted that the delivery of all relevant mining-related programs would be based on third party funding (NAC 2018).
The Environmental Technology Program at NAC celebrated 30th anniversary in the 2017-2018 school year of uninterrupted delivery, also with a completed two year cohort that year in Cambridge Bay (NAC 2018).
6.1.3 Interpretation
There are currently no mining-related programs offered in the Kitikmeot region. However, there have been a number of short-term mine related training offerings in Nunavut. TMAC and the KIA continued efforts in 2019 to enter into a Memorandum of Understanding with the GN to regularly discuss and implement measures for priority topics such as training and education aimed at increasing Inuit employment at Hope Bay. This represents a real opportunity to influence the capabilities of those seeking work. TMAC has clearly indicated in 2019 the ongoing gap for training in the region for the top three types of jobs available at Hope Bay; underground mining, heavy equipment operation and mill processing. These have been identified to the GN and community stakeholders as the needed focus for training.
6.2 Participation in Post Secondary Education
6.2.1 Predictions
The Project could affect enrolments of Kitikmeot students in post-secondary education. The effect is predicted to be positive, with an increasing number of students choosing to enrol and graduate to then be able to take advantage of the Project-related employment opportunities.
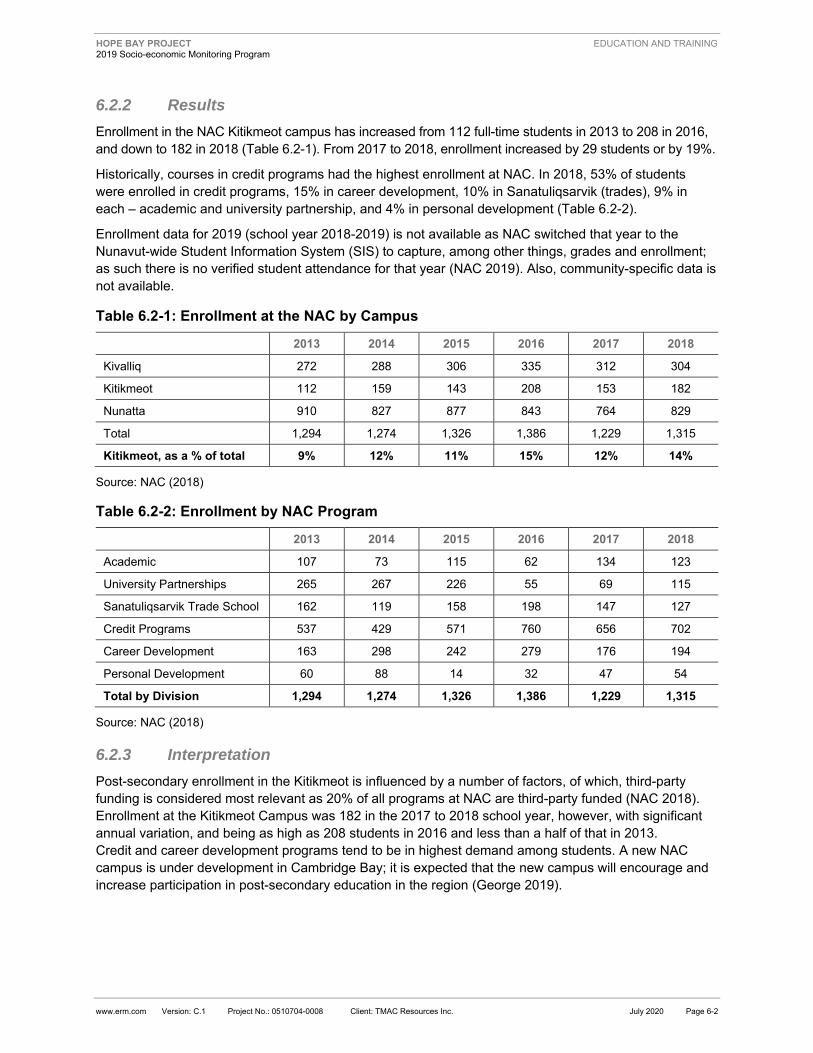
www.erm.com Version: C.1 Project No.: 0510704-0008 Client: TMAC Resources Inc. July 2020 Page 6-2
HOPE BAY PROJECT 2019 Socio-economic Monitoring Program
EDUCATION AND TRAINING
6.2.2 Results
Enrollment in the NAC Kitikmeot campus has increased from 112 full-time students in 2013 to 208 in 2016, and down to 182 in 2018 (Table 6.2-1). From 2017 to 2018, enrollment increased by 29 students or by 19%.
Historically, courses in credit programs had the highest enrollment at NAC. In 2018, 53% of students were enrolled in credit programs, 15% in career development, 10% in Sanatuliqsarvik (trades), 9% in each – academic and university partnership, and 4% in personal development (Table 6.2-2).
Enrollment data for 2019 (school year 2018-2019) is not available as NAC switched that year to the Nunavut-wide Student Information System (SIS) to capture, among other things, grades and enrollment; as such there is no verified student attendance for that year (NAC 2019). Also, community-specific data is not available.
Table 6.2-1: Enrollment at the NAC by Campus
2013 2014 2015 2016 2017 2018
Kivalliq 272 288 306 335 312 304
Kitikmeot 112 159 143 208 153 182
Nunatta 910 827 877 843 764 829
Total 1,294 1,274 1,326 1,386 1,229 1,315
Kitikmeot, as a % of total 9% 12% 11% 15% 12% 14%
Source: NAC (2018)
Table 6.2-2: Enrollment by NAC Program
2013 2014 2015 2016 2017 2018
Academic 107 73 115 62 134 123
University Partnerships 265 267 226 55 69 115
Sanatuliqsarvik Trade School 162 119 158 198 147 127
Credit Programs 537 429 571 760 656 702
Career Development 163 298 242 279 176 194
Personal Development 60 88 14 32 47 54
Total by Division 1,294 1,274 1,326 1,386 1,229 1,315
Source: NAC (2018)
6.2.3 Interpretation
Post-secondary enrollment in the Kitikmeot is influenced by a number of factors, of which, third-party funding is considered most relevant as 20% of all programs at NAC are third-party funded (NAC 2018). Enrollment at the Kitikmeot Campus was 182 in the 2017 to 2018 school year, however, with significant annual variation, and being as high as 208 students in 2016 and less than a half of that in 2013. Credit and career development programs tend to be in highest demand among students. A new NAC campus is under development in Cambridge Bay; it is expected that the new campus will encourage and increase participation in post-secondary education in the region (George 2019).

www.erm.com Version: C.1 Project No.: 0510704-0008 Client: TMAC Resources Inc. July 2020 Page 6-3
HOPE BAY PROJECT 2019 Socio-economic Monitoring Program
EDUCATION AND TRAINING
6.3 Investment in Education
6.3.1 Predictions
TMAC will support investments in school-based initiatives. Support can include the provision of financial support, school material and/or in kind support.
6.3.2 Results
Investment in school-based initiatives in 2018 included:
Career Awareness Sessions hosted in each Kitikmeot High School – $45,000.
High School Awards (cash prizes, plaques and air charter site for recipients) – $29,500.
Mining Matters events delivered in three out of five Kitikmeot High Schools – $11,000.
In 2019, TMAC budgeted financing support of $8,000 for each Kitikmeot community (total $40,000) for Mining Matters program delivery. This was, however, unspent as there were challenges scheduling sessions in schools in each community.
Information is not available for prior years.
6.3.3 Interpretation
In 2018, TMAC spent an estimated $85,500 to support school-based initiatives including Career Awareness Sessions, High School Awards, and Mining Matters events. The ability of TMAC to make investments in Education in the region has been hampered by the inability to obtain approval from local District Education Authorities and Education officials to deliver Mining Matters programming in both Gjoa Haven and Kugaaruk. In 2019, TMAC budgeted $40,000 in support of the Mining Matters programs in all five Kitikmeot communities; however, this money was not spent.
6.4 Understanding of Employment Opportunities
6.4.1 Predictions
TMAC will host community outreach events such as community information sessions or career awareness sessions in all Kitikmeot communities at least annually to encourage Inuit to attain the skills and education qualifications necessary to take advantage of Project employment opportunities.
6.4.2 Results
The first annual TMAC Community Information Tour was hosted in October and November 2017 in each of the five Kitikmeot communities. Information was provided to communities on: labour needs of the Project; skills, behaviours and qualifications required for employment at the Project; available training opportunities and educational support programs; and career opportunities in related fields (e.g., science, technology, professional services). During the 2017 Community Information Tour, TMAC also met with representatives of the GN Department of Education, Kitikmeot School Operations, and high school principals. Discussions focused on obtaining input as to how to best position future TMAC support of secondary school awards and promotion of a science based curriculum delivery. TMAC also participated in the planning the 2016 and 2017 Kitikmeot Career Fairs with representatives of the GN Department of Family Services.
In 2018, TMAC hosted five Community Information Sessions and five High School Information Sessions. TMAC also sponsored 10 student awards (ten awards: five academic, and five IQ Principles).

www.erm.com Version: C.1 Project No.: 0510704-0008 Client: TMAC Resources Inc. July 2020 Page 6-4
HOPE BAY PROJECT 2019 Socio-economic Monitoring Program
EDUCATION AND TRAINING
In 2019, TMAC delivered:
Five Career Awareness Sessions (one in each Kitikmeot community);
Two high school-specific career awareness presentations (one in Kugluktuk and one in Cambridge Bay);
Ten High School Achievement Awards (two in each Kitikmeot community);
One Cross Cultural and Life at Camp presentation to Diamond Driller training class in Cambridge Bay (attended by 10 students); and
One site visit tour to high school students (attended by 13 students).
6.4.3 Interpretation
TMAC’s involvement in community and student outreach events continues to increase with an increase in Project activities. TMAC committed to host community information and career awareness session in all Kitikmeot communities at least annually to encourage Inuit to attain the skills and education qualifications necessary to take advantage of employment opportunities.
6.5 High-School Participation
6.5.1 Predictions
The Project could affect high-school enrollment and attendance by improving the prospects of finding employment for Kitikmeot residents with a high school diploma. This effect is predicted to be positive, increasing the educational attainment in the Kitikmeot region.
6.5.2 Results
Public School Enrollment
Public school enrollment represents the number of full- and part-time students registered in school as of September 30 and include all elementary and secondary schools in Nunavut and all students enrolled in Kindergarten through Grade 12. Enrollment data are provided for the period of 2003 to 2017 for all Kitikmeot communities and the Kitikmeot region in general (Figure 6.5-1). As shown, although public school enrollment fluctuated over 2003 to 2017, enrollment increased in 2013 with continued growth through 2017, increasing by 4% for Nunavut and 11% for the Kitikmeot region. Kugaaruk experienced the highest increase in public school enrollment of 31% from 2013 to 2017, followed by Gjoa Haven at 12%, Kugluktuk and Taloyoak at 8%, and Cambridge Bay at 3%. In fact, the Kitikmeot region led the increase in public school enrollment in Nunavut. In 2017, there were 68 more students enrolled in Nunavut compared to 2016. Of that, enrollment in the Kitikmeot region increased by 71 students, while it decreased by 53 students in Qikiqtani and increased by 50 in Kivalliq (GN 2018g).
High school enrollment is only available at the regional level for 2003 through 2017 (Figure 6.5-2). While the number of students enrolled in Grade 9 through 12 varied over the investigated period, it generally increased over the last five years (note that 2015 data is not available) by 59% in Grade 9, 54% in Grade 10, 35% in Grade 11, and 36% in Grade 12 (GN 2018h).
Information for 2018 and 2019 was not available at the time of writing this report.

Figure 6.5-1: Public School Enrollment by Community, 2003 to 2017
www.erm.com Project No.: Client: Graphics: HB-20ERM-006d0519516-0001 TMAC RESOURCES INC.
Gjoa havenCambridge Bay
TaloyoakKugluktuk
Kuggaruk
426 433 420 396 397 414 389 399 420 418 422 388 421 421 433
356 379 390 368 360 356 335 331 316 323 379 405 415 399 426
256 259 266251 253 238 281 250 236 257
262 302311 313
343
372 345 354329 371 353 325
292 326 337387 404
399 421419
241 264 248268 259 252 252
255 248 246
313321
326 334338
2003
Source: GN (2018g).
2004 2005 2006 2007 2008 2009 2010 2011 2012 2013 2014 2015 2016 20170
500
1,000
1,500
2,000
2,500
Enro
llmen
t by
Com
mun
ity
Year

Figure 6.5-2: Kitikmeot Public School Enrollment by Grade, 2003 to 2017
www.erm.com Project No.: Client: Graphics: HB-20ERM-006e0519516-0001 TMAC RESOURCES INC.
Grade 11Grade 12
Grade 9Grade 10
124 127 13093
13288
117 97 102 92 99136 132
157
186 171220
214161
156
168172 177
159 125
194253 193
60 98
91
93148
123
11296
117
105106
102
105143
35
43
64
46
65
8167
69
73101
95
115
132 129
0
100
200
300
400
500
600
700
Year
Tota
l Num
ber
of S
tude
nts
2003 2004 2005 2006 2007 2008 2009 2010 2011 2012 2013 2014 2015
No dataavailable
2016 2017
Source: GN (2018h).

www.erm.com Version: C.1 Project No.: 0510704-0008 Client: TMAC Resources Inc. July 2020 Page 6-7
HOPE BAY PROJECT 2019 Socio-economic Monitoring Program
EDUCATION AND TRAINING
Public School Attendance and Truancy Rates
Public school attendance rate represents the percentage of total school days for which students attended school while public school truancy rate represents the percentage of total school days for which students had unexcused absences from school. Most recent updates on the public school attendance rate are from the 2013/2014 school year when the Kitikmeot region had an attendance rate of 58%, compared to 71% for Nunavut as a whole. Across Kitikmeot communities, Kugluktuk and Cambridge Bay had the highest attendance rate of 83%, followed by Taloyoak (70%) and Gjoa Haven (56%); attendance rate for Kugaaruk was not calculated for that year. For high school students (Grades 9 through 12) attendance rates are only available at the regional level. In 2013/2014 school year, high school attendance rate varied from a low of 55% for Grade 9 and increasing with seniority to a high of 65% for Grade 12 (GN 2015b).
Most recent public school truancy rates available at the time of writing this report are for the 2010/2011 school year. In that year, truancy rates were 25% for the Kitikmeot region, and 22% for Nunavut as a whole. For Kitikmeot communities, truancy rates were highest for Gjoa Haven (34%) and Kugluktuk (32%), followed by Taloyoak (26%), Kugaaruk (24%), and Cambridge Bay (15%). For high school students (Grade 9 through 12) truancy rates are only available at the regional level. In the 2010/2011 school year, truancy rate for Grade 9 was 35%, it was 42% for Grade 10, 36% for Grade 11 and 26% for Grade 12 (GN 2012).
6.5.3 Interpretation
With an increase in employment opportunities available to Kitikmeot residents, there appears to be a re-enforcement of the direct link between education and employment, and a positive change in school enrollment (an increase in high school enrollment). However, while high school enrollment generally increased in the Kitikmeot communities in the last number of years, due to the lack of data, it cannot be determined whether there was an improvement in the public school attendance rate or a reduction in the truancy rate.
6.6 High School Completion
6.6.1 Predictions
The Project could affect retention rates of youth in school, potentially impacting high school graduation numbers. The effect is predicted to be positive, with an increasing number of students choosing to remain in school, graduate and take advantage of the Project related employment opportunities.
6.6.2 Results
The number of secondary school graduates are summarized by community from 2001 to 2017 (Figure 6.6-1; at the time of writing, data for 2018 and 2019 have yet to be released). The number of graduates includes students who completed secondary school but excludes those who completed equivalency or upgrading programs. In the Kitikmeot region, the number of graduates fluctuated with a small number of high school graduates between 2002 and 2013, however a peak in graduation during that time period of 36 in 2008 and 30 in 2010. Since 2013, the number of graduates increased with 34 graduates in the Kitikmeot in 2014, 31 in 2015, 37 in 2016 and 36 in 2017 (GN 2017b).
Information for 2018 and 2019 was not available at the time of writing this report.
6.6.3 Interpretation
There was an increase in the number of high school graduates in the Kitikmeot communities since 2014 possibly indicating a re-enforcement of the direct link between education and employment.

Figure 6.6-1: Secondary School Graduates by Community, 2001/02 to 2016/17
www.erm.com Project No.: Client: Graphics: HB-20ERM-006f 0519516-0001 TMAC RESOURCES INC.
Gjoa havenCambridge Bay
TaloyoakKugluktuk
Kuggaruk
Year
3 3 42
4 47
4
9
5 4 4
12
4
12 12
1 12 7
10
6
11
4
5
76
3
5
6
6 7
4
3
4
1
2
6
67
15
5
7
8 6
7
34
4
1
5
12
9
9
3
94
8
13
7 8
1 11
1
2
4
1
2
1
5
41
4 3
2001/02 2002/03 2003/04 2004/05 2005/06 2006/07 2007/08 2008/09 2009/10 2010/11 2011/12 2012/13 2013/14 2014/15 2015/16 2016/170
5
10
15
20
25
30
35
40
Tota
l Num
ber
of G
radu
ates
Source: GN (2017b).
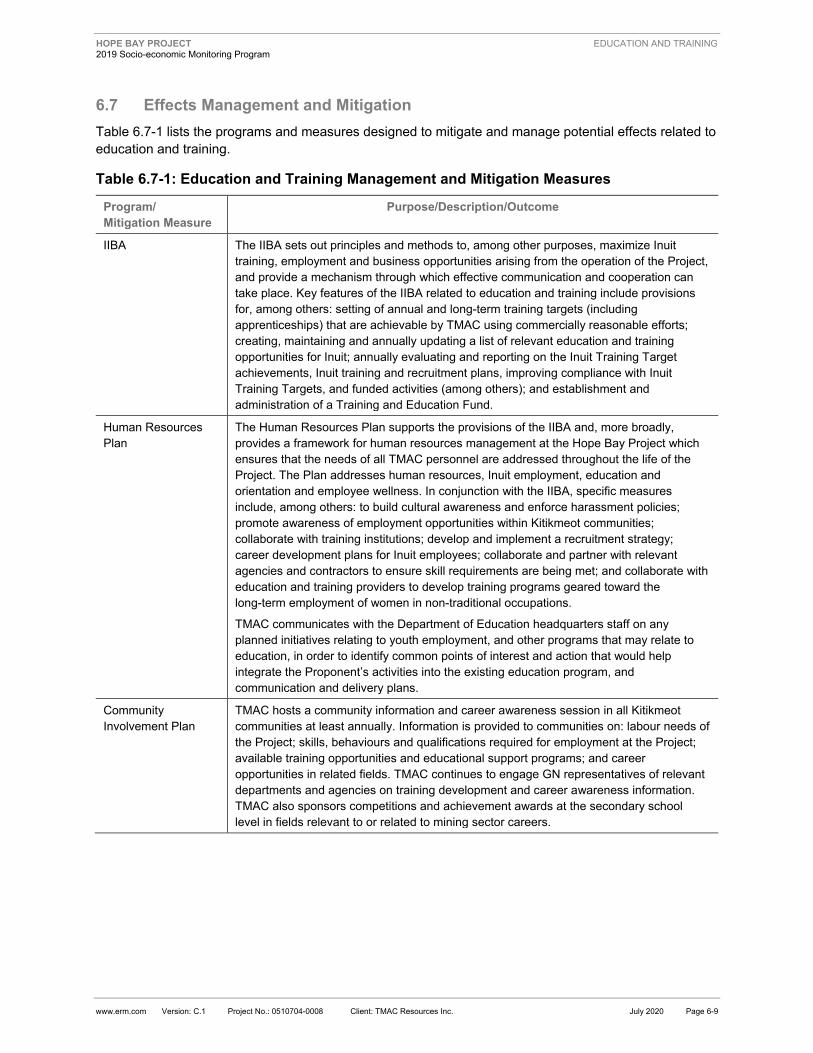
www.erm.com Version: C.1 Project No.: 0510704-0008 Client: TMAC Resources Inc. July 2020 Page 6-9
HOPE BAY PROJECT 2019 Socio-economic Monitoring Program
EDUCATION AND TRAINING
6.7 Effects Management and Mitigation Table 6.7-1 lists the programs and measures designed to mitigate and manage potential effects related to education and training.
Table 6.7-1: Education and Training Management and Mitigation Measures
Program/ Mitigation Measure
Purpose/Description/Outcome
IIBA The IIBA sets out principles and methods to, among other purposes, maximize Inuit training, employment and business opportunities arising from the operation of the Project, and provide a mechanism through which effective communication and cooperation can take place. Key features of the IIBA related to education and training include provisions for, among others: setting of annual and long-term training targets (including apprenticeships) that are achievable by TMAC using commercially reasonable efforts; creating, maintaining and annually updating a list of relevant education and training opportunities for Inuit; annually evaluating and reporting on the Inuit Training Target achievements, Inuit training and recruitment plans, improving compliance with Inuit Training Targets, and funded activities (among others); and establishment and administration of a Training and Education Fund.
Human Resources Plan
The Human Resources Plan supports the provisions of the IIBA and, more broadly, provides a framework for human resources management at the Hope Bay Project which ensures that the needs of all TMAC personnel are addressed throughout the life of the Project. The Plan addresses human resources, Inuit employment, education and orientation and employee wellness. In conjunction with the IIBA, specific measures include, among others: to build cultural awareness and enforce harassment policies; promote awareness of employment opportunities within Kitikmeot communities; collaborate with training institutions; develop and implement a recruitment strategy; career development plans for Inuit employees; collaborate and partner with relevant agencies and contractors to ensure skill requirements are being met; and collaborate with education and training providers to develop training programs geared toward the long-term employment of women in non-traditional occupations.
TMAC communicates with the Department of Education headquarters staff on any planned initiatives relating to youth employment, and other programs that may relate to education, in order to identify common points of interest and action that would help integrate the Proponent’s activities into the existing education program, and communication and delivery plans.
Community Involvement Plan
TMAC hosts a community information and career awareness session in all Kitikmeot communities at least annually. Information is provided to communities on: labour needs of the Project; skills, behaviours and qualifications required for employment at the Project; available training opportunities and educational support programs; and career opportunities in related fields. TMAC continues to engage GN representatives of relevant departments and agencies on training development and career awareness information. TMAC also sponsors competitions and achievement awards at the secondary school level in fields relevant to or related to mining sector careers.

www.erm.com Version: C.1 Project No.: 0510704-0008 Client: TMAC Resources Inc. July 2020 Page 7-1
HOPE BAY PROJECT 2019 Socio-economic Monitoring Program
POPULATION DEMOGRAPHICS
7. POPULATION DEMOGRAPHICS
7.1 Population Stability
7.1.1 Predictions
The Project is predicted to have a negligible effect on in-migration given that the Project has agreed to maintain multiple points of hire across the Kitikmeot region and to transport workers from their communities. Also, the fly-in/fly-out nature of the operation means that there is no advantage for non-Kitikmeot employees to move to the Kitikmeot region.
7.1.2 Results
Population of Kitikmeot Communities
Figure 7.1-1 shows population estimates and annual percentage change by community and for the Kitikmeot region for 2001 to 2018.7 As shown, while population in the Kitikmeot region and communities trended upward from 2001 to 2017 with population growth of 1% to 5%, population estimates for 2018 suggest that there were more notable changes in the Kitikmeot communities. Cambridge Bay, the largest community in the region, saw a 6% decline in population between 2017 and 2018. Similarly, there was population decline of 5% in Gjoa Haven and 8% decline in Kugluktuk. Kugaaruk, the smallest population in the Kitikmeot region, experienced the largest population increase of 20% between 2017 and 2018, while population in Taloyoak grew by 9%. The overall population of the Kitikmeot region decreased by 1% from 6,993 in 2017 to 6,902 in 2018 (Figure 7.1-1).
Population estimates for 2019 were not available at the time of writing this report.
Recent migration patterns, as well as births and deaths estimates, are available for Nunavut as a whole. Nunavut has, on average, more out-immigrants than in-migrants. For the period of 2001 to 2018, the number of in-migrants exceeded the number of out-migrants in 2001, 2002, 2009, 2011, 2013 and 2018. Nunavut experienced the largest out-migration in 2018, with a recorded 1,451 out-migrants; however, that year also saw a large number of in-migrants, for an overall positive net migration of 179. Historically, a notable out-migration trend extended from 2003 through 2008. Data suggest that a second out-migration trend took place from 2012 through 2017, with a net out-migration of 406 persons during the timespan (GN 2018b).
Births and deaths data indicate that Nunavut has, on average, five live births per each death (GN 2019b, 2019a). The high birth-to-death ratio supports natural population growth in the region and in Nunavut, because net migration is primarily negative with more individuals moving out of than into the territory.
7 Population estimates for the Kitikmeot region and communities are prepared by the GN. Estimates for 2001 and 2016 are based on final and updated postcensal data; while estimates for 2017 and 2018 are based on preliminary postcensal information. Population estimates should be treated as non-official as they are based on components of population growth such as births, deaths, and migration GN. 2018f. Nunavut Population Estimates by Region and Community, 2001 to 2017. https://www.gov.nu.ca/executive-and-intergovernmental-affairs/information/population-data (accessed March 2020), GN. 2019c. Nunavut Population Estimates by Sex, Age Group, Region and Community, 2018 (3 tables). https://www.gov.nu.ca/executive-and-intergovernmental-affairs/information/population-data (accessed March 2020).

Figure 7.1-1:
www.erm.com Graphics: HB-20ERM-006gProject No.: Client: 0519516-0001 TMAC Resources Inc.
Population by Community and in the Kitikmeot Region (Estimate and Percentage Change from Previous Year), 2001 to 2018
0
1,600
3,200
4,800
6,400
8,000
2001 2002 2003 2004 2005 2006 2007 2008 2009 2010 2011 2012 2013 2014 2015 2016 2017 2018
2001 2002 2003 2004 2005 2006 2007 2008 2009 2010 2011 2012 2013 2014 2015 2016 2017 2018
0
500
1,000
1,500
2,000
2,500
Population in the Kitikm
eot Region
Popu
latio
n by
Com
mun
ity
Gjoa havenCambridge Bay
TaloyoakKitikmeot Region
Kugluktuk
Kuggaruk
Year
Year
Gjoa havenCambridge Bay
TaloyoakKitikmeot Region
Kugluktuk
Kuggaruk
3% 3% 0% 2% 2% 2% 2% 4% 2% 3% 2% 2% 1% 2% 1% 2%
-1%
4% 2% 1% 0%4% 2% 2%
3%1% 2% 3% 2% 3% 2% 3% 3%
-6%
1% 5%0% 2%
2% 4% 3%5%
3%4% 2%
2% 1% 2% 1% 3%
-5%
4%4%
1% 1%3% 2%
1%
5%
2%2%
2%1% 1% 0%
-1%
3% 20%3%
3%
-1%
1%2%
2%
3%
2%4%
2%2% 1% 1%
2%
1%
-8%
3%3%
0% 4%2% 2%
2%
3%
3%
2%
0%1% 1% 1%
0%
2%
9%
-0.3
-0.2
-0.1
0
0.1
0.2
0.3
Perc
enta
ge C
hang
e fr
om P
revi
ous
Year
Source: GN (2018f, 2019c).

www.erm.com Version: C.1 Project No.: 0510704-0008 Client: TMAC Resources Inc. July 2020 Page 7-3
HOPE BAY PROJECT 2019 Socio-economic Monitoring Program
POPULATION DEMOGRAPHICS
Over the next 15 years (2019 to 2035), it is predicted that the Kitikmeot region will have an annual population growth of approximately 1% per year, with a progressively decreasing annual growth by 2035. In 2018, highest annual growth (above 1%) is predicted for the communities of Gjoa Haven, Kugaaruk and Taloyoak. Cambridge Bay and Kugluktuk are expected to have slower population growth of less than 1% (GN 2014).
Migration of Employees
In 2018, two TMAC employees moved from Cambridge Bay to Edmonton. Although there were no TMAC employees who moved to the Kitikmeot from elsewhere, two employees moved within the region in 2018: one employee hired in Cambridge Bay returned home to the community of Taloyoak, and one employee moved from Kugluktuk to Cambridge Bay.
In 2019, four TMAC employees changed their place of residence. One employee moved from Kugluktuk to Cambridge Bay, one moved from Kugluktuk to Edmonton, one from Arviat to Edmonton, and one from Cambridge Bay to Edmonton (and then subsequently returned to Cambridge Bay).
7.1.3 Interpretation
Total population, along with other demographic indicators, is a key element of any socio-economic monitoring program. Population statistics and projections are used to assess the need for housing, education, and government services (e.g., health care and social services), so that resources can be allocated according to the pace of population change. In general, an increase in population of the Kitikmeot region means an increase in the demand for infrastructure and services.
Population growth results from a number of factors including natural population changes (net births and deaths) and migration. In the Kitikmeot region, growth is driven by a relatively high birth to-death ratio. Regional population increases were modest since 2013 at 1% to 2% per year, remaining on par with the territorial (1%-2%) and national (1%) trend. In 2018, a general decrease in population was estimated for the region8. In addition, no TMAC employees from outside of the Kitikmeot have moved to the region.
Considering the increased levels of Project activity in 2015 through 2019, the Project does not appear to be a driver for population growth.
7.2 Effects Management and Mitigation Table 7.2-1 lists measures designed to mitigate and manage potential effects related to changes in population.
Table 7.2-1: Population Stability Management and Mitigation Measures
Program/ Mitigation Measure
Purpose/Description/Outcome
Fly-in/fly-out rotation Project workers are accommodated at site in camps while on rotation. TMAC provides air transportation for all Kitikmeot residents, Inuit and non-Inuit, from their home community to site if employed by the Project, in order to avoid in-migration to these communities.
8 Population estimates during inter-census years may not accurately reflect actual population changes. This was noted at the 2019 Kitikmeot SEMC meeting where the appropriateness of the methodology used by the GN Nunavut Bureau of Statistics (NBS) to prepare population estimates was questioned by community members.

www.erm.com Version: C.1 Project No.: 0510704-0008 Client: TMAC Resources Inc. July 2020 Page 8-1
HOPE BAY PROJECT 2019 Socio-economic Monitoring Program
COMMUNITY INFRASTRUCTURE AND PUBLIC SERVICES
8. COMMUNITY INFRASTRUCTURE AND PUBLIC SERVICES
8.1 Housing Availability
8.1.1 Predictions
More Kitikmeot residents will be working (more income in the community) as a result of the Project, and some residents may decide to purchase or build a home. The increased demand for private housing may also increase the number of rental units that are built. This is expected to improve the availability of private housing units in the regional communities and potentially decrease the number of people on public housing waitlists. The demand for social housing will be negligible or not significant as a result of the Project.
8.1.2 Results
Housing Need by Community
The public housing program provides subsidized housing to tenants based on their income and ability to pay rent. (NHC 2019). The rent for public housing is assessed based on income brackets of total gross income of primary tenants. Table 8.1-1 shows the number of people on the public housing waitlist in the Kitikmeot region. As evident, the number of people waiting for public housing has been increasing. From 2014 to 2018, the number of people on waitlists more than doubled in Gjoa Haven, Kugaaruk and Taloyoak, while it increased by 55% in Cambridge Bay and 32% in Kugluktuk. In 2019, there was one less person on the waitlist in Cambridge Bay, no change to the number of people on the waitlist in Kugluktuk, and an increase in the number of people on the waitlist in the remaining communities.
Table 8.1-1: Number of People on the Public Housing Waitlist – Total and as a Percentage of Available Public Housing Stock
Number of People on the Public Housing Waitlist Waitlist as a Percentage of Available Stock
Community 2014 2015 2016 2017 2018 2019 2018 2019
Cambridge Bay 93 111 119 90 144 143 54% 52%
Gjoa Haven 47 58 101 106 125 128 135% 54%
Kugaaruk 45 70 85 97 101 112 119% 70%
Kugluktuk 84 85 95 94 111 111 77% 38%
Taloyoak 43 46 75 70 99 107 104% 52%
Source: I. van Winssen, pers. comm. (2019); T. Chimhanda, pers. comm. (2020)
The number of people waiting for public housing also significantly exceeded the number of available public housing in 2018, revealing substantial housing needs across all Kitikmeot communities. In 2019, the number of people on the public housing waitlist as a percentage of available stock decreased in all communities, with most notable changes in Gjoa Haven, Kugaaruk and Taloyoak. There are also 25 units planned or under construction in Cambridge Bay, 15 in Gjoa Haven, 10 in Kugaaruk, 10 in Kugluktuk and none in Taloyoak, further effectively reducing the number of people on the public housing waitlist as a percentage of available stock (T. Chimhanda, pers. comm. 2020).
Approved Home Ownership Assistance Applications by Community
Nunavut Down Payment Assistance Program (NDAP) assists Nunavummiut residents in achieving homeownership, supporting a purchase of an existing home or a construction of a new one. The program makes financial contributions to help clients meet a down payment of 10% of the total house cost (client

www.erm.com Version: C.1 Project No.: 0510704-0008 Client: TMAC Resources Inc. July 2020 Page 8-2
HOPE BAY PROJECT 2019 Socio-economic Monitoring Program
COMMUNITY INFRASTRUCTURE AND PUBLIC SERVICES
contributes 2.5% while NHC contributes the remaining 7.5% to a maximum of $30,000). NDAP is offered as a forgivable second mortgage over a 10 year period; there is no forgiveness in the first five years (NHC 2016).
The number of approved NDAP applications was the following9:
2014/15: total of 5 approvals for the Kitikmeot
2015/16: Cambridge Bay (5), Kugluktuk (1)
2016/17: Cambridge Bay (8), Gjoa Haven (1), Kugluktuk (2)
2017/18: Cambridge Bay (1), Gjoa Haven (2)
2018/19: no approvals10
2019/20: Cambridge Bay (3)
8.1.3 Interpretation
Between 2014 and 2018, there was an increase in the number of applicants waiting for public housing. The NHC reported that following the announcement of the new needs-based allocation methodology, potential tenants were encouraged to complete applications for public housing, which increased the number of applicants on the waitlist despite the construction of new public housing unit. Therefore, the increased demand for public housing has been acknowledged to be a result of the announcement of the new allocation methodology and call for new applicants. The number of people on the waitlists can also increase with growing population, declining condition of available housing stock and varying socio-economic challenges. It is unlikely that the Project affected the demand for public housing. In 2019, the number of people on the waitlist decreased in Cambridge Bay, with no change in Kugluktuk, and an increase in the remaining communities.
With respect to the NDAP approvals, although there was an increase in approvals in the 2016/17 fiscal year, the number of approvals declined in 2017/18, and there were no approvals in 2018/19. In 2019/20, there were three approvals in Cambridge Bay. A positive impact of Project employment on the number of NDAP approvals is not evident.
8.2 Housing Status
8.2.1 Predictions
Kitikmeot residents employed by the Project will be able to accumulate wealth and seek alternative housing arrangements (i.e., leave public housing and rent private housing or purchase/build a house), given the higher personal income. Other employees may continue to rent, or live with relatives or friends while not on-site.
8.2.2 Results
Housing status of Project employees is to be determined with the help of a housing survey to be developed with NHC, GN, and KitSEMC, and administered to Nunavummiut employees. The required survey has not been developed yet. Consequently, data for this indicator is not available.
9 NHC fiscal years is from April 1 to March 31. 10 As of February 22, 2019.

www.erm.com Version: C.1 Project No.: 0510704-0008 Client: TMAC Resources Inc. July 2020 Page 8-3
HOPE BAY PROJECT 2019 Socio-economic Monitoring Program
COMMUNITY INFRASTRUCTURE AND PUBLIC SERVICES
8.2.3 Interpretation
The housing survey has not been developed. The housing survey initiative is being led by NHC. TMAC has made a number of attempts to engage with NHC on the status of survey development, but has not had a response to date.
8.3 Project Use of Emergency Services
8.3.1 Predictions
The Project may increase demand on emergency services in Kitikmeot communities due to Project related accidents. Project-related workplace accidents should be minimal in number and severity and this effect is predicted to be minor.
8.3.2 Results
Medical aid was not required in 2013 or 2015. In 2014, one Project worker required medical aid. In 2016, two workers were seen at the health centre in Cambridge Bay for minor injuries due to separate incidences of “slips, trips, and falls”. One worker returned to work the same day, and another resulted in one day of lost-time. In 2017, one TMAC employee required emergency medical attention and extended recovery time was required; this was due to an illness that was not work related. In 2018 and 2019, the Project did not use GN emergency health services.
8.3.3 Interpretation
TMAC monitors health and safety performance and adjusts its activities to avoid injuries and other incidents. Overall, the number of incidences remains very low and the Project has not resulted in increased demand on health care services in Kitikmeot communities because of Project-related emergencies.
8.4 Demand for Health and Social Services
8.4.1 Predictions
Project employees who are Kitikmeot residents will have access to health care services while at site, potentially reducing the annual number of health centre visits in the region. However, some Project employees may elect to engage in high risk behaviours while off site and off rotation (e.g., alcohol and drug use) increasing demand for health care or social services. It is not expected that a large number of employees will participate in risky behaviours and minimal adverse effects are predicted on health care and social services. Additionally, through the provision of employment and income, the Project has the potential to reduce the number of people who require social assistance.
8.4.2 Results
Visits to Health Centres
The number of community health centre visits by community and for the Kitikmeot region shows notable year-to-year variation over the investigated period (Figure 8.4-1; GN 2018c). Kitikmeot saw a general drop in the number of health centre visits leading up to and including 2009, followed by an increase in 2010 through 2014. In 2015, the number of health centre visits dropped to 39,049 across the Kitikmeot region, increasing in 2016 by 8% to 42,216 (GN 2018c).
At the time of writing, data for 2017, 2018 and 2019 have yet to be released.

Figure 8.4-1:
www.erm.com Graphics: HB-20ERM-006hProject No.: Client: 0519516-0001 TMAC Resources Inc.
Health Centre Visits by Community and Region (Total and per Capita), 2003 to 2016
Gjoa havenCambridge Bay
TaloyoakKugluktuk
Kuggaruk
Year
Gjoa havenCambridge Bay
TaloyoakKitikmeot Region
Kugluktuk
Kuggaruk
9,314 10,324 8,916 9,263 7,061 7,316 7,181 8,936 8,640 10,058 10,181 10,592 10,112 10,214
9,008 9,0878,751 7,157
7,178 6,778 4,8086,294 6,823
7,754 7,956 8,720 7,903 7,977
6,342 6,3326,304 6,845
5,362 5,5815,155
5,032 5,5985,436 5,830
6,166 6,9419,566
9,857 9,6028,910 10,097
8,960 8,115
5,397
7,7158,806
9,314 9,4779,923
6,826
7,819
6,247 6,1056,250 5,995
6,098 5,465
5,151
4,6096,149
6,6847,588
8,371
7,267
6,640
2003 2004 2005 2006 2007 2008 2009 2010 2011 2012 2013 2014 2015 20160
5,000
10,000
15,000
20,000
25,000
30,000
35,000
40,000
45,000
50,000
Tota
l Num
ber
2003 2004 2005 2006 2007 2008 2009 2010 2011 2012 2013 2014 2015 20160
2
4
6
8
10
12
14
Year
Visi
ts p
er C
apita
Source: GN (2018c).

www.erm.com Version: C.1 Project No.: 0510704-0008 Client: TMAC Resources Inc. July 2020 Page 8-5
HOPE BAY PROJECT 2019 Socio-economic Monitoring Program
COMMUNITY INFRASTRUCTURE AND PUBLIC SERVICES
On a per capita basis, there was an overall decrease in health centre visits between 2003 and 2009 within the Kitikmeot region (i.e., from 7.6 to 4.6 visits per person annually; Figure 8.4-1). While the rate of visits in the Kitikmeot region has since increased (6.3 visits per person in 2013, 6.6 in 2014, 5.8 in 2015 and 6.2 in 2016), this level of demand is low compared to the per capita rates experienced earlier in the past decade (e.g., 7.6 and 7.7 annual visits per person in 2003 and 2004, respectively); it is also relatively low in relation to other parts of Nunavut.
Cambridge Bay, Gjoa Haven, and Kugluktuk have typically had lower rates of health centre visits while Taloyoak and Kugaaruk have had higher rates (2003 to 2016; Figure 8.4-1). In 2016, Kugluktuk had the lowest rate of regional health centre visits at 4.7 visits per person annually, lower than Cambridge Bay (5.3), Gjoa Haven (5.5) and Taloyoak (6.2). Kugaaruk had the highest rate of health centre visits per capita (11.4 visits per person, an increase from 8.2 from the previous year). In general, from 2003 through 2016, the per capita rate of health centre visits varied within the Kitikmeot communities by approximately one to two per capita visits per year.
Social Assistance Caseload
The number of social assistance cases represents the number of households receiving social assistance or income support. Social assistance data (monthly average) are available from 2004 to 2018 (GN 2019d). In the Kitikmeot region, the number of social assistance cases trended upward from a low of 672 cases in 2004 to a high of 1,093 in 2013, thereafter gradually decreasing to 950 cases in 2018. Data by community are provided in Figure 8.4-2.
The rate of social assistance caseloads (per 100,000 persons) highlights the difference in caseloads in Cambridge Bay in comparison to other Kitikmeot communities, and the regional trend. The rate of social assistance caseloads varied on an annual basis, being generally lowest in Cambridge Bay and highest in Taloyoak (Figure 8.4-2). The rate trended upward for Kugaaruk from 2004 to 2013, moderately decreasing afterwards. Similar trend took place in Kugluktuk, but of a smaller change. In general, since 2013, there was a general decrease in the rate of social assistance caseloads in the Kitikmeot, with a small increase in 2016 in Cambridge Bay. In 2018, per capita caseload decreased in Cambridge Bay, Kugaaruk, and Taloyoak, and increased in Kugluktuk and Gjoa Haven.
Information for 2019 was not available at the time of writing this report.
8.4.3 Interpretation
While the number of visits to health centres (and the per capita rate) generally increased since 2010 (with a small dip in 2015), the number of visits to health centres from 2012 to 2016 was similar to the level of demand experienced in the past decade when the region had a smaller population. Visits to health centres are typically determined by a number of diverse factors, many of which are not related to the Project. The Project also has a number of measures to ensure that there is no impact on local services. For example, Project workers have access to first aid facilities and medical personnel while on-site. Additionally, Project employees who are not Kitikmeot residents are expected to continue to access health services in their home communities and only emergencies flown to Cambridge Bay would utilize medical services for those who are not Kitikmeot residents.
With respect to social assistance, there was a general decrease in the number of social assistance caseloads (and rate) since 2013 indicating that the need for social assistance decreased across Kitikmeot communities. While it is possible that Project-related employment and income as well as associated spinoff opportunities benefiting Kitikmeot residents reduced the need for social assistance, a direct correlation cannot be determined with reasonable certainty. The need for social assistance is likely to fluctuate as Project employment levels and individual employment patterns fluctuate.

Figure 8.4-2:
www.erm.com Graphics: HB-20ERM-006iProject No.: Client: 0519516-0001 TMAC Resources Inc.
Social Assistance Average Monthly Caseload by Community (Total and per 100,000 Persons), 2004 to 2018
Gjoa havenCambridge Bay
TaloyoakKugluktuk
Kuggaruk
Year
Gjoa havenCambridge Bay
TaloyoakKitikmeot Region
Kugluktuk
Kuggaruk
Year
119 134 112 103 79 93 127 121 107 132 139 122 132 134 122
187 214 223 224 231 248276 254 261
299 306 298 264 256 263
7072 86 94 94
109128 146 152
188 177 178 170 150 136141133 147 161 156
184
211 212 228
261 253236
224 237 241155
178 172 191 196
207
200 186 206
213 208217
204 196 188
2004 2005 2006 2007 2008 2009 2010 2011 2012 2013 2014 2015 2016 2017 20180
200
400
600
800
1,000
1,200
Tota
l Num
ber
2004 2005 2006 2007 2008 2009 2010 2011 2012 2013 2014 2015 2016 2017 20180
5,000
10,000
15,000
20,000
25,000
Cas
eloa
ds p
er 1
00,0
00 P
erso
ns
Source: GN (2019d).

www.erm.com Version: C.1 Project No.: 0510704-0008 Client: TMAC Resources Inc. July 2020 Page 8-7
HOPE BAY PROJECT 2019 Socio-economic Monitoring Program
COMMUNITY INFRASTRUCTURE AND PUBLIC SERVICES
8.5 Demand for Police Services
8.5.1 Predictions
Observation of changes in overall crime rate provide a broad overview of more specific indicators of crime and safety. Increased income from Project-related employment can lead to increased alcohol and drug use and other unhealthy choices or behaviours. This may result in increased demand for police services (measured as police calls for service) and the overall crime rate. However, it is expected that the majority of employees will experience positive benefits of increased income and not engage in high-risk behaviours, unproductive spending, or potentially criminal activities.
8.5.2 Results
Police Calls
Data on the number of police calls were available for the period of 2010 to 2019. Over that time, the number of police calls generally trended upward in the Kitikmeot region, however with varying trends in the communities (Table 8.5-1; Figure 8.5-1). Cambridge Bay had the highest number of police calls in 2012. The communities of Gjoa Haven and Kugaaruk had the highest number of police calls in 2018, while calls in Taloyoak peaked in 2016 and calls in Kugluktuk peaked in 2019. From 2018 through 2019, the number of police calls increased in all communities with the exception of Gjoa Haven and Kugaaruk where there was, respectively, an 8% and 20% decrease in police calls. The community of Kugluktuk experienced the highest increase in the number of police calls of 47%. In 2019, there were 5,313 police calls in the Kitikmeot region, representing an overall increase of 13% for the region over the previous year.
Table 8.5-1: Police Calls for Services, 2010 to 2019
Community Calls for Service (Number of Calls)
2010 2011 2012 2013 2014 2015 2016 2017 2018 2019 Change from 2018
to 2019
% Change from 2018
to 2019
Cambridge Bay 1,408 1,541 1,718 1,403 1,317 1,409 1,651 1,532 1,545 1,566 21 1%
Gjoa Haven 426 444 576 466 472 723 716 764 838 773 -65 -8%
Kugaaruk 76 192 217 195 256 320 312 336 343 274 -69 -20%
Kugluktuk 804 1,010 1,180 1,057 996 919 1,113 1,113 1,380 2,035 655 47%
Taloyoak 394 540 450 390 434 543 736 613 582 665 83 14%
Total 3,108 3,727 4,141 3,511 3,475 3,914 4,528 4,358 4,688 5,313 625 13%
Sources: Data for years 2010, 2011 and 2012 were provided by G. Elliot (pers. comm.). Data for 2013 were received from R. Head (pers. comm.). Data for 2014 were provided by M. Sirotic (pers. comm.). Data for 2015 and 2016 were provided by J-G Lalonde (pers. comm.) through the GN Department of Economic Development and Transportation (Mineral and Petroleum Resources). For 2017, 2018, and 2019 data were provided by PSE K. Chenier (pers. comm.).

Figure 8.5-1:
www.erm.com Graphics: HB-20ERM-006jProject No.: Client: 0519516-0001 TMAC Resources Inc.
Police Calls for Services (Total and per Capita), 2010 to 2019
Gjoa havenCambridge Bay
TaloyoakKugluktuk
Kuggaruk
Year
Gjoa havenCambridge Bay
TaloyoakKugluktuk
Kuggaruk
Year
1,408 1,541 1,7181,403 1,317 1,409 1,651 1,532 1,545 1,566
426 444576
466 472723
716 764 838 77376192
217
195 256
320312 336 343 274
8041,010
1,180
1,057 996919
1,113 1,1131,380
2,035
394
540
450
390 434
543
736 613582
665
2010 2011 2012 2013 2014 2015 2016 2017 2018 20190
1,000
2,000
3,000
4,000
5,000
6,000
Tota
l Num
ber
2010 2011 2012 2013 2014 2015 2016 2017 2018 20190.0
0.2
0.4
0.6
0.8
1.0
1.2
Cal
ls p
er C
apita
No dataavailable

www.erm.com Version: C.1 Project No.: 0510704-0008 Client: TMAC Resources Inc. July 2020 Page 8-9
HOPE BAY PROJECT 2019 Socio-economic Monitoring Program
COMMUNITY INFRASTRUCTURE AND PUBLIC SERVICES
Per capita calls for police are available for 2010 to 2018; this is because 2019 population estimates were not available at the time of writing this report. On a per capita basis, the highest number of police calls is in Cambridge Bay, followed by Kugluktuk, Taloyoak, Gjoa Haven and Kugaaruk (Figure 8.5-1). On an annual basis, there is less than one police call per capita in all communities. For 2010 through 2018, per capita calls appear to be trending upward for Gjoa Haven and Kugaaruk, being above previously recorded levels. In Cambridge Bay, police calls per capita increased in 2016, however remained below previously recorded levels of 2012.
Criminal Code Violations (Including Traffic)
The total number of criminal code violations and the crime rate (violations per 100,000 people) are summarized for all Kitikmeot communities and the region as a whole from 2001 through 2017 (Figure 8.5-2). Between 2003 and 2012, criminal code violations in the Kitikmeot region remained relatively stable at an average of 2,300 violations per year, decreasing to below 2,000 violations in 2013 through 2015, although the number of violations varied year to year for each community. In 2016 and 2017 there was an increase in the number of violations in most Kitikmeot communities (GN 2018d).
With respect to the overall crime rate (expressed as the number of criminal code violations per 100,000 persons), Canada, Nunavut and the Kitikmeot all experienced a decrease in the overall crime rate in 2013 and 2014, with all rates trending upward in the following years (2015 through 2017). However, while the crime rate was higher in 2016 and 2017, only Taloyoak had an increase in crime rate above previously recorded levels. In general, Kugaaruk has the lowest number of criminal code violations and the lowest crime rate of all Kitikmeot communities, while Cambridge Bay has the largest number of criminal code violations and generally the highest crime rate (Figure 8.5-2).
Information on criminal code violations for 2018 and 2019 was not available at the time of writing this report.
8.5.3 Interpretation
A direct correlation between changes in Project-related employment and income, and changes in the demand for police services and crime in the Kitikmeot is not evident. Although the number of police calls has been steadily increasing in the region since 2014, on a per capita basis, those rates fall within previously recorded levels. By community, the number of police calls, as well as the number of calls per capita, vary year to year, being within previously recorded levels for Cambridge Bay, Kugluktuk and Taloyoak, but increasing for Gjoa Haven and Kugaaruk.
The change in the number of police calls by community as well as the overall crime rate can result from many interacting and complex factors, such as changes in population size, changes in employment and income levels (due to the Hope Bay Project or other projects in the communities), levels of alcohol and drug availability, the relationship between the residents and the Royal Canadian Mounted Police (RCMP), and the availability and use of community services.

Figure 8.5-2:
www.erm.com Graphics: HB-20ERM-006kProject No.: Client: 0519516-0001 TMAC Resources Inc.
Criminal Code Violations for the Kitikmeot Region and by Community (Total Number and per 100,000 Persons), 2001 to 2017
Gjoa havenCambridge Bay
TaloyoakKugluktuk
Kuggaruk
Year
Nunavut Canada
Kitikmeot Region
Gjoa havenCambridge Bay
Kuggaruk
TaloyoakKugluktuk
Year
702 752934 841 883
1,238 1,150 1,259 1,231 1,143965 1,018
735 607 668952 955
201 173
261216 240
143 230295 483
338
280379
206245
325
354 456
25 73
140146 50
47 7462
38
40
6689
8689
94
122154
454
730
9531,058
695
921 731 533631
640
600
704
743601
551
649687
95
171
170 244
340
242
130 189
179282
318
254
212
241325
451444
2001 2002 2003 2004 2005 2006 2007 2008 2009 2010 2011 2012 2013 2014 2015 2016 20170
500
1,000
1,500
2,000
2,500
3,000
Tota
l Num
ber
2001 2002 2003 2004 2005 2006 2007 2008 2009 2010 2011 2012 2013 2014 2015 2016 20170
10,000
20,000
30,000
40,000
50,000
60,000
70,000
80,000
90,000
Crim
e R
ate
Source: GN (2018d).

www.erm.com Version: C.1 Project No.: 0510704-0008 Client: TMAC Resources Inc. July 2020 Page 8-11
HOPE BAY PROJECT 2019 Socio-economic Monitoring Program
COMMUNITY INFRASTRUCTURE AND PUBLIC SERVICES
8.6 Effects Management and Mitigation Table 8.6-1 lists the programs and measures designed to mitigate and manage potential effects related to community infrastructure and public services.
Table 8.6-1: Infrastructure and Public Services Management and Mitigation Measures
Program/Mitigation Measure Purpose/Description/Outcome
Health and Safety Management Plan
The purpose of this plan is to detail the Health Safety and Loss Prevention (HSLP) policies and systems adopted by TMAC and to provide the framework for their implementation. The TMAC Management Team is committed to providing a healthy and safe working environment for all personnel. The objectives are: to have all personnel appropriately trained, responsible and accountable for safety management; to incorporate industry best practice for health and safety standards in the engineering, design and processes implemented at all workplaces; to comply with all relevant standards and codes of practice, and regulatory requirements; and to provide effective training, efficient communication and continuous review of occupational health and safety practices.
Employee and Family Assistance Program (EFAP)
The EFAP provides Inuit employees and their families with services to assist them with dealing with personal problems, family matters, mental health concerns, and alcohol, drug and gambling dependencies.
Fly-in/fly-out rotation Project workers are accommodated at site in camps while on rotation. TMAC provides air transportation for all Kitikmeot residents, Inuit and non-Inuit, from their home community to site if employed by the Project, in order to avoid in-migration to these communities.
Family communications While on site, employees have access to communications facilities to allow communication with spouses and families.
Community Involvement Plan TMAC maintains communications with service providers within the Kitikmeot communities and shares information to assist in the development of collaborative adaptive management measures, should unanticipated impacts arise and mitigation be required.
Alcohol and Drug Policy The Alcohol and Drug Policy restricts the possession and use of alcohol and drugs at the Hope Bay Project, including provisions for site access and enforcement.
TMAC Liaison The TMAC Liaison assists in identifying and developing wellness initiatives for the workforce, and aids in identifying wellness needs of employees, as appropriate.

www.erm.com Version: C.1 Project No.: 0510704-0008 Client: TMAC Resources Inc. July 2020 Page 9-1
HOPE BAY PROJECT 2019 Socio-economic Monitoring Program
INDIVIDUAL AND COMMUNITY HEALTH AND WELLNESS
9. INDIVIDUAL AND COMMUNITY HEALTH AND WELLNESS
9.1 Work-life Balance
9.1.1 Predictions
Some workers and their families may find rotational employment stressful leading to termination of employment. Project employees may also access TMAC’s Employee and Family Assistance Program (EFAP) to deal with personal problems, family matters, mental health concerns, and alcohol, drug and gambling dependencies.
9.1.2 Results
Ability of Inuit Workers to Balance Employment and Family, Traditional Lifestyle
Turnover data for Inuit workers are provided in Section 5.5.2.
In 2018, ten Inuit left TMAC employment, with five terminated by TMAC and five who left voluntarily. Of those who left voluntarily, two left for other employment in their community, one left due to dissatisfaction with work hours, and two resigned due to either family commitments or conflicts with their lifestyle and rotational work.
In 2019, 12 Inuit left TMAC employment, of those:
Four were seasonal hires with contracts that ended;
Two were terminated due to work performance;
Two were terminated due to missing work rotations;
Three resigned due to family commitments; and
One resigned seeking promotion in another job.
Utilization of Employee and Family Assistance Program (EFAP)
TMAC implemented an EFAP in 2014 for permanent, full-time employees and have continued to provide the EFAP. TMAC’s EFAP is not available to contractors, although suppliers working on the Project may offer a similar program to their employees.
TMAC’s employee count was too low in 2014, 2015, and 2016 to report and ensure adequate privacy of information on usage under the EFAP. The data, therefore, have been supressed to protect confidentiality. TMAC can confirm that the program has been accessed by employees in those years.
TMAC’s EFAP is available to a larger number of workers during the operations phase as the number of permanent, full-time TMAC employees substantially increased. For 2017, the first year of operation, utilization of the EFAP was low – a total of 1.5 persons (standardized measure) accessed the service.
Between October 2017 and September 2018, there were 14 new counselling and life smart coaching cases.
Information for 2019 was not available at the time of writing this report.
9.1.3 Interpretation
Turnover rates for Inuit workers tend to be substantially higher, compared to the turnover rates for the overall TMAC workforce and industry trends. In 2018, half of Inuit workers who left TMAC employment resulted from voluntary turnover. Reasons for leaving included an alternative employment opportunity in a home community, dissatisfaction with work hours, as well as family commitments or conflicts with lifestyle

www.erm.com Version: C.1 Project No.: 0510704-0008 Client: TMAC Resources Inc. July 2020 Page 9-2
HOPE BAY PROJECT 2019 Socio-economic Monitoring Program
INDIVIDUAL AND COMMUNITY HEALTH AND WELLNESS
and rotational work. In 2019, reasons for leaving included performance based involuntary terminations, end of work contract, leaving due to family commitments, and seeking another work opportunity – the small number of resignations due to family commitments (three) indicates that negative impacts on the ability of Inuit workers to balance employment and family has not become a significant issue of concern. An EFAP continues to be available to and accessed by employees every year to help TMAC employees and their families deal with personal challenges.
9.2 Household Financial Management
9.2.1 Predictions
Increased income from Project-related employment can lead to poor spending choices and unhealthy behaviours. To address this, TMAC will offer financial management programs for Project employees to improve their financial security and well-being.
9.2.2 Results
Atuqtuarvik’s Corporation Chartered Professional Accountants (CPA) offered financial literacy training to Cambridge Bay workers on a pilot basis in 2018 with significant promotion by TMAC, however the training had no attendees. A similar course was not offered in 2019 due to lack of interest.
9.2.3 Interpretation
Financial literacy training offered to Cambridge Bay workers was not attended by Project employees, and the training was abandoned in 2019 due to lack of interest. TMAC will consider other program delivery options to increase interest and participation, and will look to try to deliver financial literacy training again in the future. Alternative financial management training is offered in the Kitikmeot region through existing pre-employment training programs such as GREAT and Mining Essentials. These are initiatives directed at people that want to be hired but are not yet within the Hope Bay workforce.
9.3 Spending Decisions and Lifestyle Choices
9.3.1 Predictions
Increased income from Project-related employment can lead to increased alcohol and drug use and other unhealthy choices or criminal behaviours. Project employment and associated increase in personal income has the potential to result in a more frequent purchase of alcoholic beverages in the Kitikmeot communities. Increased income has the potential to increase criminal behaviour, impaired driving violations, drug violations, domestic violence and gambling activity levels in Kitikmeot communities. Changes to family spending are expected to occur primarily during the period of transition to Project employment, followed by adjustment or stabilization as the new circumstances (employment and income) become the norm.
9.3.2 Results
Sale of Alcoholic Beverages
Data on the sale of alcoholic beverages for Nunavut were retrieved from Statistics Canada; information is not available at a regional level. Total sales for Nunavut as well as per capita sales (for inhabitants of 15 years of age and over) for Nunavut and Canada are shown in Figure 9.3-1. Sales peaked in 2011/12 at $5.8 million, thereafter decreasing and remaining relatively flat from 2013 to 2017 at $5.3 to $5.6 million. In 2017/18, per capita sales in Nunavut were approximately $9.30, representing a 75% increase in per capita sales over the previous year. This increase in sale and consumption could be

www.erm.com Version: C.1 Project No.: 0510704-0008 Client: TMAC Resources Inc. July 2020 Page 9-3
HOPE BAY PROJECT 2019 Socio-economic Monitoring Program
INDIVIDUAL AND COMMUNITY HEALTH AND WELLNESS
attributed, at least in part, to the opening of the first beer and wine store in Nunavut (in Iqaluit, more specifically) (CBC News 2019). The second store is planned for Rankin Inlet in 2020 that could further contribute to the purchase and consumption of alcohol in Nunavut (Nunatsiaq News 2019a).
Information for 2019 was not available at the time of writing this report.
Criminal Violations: Impaired Driving
The number of impaired driving violations in each community fluctuated over time with the highest number of violations in 2006 and 2007 in the community of Cambridge Bay (Figure 9.3-2). Between 2008 and 2011 there was an overall decrease in the number of violations with a spike in 2012 in Cambridge Bay and Kugluktuk. Subsequently, while violations generally decreased in 2013, 2014 and 2015, they increased in the Kitikmeot by 116% in 2016 and by 76% in 2017. Overall, Cambridge Bay has the highest rate of impaired driving violations compared to the other Kitikmeot communities, with the community of Kugaaruk generally having fewest impaired driving violations and the lowest impaired driving violation rate per 100,000 persons (GN 2018e).
Information for 2018 and 2019 was not available at the time of writing this report.
Criminal Violations: Drug-Related
Figure 9.3-3 shows the number of drug-related violations in each community between 2001 and 2017. As evident, there was a notable spike in the number of drug-related violations in Taloyoak in 2005, in Cambridge Bay in 2009 and 2010, and in Kugluktuk in 2013. Most recently, a trend towards fewer drug-related violations in the region began in 2014 but with an increase in 2017. Since 2013 and continuing through 2016, Kugluktuk had the highest number of drug-related violations in the Kitikmeot region with violations decreasing over the period; while in 2017, there was a substantial increase in drug-related violations in Gjoa Haven (from 2 to 12). The number of drug-related violations per 100,000 followed a similar pattern (GN 2018e).
Information for 2018 and 2019 was not available at the time of writing this report.
Criminal Violations: Assault
The number of assaults in each community fluctuated between 2001 and 2017 with the communities of Cambridge Bay and Kugluktuk generally having higher rates of assaults (Figure 9.3-4). There were notable spikes in the number of assaults in Kugluktuk (2003 and 2004), Cambridge Bay (2008), Gjoa Haven (2009), and Taloyoak (2011). Since 2013, rates of assaults in the Kitikmeot region remained relatively low (as compared to other years) with higher year to year variation across communities, and assaults generally decreasing in Cambridge Bay and Kugluktuk, but increasing in Gjoa Haven, Kugaaruk and Taloyoak (GN 2018e).
Information for 2018 and 2019 was not available at the time of writing this report.

Figure 9.3-1: Sale of Alcoholic Beverages in Nunavut, 2004/05 to 2017/18
www.erm.com Project No.: Client: Graphics: HB-20ERM-006l0519516-0001 TMAC RESOURCES INC.
Nunavut -Sales per capita (litres)Nunavut -Total Sales (CDN millions)
Canada -Sales per capita (litres)
Year2004/05 2005/06 2006/07 2007/08 2008/09 2009/10 2010/11 2011/12 2012/13 2013/14 2014/15 2015/16 2016/17 2017/18
0
1
2
3
4
5
6
7
8
9
10
$0
$1
$2
$3
$4
$5
$6
$7
$8
$9
$10
Volume of Sales per capita (litres)
Valu
e of
Sal
es ($
)
Source: GC (2019).

Figure 9.3-2:
www.erm.com Graphics: HB-20ERM-006mProject No.: Client: 0519516-0001 TMAC Resources Inc.
Impaired Driving Criminal Violations (Total Number and per 100,000 Persons), 2001-2017
Year
Year
1823 25 22 24
6453
3932
23 19
35
2216
1017 21
31
62 1
2
8
1214
8
2
6
4
23
4
1710
13
2421
16
1519
512
14
8
21
12
76
9
19
1
41
13
5 5
7 2
4
5
8
7
3
9
4
2001 2002 2003 2004 2005 2006 2007 2008 2009 2010 2011 2012 2013 2014 2015 2016 2017
2001 2002 2003 2004 2005 2006 2007 2008 2009 2010 2011 2012 2013 2014 2015 2016 2017
0
10
20
30
40
50
60
70
80
90
100
Tota
l Num
ber o
f Im
paire
d D
rivin
g Vi
olat
ions
0
500
1,000
1,500
2,000
2,500
3,000
3,500
4,000
4,500
Num
ber o
f Im
paire
d D
rivin
gVi
olat
ions
per
100
,000
Per
sons
31
6
1
1
12
11
Gjoa havenCambridge Bay
TaloyoakKugluktuk
Kuggaruk
Gjoa havenCambridge Bay
TaloyoakKugluktuk
Kuggaruk
Source: GN (2018e).

Figure 9.3-3:
www.erm.com Graphics: HB-20ERM-006nProject No.: Client: 0519516-0001 TMAC Resources Inc.
Drug-Related Criminal Violations (Total Number and per 100,000 Persons), 2001-2017
Year
Year
8 9 813
512
814
2936
1521
168 7 6 6
15
2 2
1
1
34
4
6
8
5 1
1 1 2
12
1
3 85
2
1
1
9 58
2 2 1
4
4
1111
18
7
15
6
10
8
12
1010
30
10 139
4
3 87
13
347
2
4
3
4
11
8
4
58
6
8
2001 2002 2003 2004 2005 2006 2007 2008 2009 2010 2011 2012 2013 2014 2015 2016 2017
2001 2002 2003 2004 2005 2006 2007 2008 2009 2010 2011 2012 2013 2014 2015 2016 2017
0
10
20
30
40
50
60
70
Tota
l Num
ber o
f Dru
g-R
elat
ed V
iola
tions
0
500
1,000
1,500
2,000
2,500
3,000
3,500
4,000
4,500
Num
ber o
f Dru
g-R
elat
edC
rimin
al V
iola
tions
per
100
,000
Per
sons
Gjoa havenCambridge Bay
TaloyoakKugluktuk
Kuggaruk
Gjoa havenCambridge Bay
TaloyoakKugluktuk
Kuggaruk
Source: GN (2018e).

Figure 9.3-4:
www.erm.com Graphics: HB-20ERM-006oProject No.: Client: 0519516-0001 TMAC Resources Inc.
Assault-Related Criminal Violations (Total Number and per 100,000 Persons), 2001-2017
Year
Year
134 142172
142 141 163 141
234178
147 165 190136 113
83 69 96
3752
77
53 50 32 54
60 143
96 57
88
57 8588
8196
516
34
38 17 12 22
1513
1214
24
19 1625
37
2989
154
205
215
149181
121
116127
150152
174
142 138109 128
11029
37
2868
9384
60
4844
55 104
65
44 66
5068
69
2001 2002 2003 2004 2005 2006 2007 2008 2009 2010 2011 2012 2013 2014 2015 2016 2017
2001 2002 2003 2004 2005 2006 2007 2008 2009 2010 2011 2012 2013 2014 2015 2016 2017
0
100
200
300
400
500
600
Tota
l Num
ber o
fA
ssau
lt-R
elat
ed C
rimin
al V
iola
tions
0
2,000
4,000
6,000
8,000
10,000
12,000
14,000
16,000
18,000
Num
ber o
f Ass
ault-
Rel
ated
Crim
inal
Viol
atio
ns p
er 1
00,0
00 P
erso
ns
Gjoa havenCambridge Bay
TaloyoakKugluktuk
Kuggaruk
Gjoa havenCambridge Bay
TaloyoakKugluktuk
Kuggaruk
Source: GN (2018e).

www.erm.com Version: C.1 Project No.: 0510704-0008 Client: TMAC Resources Inc. July 2020 Page 9-8
HOPE BAY PROJECT 2019 Socio-economic Monitoring Program
INDIVIDUAL AND COMMUNITY HEALTH AND WELLNESS
9.3.3 Interpretation
The Project does not appear to have an effect on the sale of alcoholic beverages given that the sales mostly decreased since 2012. In 2018, there was an increase in the sales of alcoholic beverages in Nunavut, most likely at least partly attributed to the opening of the first beer and wine store in Nunavut. However, as the information is not available at the regional level it is difficult to fully investigate the effect of Project income on the purchase of alcoholic beverages in the Kitikmeot region. Further, in 2015, 2016 and 2017, there was an increase in total impaired driving violations and as well as assault-related violations in the Kitikmeot region; while drug-related violations increased in 2017. By community, while violations increased in some communities, they decreased in others. There is also a substantial inter-annual variation in the number of violations. These factors make it challenging to assess the effect of Project income on the number of violations in each community; however, a possible positive correlation cannot be discarded. In addition, with 2019 being the first full year of legalized recreational cannabis use in Canada, the sum effect on the trend in recorded violations in Kitikmeot communities remains uncertain, but can be expected to result in lower drug-related violations because of cannabis legalization.
9.4 Country Foods Consumption
9.4.1 Predictions
Country foods play an important role in the diets of Nunavummiut and TMAC will facilitate access to country foods for Project employees. Country foods will be served on site to those employed by the Project. Also, access to Country Food Kitchens will be provided to Project employees for individual food preparation.
9.4.2 Results
TMAC canteen serves country foods to Project employees every three weeks and on special holidays. In 2018, country foods were served to workers up to 20 times.
Inuit workers use the cultural cabin on a regular basis. Individual users are not logged in as the facility is open on a continual basis. Consequently, the number of workers who utilize the Country Food Kitchen is unknown.
9.4.3 Interpretation
In 2018, country foods were served to Project employees up to 20 times; information for 2019 is not available. Inuit workers regularly utilize the Country Food Kitchen.
9.5 Food Security
9.5.1 Predictions
There could be a minor increase in the cost of living (the cost of food) in the communities as a result of the Project. However, the Project can also reduce food insecurity through increased employment and income. Employees who choose to use their income productively (e.g., spending on nutritious foods, purchasing equipment to support harvesting) have the potential to positively impact food security not only in their own households but also amongst their extended family network, due to the Inuit cultural practice of sharing food (and country foods in particular).
9.5.2 Results
The Nunavut Food Price Survey (NFPS) is an annual survey conducted in March each year by the GN NBS in each of Nunavut’s 25 communities. NBS started the NFPS as a pilot in 2013 and began regularly

www.erm.com Version: C.1 Project No.: 0510704-0008 Client: TMAC Resources Inc. July 2020 Page 9-9
HOPE BAY PROJECT 2019 Socio-economic Monitoring Program
INDIVIDUAL AND COMMUNITY HEALTH AND WELLNESS
reporting food price data in 2014/2015. The NFPS provides information on prices by calculating the average cost of an item from all stores in a community. The survey includes 141 regularly priced items selected based on the groups in the Nunavut Food Guide, with the exception of 19 non-food items. NBS provides an annual comparison of 24 select food items basket11 by region and community.
Table 9.5-1 provides the average price of a food basket at the community and regional levels as well as the percentage difference for the most recent year (2018) in comparison to the territorial average. While trends are difficult to discern, the cost of a food basket was higher in 2015 in comparison to 2014 in each community by 7% to 17%. In 2016, food prices increased in Cambridge Bay (by 2%) but decreased in other Kitikmeot communities, and in the region as a whole. In 2017, prices decreased by 9% in Kugaaruk and Kugluktuk while they increased by 5% in Taloyoak and 4% in Cambridge Bay, and remained at the same level in Gjoa Haven. In 2018, prices decreased in Cambridge Bay, Gjoa Haven and Taloyoak, but increased in Kugaaruk and Kugluktuk. In general, the cost of food was higher in Kugaaruk and Taloyoak compared to other communities (GN 2015a, 2016, 2017a, 2018a).
Table 9.5-1: NFPS – Comparison of 24 Select Food Items Basket, 2014 to 2018
Community March 2014
March 2015
March 2016
March 2017
March 2018
Difference with Nunavut 2018
2017-2018 Difference
Kitikmeot Average $165.81 $182.75 $180.90 $177.30 181.15 5% 2%
Cambridge Bay $152.41 $166.46 $169.68 $175.80 173.13 -1% -2%
Gjoa Haven $165.84 $181.24 $178.47 $178.64 177.06 2% -1%
Kugaaruk $174.47 $204.02 $201.98 $184.07 210.23 21% 14%
Kugluktuk $161.57 $174.39 $169.60 $154.64 163.86 -6% 6%
Taloyoak $174.76 $187.61 $184.75 $193.36 181.54 4% -6%
Source: GN (2015a, 2016, 2017a, 2018a)
A comparison of food prices documented by NFPS and the Canada Consumer Price Index (CPI) food basket indicates that prices are substantially higher in the Kitikmeot communities in comparison to the Canadian average. In 2017, apples and white bread cost $6.85 and $6.68 in the Kitikmeot region, while average costs in Canada were $3.85 and $2.81, respectively. In a regional context, Kitikmeot food prices were higher compared to the Nunavut average every year for which the data were collected. Compared to the national average, food costs in the Kitikmeot region are at least twice the Canadian average.
Information for 2019 was not available at the time of writing this report.
9.5.3 Interpretation
The cost of food in Nunavut is determined by a number of factors including the cost to transport food from southern Canada and the wholesale cost of food from southern vendors. Programs that subsidize transport costs aim to regulate the cost of certain food and non-food items. The extent to which changing food subsidies influence the price of specific items is unknown.
In 2018, TMAC began to provide free air freight on company air charter flights for the Kugluktuk High School to bring in fresh produce to be used in education programming and for a breakfast program.
11 The 24 select food items basket includes: 2% milk (2l), apples (1kg), baby food in jars (128ml), bananas (1kg), canned baked beans (398ml), canned cream of mushroom (284ml), canned pink salmon (213g), carrots (1kg), eggs (12 large), frozen corn (750g), frozen french fries (650g-1kg), frozen pizza (one unit, >799g), ground beef (1kg), instant rice (700g), macaroni and cheese dinner (200-225g), margarine (454g), pork chops (1kg), potatoes (2.27kg), quick oatmeal (900g-1kg), soda crackers (450g), spaghetti noodles (500g), white bread (570g), white flour (2.5kg), and wieners (450-500g).

www.erm.com Version: C.1 Project No.: 0510704-0008 Client: TMAC Resources Inc. July 2020 Page 9-10
HOPE BAY PROJECT 2019 Socio-economic Monitoring Program
INDIVIDUAL AND COMMUNITY HEALTH AND WELLNESS
This significantly reduces the cost of food for high school student programming in Kugluktuk. TMAC will continue to look at ways in which company operations can contribute to lowering the cost of food and supporting education in the region.
The Project entered operations in 2017 and employed local workers. The NFPS indicates that it is common for prices to both rise and fall in the Kitikmeot communities and a Project-related impact on prices is not apparent.
9.6 Household Economic Self-sufficiency
9.6.1 Predictions
Project-related employment will increase personal and family income for households in the Kitikmeot region. This, in turn, has the potential to improve households’ economic self-sufficiency and to decrease the number of low-income households in the region.
9.6.2 Results
Low-income Households
Low-income metrics, set at 50% of adjusted median household income, represents a relative measure of low income12 for Kitikmeot communities. Low-income data were collected for all Kitikmeot taxfilers for 2004 to 2016 and include data on couple families13, lone parent families14 and persons not in a census family15 (Figure 9.6-1)16. In 2016, data was not available for the total number of families and persons not in a census data and, therefore it was not possible to calculate the share of low-income families as a percentage of total. Data for 2017, 2018 and 2019 have yet to be released.
In the Kitikmeot region, the number of low-income families and non-family persons was lower from 2004 through 2006 and in 2010 compared to other years. From 2011 through 2014, the number of low-income families and non-family persons trended upward for all communities. In 2015, there was a small decrease in the number of low-income families and non-family persons in Gjoa Haven and Kugluktuk, with no change in Cambridge Bay and Kugaaruk, and an increase in Taloyoak. In 2016, the number of low-income families and non-family persons decreased in all communities with the exception of Cambridge Bay. In general, 31% of families and non-family persons were classified as low income in Cambridge Bay in 2015, compared to 39% in Gjoa Haven, 46% in Kugaaruk, 43% in Kugluktuk and 48% in Taloyoak17 (GN 2019e).
Project Employment Income
Total employment income increased with the commencement of Project production, supporting the financial security of Inuit workers. In 2019, TMAC paid $2.5 million in payroll to Inuit workers, representing a 31% increase over the previous years, and a four-fold increase in income to Inuit workers since 2015.
12 The measure is categorized according to the number of persons present in the household. 13 A couple family consists of a couple living together (married or common-law, including same-sex couples) living at the same address with or without children. 14 A lone-parent family is a family with only one parent, male or female, and with at least one child. 15 Persons not part of a couple or lone-parent family. 16 All low income data should be interpreted with caution as the data are subject to rounding. 17 This estimate is not available for 2016.

Figure 9.6-1:
www.erm.com Graphics: HB-20ERM-006pProject No.: Client: 0519516-0001 TMAC Resources Inc.
Low Income Families & Non-family Persons (Total and as a Percentage of All Families and Non-Family Persons), 2004-2016
Year
Year
150 160 150 170 190 180 160 170 180 190 200 200 210
140 120 120 120 120 130100 120 130 150 170 160 140
60 70 70 7080 70
7070
90100
110 110 90160 150 170 170
190 190180
170180
200220 200
19090 80 90100
100 100
90100
120
120
130 150140
2004 2005 2006 2007 2008 2009 2010 2011 2012 2013 2014 2015 2016
2004 2005 2006 2007 2008 2009 2010 2011 2012 2013 2014 2015 2016
0
100
200
300
400
500
600
700
800
900
Tota
l Num
ber
0.0
0.1
0.2
0.3
0.4
0.5
0.6
Perc
enta
ge o
f Tot
al
Gjoa havenCambridge Bay
TaloyoakKugluktuk
Kuggaruk
Nunavut Kitikmeot Region
Gjoa havenCambridge Bay
Kuggaruk
TaloyoakKugluktuk
Source: GN (2019e).

www.erm.com Version: C.1 Project No.: 0510704-0008 Client: TMAC Resources Inc. July 2020 Page 9-12
HOPE BAY PROJECT 2019 Socio-economic Monitoring Program
INDIVIDUAL AND COMMUNITY HEALTH AND WELLNESS
9.6.3 Interpretation
Most recent data for low income families and non-family persons are available for 2016. In 2015 and 2016, there was a decrease in the number of low-income families in the region; however, at a community level the number of low-income families increased in Cambridge Bay and Taloyoak. Further, while there was some activity at the Hope Bay Project in 2015 and 2016, operations and an increase in hiring began in 2017 with significant increase in salaries paid to Inuit workers in the following years. Due to the lack of more recent data on low income families, it is difficult to determine whether there was a decrease in the number of low-income families in the Kitikmeot region as a result of Project-related employment and income. However, as a large proportion of Hope Bay recruitment was from the pool of unemployed and underemployed persons within the region, a positive effect on low income families can be expected.
9.7 Effects Management and Mitigation Table 9.7-1 lists the programs and measures designed to mitigate and manage potential effects related to individual and community health and wellness.
Table 9.7-1: Health and Wellness Management and Mitigation Measures
Program/Mitigation Measure Purpose/Description/Outcome
Employee and Family Assistance Program (EFAP)
The EFAP provides Inuit employees and their families with services to assist them with dealing with personal problems, family matters, mental health concerns, and alcohol, drug and gambling dependencies.
Family Communications While on site, employees have access to communications facilities to allow communication with spouses and families.
Community Involvement Plan TMAC maintains communications with service providers within the Kitikmeot communities and shares information to assist in the development of collaborative adaptive management measures, should unanticipated impacts arise and mitigation be required.
Alcohol and Drug Policy The Alcohol and Drug Policy restricts the possession and use of alcohol and drugs at the Hope Bay Project, including provisions for site access and enforcement (policy of “zero tolerance” at the Project).
Country Foods TMAC provides a country food kitchen that can be used at anytime by workers. TMAC also provides cultural activities at the Project as determined by the site social committee based on demand and request.
Financial Training TMAC will reach out to third parties to deliver financial management programs such as financial literacy, financial planning and personal budgeting as identified in the Human Resources Plan. Third parties will be engaged to provide the necessary expertise in financial literacy training, and may include financial institutions, post-secondary education institutions (e.g., Nunavut Arctic College) and/or government. In particular, TMAC will approach GN Family Services (or other GN department as appropriate) to solicit input and/or participate in the delivery of programming to Project workers.
TMAC Liaison The TMAC Liaison assists in identifying and developing wellness initiatives for the workforce, and aids in identifying wellness needs of employees, as appropriate.

www.erm.com Version: C.1 Project No.: 0510704-0008 Client: TMAC Resources Inc. July 2020 Page 10-1
HOPE BAY PROJECT 2019 Socio-economic Monitoring Program
CONCLUSIONS
10. CONCLUSIONS
10.1 Summary of Results A total of 60 socio-economic indicators comprise the SEMP. TMAC provided data for 42 indicators. The remaining community-level indicators required data from other sources, including the GC, GN, NBS, NHC, RCMP, and NAC. The socio-economic indicators are updated annually and, where possible, include information for the most recent calendar year. However, due to the revisions of the SEMP Plan implemented in 2019, the SEMP report has now a number of new or modified indicators for which historical data is not available. This resulted in variation of how the collected data were reported and interpreted. Going forward, all indicators will be updated annually if possible.
Key results from the Hope Bay SEMP for 2019 include the following:
Economic Development
TMAC made payments of $10.8 million to the KIA, NTI and the Kitikmeot Corporation to promote the social, economic, and cultural well-being of Inuit in Nunavut.
TMAC made payments of $1.6 million in various taxes to the GN; additional benefits were from the purchase of diesel fuel by the Project, with tax paid at the wholesale level.
Contracting and Business Expenditures
TMAC spent $204.1 million on contracts with businesses from Nunavut and beyond.
TMAC awarded $91.5 million in contracts to Nunavut businesses, this being equivalent to all contracts awarded to KQB/Inuit owned businesses that year.
TMAC’s procurement from KQBs continues to increase with a positive effect on Kitikmeot business development.
Employment
TMAC and contractors hired up to 760 workers with an average workforce effort of 1,987 hours per worker.
There were as many as 63 Kitikmeot Inuit working at the Project, representing 8% of the total workforce size.
There were up to 15 Inuit from outside of the Kitikmeot region working at the Project, comprising on average 2% of the total workforce.
By community, up to 33 workers were from Cambridge Bay, 17 from Gjoa Haven, 14 from Kugluktuk, five from Kugaaruk and two from Taloyoak.
TMAC workforce as of December 31, 2019 included 33 Inuit workers, representing 13% of total TMAC workforce.
Workforce effort by women represented 11% of the total workforce effort.
Workforce effort by Inuit women represented 3% of the total workforce effort.
Total employment income reached $30.8 million for all workers, of that, $2.5 million was paid to Inuit workers.
Employee turnover rate for all Project employees, including Inuit, is as expected for a Project such as this (26% for all employees, and 35% for Inuit employees).

www.erm.com Version: C.1 Project No.: 0510704-0008 Client: TMAC Resources Inc. July 2020 Page 10-2
HOPE BAY PROJECT 2019 Socio-economic Monitoring Program
CONCLUSIONS
There was one lost time incident and 76 minor injuries.
TMAC provided 158 hours of general training to Inuit workers, 458 hours of health and safety related training, and 7,754 hours of work-related training.
Two apprenticeship position have been created thus far at the Project.
Inuit employees held a mix of unskilled, semi-skilled and skilled positions, while being underrepresented in professional and management positions.
By department, Inuit employees worked in site operations and site services, and to a lesser degree in exploration, environment and corporate.
Twelve skilled workers left employment in community for employment at the mine while 23 new TMAC hires were previously unemployed.
Education and Training
The Kitikmeot NAC campus is not currently offering any mining-related courses.
TMAC hosted Career Awareness Session in each Kitikmeot Community, delivered high school specific awareness presentations to schools in Kugluktuk and Cambridge Bay, provided ten High School Achievement Awards, delivered a Cross Cultural and Life at Camp presentation to Diamond Driller training class in Cambridge Bay, and hosted a site tour to high school achievement award winners.
High school enrollment remained relatively stable in the Kitikmeot region in 2017; information for 2018 and 2019 was not available at the time of writing this report.
High school completion in 2017 increased in Gjoa Haven and Kugluktuk, remained the same in Cambridge Bay, and decreased in Kugaaruk and Taloyoak; information for 2018 and 2019 was not available at the time of writing this report.
Population Demographics
Population increased in Kugaaruk and Taloyoak in 2018, while it decreased in the remaining communities; information for 2019 was not available at the time of writing this report.
TMAC employees did not migrate to the Kitikmeot region.
Community Infrastructure and Public Services
The number of people on public housing waitlist increased in most communities with the exception of Cambridge Bay that had one less person on the list and with no change in Kugluktuk. The number of people on the public housing waitlist exceeded the number of available public housing in all communities.
Housing status of Project employees is unknown; the housing status survey is to be developed in the coming years.
The Project did not use GN emergency services.
Information on visits to health centres in 2017, 2018 and 2019 was not available at the time of writing this report.
The number of social assistance cases slightly decreased in 2018; information for 2019 was not available at the time of writing this report.
There was an increase in the number of police calls in all communities with the exception of Gjoa Haven and Kugaaruk where the number of calls decreased; overall the number of police call increased in the Kitikmeot region.

www.erm.com Version: C.1 Project No.: 0510704-0008 Client: TMAC Resources Inc. July 2020 Page 10-3
HOPE BAY PROJECT 2019 Socio-economic Monitoring Program
CONCLUSIONS
There was an increase in the overall crime rate in 2017; information for 2018 and 2019 was not available at the time of writing this report.
Individual and Community Health and Wellness
Twelve Inuit left TMAC employment, with four terminated by TMAC, four whose contract expired, and four voluntary terminations. Reasons for leaving included family commitments and career advancement.
Financial literacy training was abandoned to due lack of interest.
The regional sale of alcoholic beverages increased significantly in 2018, likely attributed to the opening of the first beer and wine store in Nunavut; information for 2019 was not available at the time of writing this report.
Impaired driving violations, drug-related violations and the number of assaults all increased in 2017; information for 2018 and 2019 was not available at the time of writing this report.
Data on food prices is not available for 2019.
Low-income information for families for 2017, 2018 and 2019 was not available at the time of writing this report.
10.2 Management Response The review and analysis of Project-specific indicators and trends over time suggest the following management responses:
Continue to encourage Kitikmeot Inuit to seek employment with the Project.
Continue to encourage and support the participation of women in the Project’s workforce.
As enabled by the provisions of the IIBA, continue to encourage contractors to rely on Inuit workers, and demonstrate a preference for Kitikmeot Qualified Businesses and other contractors with Inuit content as defined by the IIBA.
As enabled by the provisions of the IIBA, continue to support the development of skills and worker readiness for employment by working with the KIA, GN, NAC and other organizations. Continue to work with GN and NAC on the development and implementation of courses and programs that are relevant to the mining industry for Inuit.
Continue to monitor the diversity of job types held by Inuit and advancement into more senior roles. TMAC expects this to evolve further over time as Inuit skill levels increase, as well as the interest in mining career opportunities.
Continue to work with the GN NBS and other government departments to encourage the updating of government statistics, as the lack of current data for a number of community-level indicators is having an increasingly negative impact on the SEMP.
TMAC will continue to track Project-specific indicators as defined by the Hope Bay SEMP, and respond to any issues or concerns arising in consultation with NIRB, the GN, CIRNAC, and the KIA, as appropriate. TMAC will continue to participate in and contribute to the Kitikmeot SEMC.

www.erm.com Version: C.1 Project No.: 0510704-0008 Client: TMAC Resources Inc. July 2020 Page 11-1
HOPE BAY PROJECT 2019 Socio-economic Monitoring Program
REFERENCES
11. REFERENCES
Definitions of the acronyms and abbreviations used in this reference list can be found in the Glossary and Abbreviations section.
1985. Criminal Code, RSC. C.C-46.
1998. Corruption of Foreign Public Officials Act, SC. C.34.
Acbayaan, J. 2020. Nunavut Arctic College: 2020-2021 Academic Programs. https://static1.squarespace.com/static/5b1954d75cfd798b94327249/t/5e62bee348078258c317b80c/1583529701156/2020-2021-Program-Offerings.pdf (accessed March 2020).
AMEC. 2007. Miramar Hope Bay Limited Socio-Economic Monitoring Program for the Doris North Gold Project. August 2007.
CBC News. 2019. Beer and wine sales up in Nunavut, liquor sales down. May 15, 2019. https://www.cbc.ca/news/canada/north/beer-and-wine-up-liquor-down-1.5136188 (accessed March 2020).
ERM. 2015. Doris North Project: Revisions to TMAC Resources Inc. Amendment Application No. 1 of Project Certificate No. 003 and Water Licence 2AM-DOH1323 – Package 4 Identification of Potential Environmental Effects and Proposed Mitigation. Prepared for TMAC Resources Inc. by ERM Consultants Canada Ltd.: Vancouver, BC. (accessed March 2019).
ERM. 2019. Hope Bay Project: 2018 Socio-economic Monitoring Program Update. Prepared for TMAC Resources Inc. by ERM Consultants Canada Ltd.: Vancouver, BC. December 2019.
GC. 2019. Table 10-10-0010-01 Sales of alcoholic beverages types by liquor authorities and other retail outlets, by value, volume, and absolute volume. https://www150.statcan.gc.ca/t1/tbl1/en/cv.action?pid=1010001001 (accessed March 2020).
George, J. 2019. News 3 October 2019 – 1:00 pm EDT. Cambridge Bay groundbreaking ushers in new Nunavut Arctic College campus. Nunatsiaq News, October 3, 2019. News. https://nunatsiaq.com/stories/article/cambridge-bay-ground-breaking-ushers-in-new-nunavut-arctic-college-campus/ (accessed May 2020).
GN. 2012. Nunavut Public School Truancy Rate: 2001-2002 to 2010-2011. https://www.gov.nu.ca/executive-and-intergovernmental-affairs/information/social-data (accessed March 2020).
GN. 2014. Nunavut, Regional and Community Population Projections 2014 to 2035. https://www.gov.nu.ca/executive-and-intergovernmental-affairs/information/population-data (accessed March 2020).
GN. 2015a. Nunavut Food Price Survey, Comparison of 24 Select Food Items Basket, 2014-2015. https://www.gov.nu.ca/executive-and-intergovernmental-affairs/information/economic-data (accessed March 2020).
GN. 2015b. Nunavut Public School Attendance Rate, 2001-2002 to 2013-2014. https://www.gov.nu.ca/executive-and-intergovernmental-affairs/information/social-data (accessed March 2020).
GN. 2016. Nunavut Food Price Survey, Comparison of 24 Select Food Items Basket, 2015-2016. https://www.gov.nu.ca/executive-and-intergovernmental-affairs/information/economic-data (accessed March 2020).

www.erm.com Version: C.1 Project No.: 0510704-0008 Client: TMAC Resources Inc. July 2020 Page 11-2
HOPE BAY PROJECT 2019 Socio-economic Monitoring Program
REFERENCES
GN. 2017a. Nunavut Food Price Survey, Comparison of 24 Select Food Items Basekt, 2016-2017. https://www.gov.nu.ca/executive-and-intergovernmental-affairs/information/economic-data (accessed March 2020).
GN. 2017b. Nunavut Secondary School Graduates by Community 1999-2016. https://www.gov.nu.ca/executive-and-intergovernmental-affairs/information/social-data (accessed March 2020).
GN. 2018a. 2018-2017 Nunavut Food Price Survey – Comparison of 24 Select Food Items Basket. https://www.gov.nu.ca/executive-and-intergovernmental-affairs/information/economic-data (accessed March 2020).
GN. 2018b. Nunavut Annual Migration Estimates, July 1 to June 30, 1999 to 2018. https://www.gov.nu.ca/executive-and-intergovernmental-affairs/information/population-data (accessed March 2020).
GN. 2018c. Nunavut Community Health Centre Visits: 2003 to 2016. https://www.gov.nu.ca/executive-and-intergovernmental-affairs/information/social-data (accessed March 2020).
GN. 2018d. Nunavut Criminal Violations by Region and Community, 1999 to 2017. https://www.gov.nu.ca/executive-and-intergovernmental-affairs/information/social-data (accessed March 2020).
GN. 2018e. Nunavut Criminal Violations by Type and Community, 1999 to 2017. https://www.gov.nu.ca/executive-and-intergovernmental-affairs/information/social-data (accessed March 2020).
GN. 2018f. Nunavut Population Estimates by Region and Community, 2001 to 2017. https://www.gov.nu.ca/executive-and-intergovernmental-affairs/information/population-data (accessed March 2020).
GN. 2018g. Nunavut Public School Enrollment by Community, Region & Territory 2003 - 2017. https://www.gov.nu.ca/executive-and-intergovernmental-affairs/information/social-data (accessed March 2020).
GN. 2018h. Nunavut Public School Enrolment by Grade, 2003 to 2017 (6 tables). https://www.gov.nu.ca/executive-and-intergovernmental-affairs/information/social-data (accessed March 2020).
GN. 2019a. Nunavut Deaths by Month, 2002 to 2018.xls. https://www.gov.nu.ca/executive-and-intergovernmental-affairs/information/population-data (accessed March 2020).
GN. 2019b. Nunavut Live Births and Fetal Deaths, 2001 to 2018 (8 Tables). https://www.gov.nu.ca/executive-and-intergovernmental-affairs/information/population-data (accessed March 2020).
GN. 2019c. Nunavut Population Estimates by Sex, Age Group, Region and Community, 2018 (3 tables). https://www.gov.nu.ca/executive-and-intergovernmental-affairs/information/population-data (accessed March 2020).
GN. 2019d. Nunavut Social Assistance Average Monthly Caseload by Community, Region and Territory, 2004 to 2018. https://www.gov.nu.ca/executive-and-intergovernmental-affairs/information/social-data (accessed March 2020).
GN. 2019e. Nunavut Taxfilers with Low Income by Region and Community, 2004 to 2016. https://www.gov.nu.ca/executive-and-intergovernmental-affairs/information/economic-data (accessed March 2020).
www.erm.com Version: C.1 Project No.: 0510704-0008 Client: TMAC Resources Inc. July 2020 Page 11-3
HOPE BAY PROJECT 2019 Socio-economic Monitoring Program
REFERENCES
KIA & TMAC. 2015. March 30, 2015 Hope Bay Belt Project Inuit Impact and Benefit Agreement (IIBA) between Kikikmeot Inuit Association (KIA) and TMAC Resources Inc.
MiHR. 2017. Canadian Mining Labour Market Outlook. https://www.mihr.ca/pdf/publications/National-Report-2017_EN_WEB.pdf (accessed March 2019).
MiHR. 2019. Canadian Mining Labour Market Outlook. https://www.mihr.ca/pdf/publications/WEB_MiHR_Labour_Market_Outlook_2019.pdf (accessed March 2019).
MMC. 2005. Chapters 25 and 26 of the Doris North Technical Report – FEIS. (accessed March 2019).
NAC. 2018. Annual Report 2017-2018. https://static1.squarespace.com/static/5b1954d75cfd798b94327249/t/5ca4cbac41920228e466b7c5/1554304053430/NAC-Annual-Report-2017-2018-online-EN.pdf (accessed March 2020).
NAC. 2019. Annual Report 2018-2019. https://assembly.nu.ca/sites/default/files/TD-240-5(2)-EN-NAC-Annual-Report-2018-2019.pdf (accessed March 2020).
NHC. 2016. Nunavut Down-payment Assistance Program. https://www.gov.nu.ca/sites/default/files/fillpdf/11.2._nhc_-_nunavut_down_payment_assistance_policy_1016.pdf (accessed March 2019).
NHC. 2019. Public Housing. http://www.nunavuthousing.ca/publichousing (accessed March 2019).
NIRB. 2003. Environmental Impact Statement (EIS) Guidelines for the Doris Hinge Project.
NIRB. 2012. Guidelines for the Preparation of an Environmental Impact Statement for Hope Bay Mining Ltd.’s Phase 2 Hope Bay Belt Project (NIRB File No. 12MN001) Nunavut Impact Review Board: Cambridge Bay, NU. (accessed March 2019).
NTI. 2020. Search the Registry. https://inuitfirm.tunngavik.com/search-the-registry/ (accessed March 2020).
Nunatsiaq News. 2019a. Nunavut’s second beer and wine store to open within a year. May 15, 2019. https://www.cbc.ca/news/canada/north/beer-and-wine-up-liquor-down-1.5136188 (accessed March 2020).
Nunatsiaq News. 2019b. Two Kitnuna companies declare bankruptcy Nunatsiaq News, November 8, 2019. News. https://nunatsiaq.com/stories/article/two-kitnuna-companies-declare-bankruptcy/ (accessed March 2020).
TMAC. 2017. Madrid-Boston Project: Final Environmental Impact Statement. TMAC Resources Inc.: Toronto, ON. (accessed March 2019).
TMAC. 2018. Management's Discussion and Analysis. https://s1.q4cdn.com/893791552/files/doc_financials/2018/Q4/21/TMAC-2018-Q4-MD-A.pdf (accessed March 2019).
TMAC. 2019a. Audited Financial Statements. https://s1.q4cdn.com/893791552/files/doc_financials/2018/Q4/TMAC-Financial-Statements-Q4-2018.pdf (accessed March 2019).
TMAC. 2019b. Condensed Interim Financial Statements September 30, 2019 (Unaudited). https://s1.q4cdn.com/893791552/files/doc_financials/2019/q3/TMAC-Financial-Statements-Q3-2019-_Filing-Copy.pdf (accessed April 2020).
TMAC. 2020. Investors Presentation: Building Canada's Next Gold Mining District. https://s1.q4cdn.com/893791552/files/doc_presentations/2020/04/2020-04-TMAC-Investor-Presentation.pdf (accessed April 2020).

www.erm.com Version: C.1 Project No.: 0510704-0008 Client: TMAC Resources Inc. July 2020 Page 11-4
HOPE BAY PROJECT 2019 Socio-economic Monitoring Program
REFERENCES
Personal Communications
Chimhanda, T. 2020. Policy Analyst – Corporate Policy, Nunavut Housing Corporation. Personal Communication.
Elliot, G. 2010. RCMP Sargent, Iqaluit RCMP Detachment, Iqaluit, NU. Personal Communication.
Elliot, G. 2011. RCMP Sargent, Iqaluit RCMP Detachment, Iqaluit, NU. Personal Communication.
Elliot, G. 2012. RCMP Sargent, Iqaluit RCMP Detachment, Iqaluit, NU. Personal Communication.
Head. R. 2013. Sargent, Iqaluit RCMP Detachment, Iqaluit, NU. Personal Communication.
Lalonde, Jean-Guy. 2015. Sargent, Cambridge Bay RCMP Detachment, Cambridge Bay, NU. Personal Communication.
Lalonde, Jean-Guy. 2016. Sargent, Cambridge Bay RCMP Detachment, Cambridge Bay, NU. Personal Communication: via GN Department of Economic Development and Transportation (Mineral and Petroleum Resources).
PSE Chenier, K. 2017. Detachment Services Assistant. Cambridge Bay RCMP. Personal Communication.
PSE Chenier, K. 2018. Detachment Services Assistant. Cambridge Bay RCMP. Personal Communication.
Sirotic, M. 2014. Royal Canadian Mounted Police, Iqaluit, NU. Personal Communication.
van Winssen, Ilse. 2019. Senior Policy Analyst. Nunavut Housing Corporation. Personal Communication.

www.erm.com Version: C.1 Project No.: 0510704-0008 Client: TMAC Resources Inc. July 2020
HOPE BAY PROJECT 2019 Socio-economic Monitoring Program
APPENDIX A SUMMARY OF PROJECT ACTIVITIES, 2013 TO 2019

www.erm.com Project No.: 0510704-0008 Client: TMAC Resources Inc. Page 1 of 5
HOPE BAY PROJECT 2019 Socio-economic Monitoring Program
APPENDIX A: SUMMARY OF PROJECT ACTIVITIES, 2013 TO 2019
Appendix A: Summary of Project Activities, 2013 to 2019
Activities in 2013
In March 2013, the Hope Bay Project, including existing licences and permits associated with the Doris
Project, was acquired by TMAC, with Newmont remaining as the main shareholder. The acquisition of the
Hope Bay Project included the signing of a Memorandum of Understanding between TMAC, Newmont
and the Kitikmeot Inuit Association (KIA) to transfer existing surface access agreement to the new
company. At that time, TMAC was a privately held company based in Toronto, Canada. The company’s
vision and sole focus is the responsible and economically sustainable exploration, development and
mining of the Belt.
TMAC took Doris Camp and the Hope Bay Project out of seasonal unmanned closure March 22, 2013 in
support of advanced exploration and environmental compliance work. Environmental work began in
April 2013; the exploration drilling program commenced in June 2013.
As a new corporate entity, TMAC began in 2013 to develop and implement the financial, human resource,
project management, environmental management, and safety systems necessary to support and govern
future operations at Hope Bay.
TMAC conducted a Kitikmeot community tour in late March to inform stakeholders about project
acquisition and introduce the new company to the region. Also in late March, Doris Camp was reopened
to support environmental compliance monitoring and a gold exploration program, including surface
diamond drilling with a target of 30,000 metres of drilling for the year.
During the spring, summer, and fall, work at the Doris North mine site was limited to regular site
maintenance activities; underground workings were still sealed and several mining-related buildings
remained in care and maintenance. In August 2013, a sealift of supplies was received from the western
Arctic, and previously de-mobilized equipment was shipped back from Quebec.
During 2013, TMAC continued efforts to renew the Doris North Type A Water Licence. This work
culminated in September 2013 with the ten year renewal of the licence. At the end of 2013, TMAC
submitted a Water Licence amendment and commensurate NIRB Project Certificate amendment package
outlining proposed changes to the future operation of the Doris North Mine. With the Doris North Inuit
Owned Land (IOL) commercial lease expiry set for September 2013, TMAC was successful in renewing
this lease for a period of five years.
TMAC’s focus in 2013 centered on mine planning and the completion of a Preliminary Economic
Assessment (PEA) of the Hope Bay Project, an assessment that would inform future development plans
and form the basis for continued funding of gold mining efforts at Hope Bay.
Activities in 2014
In 2014, TMAC continued activities aimed at bringing the Hope Bay project into production.
These activities included land tenure negotiations, advanced exploration, re-opening the Doris North
underground workings, process plant design and mine planning, licencing and permitting, and economic
analysis aimed at producing a Pre-Feasibility Study.
TMAC opened discussions with Nunavut Tunngavik Incorporated (NTI) and the KIA in order to secure
long-term land tenure to the IOL parcels that comprise almost all of the Hope Bay Belt area. Significant
progress was achieved in obtaining a new Mineral Exploration Agreement (MEA) to allow for continued

www.erm.com Project No.: 0510704-0008 Client: TMAC Resources Inc. Page 2 of 5
HOPE BAY PROJECT 2019 Socio-economic Monitoring Program
APPENDIX A: SUMMARY OF PROJECT ACTIVITIES, 2013 TO 2019
mineral exploration and production at Hope Bay, as well as in the drafting of a Framework Agreement that
governs how TMAC can access the surface of these lands for mining and exploration in the future.
Advanced exploration work in 2014 included 67,000 metres of diamond drilling primarily focused on
upgrading resource estimates at the Doris North and Madrid deposits. Additionally, several metallurgical
samples were collected and analyzed for mill design purposes.
Repair and maintenance work was conducted at the Doris Project to maintain facilities in operational
readiness for continued Care and Maintenance and eventual production. In 2014, chief amongst these
activities was obtaining Mine Inspector approval to open the Doris underground to TMAC personnel.
Additionally, the Roberts Bay jetty was repaired, the Doris airstrip was resurfaced, the main power plant
was brought on-line again, and an existing maintenance facility was enlarged.
In 2014, process plant design was advanced, and drilling results were incorporated into the TMAC
business case for the Hope Bay project. These results were summarized in a new Pre-Feasibility Study
(PFS) which was finalized in April 2015 and included the updated and increased Doris resource estimate.
With respect to licencing and permitting, TMAC conducted a number of relevant activities in 2014.
A successful field season of compliance monitoring was conducted pursuant to existing licence and
permit requirements for care and maintenance. TMAC continued preparation work aimed at updating the
Type A Water Licence Amendment application in line with new mine planning strategies. Also, a new
Type B Water Licence application, seeking approval for bulk sampling the Madrid Deposit at two
locations, was submitted in 2014.
In 2014, TMAC launched a Facebook page in order to better communicate with stakeholders, participated
in initial NIRB community consultation regarding the Type A Water Licence Amendment, and completed
one Kitikmeot community tour to provide the public with an update on the Hope Bay project.
TMAC took the Doris North permitted gold project out of Care and Maintenance status and began working
towards completing mine construction to start gold production at the Doris Deposit in early 2017.
Activities in 2015
In March 2015, TMAC successfully concluded negotiations with both the KIA and NTI, gaining long-term
surface and subsurface access to the IOL portion of the Hope Bay Project. Surface access was secured
for a 20 year period by means of a Framework Agreement that provides for a number of benefits to
Kitikmeot Inuit including TMAC shares, a Net Smelter Royalty, and annual payment. In exchange, the KIA
granted TMAC access to Hope Bay IOL for a broad range of exploration and mine development activities.
Part of the Framework Agreement provides for a new Inuit Impact and Benefit Agreement (IIBA) that
applies to the entire project. The existing Doris North IIBA was replaced with this agreement. Additionally,
the existing Doris North Commercial Lease was replaced with an updated and renewed version.
Under the terms of the new IIBA, TMAC and the KIA concluded two Implementation Committee meetings.
The IIBA Implementation Committee is intended to facilitate and support the successful execution of IIBA
employment, training and contracting provisions. Additionally, TMAC and the KIA concluded two Inuit
Environmental Advisory Committee (IEAC) meetings in 2015.
With respect to subsurface rights, TMAC obtained a new MEA from the NTI for a 20 year period. Updated
royalty provisions are included in this new agreement. Seven existing and expiring Mineral Concession
Agreements were replaced with this one agreement. Subsequently in August, TMAC activated the
Production Lease provisions of the new NTI MEA for the Doris Deposit. This sub agreement allows for
the production of gold from this deposit.
In April, TMAC released a new PFS for the Hope Bay Project (RPA Inc., 2015). In brief, the PFS
supported the sequential development and underground mining of the three known deposit trends at

www.erm.com Project No.: 0510704-0008 Client: TMAC Resources Inc. Page 3 of 5
HOPE BAY PROJECT 2019 Socio-economic Monitoring Program
APPENDIX A: SUMMARY OF PROJECT ACTIVITIES, 2013 TO 2019
Doris, Madrid, and Boston. The development plan in the PFS includes conventional high-grade
underground mining that makes use of existing surface and underground infrastructure. The updated
mineral resources estimate in the PFS includes 4.5 million ounces of gold in the Measured and Indicated
categories, as well as TMAC’s first reported Proven and Probable Reserves estimate of 3.5 million
ounces in support of an initial 20 year mine life.
In the 2015 Amendment Application, TMAC extended the mine life for the Doris Project from a two year
period of operations to six years through mining two additional mineralized zones (Doris Connector and
Doris Central zones) to be accessed via the existing Doris North portal. The expanded mining program
would also increase the approved mining and milling rates to 2,000 tonnes per day, and require the
restructuring of the TIA to be managed as subaerial tailings with treated effluent being transported via a
pipeline for discharge into Roberts Bay. A larger anticipated workforce has required an increase to the
Doris Camp size.
Also in 2015, TMAC ceased being a privately held company by means of an Initial Public Offering of its
shares. This offering managed to raise aggregate gross proceeds of $135 million. These proceeds will be
used to advance the Hope Bay Project. Furthermore, TMAC obtained a US $120 million senior secured
term loan in July 2015. With this financing in place, TMAC was able to complete construction of the Doris
mine and begin gold production in early 2017.
Operationally, TMAC continued with near deposit diamond-drill exploration by Doris and Madrid in 2015,
with the addition of an airborne geophysics program focused on nearby Elu belt Crown mineral claims.
At Doris Camp, TMAC undertook a number of activities including commissioning the automated controls
for the existing four generator primary powerhouse at Doris, and the purchase of construction equipment
to erect the processing plant building in 2016. Further, TMAC designed and completed fabrication of the
processing plant building, initiated on-site construction of the processing plant building foundations, and
completed the Gekko processing plant flowsheet design. TMAC took advantage of the opening of quarries
and the initiation of earthworks related to the process plant foundation construction to opportunistically
advance Doris Airstrip improvements aimed at lengthening and widening the airstrip. Finally, TMAC
ordered long lead time items and initiated fabrication of the processing plant.
Underground operations continued in 2015. Significant activities included delivery of narrow-vein test mining
equipment via an airlift in the spring and the purchase of mobile mine equipment capable of mining at a rate
of 1,000 tonnes per day for delivery via sealift. TMAC also developed a narrow vein undercut test drift at
Doris to validate the PFS mining model and cost assumptions, ordered the first year mining supplies for
delivery by sealift, initiated and completed the widening of the Doris Mine vent raise to incorporate escape-
way infrastructure, and completed a tactical plan for mine development and production.
In the fall, TMAC successfully concluded the 2015 sealift including the purchase and delivery of 15 million
litres of diesel fuel and delivery of the processing plant building materials to Hope Bay to allow for
erection of the building in the second and third quarters of 2016.
In October, TMAC concluded a Kitikmeot-wide community consultation tour aimed at explaining the Doris
amendment application and providing a general project update. Public meetings were well attended and
valuable comments received.
Activities in 2016
In 2016, TMAC focused on completing the construction of Doris Mine. This included earthworks to
complete the TIA, establish an explosives magazine, construct the process plant building and conduct a
large sealift including the shipment of machinery for the process plant. The process plant was assembled
in preparation for commissioning.

www.erm.com Project No.: 0510704-0008 Client: TMAC Resources Inc. Page 4 of 5
HOPE BAY PROJECT 2019 Socio-economic Monitoring Program
APPENDIX A: SUMMARY OF PROJECT ACTIVITIES, 2013 TO 2019
Concurrent with construction, underground mining continued throughout 2016 with the aim of stockpiling
a quantity of ore at the surface in advance of processing.
TMAC permitting accomplishments in 2016 included the completion two public regulatory processes
which resulted in the issuance of:
an amended Doris North NIRB Project Certificate (No. 003, dated September 23, 2016); and
an amended Type A Water Licence for the Doris Project (2AM-DOH1323 issued by the NWB, dated
December 16, 2016).
During the latter part of 2016, TMAC began recruitment efforts aimed at developing a production
workforce for the Doris mine.
Activities in 2017
TMAC commenced commercial production at Doris Mine in 2017, processing a total of 150,700 tonnes of
ore mined at a grade of 11.5 g/t, containing 55,700 ounces of gold during the year. First gold was poured
at Doris Mine in February, and a mine opening ceremony was conducted including community and
territorial leaders in April. The focus of work at Doris Mine has been to optimize process plant availability
and throughput.
In May, TMAC obtained a Type B Water Licence from the Nunavut Water Board that allows for underground
bulk sampling of the Madrid deposit at two locations. Further, in the summer of 2017, TMAC undertook an
underground drilling program at Doris Mine in order to examine the gold resource at depth below a diabase
dyke (BTD – Below the Dyke) that intersects the ore body. This work also included exploration work at
Boston Camp to further understand the Boston deposit and to support mine planning for Phase 2 (Madrid-
Boston). The drilling program at Boston confirmed high grade gold zones and the potential to increases
these resources, as well as Boston’s potential exploration upside, along strike and at depth.
In 2017, NIRB concluded its review of the Hope Bay Phase 2 (Madrid-Boston) Draft Environmental Impact
Statement (DEIS). TMAC conducted a series of meetings in the Kitikmeot during the fall of 2017 to provide
communities with updates on the Hope Bay Project, including the DEIS. Following this, TMAC submitted the
Final Environmental Impact Statement (FEIS) for the proposed Madrid-Boston development in December.
Activities in 2018
In 2018, commercial operations continued at Doris. TMAC produced over 110,000 ounces of gold during
the year. Infrastructure constructed included a fabric tent structure over the primary crusher of the mill and
an enclosure for the detoxified tailings conveyor exiting the mill building. Two dorms were added to allow
an additional 98 beds at the Doris site. Construction of the Tailings Impoundment Area South Dam and
associated access road were completed in 2018. In addition to this, construction of the access road and
outfall berm for the Roberts Bay ocean discharge line and fusing of the discharge pipeline began in 2018.
To accommodate increased fuel storage required for future project activities, the Roberts Bay single tank
farm berm was raised to allow full use of the 5 ML tank and this tank was recommissioned in 2018. In
order to support continued underground development, the Doris Connector Vent Raise access road was
constructed. The final section of Pad T was completed in 2018 to allow additional ore and waste rock
storage within the permitted footprint.
In the fall, TMAC concluded another successful sealift operation including the purchase and delivery of
diesel fuel and Jet-A fuel as well as explosives and reagents to support mining and milling activities. The
sealift also included additional heavy equipment and supplies to support mining and construction operations.
In 2018, the focus of TMAC’s permitting efforts were on the Madrid-Boston (Phase 2) Project.
The Madrid-Boston Project FEIS was submitted to NIRB in December 2017, the FEIS final hearing was

www.erm.com Project No.: 0510704-0008 Client: TMAC Resources Inc. Page 5 of 5
HOPE BAY PROJECT 2019 Socio-economic Monitoring Program
APPENDIX A: SUMMARY OF PROJECT ACTIVITIES, 2013 TO 2019
held in May 2018, and Project Certificate No. 009 was awarded in November 12, 2018. The final
permitting for the Madrid-Boston Project was completed on January 14, 2019 with the approval of two
Type A Water Licence as recommended by the NWB on December 7, 2018 and concluded the final step
in the environmental permitting process that enables mine development at Madrid North, Madrid South
and Boston, with connecting all-weather roads.
Community consultation in 2018 focused on engaging positively and effectively with local communities
regarding TMAC operations, employment and contracting opportunities and consultation on TMAC’s
Boston-Madrid Project. TMAC conducted community tours of Kugluktuk, Cambridge Bay, Kugaaruk,
Taloyoak, and Gjoa Haven in both March and October 2018. The purpose of the March 2018 Community
Tour was to share a Hope Bay Project update and seek public input on the proposed Boston-Madrid
Project, and the purpose of the October 2018 Community Tour was to offer an opportunity to ask questions
and to raise awareness on Human Resources related matters such as jobs and skill training opportunities.
Activities in 2019
In 2019 commercial operations continued at Doris with efforts focused on progressively ramp up
production to increase ore throughput and optimize gold recovery. TMAC produced over 139,000 ounces
of gold during the year.
Civil construction activities included the completion of the Roberts Bay Discharge System (RBDS) and
installation of the associated underground mine dewatering and Tailings Impoundment Area (TIA)
discharge pipelines and pumping infrastructure. The ocean discharge pipeline was successfully installed
into Roberts Bay during the open water season. As part of this system, a Water Treatment Plant was
constructed to remove Total Suspended Solids from underground mine water at Doris prior to discharge
through the RBDS. No discharge occurred to Roberts Bay in 2019. At the Doris site one dorm was added
to allow an additional 48 bed spaces and at Roberts Bay and an additional 5 million litre fuel tank was
constructed at the Fuel Storage and Containment facility.
Earthworks began at the Madrid North site to support the commencement of mining of the Naartok East
Crown Pillar and Madrid North underground decline. This included construction of the first kilometre of the
Madrid North all-weather-road, the Madrid North Contact Water Pond, and construction of the Madrid
North Waste Rock storage pad. Laydown space and access roads were constructed to support shop
facilities, lunchroom/offices and wash car facilities. An overburden stockpile was established to store
overburden removed during mining of the Naartok East Crown Pillar.
In the fall, TMAC concluded another successful sealift operation including the purchase and delivery of
diesel fuel, as well as supplies to support mining and milling activities. The sealift also included additional
heavy equipment and supplies to support mining and construction operations.
Consultations in 2019 included two workshops with the Inuit Environmental Advisory Committee (IEAC).
The focus of these meetings were to advance the Fisheries No Net Loss Plan and work through viable
options for caribou monitoring in relation to the Madrid-Boston Project. The workshops were successful at
communicating objectives and gaining and documenting perspectives from the IEAC on potential fisheries
and caribou monitoring programs. TMAC also initiated a capacity building program for Inuit Environmental
Assistants working at Hope Bay. The program was successful in documenting skills learned during the
field season and promoting regular coaching sessions for information exchange, with the overall objective
of building a larger and sustainable Inuit environmental workforce. In October 2019, TMAC conducted
Career Awareness Sessions in each of the five Kitikmeot communities. As part of the Socio-economic
Monitoring Program, TMAC continued to engage with the Hope Bay Socio economic Monitoring Working
Group (SEMWG); work completed with the SEMWG in 2019 included a comprehensive update of the
Hope Bay Socio-economic Monitoring Program. In 2019, TMAC was also an active participant in the
annual meeting of the Kitikmeot Socio-economic Monitoring Committee held in Cambridge Bay.

The business of sustainability
ERM has over 160 offices across the following countries and territories worldwide
Argentina Australia Belgium Brazil Canada Chile China Colombia France Germany Guyana Hong Kong India Indonesia Ireland Italy Japan Kazakhstan Kenya Malaysia Mexico Mozambique Myanmar
The Netherlands New Zealand Norway Panama Peru Poland Portugal Puerto Rico Romania Russia Singapore South Africa South Korea Spain Sweden Switzerland Taiwan Tanzania Thailand UK US Vietnam
ERM’s Vancouver Office 1111 West Hastings Street, 15th Floor Vancouver, BC Canada V6E 2J3 T: +1 604 689 9460 F: +1 604 687 4277 www.erm.com