honduras: poverty reduction strategy paper progress report ... · pec school improvement plans pedm...
TRANSCRIPT

© 2005 International Monetary Fund March 2005 IMF Country Report No. 05/82
[Month, Day], 2001 August 2, 2001 January 29, 2001 [Month, Day], 2001 August 2, 2001
Honduras: Poverty Reduction Strategy Paper Progress Report
Poverty Reduction Strategy Papers (PRSPs) are prepared by member countries in broad consultation with stakeholders and development partners, including the staffs of the World Bank and the IMF. Updated every three years with annual progress reports, they describe the country's macroeconomic, structural, and social policies in support of growth and poverty reduction, as well as associated external financing needs and major sources of financing. This country document for Honduras, dated January 2005, is being made available on the IMF website by agreement with the member country as a service to users of the IMF website.
To assist the IMF in evaluating the publication policy, reader comments are invited and may be sent by e-mail to [email protected].
Copies of this report are available to the public from
International Monetary Fund • Publication Services 700 19th Street, N.W. • Washington, D.C. 20431
Telephone: (202) 623-7430 • Telefax: (202) 623-7201 E-mail: [email protected] • Internet: http://www.imf.org
Price: $15.00 a copy
International Monetary Fund
Washington, D.C.


ii

CCOONNTTEENNTTSS
LIST OF ABBREVIATIONS ---------------------------------------------------------------------------------------------------- 1 EXECUTIVE SUMMARY ------------------------------------------------------------------------------------------------------- 3 I. INTRODUCTION -------------------------------------------------------------------------------------------------------------- 9 II. REPORT CONSULTING PROCESS ------------------------------------------------------------------------------------13
A. Organization and Participating Sectors --------------------------------------------------------------------------------- 13 B. Results of the Consultation ------------------------------------------------------------------------------------------------ 14 C. Incorporation of the Results into the Report ---------------------------------------------------------------------------- 16
III. MACROECONOMIC FRAMEWORK --------------------------------------------------------------------------------17 A. International Panorama --------------------------------------------------------------------------------------------------- 17 B. National Economy ---------------------------------------------------------------------------------------------------------- 17
a. Macroeconomic overview --------------------------------------------------------------------------------------------- 17 b. Growth, investment and competitiveness---------------------------------------------------------------------------- 18 c. Fiscal Performance ----------------------------------------------------------------------------------------------------- 20 d. Monetary and Credit Policy ------------------------------------------------------------------------------------------- 21 e. Financial System-------------------------------------------------------------------------------------------------------- 22 f. Debt Sustainability ----------------------------------------------------------------------------------------------------- 22 g. Medium-term Implementation of the PRGF ------------------------------------------------------------------------ 23
IV. THE STATE OF POVERTY, PRSP GOALS AND GLOBAL INDICATORS ----------------------------25 A. Poverty and Inequality ----------------------------------------------------------------------------------------------------- 25 B. Global Performance Indicators------------------------------------------------------------------------------------------- 27
V. TRENDS IN POVERTY SPENDING --------------------------------------------------------------------------------31 A. Evolution of Poverty Spending-------------------------------------------------------------------------------------------- 31 B. Utilization of HIPC Funds------------------------------------------------------------------------------------------------- 36
a. Interim HIPC Debt Relief received----------------------------------------------------------------------------------- 36 b. Assignment of Debt Relief -------------------------------------------------------------------------------------------- 38 c. Remaining HIPC Debt Relief for the PRSP ------------------------------------------------------------------------- 39
VI. PROGRESS BY PROGRAMMATIC AREA --------------------------------------------------------------------41 A. Area I: Equitable and Sustainable Economic Growth ----------------------------------------------------------------- 41 B. Area II: Reducing Poverty in Rural Zones ------------------------------------------------------------------------------ 43 C. Area III: Reducing Poverty in Urban Zones ---------------------------------------------------------------------------- 45 D. Area IV: Investing in Human Capital------------------------------------------------------------------------------------ 46 E. Area V: Strengthening Protection for Specific Groups ---------------------------------------------------------------- 51 F. Guaranteeing the Strategy’s Sustainability ----------------------------------------------------------------------------- 53
VII. MEDIUM- AND LONG-TERM PLANNING ---------------------------------------------------------------------59 A. Medium- and Long-term Strategic Planning---------------------------------------------------------------------------- 59 B. Harmonizing Cooperation------------------------------------------------------------------------------------------------- 60
VIII. MONITORING AND EVALUATION ------------------------------------------------------------------------------63 A. the prsp information system ----------------------------------------------------------------------------------------------- 63 B. Impact Evaluation ---------------------------------------------------------------------------------------------------------- 64
IX. CHALLENGES FACING PRSP IMPLEMENTATION --------------------------------------------------------69

ii

1
LLIISSTT OOFF AABBBBRREEVVIIAATTIIOONNSS ADEL Local Development Association AFE State Forestry Administration AIEPI Comprehensive Care for Common Childhood Diseases AIN Comprehensive Care for Children AIN - C Comprehensive Community-Based Care for Children AMHON Honduran Municipalities Association BANADESA National Agricultural Development Bank BCH Central Bank of Honduras BCIE Central American Bank for Economic Integration CAD Teacher Education Center CAFTA Central American Free Trade Agreement CAMEL Test Capital Adequacy, Asset Quality, Management, Earnings and Liquidity. CARE Cooperative for Assistance and Relief Everywhere CCERP Consultative Council for the Poverty Reduction Strategy CCPET Consultative Council of the Program for Efficiency and Transparency in State Procurements and
Hiring CDA Center for Agro-Business CDC Commonwealth Development Corporation CEOT Territorial Planning Executive Council CEPREB Preschool Education Center CESCCO Center for the Study and Control of Contaminants CEVS Sula Valley Executive Commission CIF Price including cost, insurance and freight CIP Comprehensively Planned Tourism Center CNB National Primary School Curricula CNBS National Banking and Insurance Commission COHDEFOR Honduran Forestry Development Corporation CONADEH National Human Rights Commissioner CONATEL National Telecommunications Commission COPECO Permanent Contingencies Commission CPI Consumer Price Index DFID Department for International Development of the U.K. DGA Department of Environmental Management DICTA Department of Agricultural Science and Technology DPD Honduras Decision Point Document EFA Education for All Program ENCOVI Standard of Living Survey ENEE National Electricity Company ENESF National Epidemiological and Family Health Survey ENIGH National Household Income and Spending Survey EPHPM Permanent Multi-Purpose Household Survey FHIS Honduran Social Investment Fund FOB Free On Board FONAPROVI National Fund for Production and Housing FOSEDE Deposit Insurance Fund FSAP Financial Sector Evaluation Program FTA Free Trade Agreement GDP Gross Domestic Product G17 Group of 17 donors to Honduras H & A Harmonization and Alignment HIPC Heavily Indebted Poor Country HIV/AIDS Human Immunodeficiency Virus/Acquired Immune Deficiency Syndrome HONDUTEL Honduran Telecommunications Company HDI Human Development Index IBRD International Bank for Reconstruction and Development IDA International Development Association IDB Inter-American Development Bank IFAD International Fund for Agricultural Development IMF International Monetary Fund INE National Statistics Bureau INICE National Institute for Educational Research and Training ISV Sales Tax MAFOR Sustainable Management and Use of Softwood Forests MARENA Management Program for Natural Resources in Priority Watersheds

2
MDG Millennium Development Goals MIPYME Micro, Small and Medium Enterprises NFPS Non-Financial Public Sector NIR Net International Reserves ODA Official Development Assistance OMO Open-Market Operations ONCAE Normative Office for State Hiring and Acquisitions OPEC Organization of Petroleum Exporting Countries PACTA Land Access Project PANE VPN Percentage of Nominal Effective Debt Relief in terms of Current Net Value PAPIN Support Program for Indigenous and Black Populations PARA Rural Areas Administration Project (now PATH) PATH Honduran Land Administration Program PEC School Improvement Plans PEDM Strategic Municipal Development Plan PEGAH Gender Equity Policy for Honduran Agriculture PMRTN Master Plan for National Reconstruction and Transformation PPA Priority Protected Area PRRAC Central American Regional Reconstruction Program PRAF Family Allotment Program PRGF Poverty Reduction and Growth Facility PRIESS Institutional Reorganization and Extension of Health Care Services Program PRIMHUR Urban Renewal Program PROBAP Biodiversity Project for Priority Areas PROCUENCA Management Program for Renewable Natural Resources in the Cajón Reservoir Watershed PRODDEL National Decentralization Program PRODERT Sustainable Rural Development Project in Ecologically Fragile Zones in the Trifinio Region PROHECO Honduran Community Education Program PROMANGLE Management and Conservation Project for Mangroves in the Gulf of Fonseca PRONADERS National Sustainable Rural Development Program PRONOT National Territorial Organization Program PRSC World Bank Poverty Reduction Support Credits PRSP Poverty Reduction Strategy PSIA Poverty and Social Impact Analysis RENOT Registry of Territorial Organization Norms RNP National Registry of Persons SANAA National Water and Sewerage Service SEFIN Secretariat of Finance SERNA Secretariat of Natural Resources and Environment SIAFI Integrated System for Financial Management SIARHD Integrated Teacher Administration System SIERP System of Indicators for the Poverty Reduction Strategy SIFAR Alternative Rural Financing System SINIA National Environmental Information System SINIT National Territorial Information System SOPTRAVI Department of Public Works, Transportation and Housing STD Sexually Transmitted Disease SWAP Sector Wide Approach TNE National Elections Tribunal TRANSFORMA-CATIE Technology Transfer and Promotion of Professional Training in Natural Forest Management /
Tropical Agricultural Research and Higher Education Center UAM Municipal Environmental Unit UBN Unsatisfied Basic Needs UMCE Unit of Measurement for Educational Quality UNAH National Autonomous University of Honduras UNAT Technical Support Unit of the Office of the Presidential Secretariat UNDP United Nations Development Program UPEG Management Planning and Evaluation Unit WB World Bank

3
EXECUTIVE SUMMARY i. This report describes progress made in implementing the Honduran Poverty
Reduction Strategy (PRSP) from the time of its approval by the Government of Honduras in August 2001, through to the present. The report also monitors the economic and social programs that were defined in the original document and which were revised, following consultation with civil society in the First Progress Report and Update of the PRSP. This document, published in November 2003, recalibrated the Strategy’s goals and indicators and redefined poverty spending to ensure its consistency with the outlined objectives.
ii. As part of its strategy to achieve the PRSP objectives, the Government has
intensified actions to maintain a stable macroeconomic framework and increase economic growth. This was complemented by the National Competitiveness Program which aims to improve business confidence and stimulate private investment. This included actions to simplify administrative procedures and increasing public and private investment in infrastructure and the productive sectors.
iii. These efforts, combined with responsible management of public finances, adequate
monetary management, implementation of the state re-engineering process, and reform of the financial system, allowed Honduras to reach a new PRGF agreement with the IMF in early 2004, opening the way to increased international financing and to reaching the HIPC Completion Point.
iv. The economy has responded very positively to these reforms. The GDP growth rate
reached 4.6% in 2004, in which year Honduras met all the macroeconomic targets laid out in the PRGF agreement. There are also growing signs of positive outcomes in the poverty indicators. The percentage of Hondurans living in extreme poverty declined from 49% in 1999 to 44.6% in 2004, or by around one percentage point per year. However, the overall poverty headcount index fell less, from 66% to 64.2% and the distributive indicators show only modest improvement to date. It will be necessary to accelerate the rate of poverty reduction for Honduras to meet the PRSP goal of reducing the poverty and extreme poverty rates by 24 percentage points by 2105. It is expected that the recently approved tax measures will improve the pattern of income distribution and that sustained GDP growth will increase employment rates and accelerate the growth of the real incomes of the poor.
v. Overall, Honduras thus far has achieved approximately 18% of the improvement on
the PRSP indicators that will be needed to reach to the goals set for 2015. The PRSP indicators whose performance improved most during 2001-2004 included macroeconomic indicators, the extreme poverty index, education coverage, electricity coverage, telecommunications coverage, human development, and the amount of Protected Areas surface area with management plans in place. The indicators for the poverty headcount index, health outcomes, and access to water and sanitation services have evolved more slowly. Despite increased spending in these sectors, the advances in the indicators have been disappointing. A review of intervention strategies is needed, to improve the efficiency of resource utilization and guarantee greater impact on PRSP indicators.
vi. As mentioned above, in 2004, a broadened definition of poverty spending was
adopted. At the same time, a new tracking system was put in place to ensure that the

4
benefits of debt relief are channeled into increased spending on poverty. To this end, as recommended by the World Bank, Honduras adopted a “virtual” Poverty Reduction Fund”, which shows the trends of total poverty spending and its financing. The Finance Ministry’s budget administration system, SIAFI, is used for this purpose. Honduras met the PRGF target of increasing poverty spending by 0.6% of GDP, to 8.4% in 2004. “Investment in Human Capital,” absorbed 57% of total investment. This is followed by “Guaranteeing the Strategy’s Sustainability” (19% of the total) and “Reducing Poverty in Rural Zones,” for which 13% of resources were used.
vii. Up to the end of 2004, Honduras had received $256.8 million in Interim HIPC debt
relief. The relief was equal to 0.2% of GDP in 2000, 0.9% in 2001 and 2002 and 0.8% in 2003 and 2004. Most of the HIPC relief has been assigned to investment in human capital, especially in education and health. A small remainder of $20.2 million had not yet been applied to poverty programs by the end of 2004, and will be used in 2005. After HIPC Completion Point is reached, it is estimated that Honduras will receive a further $581.4 million in debt relief between 2005 and 2018.
viii. As intended under the HIPC initiative, debt relief has led to an increase in total
poverty spending, rather than replacing other sources of funding. Analysis of data for poverty spending from 2000 to 2004 shows that –once post-hurricane reconstruction programs are excluded – the nationally funded effort of poverty spending has remained stable at around 4.6% of GDP in each year.
ix. As well as funding increased spending programs targeted on poverty reduction, the
PRSP also sets out an ambitious program of policy initiatives and legislative reforms designed to remove obstacles to increased growth and social equity. The following paragraphs outline the most important advances in each of the five broad programmatic areas of the PRSP.
x. Key actions taken to promote Equitable and Sustainable Economic Growth
include approval of the Finance System Law, and reforms of the law regulating the National Banking and Insurance Commission (CNBS), the BCH and the Insured Deposits Fund (FOSEDE). In addition, the Copyright Law and norms were approved, and the presidents of Central America approved a work program for the Central American Customs Union, aiding regional integration. The CAFTA negotiations with the United States were concluded and the National Commission on Competitiveness and the National Center to Promote Agro-Business were created. Moreover, a Tourism Cabinet and special Tourism Police Unit were set up, and the Policy to Support Competitiveness among MIPYMEs was approved.
xi. In the area of rural poverty reduction, the Financial Support Law for Agricultural
Producers was approved along with the Property Law on May 28, 2004, which includes the creation of a Property Institute. With respect to programs and projects, implementation of the National Sustainable Development Program (PRONADERS) continued, benefiting 288,461 rural families. Implementation of the Land Access Program (PATH, which was previously known as PAAR) has also continued, with financing of L. 267.8 million, along with FHIS programs aimed at improving the nation’s rural infrastructure. In the agriculture sector, the greatest progress has resulted from setting up six agro-food chains, which serve the production of dairy products, African palms, vegetables, honey, and pork and beef (benefiting approximately 70,000 producers nationwide), and creating the Agro-Business Center

5
(CDA), responsible for improving capacities to negotiate and commercialize products.
xii. With respect to urban poverty reduction, actions are focused on stimulating the
development of micro, small and medium scale enterprises as a source of employment and income generation for poor families in urban zones. The Competitiveness Policy, now in force, is aimed at supporting MIPYMES and the economy’s social sector. The Framework Law for Potable Water and Sanitation was approved, with the goal of improving access to basic services in priority areas. The purpose of this law is to promote an expansion of coverage and assure water quality as part of an appropriate environmental management scheme that protects and preserves water sources and health.
xiii. In the area of education, the design, approval and initiation of the Education for All
(EFA) program for 2003-2015 is particularly noteworthy, with resources totaling some US$86 million. The objective is to achieve universal sixth grade graduation for all school-age children by the year 2015. The General Education Law and reforms of the UNAH Organic Law were also harmonized, and a national educational research and training network was created by four schools affiliated with the INICE and 2,725 teacher education centers (CADs)
xiv. In the health sector, PRSP priorities target strengthening primary care, primary care
for children and women, and better quality health services all around. The most important policy measures include developing and discussing the framework for the health sector reform process, which is based on separating functions, strengthening the regulatory role of the Secretariat of Health, implementing the maternal-infant mortality initiative, developing, approving and implementing the Global Fund for HIV/AIDS, tuberculosis and malaria, financing community-based prevention actions, and delivering anti-retroviral medications. Some 76.3% of all funds utilized in the health sector by September 2004 were national funds, while 11.1% were loans, 6.4% HIPC funds and 6.2% donations. Approximately 86% of these resources have been invested in programs and projects providing outpatient care, epidemiological control of illnesses, and hospital treatment. An average of L.1.2 billion has been used every year to finance these projects. Some 91% of national funds assigned to the hospital network have been used for acquiring medicines and surgical equipment, as well as for strengthening primary care. In particular, these funds have been used to sustain the Expanded Program of Immunizations (EPI) and community-based comprehensive care for children (AIN-C).
xv. With respect to providing greater social protection to specific groups, a Plan of
Attention for the Most Socially Vulnerable—street children, sexually exploited children, children orphaned by HIV/AIDS, gang members, the disabled, the elderly and female victims of violence—is being defined. In addition, the National Policy on Preventing Disabilities and the Comprehensive Care and Rehabilitation of Disabled Persons and Protecting their Rights and Responsibilities has been approved. Meanwhile, the National Plan of Action for the Disabled is being developed, and cooperation agreements supporting a community-based rehabilitation strategy in the Miskito coast region of Honduras have been signed. To improve the socio-economic situation of indigenous and Afro-Caribbean Hondurans, a Commission to Eliminate All Forms of Racial Discrimination has been created. Moreover, the Support Program for Indigenous and Black Populations (PAPIN), whose main component is

6
implementing an ethnic-engineering model in two pilot communities (Belén in Mosquitia and Nueva Esperanza, Lempira), is being implemented with 34 projects at a cost of L. 21.9 million.
xvi. Actions to guarantee the strategy’s sustainability are being implemented to
promote good governance and democratic participation, such as eliminating the figure of the “presidential designate” and replacing it with a Vice-President. A constitutional reform was adopted on November 24, 2004, through which the plebiscite and referendum were incorporated as democratic options, and the New Electoral Law and Political Organization Law were also adopted. With respect to improving citizen security, initiatives such as implementing Preventive Education Programs have been approved, which are managed by the Division on Gang Prevention. In addition, the “Safer Community” program was implemented, in which citizens and the National Police jointly work on community security issues. The Strategy to Combat Drug Trafficking has been implemented in the Gracias a Dios and Colón provinces, and the Transit Law and Law on Firearm Ownership, Registration, and Possession and Control of Munitions, Explosives and Other Similar Devices were reformed (published in La Gaceta No. 30-224 on November 19, 2003).
xvii. The basis for PRSP’s medium-term implementation is contained in the PRSP
Implementation Plan for 2004-2006, which the Government presented at the Consultative Group meeting in June 2004. This Plan integrates the first sector wide planning efforts carried out by the six Sector Roundtables that, under Government leadership, consolidated and aligned the demand for programs related to PRSP goals. This was reinforced further by approval of the Budget Law, which establishes a mechanism for developing a Medium Term Multi-Year Plan that will link PRSP goals with medium-term budgetary programming. The Government of Honduras has taken on the challenge of leading the process of harmonizing and aligning cooperation support, with the principal goal of determining which steps are needed to insure that international cooperation complement national efforts rather than substitute them, to achieve more sustainable economic and social development.
xviii. Monitoring of PRSP programs and projects requires effective financial oversight and
ongoing review of activities. The Technical Support Unit (UNAT), together with the National Statistics Bureau (INE)—attached to the Presidential Secretariat and the Finance Secretariat—took the initiative to begin developing a prototype for a monitoring and evaluation system using available resources and information. On March 31, 2004, the PRSP Information System (SIERP) was presented on the official web site: www.sierp.hn.
xix. The SIERP is a general information system that facilitates monitoring and evaluation
of national anti-poverty measures. It is based on analyzing the progress of global and intermediate indicators, and the physical and financial advance of PRSP programs and projects. To provide sustainability to the follow-up process, a SIERP Implementation Master Plan (PMSIERP) was drafted with a vision to 2015. One of the main tasks assigned to the SIERP is defining, compiling and discussing the indicators with all institutions. To achieve it, model matrices were developed so that each institution could include the indicators it considers pertinent. The matrices were designed to compile information from the institution, from existing information systems, and the indicators themselves. The indicators are differentiated by time, level of aggregation and source.
7
xx. To measure progress toward achieving PRSP goals, adequate monitoring and
evaluation of specific advances in concretely improving the population’s living conditions are needed. For this, technical instruments and tools are required that allow policy recommendations to be made, like the PSIAs, which are studies about impact and poverty.
xxi. The main challenges facing PRSP implementation in the medium and long term
include the need to further strengthen the articulation between PRSP program goals and sector-level planning and budgeting, including the alignment and harmonization of donor funding. It is also important to increase national appropriation of the process through building civil society capacities, adequate outreach about the PRSP’s objectives, goals and results, and the promotion of “social audits” as a mechanism for overseeing the efficiency and accountability of program implementation. Moreover, decentralized mechanisms that link local supply and demand are also needed, to improve the effectiveness of resource use.

8

9
I. INTRODUCTION 1. This report describes progress made to date in implementing the Poverty Reduction
Strategy (PRSP), since its approval by the Government of Honduras in August 2001. The PRSP, whose primordial goal is reducing the levels of poverty and indigence in a sustainable manner through economic growth with equitable distribution of resources, through the year 2015, is strengthened and further accentuated by the commitment of Honduran authorities to achieve the Millennium Development Goals. This commitment was concretized by Honduras and 188 other nations in 2000. A complete description of the PRSP goals, its global indicators, and the policies and programs designed to achieve these was published in the governmental document, “Poverty Reduction Strategy,”1 which was approved by the Directorates of the International Monetary Fund (IMF) and the World Bank (WB) in October 2001.
2. In late 2003, the process of updating the PRSP was concluded. This process
consisted of recalibrating its goals and indicators, and redefining poverty spending to make the Strategy more coherent with defined objectives. This process took place in the framework of the first progress report, which summarized the achievements and outstanding challenges facing program implementation and the impact on indicators during the 2002-2003 period. This report monitors the recalibrated goals, in light of the new poverty spending definition and institutional structure changes that arose in 2004.
3. The report is also reinforced by the Poverty Reduction and Growth Facility (PRGF)
agreement that the Government of Honduras signed with the IMF, by the World Bank’s Poverty Reduction Support Credits (PRSC), and by agreements made in the framework of the Fourth Meeting of the Consultative Group held in Tegucigalpa in June 2004. It is hoped that the same will serve as the basis for achieving the Floating Culmination Point in the framework of the Heavily Indebted Poor Countries initiative, to facilitate the achievement of PRSP goals through external debt service relief and its conversion into higher levels of spending for the most unprotected members of society.
4. Since the PRSP was developed, important events have occurred that have altered the
nation’s medium-term economic outlook. The negative effect of the US economy’s deceleration after September 11th, 2001, the continued worsening of the terms of exchange, added to a two year delay signing the PRGF with the IMF have attenuated Government efforts to achieve PRSP goals. However, a more exhaustive review of the impact of policy measures under implementation, and of the increased spending on poverty reduction programs, reveal important progress in terms of achieving significant improvements in the well being of the most vulnerable members of Honduran society.
5. The report will be subjected to a consultative process through the PRSP Consultative
Council (CCERP), whose structure was expanded to include a greater number of civil society representatives. The results of this process improved Honduran society’s understanding of PRSP implementation to date, and more precisely defined the outstanding challenges to be faced in the future. A detailed description of the consultation process along with its results has been included in Chapter II.
6. Chapter III outlines the nation’s macroeconomic situation and its influence on PRSP
implementation. Reference is made to the economic deceleration and fiscal crisis 1 Poverty Reduction Strategy, Government of the Republic of Honduras, August 2001.

10
underway since 2001, as well as the measures taken to correct this situation. The PRGF agreement signed in March 2004 with the IMF, combined with access to World Bank Poverty Reduction Support Credits (PRSC) and the achievements made in the Consultative Group reaffirm the centrality of poverty reduction to the nation’s development strategy. This is also reflected in later reviews of these agreements and the positive projections for compliance with the monetary program approved by authorities at the beginning of the year, despite obstacles generated by external shocks mostly associated with the world energy crisis.
7. Chapter IV summarizes the state of poverty and the performance of the main economic
and social indicators for poverty reduction, between September 2001 and September 2004. The results of the Standard of Living Survey (ENCOVI) are still not available; these will shed light on important themes related to poverty in the country. This section also contains some fundamental innovations in relation to previous reports. The evolution of poverty is extensively reviewed, considering not only its incidence but also the severity and scope of disparities. In addition, income redistribution is considered using more stylized indicators than the Gini coefficient, such as the Atkinson and Theil indices. Well-being is also briefly evaluated using the Unsatisfied Basic Needs method.
8. In Chapter V, implementation of the PRSP’s financial resources during the 2001-2004
period is analyzed. The first part of the analysis provides a global overview of budgetary implementation, detailing the use of financing following the redefinition of poverty spending in 2003. Later, the acquisition and use of interim debt relief resources between 2001 and September 2004 is explained in detail. It is important to stress the manner in which HIPC resources have allowed greater insertion and focalization of public resources earmarked for the fight against poverty. The consolidation of national efforts is sought under the principle of HIPC relief additionality, achieving adequate budget implementation by social sectors, avoiding the fungibility and displacement of financial resources, and assuring the use of an increasingly larger portion of the budget to achieve the PRSP goals.
9. Chapter VI details the PRSP’s programmatic implementation and progress made in
implementing legal and political reforms in each of the six programmatic areas contained in the document. It also includes an examination of advances in the decentralized implementation of the PRSP, especially with respect to municipal strategic planning and building local capacities. Finally, the development of the PRSP’s operational-institutional framework is assessed, justifying changes in the CCERP’s structure and in the institutional participatory planning model generated by the Sector Roundtables.
10. Efficient implementation of the PRSP should be proposed in a framework of a strategic
planning process that is consistent with the requirements for achieving the PRSP goals. For this, the Government and the G-17 Donor Group began a process in 2003 of harmonizing international cooperation and aligning it to the priorities defined in the framework of PRSP goals. The progress of this process is described in Chapter VII, where the design and implementation of SWAPs Programs—a fundamental long-term planning instrument—are also evaluated.
11. Monitoring and evaluating the impact of both PRSP policies and programs and projects
are a priority, to facilitate decision-making. Chapter VIII analyzes the performance of

11
the PRSP Information System (SIERP), including progress in monitoring impact and process indicators, as well as studies carried out to measure the impact of policies and programs (the so-called Poverty and Social Impact Analysis, or PSIA). The chapter also describes the medium term outlook for these instruments.
12. Finally, Chapter IX describes obstacles encountered during PRSP implementation, as
well as the main challenges that need to be confronted in the medium and long term. The purpose here is to pinpoint the main aspects to be considered in future work, in light of institutional changes and shifts in policy cycles, as well as the influence of medium-term world economic trends.

12

13
II. REPORT CONSULTING PROCESS 13. As has been done on previous occasions, a draft of the PRSP Progress Report
through 2004 was submitted for consultation to Civil Society and the International Cooperation Community through the CCERP. The fundamental goal of this task was to learn the viewpoint of the citizenry represented in the different sectors regarding relevant aspects in implementing the Strategy and stimulating them to become more aware of the process, as well as to obtain inputs to enrich the document and improve its quality.
A. ORGANIZATION AND PARTICIPATING SECTORS 14. On this occasion, the consultation took place through six regional workshops in order
to ensure broad participation by Civil Society at the national level. The consulted regions were: i) Central Region, which covers the provinces of Francisco Morazán, Comayagua, La Paz and Olancho; ii) South Region, for the provinces of Valle and Choluteca; iii) Western Region, for the provinces of Copán, Ocotepeque, Lempira and Intibucá; iv) North Region, provinces of Cortés and Santa Bárbara; v) Seaboard Region, provinces of Atlántida, Islas de la Bahía and Yoro; and vi) Bajo Aguan Region, provinces of Colón and Gracias a Dios. Approximately 800 people participated in the consultation, among the 12 sectors of Civil Society and representatives of the G-17.
15. A methodology was designed to facilitate the analysis and reflection on the topics
addressed in the report, as well as the later inclusion of the participants’ contributions in the final version. This methodology, as well as the definition of the participants was done together with the members of the recently installed CCERP.2
16. The first draft of the report was turned in ahead of time to the CCERP members so that
they could share it with their base organizations before the workshops. The working sessions began with a presentation by the Government regarding the content of the document, followed by work in groups, in which the participants offered their contributions and comments regarding their vision of the process.
17. The results of the workshops were systematized in matrixes, which served for drafting
a summary of the observations and proposals by Civil Society that were then included in the document. Annex A contains a summary chart of the contributions from Civil Society, noting the topic and origin of each one.
18. The International Cooperation Community grouped in the G-17 offered valuable
contributions to the report. A document with general and specific comments on the draft was submitted to the Government. It included numerous ideas for improving the internal coherency of the report. In addition, one or more representatives of the donors participated as observers in all the consultation workshops.
2 Changes to the FRP Law permitted the CCERP to expand its Civil Society membership from 5 to 12 members, which were elected in free assemblies that were ratified by the President of the Republic. The installation of the new CCERP took place on December 7, 2004 and its first task was to take responsibility for the consultation process for this report.

14
B. RESULTS OF THE CONSULTATION
a. General aspects
19. The impression of the majority of participants is that document pulls together a valuable amount of information about the main actions carried out by the Government regarding implementation of the PRSP. Nonetheless, they expressed concern about the lack of impact of these actions on the global goals. The majority agreed that this is principally because the current efforts will crystallize in the long term. The impression also persists that the delay in reaching the Culmination Point of the HIPC initiative has stagnated the process.
20. Another recurring aspect in the discussions was the need for Honduran society to
appropriate the PRSP. Concern was expressed regarding the sustainability of the process in the fact of changes of government, especially in a political year, and the implementation of a broad outreach program to publicize the Strategy was proposed, to make it known by both civil society and the authorities.
21. There was insistence on the need to adequately prioritize the programs and projects to
strengthen the link between actions to be undertaken and the goals of the Strategy. In this context, the need was expressed to link all Government actions to the PRSP through sector-wide inter-institutional coordination.
22. In this framework, the proposal was made in the majority of the meetings to increase
civil society’s participation in determining the programs to be financed with Strategy resources. To this end, it was proposed, among other things, to strengthen decentralization in their implementation, especially through the Strategic Municipal Development Plans and promotion of the Regional Strategies.
23. Greater participation by society was also urged in determining strategic aspects of the
PRSP, such as the definition of macroeconomic policies, the country’s strategy regarding processes such as CAFTA, and the formulation of an appropriate strategy for combating corruption. As part of this effort, it was stated that the national consultation processes must be more ongoing and genuinely affect the orientation and implementation of the Strategy
24. The importance of having access to information about all the programs and projects
was remarked upon, including disaggregating at the level of implementing institution, geographic reach and expected impact. Greater information was also requested regarding fulfillment of the program’s physical and financial targets and the degree of progress in that regard. There was also insistence on the need for disaggregated information at the municipal level. The same type of information must be available for the programs and projects suggested for incorporation into the PRSP in the medium and short term.
25. General enthusiasm was perceived in all the workshops regarding the participation and
opening that the Government has generated around the PRSP. Unlike previous processes, Civil Society expressed positive expectations regarding the future implementation of the programs. Nonetheless, criticisms were evident regarding the slowness of the majority of public institutions, as well as the lack of commitment on the

15
part of authorities to push the programs and projects. Greater accompaniment by public officials at the future participatory processes was requested.
b. Specific Comments
26. With respect to the macroeconomic chapter, it was expressed that although the GDP growth, inflation and the interest rates show stability, this behavior is not becoming tangible in the situation of employment and well-being of the majority of population sectors. It is necessary that the measures taken by the Government be joined by policies capable of developing production with the participation of all sectors. As on other occasions, there were diverse opinions regarding how to configure the macro-fiscal framework in concrete terms.
27. On the topic of Economic Growth, the private sector representatives and the social
sector of the economy criticized the fiscal measures for increasing taxes on the formal sector. Others said that it is not observable how the corruption-fighting measures have been a source of financing for the PRSP. The impression persists that the government is excessively large and they consider it important to make public spending on salaries consistent with the country’s macroeconomic possibilities. They also criticized the persisting tax exemptions.
28. The discussions also centered on the need to strengthen the National Competitiveness
Program, the development of micro and small businesses, and the importance of the negotiation of the trade opening taking into consideration its linkage to poverty. Some of those consulted did not agree with the trade liberalization in the CAFTA framework, for fear of a negative impact on some sectors such as agro, while others see it as an essential factor for strengthening Honduras’ competitiveness.
29. There was insistence in the majority of workshops on the need to order public
interventions toward the poorest sectors. Institutional disorder continues to be observed in the implementation of programs and projects. In addition, the NGOs and Cooperation were criticized in that they often duplicate efforts, leading to a waste of much-needed funds to reduce poverty.
30. On the issue of Rural Poverty, the participants agreed on the need for an effective land
access policy to be designed together with an efficient land use scheme that permits the land to be used well. There was a demand by the peasant organizations that a land redistribution be carried out fin the framework of a broad agrarian reform, assigning the needed budget resources to that end. Others emphasized the importance of improving the irrigation systems and access to basic infrastructure services such as water and sanitation, electricity, telecommunications and a rural road system to facilitate the recovery of productive activities.
31. The discussions regarding urban poverty demanded the development of social and
economic infrastructure in the marginal neighborhoods of the development polls. Several of those consulted stressed the importance of improving the existing informal housing in marginal neighborhoods. A greater disaggregating of the indicators of access to basic services was requested, as was greater participation by residents and councils in the policy decisions regarding the PRSP. Some questioned whether the People’s Housing program could attend the truly poor. Skepticism was expressed

16
about the reported figures of urban water coverage, with the comment that many who are connected to a system receive bad service. It was requested that greater importance be given to this issue.
32. Those consulted on education and health centered their comments on the
development of a better scheme for following up on attainment of the goals, better linkage of public policies with local actors, a more transparent usage of resources and that the quality of the services be taken into account. Concern was expressed about the failure to meet several of the goals in this area, including net coverage in primary and secondary education.
33. With respect to attention to specific groups, those consulted want a comprehensive
vision of ongoing poverty reduction of those groups, and not through social compensation programs and temporary poverty alleviation (which were characterized as charity or paternalistic projects). It was requested that the issues of third age and people with disabilities be made more visible, as they are absent from the program. There was also a request for better treatment of the issue of at-risk children and youth.
34. With respect to the sustainability of the strategy, it was requested that actions
regarding public security, democratic participation and governmental transparency be implemented. Regarding environmental protection and risk management, concerns were expressed about the apparently reduced importance given these themes in recent years and the need was expressed for establishing a clear state environmental and risk-management policy. It was requested that the follow-up systems to the PRSP and civic participation in them both be strengthened
C. INCORPORATION OF THE RESULTS INTO THE REPORT 35. This PRSP Progress Report incorporates many of the comments and suggestions
received. The majority of them have been incorporated into the document considering their pertinence to specific chapters and sections of the document. Parallel to the document, a minute of the process is being drafted, detailing evidence of the incorporation of the suggestions. In addition, matrix A details the contributions by city and Report section.
36. The strengthening of the sections of statistics and indicators of PRSP results and
impacts are among the most important changes to the Report. Moreover, greater emphasis has been given to the PRSP work program by strengthening the participatory and decentralized implementation processes of the Strategy and the creation of transparent follow-up mechanisms for the PRSP. Work has begun to align the PRSP interventions and goals within the framework of sector-wide programs in education, health, water and sanitation, agroforestry and public security.

17
III. MACROECONOMIC FRAMEWORK A. INTERNATIONAL PANORAMA
37. The world economy showed strong signs of recovery in 2003 and 2004, following
economic deceleration and uncertainty at the start of the century. Preliminary data reveal that the global GDP grew around 4% last year, pulled upward by the acceleration of the US and Chinese economies. Japan’s recovery injected a new demand factor into the international scene. Its 2.7% growth rate in 2003 and 2004 easily surpassed the 0.2% rate of growth in 2002. Other factors affecting this behavior were the end of the war in Iraq, the rise in world hydrocarbon prices, and better access to financing in developing countries.
38. Propelled by world trends, the economies
of Latin America and the Caribbean as a whole had encouraging growth in 2004, registering a 5.5% increase in the GDP.
39. The USA’s 4% growth rate facilitated an
increase in Latin American and Caribbean imports to that country. Moreover, the expansion of Asian economies, headed by China’s 9.8% growth rate, triggered price and volume increases for basic products exported by the region, including copper, tin, iron and soy. In addition, the recovery of intra-regional trade flows in Latin America favored this increased economic activity.
40. Central America also produced good economic results, despite some adverse external
factors. Macroeconomic stability was maintained throughout the period, expressed in inflation rates below 10% in most of the region. Other positive factors included maintaining stable exchange rates, increased exports and increasing international reserves. However, the balance of payments current account deficit deteriorated in most of the countries in the region, reflecting growing import demand as GDP growth increased, and some countries reported slippage on the fiscal deficit
41. Besides these generally positive macroeconomic results, the Central American Free
Trade Agreement (CAFTA, or “TLC” in Spanish) was negotiated with the United States, generating positive expectations for medium-term trade and investment flows. In addition, state modernization processes and structural reforms continued in most countries of the region.
B. NATIONAL ECONOMY
a. Macroeconomic overview 42. Honduras registered very positive results for the first full year implementation of the
PRGF agreement with the IMF (see Table III.1). Based on provisional data (subject to review by the IMF Mission programmed for the first week of February, 2005), real GDP growth is estimated to have reached 4.6% (against the forecast of 3.75%)
Latin America: Growth of the GDP, Inflation and Unemployment
-3
0
3
6
9
12
15
1999 2000 2001 2002 2003 2004
GDP growth Inflation Unemploy.

18
Hondur a s: I nt e r - Annua l Va r i a t i on of t he I P C , 2 0 0 0 -2 0 0 4
( t hr ough S e pt e mbe r of e a c h y e a r )
9.2
6.8
8.18.8
10.1
6.0
8.0
10.0
12.0
2000 2001 2002 2003 2004
Year
%
43. The level of Net International Reserves
surpassed program goals comfortably and the monetary targets were met. In spite of these achievements, the inflation rate (consumer price index, CPI, point-to-point) reached 9.2%, above the revised PRGF objective of 8.0%, due mainly to the pressure of increased fuel prices. However, the GDP deflator rose only 7.7%, which indicates that domestic inflationary pressure was contained broadly in line with the program goals. The long-term trend in inflation is clearly downwards (see graph) and it is expected that this will continue in the second year of the PRGF program, as international fuel markets move back towards normality. It is also noteworthy that the relative increase in the Honduran CPI in 2004 was the lowest in the Central American region.
44. Most important of all, the fiscal goals of the PRGF program were met. The deficit of the
Central Government was 3.5% of GDP (down from 5.4% in 2003) and the combined deficit of the non-financial public sector was 3.0% (compared with 4.9% in 2003). This adjustment was achieved without sacrificing poverty reduction spending, which (on the new definition outlined in the previous Progress Report) rose from 7.8% of GDP in 2003 to 8.4% in 2004. In the following paragraphs, the main aspects of the government’s successful macroeconomic program are outlined. Chapter V presents further details on the trends of poverty spending.
b. Growth, investment and competitiveness
45. GDP growth for 2004 is estimated at 4.6%, higher than the 3.75% revised projection of
the PRGF agreement. The continued recovery of GDP growth was propelled by government efforts to maintain a stable macroeconomic framework complemented by implementation of the National Competitiveness Program, the generation of an improved business climate and increased public investments to support production. The main factors contributing to growth on the demand side were a sharp rise in investment (from 23.4% of GDP in 2003 to 26% in 2004) and strong growth of export of goods (not including maquila) (up from 20.3% of GDP in 2003 to 21.1% in 2004). The continuing strong inflow of family remittances helped to offset the shock of increased oil prices.
46. Private investment grew strongly in 2004, rising to 19.8% of GDP, compared with
17.9% in 2003. To stimulate private investment, the Government has promoted accelerated liberalization of the telephone sector through the “Phones for All” program; has awarded a second cell phone concession (leading to significant reductions in rates and a very rapid increase in the number of phones), and has contracted 400 Mw of electricity generation capacity on very favorable terms from private generators. Public investment also rose, from 5.4% to 6.2% of GDP. Much of the public investment program is oriented towards economic recovery and improving the competitiveness of the economy, including major infrastructure investments in the roads sector, irrigation

19
projects in the agriculture sector, and an ambitious housing program for low-income families.
Table III.1
Honduras: Principal Macroeconomic Indicators
2000 2001 2002 2003 2004 Real Real Real Real Prelim.
National Revenues and Prices Real average GDP (real growth, %) 5.7 2.6 2.7 3.75 4.6GDP Deflator (% increase) 9.7 8.0 6.3 7.7 7.7Consumer prices (% increase at end of period) 10.1 8.8 8.1 6.8 9.2Per capita GDP (US$) (at December 1999 prices) 879 867 850 872 884Poverty rate (% of population) n.a. 64.4 63.9 63.5 64.2Extreme Poverty rate (% of population) n.a. 47.4 45.0 44.7 44.6
% of GDP Balance of Payments Current account -4.1 -4.9 -2.6 -5.2 -5.8Trade balance -20.5 -22.3 -21.9 -24.7 -26.3Exports 23.8 21.5 20.7 20.3 21.1Imports -44.3 -43.8 -42.6 -45.0 -47.4Non-factor services (net) 6.4 5.1 6.7 7.3 7.6Factor services (net) -2.4 -2.2 -2.4 -2.9 -2.8Transfers (net) 12.4 14.5 15.0 15.1 14.9Savings and Investment Gross fixed capital formation 26.1 23.7 22.1 23.4 26.0Non-Financial Public Sector (NFPS) 5.9 6.8 4.8 5.4 6.2Private Sector 20.3 16.9 17.3 17.9 19.8National Savings 22.1 18.7 19.5 18.3 19.3Public Sector 6.1 4.5 2.8 1.4 4.0Private Sector 16.0 14.2 16.6 16.9 15.3Public Finances Combined NFPS Deficit -0.7 -3.5 -3.3 -4.9 -3.0Central Government Deficit -5.6 -5.9 -5.3 -5.4 -3.5Total Revenues Including Donations 18.7 19.9 19.4 19.8 20.6Tax Revenues 16.4 16.2 15.9 16.3 17.3Total Spending 24.3 25.9 24.8 25.0 24.1PRSP Spending 8.2 8.8 7.5 7.8 8.4Memorandum Items Nominal GDP in market prices (Lempiras) 89,401 99,032 108,124 120,465 135,681
Nominal GDP in market prices (US$ million) 6025 6,400 6,580 6,945 7,455Average Exchange Rate, Lempiras/US$ 14.84 15.47 16.43 17.35 18.20Source: BCH, INE, SEFIN
47. The external sector has been strengthened by export growth and the increase in
remittances, which are expected to reach close to 15.6% of the GDP in 2004. The growth of exports of goods in 2004 is mainly due to: bananas, coffee, shrimp, gold, silver, lead, sugar, pineapples, soap and detergent, wood, tilapia, and plants and vegetables. Although the international prices for some of these products dropped,

20
export volumes were strong.3 The apparel maquila sector also remains strong, recovering well from the 2001-2002 down-turn. These factors have offset the impact of oil price increases, and international reserves of the central bank reached 2004, comfortably surpassing the US$1.623 billion in December PRGF goal of maintaining 4 months of import cover.
c. Fiscal Performance
48. The weak fiscal situation in Honduras was the principal problem addressed under the
first year of the PRGF program. All the PRGF program fiscal goals were met. 49. On the revenue side, the measures implemented under the program have reversed the
decline in tax revenues observed between 2000 and 2002, when they fell to 15.9% of GDP. A combination of tax reforms implemented by the current administration and improved tax administration led to a sharp recovery in tax revenues, which reached 16.3% of GDP in 2003 and 17.3% in 2004, and are expected to rise by a further 0.2% of GDP in 2005. Total revenues (including donations) rose from 19.4% of GDP in 2002 to 19.8% in 2003 and 20.6% in 2004. Coupled with the reduction of total spending from 25.0% of GDP in 2003 to 24.1% in 2004 (whose causes are detailed below), this translated into sharply increased public sector savings (up from 1.4% of GDP in 2003 to 4.0% in 2004).
50. The tax reform program was applied in three stages. The first reform included
measures to expand the Sales Tax (ISV) base, unification of corporate income tax rates and increased fines and license fees. It also included some measures that implied a loss of revenues, since it eliminated excise taxes and reduced taxes on vehicles, clothing and other goods to 15%. The second phase included measures to improve tax equity, to expand the tax base, to reduce fiscal fraud and to improve tax administration. The third reform—approved in December 2003—applied sales tax to public enterprises, increased the sales tax base by eliminating unjustified exemptions, established a temporary 5% income tax surcharge on corporate profits above L.1 million and modified taxes on petroleum and its derivatives.
51. The Government’s strategy to control current spending has centered on controlling
unjustifiable increases in public sector wages and rationalizing the executive branch. The rapid growth of salary costs began following reforms to the economic clauses of the laws governing teachers and doctors remuneration in the mid 1990s, and pushed the previous PRGF off-track in 2001. By 2002 the Central Government wage bill had reached 10.8% of GDP, close to double the level recorded 5 years earlier. Wage growth was contained following negotiations with the unions in 2002, when the government faced-down a teachers’ strike that sought further immediate increases of nearly 50%. To establish a permanent solution to the problem, the government reformed the public sector remuneration system to reassert executive control over salary policies and restore equity between different groups of employees. The implementing legislation was approved by the National Congress in December 2003. Central government wage spending fell to 10.5% of GDP in 2003 and 10.2% in 2004, and is projected to continue falling gradually in the coming two years.
3 Imports have grown during the same period, mainly an increase of capital goods for industry explained by the importation of machinery and equipment for thermal energy generation and telephone projects.

21
Evolution of Interest Rates for Loans/Deposits in National Currency
0.00
5.00
10.00
15.00
20.00
25.00
30.00
Jan-01Apr-01 Jul-01Oct-01Jan-02Apr-02 Jul-02 Oct-02 Jan-03 Apr-03 Jul-03 Oct-03 Jan-04Apr-04 Jul-04
%
Loans Deposits
52. State restructuring is another strategic component of the expenditure rationalization program. The Government has initiated a “re-engineering” process to eliminate excess costs and more efficiently restructure governmental departments. Legislation on this issue has been remitted to the Congress and is expected to be finalized during 2005.
53. A World Bank study of the distributive impact of the fiscal adjustment program
(conducted as a Poverty and Social Impact Appraisal, PSIA, under the aegis of the PRSP) confirmed that the tax measures undertaken by the Government have been slightly progressive (i.e. have shifted the tax burden somewhat towards better-off families). It also found that the combined distributional impact of the tax measures and spending reforms to date under the PRGF program has been strongly progressive, because. The fiscal adjustment program was carefully designed not to prejudice poverty reduction efforts and to protect spending programs benefiting poorer households. Poverty related spending (under revised definitions established in the First PRSP Progress Report) increased from 7.8% in 2003 to 8.4% in 2004. Under PRGF program goals, it is expected to reach 8.7% in 2005 and 9.4% in 2006. The trend of poverty spending is discussed in more detail in Chapter V.
54. As a result of the factors outlined above, as already mentioned in paragraph 44, the
Central Government’s fiscal deficit was sharply reduced, to 3.5% of GDP in 2004. The deficit is expected to continue falling gradually, to 3.0% in 2005 and 2.7% in 2006. Similarly, the combined public sector deficit was reduced to 3.0% in 2004, and will continue falling to 2.5% in 2005 and then 1.7% of the GDP in 2006. These projected levels of the overall deficit are congruent with Honduras’ ability to raise concessionary financing from the international community and – therefore – with the maintenance of a sustainable debt load after the HIPC Completion Point is reached in 2005.
d. Monetary and Credit Policy
55. The Central Bank’s monetary and foreign
exchange policies are geared to achieving internal price and foreign exchange stability through the implementation of a stringent monetary program The main instruments of monetary policy are Open-Market Operations (OMO)
56. During 2004, the increase in Net
International Reserves was greater than the forecast in the PRGF, due principally to the increase in family remittances from Hondurans living abroad. This was mainly offset by increased banking system investments in monetary absorption certificates issued by the BCH and higher deposits in the BCH . However, to avoid the risk that excess liquidity might trigger an increase in dollarization, the BCH also required temporary obligatory investments to the financial institutions. This allowed the BCH to sterilize the growth of currency issue caused by foreign exchange inflows, without pushing up interest rates on CAMS. The latter are an important reference point for system lending rates and also produce considerable quasi-fiscal costs. To reduce the excessive rate of growth of dollar lending, the BCH also tightened the prudential limits for the financial system’s external indebtedness.

22
57. Since 2001, interest rates for national currency operations in the banking system have declined steadily, as inflation has come under control and the 2001 financial sector crisis has been resolved. The weighted average of the financial system’s nominal lending rate fell from 23.2% in 2001 to 19.5% in 2004, while deposit rates have been reduced from 11.76% in 2001 to 8.0% in 2004. The margin of financial intermediation has remained stable, allowing banks to strengthen their balance sheets and capital positions.
58. Throughout the same period, exchange rate management policy sought to maintain
currency stability while avoiding further real exchange rate appreciation. Honduras operates a crawling peg system based on an auction of all foreign exchange, administered by the Central Bank. To prevent instability, the outcome of the auction is limited within a band around a reference price set by the BCH. The monetary authorities have continued to adjust the reference price based on the differential between inflation in Honduras and that of its main trading partners. This strategy aims to shore up competitiveness and prevent real exchange rate appreciation, in spite of the strong inflows of foreign exchange linked to private transfers, investment flows and official capital flows, noted above.
e. Financial System
59. Following the 2001 financial crisis, the Government has implemented a successful
sector stabilization program. In 2003, the National Banking and Insurance Commission (CNBS) began implementing a Financial Sector Adjustment Program (FSAP) with support from international organizations. Key actions under this program were included among the structural conditions of the PRGF. The Congress passed a new Financial System Law, whose objective is to strengthen the CNBS’s supervisory capacity and establish a legal basis for the consolidated supervision of financial groups. Reforms were also made to the CNBS Law, the Central Bank Law, and the Deposit Insurance Fund (FOSEDE). The penal code was reformed to criminalize financial offenses (previously they were civil offenses). The BCH accounts were published together with the auditor’s opinion; commercial banks were required to publish their accounts quarterly; and the government continued the process of liquidating the assets of the failed banks.
60. In this context, the system has been stabilized and strengthened. The consolidation
process resulted in four bank mergers and the reduction of commercial banks from 21 to 16 between 2001 and 2004. The capital adequacy of commercial banks averaged 13.01% for 2003 and 14.16% at December 2004, which is comfortably above the minimum of 10% required by the National Bank and Insurance Commission (CNBS). These ratios have been maintained in spite of the application of stricter provisioning requirements. A fiscal contingency of close to 0.5% of GDP for dealing with financial sector problems remained unused, and was re-assigned to poverty-related investments.
f. Debt Sustainability
61. In the aftermath of Hurricane Mitch (1998), the Government sought to mobilize
international resources for reconstruction and poverty reduction, and at the same time, to achieve a definitive solution to the debt crisis which had dogged macroeconomic management for close to two decades. The strategy aimed at achieving a sustainable

23
foreign debt and freeing fiscal resources to promote economic and social development, in the framework of the Poverty Reduction Strategy (PRSP). Honduras reached Decision Point on the HIPC initiative under the fiscal window in 2000. However, as noted above, unfortunately, the PRGF program with the IMF went off track in 2001, due to fiscal indiscipline, and as a result the HIPC Completion Point was delayed and Honduras started to accumulate technical arrears with bilateral creditors.
62. The signing of the new PRGF in 2004 made it possible to re-open negotiations with the
Paris Club and move towards HIPC Decision Point, which is now expected for the first quarter of 2005. On April 14, 2004, the fifth Minute was signed with the Paris Club Creditor Nations. The eligible debt (including previously restructured and deferred debts) was reduced by 90% of its present net value, on Cologne terms (see text box). After the Minute was signed, the Government continued seeking a negotiated cancellation of 100% of debts falling due through June 2005, and has achieved debt write-offs with the United States, Germany and Italy.
63. At the same time, the international community has continued to provide strong support
to Honduras’ reconstruction and poverty reduction efforts, and the Government has maintained its policy of accepting fresh debt only on concessionary terms. The total of foreign assistance credits received from June 2002-June 2004 was US$509.8 million, the majority of which came from multilateral organizations (US$377.4 million or 74.0%), with the Inter-American Development Bank (IDB) supplying US$181.4 million (35.6%) and the International Development Association (IDA) contributing US$121.0 million (23.7%). The remaining 26% came from bilateral agencies. The accumulated foreign debt as of June 2004 was US$4.362 billion.
g. Medium-term Implementation of the PRGF
64. The medium-term macroeconomic projections indicate that the macro-fiscal stability
and growth dynamics established in the framework of the PRGF agreement should allow Honduras to meet the goals of the PRSP in the coming years. Real GDP growth is projected to hold steady at an average of 4.5% annually. Once the international fuel markets have normalized, inflation will tend to drop gradually, settling at 2.5%. The external sector will continue to be strengthened by increased non traditional exports and flows of family remittances, allowing a sharp reduction in the current account deficit, and ensuring balance of payments viability. With the reaching of HIPC Completion Point, foreign public debt is projected to decline from 66% of GDP in 2004 to 45.6% in 2005. Thereafter it will continue to decline more slowly, reaching 40.6% of GDP in 2009, as GDP growth will be faster than future debt accumulation (see Table III.2).
Box 1 - Negotiation with the Paris Club On April 14, 2004, Honduras successfully re-negotiated the debt service in arrears through December 2003 and capital and interest payments due between January 2004 and June 2005 with the Paris Club. The amount negotiated was US$360 million, of which US$214 million was in arrears. Of the negotiated sum, around US$147 million will be forgiven, and the rest will be restructured on Cologne terms, which are only awarded to HIPC countries. Of approximately US$405 million that was to have been paid as external debt service between January 2004 and June 2005, only US$49 million will be paid. The relief will be implemented through bilateral agreements that are being formalized with individual creditor nations.

24
Table III.2 Honduras: Macroeconomic Projections
2004 2005 2006 2007 2008 2009 GDP (real growth, %) 4.6 4.2 4.5 4.5 4.5 4.5 Consumer prices (% increase to the end of the period) 9.2 6.9 5.0 4.0 3.0 2.5 % of GDP Deficit of the Combined Public Sector -3.0 -2.5 -1.7 -1.7 -1.7 -1.7 Primary deficit of the Combined Public Sector -2.7 -2.7 -2.2 -2.2 -2.2 -2.2 Current Account Balance -5.8 -3.6 -3.0 -3.3 -3.3 -3.7 Gross International Reserves (In months of imports) 4.6 4.3 4.3 4.2 4.1 4.1 Total Public Debt 66.1 51.4 50.7 49.4 48.3 47.3 Foreign Public Debt 66.0 45.6 44.3 43.0 40.6 40.6 Source: BCH

25
IV. THE STATE OF POVERTY, PRSP GOALS AND GLOBAL INDICATORS A. POVERTY AND INEQUALITY
37. The main challenge posed in the PRSP
is reducing poverty from 66.0% (1999) to 42% (2015). Using the income method, we find that the poverty rate has diminished slightly from 65.9% to 63.5% between 2000-2003. The same trend is seen in the magnitude of poverty, in terms of the proportion of poor people and indigents according to indicators for the scope and severity of poverty—in other words the relative income deficit of the poor with respect to the poverty line (the Gap) as well as the degree of the disparity in income distribution among the poor (Severity). (See Table IV1).
38. The conclusions outlined in this analysis clearly
illustrate that despite their slight reductions, the changes in these indicators are not statistically significant. To summarize, although poverty has not diminished in an accelerated manner during the period being examined, the situation of the poor—in terms of income—has not worsened.
39. A better outlook may be found in the extreme
poverty indicator, the incidence of which has dropped four points between 1999 and 2003, showing a systematic trend of reduction. This trend would imply a better possibility of achieving the goal of reducing extreme poverty by 24 points by 2015, which is also consistent with the Millennium Development Goals (MDGs). Nonetheless, efforts will need to be redoubled, above all in relation to designing adequate policies that increase the income of the poor through generating employment in the economy’s formal sector.
40. The highest incidence of poverty is found in rural zones, where 70.2% of households
lack sufficient income and 58.4% are living below the extreme poverty line. This contrasts with urban areas, where extreme poverty reaches around 29.6% (2003). This clearly evidences the need to expand efforts through measures that insure that the poorest share the benefits of economic growth.
41. Although the Government may focus greater efforts on developing programs and
projects for sectors with the greatest poverty indices in the country, programs stimulating productive sectors are key to increasing productivity and competitiveness so that the lowest income segments of the population may more successfully integrate into the economy.
Table IV.1 Honduras: Poverty Indicators by Income.
Year* Poverty Gap Severity of Poverty
1998 37.7 28.0 1999 38.6 27.9 2001 37.3 26.3 2002 35.5 24.7 2003 35.9 25.0
*The exercise makes use of the EPHPM rounds conducted during the first half of each year. Source: UNAT, developed based on the EPHPM, INE
Honduras. Pobreza según ingresos, 1998-2004
0102030405060708090
100
(Por
cent
aje)
Indigencia 45.6 48.6 48.6 47.4 45.2 44.7 44.6
Pobres 17.5 17.3 17.3 17 18.1 18.9 19.7
línea dePobreza
63.1 65.9 65.9 64.5 63.3 63.5 64.2
1998 1999 2000 2001 2002 2003 2004

26
42. When we evaluate the structure of income distribution based on the percentage of total
income that households receive (in increasing order), we find that 80% of households received only 39.8% of the nation’s total income (May 2003) while 60.2% of the nation’s income pertained to the wealthiest 20% of households. Table IV.2 shows that although this structure has not been significantly modified in recent years, there is a slight trend toward increased income among the poorest quintile of the population, due to a slight shift downward of income from the third and fourth quintiles.
43. The Gini index shows that inequality has remained relatively stable since the PRSP
began (2001-2003), reaching 56.8% in 2003. Despite the stability shown by the indicator, its level is still relatively high compared to neighbor countries such as Costa Rica (44.6%) and even Nicaragua (54.1%).4 Furthermore, when we consider transfers to the lowest portion of the income distribution scale, the Theil index shows a two-point decrease for the period analyzed. Similarly, by assigning more weight to households with lower income than those with higher income, the Atkinson index (e=2) shows an increase of almost four points for this period. We can conclude that distributional inequality remained generally stable in terms of the Gini quotient, albeit still at high levels; but by assigning greater weight to the lower portion of income distribution we find a slight distributional deterioration with a tendency to fall over the medium term, given the greater income expectations associated with decreases in extreme poverty levels in recent years and the economic improvement forecasted for the country.
4 Source: Gasparini, L. Different Lives: Inequality in Latin America and the Caribbean. Chapter 2 World Bank LAC Flagship Report (2003)
Table IV.2Honduras: Participation in total income distribution,
by quintiles. 1999-2003 (in percentages)
Quintile 2001 2002 2003
1 2.3 2.4 2.4 2 6.1 6.1 6.1 3 11.3 11.2 11.2 4 20.2 20.0 20.0 5 60.2 60.2 60.2
*The exercise makes use of the EPHPM rounds carried out during the first half of each year. Source: UNAT, developed on the basis of the EPHPM, INE
Table IV.3Honduras. Evolution of Inequality Indices.
(in percentages) Year* Gini Theil Atkinson (e=2)1998 57.2 65.5 74.6 1999 55.1 58.1 74.6 2001 56.9 64.4 74.6 2002 56.8 63.5 79.1 2003 56.8 63.5 79.1
*The exercise makes use of the EPHPM rounds carried out during the first half of each year. Source: UNAT, developed based on the EPHPM, INE.

27
B. GLOBAL PERFORMANCE INDICATORS 44. The PRSP’s global goals and indicators were designed to be consistent with elements
that are closely associated with poverty. These were discussed with civil society organizations and the cooperation community during the consultative process, and were aligned with the Millennium Development Goals (MDGs).
45. During the first years of PRSP implementation, the trends among most of the global
indicators have been relatively stable, due mainly to the generally unfavorable economic environment in Honduras and delays caused by the absence of an agreement with the IMF. This, in turn, impeded reaching the Culmination Point of the HIPC Initiative and full relief of the external debt. The agreement signed with the IMF in February 2004 directs government efforts at structural reforms that will help reassign resources in function of achieving the Strategy’s goals, and that will allow results-based programming and budgetary assignments to increase the efficiency of public sector interventions.
46. Table IV.4 details the results for global indicators in relation to the goals planned during
2003 and 2004. In analyzing these achievements, we find that the Government has faithfully fulfilled its commitments to adopt certain policy measures. The goal for GDP growth was met, with 3.75% growth registered for 2003 versus the goal of 3%. In 2004, a real GDP growth of 4.6% is planned, again surpassing the proposed goal. Per capita GDP increased by 0.8%, surpassing the 0.6% goal for 2003, and it is expected that the goal for 2004 will be met as well. Poverty spending as a percentage of the GDP had similar results, reaching 7.8% in 2003 versus the goal of 7.5%. In 2004, the PRSP budget is expected to fulfill the 8.1% proposed goal for this indicator, since spending was already equal to 7.2% of the GDP in September.
47. Although the specific goals for poverty and extreme poverty were not met, as
mentioned earlier, a systematic improvement in the latter indicator was observed. This behavior may be attributed to the fact that per capita growth is still not sufficient to guarantee sustainable income levels in the poorest households, and the fact that income is still poorly distributed (see above).
TABLE IV.4 HONDURAS: GLOBAL PRSP INDICATORS
GOAL INDICATOR (base year) Base Observed in 2003
2003 Goal12
Goal met in 2003?17
Observed in 2004
2004 Goal12
Goal met in 2004?17
Real GDP Growth % of real GDP Growth (2000) 1 5.7 3.75 3.0 Yes 4.6 15 3.75 Yes
Per Capita GDP Growth % of Per Capita GDP Growth (2000)2 2.6 0.8 0.6 Yes 1.9 15 1.1 Yes
Social Spending Spending on Poverty as % of GDP (2000) 3 7.0 7.8 7.5 Yes 8.4 16 8.1 Yes Poverty rate (1999) 4 66.0 63.5 62.1 No 64.2 13 60.2 No Reduce poverty by 24 percentage points
Extreme Poverty rate (1999) 4 49.0 44.7 43.4 No 44.6 13 41.5 No Double net preschool education coverage (through 5 years)
Preschool coverage rate (1999) 4 32.9 37.7 34.9 Yes 36.0 13 35.7 Yes
95% net coverage in the first two cycles of primary education.
Net coverage rate (except over-age) in the 1st and 2nd cycles (1999) 4
89.8 88.1 90.7 No 89.3 13 91.2 No
70% net coverage in the third cycle of primary education (middle school).
Coverage rate (except over-age) in the 3rd cycle of primary education (middle school) (1999) 4
24.2 31.2 32.9 No 38.2 13 35 Yes

28
TABLE IV.4 HONDURAS: GLOBAL PRSP INDICATORS
GOAL INDICATOR (base year) Base Observed in 2003
2003 Goal12
Goal met in 2003?17
Observed in 2004
2004 Goal12
Goal met in 2004?17
50% of the emerging population completes secondary education.
Net coverage (except over-age) in the Diversified Cycle (10th – 12th grades)(1999) 4
12.4 18.9 19.0 Yes 21.3 13 20.6 Yes
Infant mortality rate/1,000 l.b. (1996) 5 36.0 n.a 32.0 n.a n.a 30.0 n.d Reduce infant and Under 5 mortality rates in half.
Under 5 mortality rate (per 1,000 l.b.) (1996) 5
48.0 n.a 43.0 n.a n.a 41.0 n.d
Reduce Under 5 malnutrition by half. Child malnutrition rate (1996) 5 37.8 n.a 30.9 n.a n.a 29.9 n.d Reduce maternal mortality by half. Maternal mortality rate, per 100,000 l.b.
(1996) 6 147.0 n.a 102.0 n.a n.a 98.0 n.d
Achieve 80% electricity service coverage. Electricity coverage rate (2000) 7 54.9 62.1 61.7 Yes 63.7 14 63.3 Yes
Density of fixed lines per 100 inhabitants (2000) 8
4.8 4.9 5.0 No 5.18 14 5.2 Yes Triple the density of telephone coverage nationwide.
Penetration of mobile telephones (users per 100 inhabitants) 8
2.5 5.6 5.5 Yes 8.85 14
6.4 Yes
% of population with access to potable water (1999) 4
81 81 82.1 No 82.2 13 82.6 Yes 95% access to potable water and sanitation.
% of population with access to sanitary facilities (excreta elimination) (1999) 4
70.2 68.6 70.7 No 76.7 13 71.9 Yes
HDI relative to gender (1999) 9 0.6 0.65 0.65 Yes n.a 0.66 n.d Raise human development index of women by 20%
Gender empowerment index (1999) 9 0.5 0.43 0.47 No n.a 0.48 n.d
Number of priority protected areas (PPAs) with management plans (2000) 10
5.0 15..0 15.0 Yes 23 14 23 Yes
% of total PPAs’ surface area with management plans (2000) 10
12.5 37.5 60.0 No 57.5 14 75.0 No
Reduce the nation’s environmental vulnerability.
Air pollution in urban centers (ug/m3 of PTS) (2000) 11
668.7 708.0 n.a n.a n.a n.a n.d
1 1.BCH; 2.UNAT, with data from the BCH and INE; 3.SEFIN based on the new definition of poverty spending; 4.Estimates based on EPHPM; 5.ENESF; 6.Secretariat of Health: Research about maternal mortality and women of childbearing age in Honduras, 1997; 7.ENEE Registries; 8.HONDUTEL/CONATEL Registries; 9.Report on Human Development (UNDP); 10.COHDEFOR statistical yearly report; 11.SERNA (Center for the Study and Control of Contaminants, CESCCO), no monitoring was carried out in 2002, and monitoring was carried out through December of 2004; 12.Data for this year are the revised goals based on the First Progress Report; 13.For 2004, the estimate is based on the May 2004 EPHPM; 14.For 2004 there are estimates through September based on the registries of the respective Secretariat;15.The real GDP growth rate is a BCH projection, and the per capita GDP also makes use of INE population projections; 16.The amount observed corresponds to PRSP spending programmed and approved for 2004 (it is worth mentioned that implementation through September was equal to 7.2% of the GDP); 17.The goal is considered met if the difference between the value observed and the goal is not greater than 0.5%.
48. In addition, the data for 2003 is from the month of September while data for 2004 is
from May, given that it is the only information available at this time. Therefore, the statistical significance of differences caused by estimating poverty during different periods should also be considered.5 When data from May is compared for the 2003-2004 period, we find that poverty in 2003 equaled 65.1%, and extreme poverty 47.0%. Although the goals in this respect were not met, we see an even more marked trend of diminishing levels of both indicators. Finally, it should be stressed that these poverty measurements will be complemented by data from the Standard of Living Survey (ENCOVI) when it becomes available. The data of this Survey is currently being processed, and it will provide more robust indicators for measuring poverty. This Survey will provide measurements of traditional poverty indicators, but these measurements will classify well-being based on consumption, making them more comprehensive and well-rounded. In addition, measurements based on income can also be made, allowing information to be compared.
5 Historically, poverty data from the month of May is higher than September, although the difference is not statistically significant.

29
49. In education, the goals for preschool coverage were met in 2003 and 2004. In 2003, coverage was 37.7%, surpassing the goal of 34.9%, and 36.0% coverage was achieved in 2004, again surpassing the 35.7% goal.6 On the other hand, the net coverage index for the 1st and 2nd cycles of primary education has not met the proposed goals for the periods under study: 88.1% (2003) and 89.3% (2004). Although the trend was in the right direction, it was not sufficient for achieving the specific goals. It is hoped that initiation of the Education for All (EFA) program, launched in mid-2004 and beginning implementation in February 2005, will help to effectively adjust the goals. In addition, there was a significant improvement in net coverage of the 3rd cycle of primary education (middle school), which rose from 31.2% in 2003 to 38.2% in 2004, effectively meeting its goal for that year. In a similar fashion, the net coverage indicator for the diversified secondary school cycle shows permanent improvements, meeting the goal in both years. This indicator for 2003 was 18.9%, versus the goal of 19.0%, and rose to 21.3% in 2004, versus the goal of 20.6%.
50. Up to date information about indicators in the health sector are not available, since the
ENESF is only conducted every five years. As described in the first progress report, the indicators showed positive results in 2001. Moreover, the trend of intermediate indicators points to improved access to basic health services, which directly impacts global indicators. It should be mentioned that resources are being negotiated to conduct the ENESF more frequently and to strengthen health sector administrative registries up to date, so that more continuous health indicators and/or higher quality intermediate indicators are available to better evaluate progress toward the goals.
51. With respect to access to infrastructure services, the rate of electricity coverage has
tended to improve since the PRSP began, even though the proposed goals have not been fully met. Thus, the indicator increased from 62.1% to 63.7% during the 2003-2004 periods.7 The telecommunications sector showed a similar trend. The global indicators for this sector changed due to the evolution of this market, with the expansion of fixed lines, the entry of new cell phone companies, and the deregulation of the Internet market. The indicators that are used to measure telephone density in the country are: density of fixed lines (for every 100 inhabitants) and the penetration of mobile phones (users per 100 inhabitants).8 The density of fixed lines for each 100 inhabitants evolved from 4.9 in 2003 to 5.18 in 2004. The penetration of mobile telephones increased from 5.6 (2003) to 8.85 (2004), meeting and surpassing the goal in the last year thanks to the entry of a new cell phone concession into the market. The goals for these two indicators have been revised in the context of SIERP implementation, sector growth programs (Telephones for All, Modernization for Honduras), and thanks to the development of technological platforms and the evolution of national and international markets.
52. Water and basic sanitation coverage did not meet goals until 2004. Potable water
coverage increased from 81% (2003) to 82.2% (2004), as compared to the goals for the respective years: 82.1% and 82.6%. Basic sanitation coverage grew from 68.6% in
6 Data for 2004 was obtained from the EPHPM of May 2004. Therefore, this indicator will be updated at the end of the year on the basis of coverage during the entire year. 7 Data for 2004 are estimates through September, provided by ENEE. The source of information for this indicator has changed in relation to the First Progress Report, and therefore the goal has been recalibrated. For more details, refer to Appendix B1. 8 Data for 2004 are estimates through September, provided by CONATEL. The source of information for this indicator has changed in relation to the First Progress Report, and therefore the goal has been recalibrated. For more details, refer to Appendix B1.

30
2003 to 76.7% in 2004, in comparison to the goals of 70.7% and 71.9% for the same years.
53. The goal for the gender-related Human Development Index was met in 2003, just
reaching the proposed 0.65. Meanwhile, the gender empowerment index showed a trend toward improvement but not enough to achieve the goal proposed for that year (0.43, instead of the goal of 0.47). It is likely that this indicator will improve significantly in the 2004 report with approval of policy measures aimed at guaranteeing access to elected office for more women.
54. In relation to the environment, the goal for Priority Protected Areas with management
plans in place was met, achieving the specific goals for 2003 (15) and 2004 (23). Thus, the percentage of priority protected areas with management plans has evolved from 37.5% in 2003 to 57.5% in 2004. Finally, the air pollution indicator for urban centers is under review, since no annual data for monitoring is available and the methodology used for measuring contamination has varied from year to year.
55. To summarize, the indicators that showed permanent improvements during the 2001-
2004 period are macroeconomic indicators, and indicators for extreme poverty, education, electricity, telecommunications, human development, and the territory declared as protected areas. This translates into an approximate 18% improvement in relation to the goals proposed for 2015.
56. The main problems in achieving the PRSP goals have been related to health coverage
and service coverage, mainly water and sanitation. Despite government efforts to increase spending in these sectors, no significant progress has been made. Therefore, intervention strategies will need to be reviewed and an approach that better focuses resources on coverage will need to be developed, to insure greater impact on PRSP indicators.
57. Thus, what should be stressed is the generally improved performance of indicators,
which is verified when we add up fulfillment of goals in relation to levels achieved in the previous year. While 40% of the goals were met in 2003 (7 out of 17 observable goals), this percentage rose to 75% in 2004 (12 out of 16 observable goals), which is a significant improvement.

31
V. TRENDS IN POVERTY SPENDING A. EVOLUTION OF POVERTY SPENDING 58. This chapter deals with the financial implementation of the PRSP during 2001-2004.
This first section provides detailed documentation and analysis of PRSP spending by program area, by economic classification and source of financing. In the second section, the use of interim debt relief funds awarded to Honduras between 2001 and September 2004 is detailed.
59. The PRGF sought to ensure that the necessary fiscal adjustment was not undertaken at the expense of poverty-related spending. To this end, the 2004 PRGF agreement included a precise definition of poverty spending and a target was set for this to increase at 0.6% of GDP in each year of the program. At the same time, the definition of poverty spending was revised, following extensive discussions and consultation around the first PRSP Progress Report, which was submitted to the boards of the World Bank and IMF in the first quarter of 2004, together with the PRGF agreement itself.
60. The spending definition was widened from the conceptualization used in the original PRSP, drafted in 2000, which was limited in the main to externally funded investment operations. The new definition includes both current and capital expenditures and both externally and nationally funded activities.9 On this basis, poverty spending was estimated at 7.5% of GDP in 2003 and was slated in the PRGF program to increase to 8.1% in 2004.10
61. Particular attention was given to defining the poverty-related component of spending financed with national funds. This was necessary to ensure that HIPC debt relief led to additional poverty related spending, rather than substituting for expenditures that were already being undertaken with national funds.
62. To this end, in 2004 the Government reformed the Law of the Poverty Reduction Fund, to establish a “Virtual Fund”, along the lines of that established in Nicaragua and other HIPC countries. This change – which was supported by World Bank technical staff - replaced the previous tacking mechanism, which was a real fund in the Central Bank. The old mechanism was limited to ensuring that the direct product of debt relief was spent on poverty related items, without checking for fungibility in the rest of the fiscal program.
63. The new system for tracking poverty spending is centered on the Finance Secretariat’s Integrated Financial Administration system (SIAFI), which was strengthened with World Bank support during 2003-2204. The SIAFI system labels all expenditure items in the budget according to whether or not they fall within the poverty definition established in the first PRSP Progress Report. These definitions have also been applied retroactively to all financial years since 2000, allowing analysis of the global trend of poverty spending (on the new definition) during the period of HIPC Interim Relief (2001-2004).
64. Table V.1 summarizes the financial execution of the PRSP between 2000 and 2004, in Lempiras, and Table V.2 summarizes the same data as a ratio of GDP. The data show that total poverty spending stood at 8.2% of GDP in 2000, rose to 8.8% in 2001 (when
9 Annex D.4 summarizes the expanded definition of poverty spending. 10 These are the figures incorporated in the original PRSP Program – which was prepared before final fiscal data for 2003 were available. However the final figures for 2003 show poverty spending reached 7.8% of GDP in that year. The increase of 0.6% of GDP programmed for 2004 was still implemented, taking the total to 8.4%.

32
post-hurricane reconstruction spending was at its apogee); fell back to 7.5% in 2002 and then grew to 7.8% in 2003 and 8.4% in 2004. Thus, Honduras clearly met the PRGF goal of increasing PRSP spending by 0.6% of the GDP in 2004.
Table V.1 Honduras: Poverty Reduction Strategy
SUMMARY OF FINANCIAL IMPLEMENTATION Millions of Lempiras
2004 Program 2000 2001 2002 2003 Budgetted Real
1. Accelerating equitable and sustainable economic growth - - - 13.9 104.2 27.5
2. Reducing rural poverty 1,083.1 1,543.5 1,124.8 1,184.3 1,087.0 1,478.8 3. Reducing urban poverty 699.6 486.9 482.1 792.5 843.9 787.0 4. Investing in human capital 3,869.2 4,519.1 5,014.7 5,640.8 6,520.4 6,484.4 5. Social protection for specific groups 406.6 482.9 374.5 406.2 476.6 473.6
6. Guaranteeing the strategy’s sustainability 1,239.8 1,722.8 1,160.8 1,217.5 1,674.9 2,105.1
Total PRSP 7,298.3 8,755.3 8,156.8 9,255.2 10,724.0 11,356.4 Of which: Reconstruction 1,611.2 1,850.0 1,092.0 0 0 0 Not Reconstruction 5,687.1 6,905.3 7,064.8 9,255.2 10,724.0 11,356.4 Source of Financing National Funds 4,389.1 4,680.5 5,108.4 5,417.0 5,962.3 6,318.9 Loans 2,178.3 2,526.7 1,665.0 2,026.7 2,193.8 3,560.3 Donations 579.0 687.2 443.1 894.2 1,476.8 385.9 HIPC 152.0 860.8 940.3 917.3 1,091.1 1,091.2 Total PRSP 7,298.3 8,755.3 8,156.8 9,255.2 10,724.0 11,356.4Economic Classification Salaries 2,894.3 3,259.2 3,681.2 3,992.0 4,489.2 4.517.9 Goods and services 853.3 695.2 675.4 869.4 1,401.3 1,020.9Current transfers 546.9 855.8 864.1 1,177.7 1,281.1 1,597.1 Investment inc capital transfers 2,891.0 3,877.1 2,917.3 3,120.9 3,467.3 4,026.3Net lending 112.9 68.0 18.9 95.2 85.2 194.1 Total PRSP 7,298.3 8,755.3 8,156.9 9,255.2 10,724.0 11,356.4GDP 89,401.0 99,062.0 108,175.0 118,544.0 132,080.0 134,512.0Total PRSP USD$ mn 491.8 566.0 498.9 538.1 589.2 623.9 GDP USD$ mn 6,024.3 6,403.5 6,616.2 6,892.1 7,257.1 7,390.7 Exchange Rate 14.8 15.5 16.4 17.2 18.2 18.2Source: SEFIN and BCH 65. By Program Area, investments in human capital have been consistently the largest
item in the PRSP. In 2004, they accounted for 4.8% of GDP or 57% of the total. Second in importance are investments related to the sustainability of the strategy (1.6% of GDP, 19% of the PRSP total in 2004). Programs to reduce rural poverty in 2004 accounted for 1.1% of GDP (13% of the total). Programs focused on urban poverty were 0.6% of GDP (7% of the program total); social protection programs were 0.4% of GDP (5% of the PRSP total); and programs focused on economic growth were less than 0.1% of GDP (only 0.2% of the program total). However, the PRSP Implementation Plan for 2004-2006 (presented to the Consultative Group meeting in Tegucigalpa in June 2004) emphasized the need to increase investment in programs focused on faster, more equitable growth. The programs linked to the Millennium Challenges Account (MCA) financed by the US Government, presently under

33
negotiation, will concentrate in this part of the Strategy. As a result, this part of the PRSP budget will be considerably strengthened in 2005.
Table V.2 Honduras: Poverty Reduction Strategy
SUMMARY OF FINANCIAL IMPLEMENTATION % of GDP
2004 Program 2000 2001 2002 2003 Budgeted Real
1. Accelerating equitable and sustainable economic growth - - - 0.0 0.0 0.0
2. Reducing rural poverty 1.2 1.6 1.0 1.0 0.9 1.1 3. Reducing urban poverty 0.8 0.5 0.4 0.7 0.7 0.6 4. Investing in human capital 4.3 4.6 4.6 4.8 4.7 4.8 5. Social protection for specific groups 0.5 0.5 0.3 0.3 0.4 0.4
6. Guaranteeing the strategy’s sustainability 1.4 1.7 1.1 1.0 1.4 1.6
Total PRSP 8.2 8.8 7.5 7.8 8.1 8.4 Of which: Reconstruction 1.8 1.9 1.0 0 0 0 Not Reconstruction 6.4 7.0 6.5 7.8 8.1 8.4 Source of Financing National Funds 4.9 4.8 4.8 4.5 4.7 4.7 Loans 2.4 2.6 1.5 1.7 2.1 2.6 Donations 0.6 0.7 0.4 0.8 0.4 0.3 HIPC 0.2 0.9 0.8 0.8 0.8 0.8 Total PRSP 8.2 8.8 7.5 7.8 8.1 8.4 Economic Classification Salaries 3.2 3.3 3.4 3.4 3.3 3.4 Goods and services 1.0 0.7 0.6 0.7 0.5 0.8 Current transfers 0.6 0.9 0.8 1.0 1.2 1.2 Investment inc. capital transfers 3.3 3.8 2.7 2.6 2.9 2.9 Net lending 0.1 0.1 0.0 0.1 0.2 0.1 Total PRSP 8.2 8.8 7.5 7.8 8.1 8.4 Source: SEFIN
66. In 2004, the distribution of PRSP spending by economic category was as follows. A
little over 40% of the total was used for wages and salaries of workers providing basic services such as education and health,11 35% was used for investments (both direct investments by the Central Government and capital transfers to municipal governments and agencies such as the water company, SANAA). 14% of the resources were used for current transfers, and 9% for the purchase of goods and services (such as medicines).
67. The main source of financing for the portfolio of PRSP projects has been the National Treasury, which has financed an average of 63% of the total investment over the last four years, followed by loans (25%), and donations and HIPC funds, which have supplied an average of 7% and 4% of resources, respectively.
11 It should be noted that this calculation uses standardized salaries and does not take into account the total wage bill. For instance, teachers’ salaries are calculated as 3.5 times per capita GDP. This was agreed with the IMF during the negotiation of the PRGF to avoid salary rises being reflected as an increase in PRSP spending.

34
68. In 2004, the largest part of the funding for the PRSP, as in previous years, came from national resources (4.7% of GDP and 56% of the PRSP total). Loans from international development agencies were the second largest contributor (2.6% of GDP and 31% of the PRSP total). During 2004, the implementation rate for loan-funded programs surpassed that projected in the PRGF, in an amount equivalent to 0.5% of GDP. This more than offset the shortfall in the execution of PRSP programs funded by donations, which reached 0.4% of GDP compared with 0.5% in the PRGF projections, due to delays in implementation of the Education for All (EFA) Fast Track Initiative and of the Global Fund for HIV-AIDS and Tuberculosis.
69. HIPC interim relief financed poverty spending worth 0.2% of GDP in 2000, 0.9% in 2001 and 0.8% in each of 2002, 2003 and 2004. Total nationally funded poverty spending stood at 4.9% in 2000 and declined to 4.5% in 2003 before recovering to 4.7% of GDP in 2004. However, this analysis does not take into account the effect of post-hurricane reconstruction spending, much of which was classified as PRSP spending. HIPC Relief Additionality
70. The principle of HIPC relief additionality establishes that the debt relief must be invested in initiatives aimed at reducing poverty. This condition was established in Cologne, Germany in 1999. However, debt relief funds were also to be used to complement national efforts underway to combat poverty (using national resources). Thus, HIPC relief should not be fungible, and should be added to—in other words, complement—internal Poverty Reduction efforts.
71. At first sight, in the data presented in Table V.2, it appears that there may have been a tendency for part of the HIPC relief to “crowd out” nationally funded poverty spending, since the latter declines from 4.9% of GDP in 2000 to 4.5% in 2003, rising back to 4.7%in 2004. However, in order to provide an undistorted measure of the underlying trends in poverty spending, it is necessary to distinguish between post-hurricane reconstruction spending and the rest of the PRSP.
72. This is done in Table V.3, which provides details of the total national budget in nominal Lempiras between 2000 and 2004, distinguishing between non-reconstruction PRSP spending; PRSP spending related to reconstruction; and non PRSP spending. It can be seen that adjusted pro-poor spending (excluding spending related to Hurricane Mitch) has grown systematically and at a higher rate than total spending, even greater than the increase in interim debt relief resources that have been awarded, despite delays in reaching the Completion Point.
73. Table V.4 presents a detailed summary by spending source of PRSP spending excluding reconstruction spending, in nominal Lempiras and in % of GDP. The data show that on this adjusted definition, poverty spending stood at 6.4% of GDP in 2000. This rose to 7.0% in 2001, fell back slightly to 6.5% in 2002 and recovered strongly to 7.8% in 2003 and 8.4% in 2004, in line with PRGF program targets. Within this total, nationally funded poverty spending (excluding reconstruction spending) can be seen to have remained steady between 2000 and 2004.
74. In summary, the data presented in this section show that Honduras met the target for poverty spending subscribed in the PRGF for 2004. It has also met its obligation to

35
establish a transparent tracking system for poverty spending and to assign debt relief to additional poverty related spending.
Table V.3 -Honduras: HIPC Relief Additionality
MILLIONS OF LEMPIRAS PROYECCION
DESCRIPCION 2000 2001 2002 2003 2004 a/ 2005 b/
TOTAL REVENUES 16,753.1 19,807.7 20,977.3 23,632.4 27,821.1 31,105.0 d/c Donations 881.0 1,739.0 1,138.3 1,328.2 1,295.0 2,084.0 TOTAL SPENDING 21,769.1 25,634.0 26,644.8 30,738.1 32,548.6 35,570.0 Payment of Interest 2,306.4 2,128.9 2,046.9 2,292.6 2,364.0 2,618.0 Total PRSP Spending 7,298.4 8,755.3 8,156.8 9,255.1 11,356.4 12,850.0 PRSP Spending not related to MITCH 5,687.1 6,905.3 7,064.8 9,255.1 11,356.4 12,850.0
Financing Internal 3,991.2 4,595.8 4,906.6 5,417.0 6,319.2 7,669.2 External (incl. Donations) 1,695.9 2,309.5 2,158.2 3,838.1 5,037.4 5,180.9 HIPC Relief c/ 152.0 860.8 940.3 917.3 1,091.1 1,576.7 Other 1,543.9 1,448.7 1,217.9 2,920.8 3,946.2 3,604.2 PRSP Spending related to MITCH 1,611.2 1,850.0 1,092.0 - - -
Financing Internal 397.9 84.7 201.8 - - - External (incl. Donations) 1,213.4 1,765.3 890.2 - - -
Total Non-PRSP Spending 12,164.4 14,749.8 16,441.1 19,190.4 18,828.2 20,102.0 Financing Internal 11,173.1 12,211.6 15,013.1 17,440.4 17,381.5 17,340.6 External (incl. Donations) 991.3 2,538.2 1,428.0 1,750.0 1,446.7 2,761.4
BALANCE (5,016.0) (5,826.3) (5,667.5) (7,105.7) (4,727.5) (4,465.0)
Financing 5,016.0 5,826.3 5,667.5 7,105.7 4,727.5 4,465.0 Net External Financing 1,111.9 2,731.8 873.6 2,116.8 5,708.0 2,915.0 External Resources (excl. don.) 3,019.5 4,874.0 3,338.1 4,259.9 7,179.4 6,216.0 Amortization 1,907.6 2,142.2 2,464.5 2,143.1 1,471.4 3,301.0 Financing Gap 1,539.0 Internal Financing 3,904.1 3,094.5 4,793.9 4,988.9 (980.5) 11.0a/ December b/ Includes saving due to reingeneiring measures for L. 326 mm c/ Includes Multilateral Relief (HIPC including CABEI) and Bilateral Relief (Paris Club)
Source: SEFIN

36
Table V.4 – Honduras PRSP Spending excluding hurricane reconstruction
2000 2001 2002 2003 2004 Lempiras, mn National funds 3,991 4,596 4,907 5,417 6,319 Loans 1,354 1,538 900 2,027 3,560 Donations 190 -89 318 894 386 HIPC Total 152 861 940 917 1,091
Paris Club 0 0 132 547 599 Mulilateral & Commercial 152 861 808 370 492
TOTAL 5,687 6,905 7,065 9,255 11,356 % of GDP National funds 4.5 4.6 4.5 4.6 4.7 Loans 1.5 1.6 0.8 1.7 2.6 Donations 0.2 -0.1 0.3 0.8 0.3 HIPC Total 0.2 0.9 0.9 0.8 0.8
Paris Club 0.0 0.0 0.1 0.5 0.4 Mulilateral & Commercial 0.2 0.9 0.7 0.3 0.4
TOTAL 6.4 7.0 6.5 7.8 8.4 Source: SEFIN and BCH
B. UTILIZATION OF HIPC FUNDS
a. Interim HIPC Debt Relief received
75. The Decision Point Document for Honduras (DPD) provided for interim relief between July 2000 and July 2002, which was the date originally set for the Completion Point. However, this period was extended due to the delay in reaching the Completion Point. Table V.5 provides details the HIPC Debt Relief received by Honduras to date, which totals USD$256.8 million.
76. The World Bank (WB) began delivery of debt relief in December 2000 in the form of a quarterly donation modality (transfers) covering approximately 50% of the debt service paid during the previous quarter. By July 2002, the WB had awarded the total interim debt relief specified in the DPD, totaling US$36.8 million and further relief was suspended pending Completion Point.
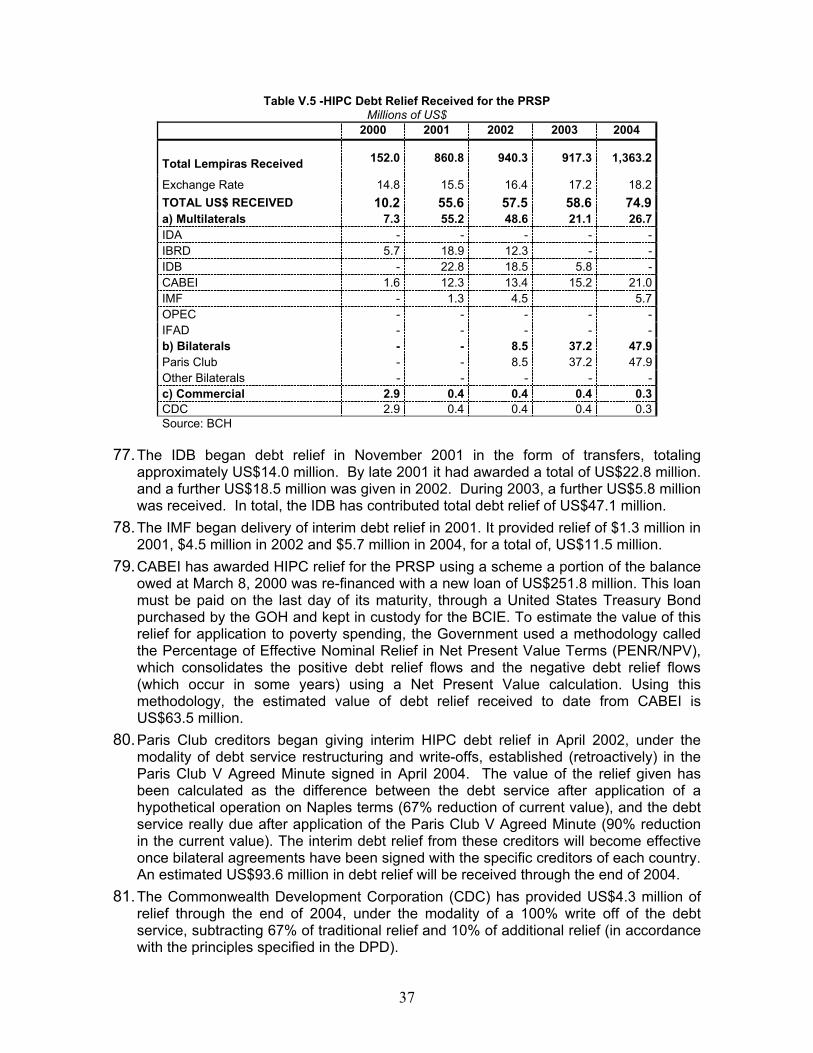
37
77. The IDB began debt relief in November 2001 in the form of transfers, totaling approximately US$14.0 million. By late 2001 it had awarded a total of US$22.8 million. and a further US$18.5 million was given in 2002. During 2003, a further US$5.8 million was received. In total, the IDB has contributed total debt relief of US$47.1 million.
78. The IMF began delivery of interim debt relief in 2001. It provided relief of $1.3 million in 2001, $4.5 million in 2002 and $5.7 million in 2004, for a total of, US$11.5 million.
79. CABEI has awarded HIPC relief for the PRSP using a scheme a portion of the balance owed at March 8, 2000 was re-financed with a new loan of US$251.8 million. This loan must be paid on the last day of its maturity, through a United States Treasury Bond purchased by the GOH and kept in custody for the BCIE. To estimate the value of this relief for application to poverty spending, the Government used a methodology called the Percentage of Effective Nominal Relief in Net Present Value Terms (PENR/NPV), which consolidates the positive debt relief flows and the negative debt relief flows (which occur in some years) using a Net Present Value calculation. Using this methodology, the estimated value of debt relief received to date from CABEI is US$63.5 million.
80. Paris Club creditors began giving interim HIPC debt relief in April 2002, under the modality of debt service restructuring and write-offs, established (retroactively) in the Paris Club V Agreed Minute signed in April 2004. The value of the relief given has been calculated as the difference between the debt service after application of a hypothetical operation on Naples terms (67% reduction of current value), and the debt service really due after application of the Paris Club V Agreed Minute (90% reduction in the current value). The interim debt relief from these creditors will become effective once bilateral agreements have been signed with the specific creditors of each country. An estimated US$93.6 million in debt relief will be received through the end of 2004.
81. The Commonwealth Development Corporation (CDC) has provided US$4.3 million of relief through the end of 2004, under the modality of a 100% write off of the debt service, subtracting 67% of traditional relief and 10% of additional relief (in accordance with the principles specified in the DPD).
Table V.5 -HIPC Debt Relief Received for the PRSPMillions of US$
2000 2001 2002 2003 2004
Total Lempiras Received 152.0 860.8 940.3 917.3 1,363.2
Exchange Rate 14.8 15.5 16.4 17.2 18.2 TOTAL US$ RECEIVED 10.2 55.6 57.5 58.6 74.9 a) Multilaterals 7.3 55.2 48.6 21.1 26.7 IDA - - - - - IBRD 5.7 18.9 12.3 - - IDB - 22.8 18.5 5.8 - CABEI 1.6 12.3 13.4 15.2 21.0 IMF - 1.3 4.5 5.7 OPEC - - - - - IFAD - - - - - b) Bilaterals - - 8.5 37.2 47.9 Paris Club - - 8.5 37.2 47.9 Other Bilaterals - - - - - c) Commercial 2.9 0.4 0.4 0.4 0.3 CDC 2.9 0.4 0.4 0.4 0.3 Source: BCH

38
b. Assignment of Debt Relief
82. HIPC debt relief resources have been earmarked according to agreements made in the
framework of the HIPC Decision Point for Honduras. As detailed in Table V4, US$236.63 million had been implemented up to the end of 2004. Most of the investment has been earmarked for human capital, especially for education and health.
83. Spending of HIPC resources has represented less than an average of 1% of the GDP per year, concentrated during the four years mainly on implementation of the Honduran Community Education Program (PROHECO), support to formal primary schools, and support to formal primary education. In the area of health, most of the resources have been earmarked for hospital care and epidemiological control of diseases via Investments in Human Capital. An additional 9% of the total debt relief resources have been earmarked for social protection networks, specifically vouchers awarded by the Family Allotment Program (PRAF). Finally, 6% of the resources were invested in projects aimed at reducing poverty in rural zones. Appendix D presents more detailed information about the use of HIPC funds by program.
84. There is a small remainder of debt relief received to date which has not yet been
applied to PRSP programs, estimated at $20.2 million, as shown in table V.5. This will be applied to PRSP spending in 2005.
TABLE V.6HONDURAS: USE OF INTERIM DEBT RELIEF FUNDS, BY PROGRAMMATIC AREA PROGRAMMATIC AREA / PROJECT 2000 2001 2002 2003 2004
MILLIONS OF DOLLARS
1. Accelerating equitable and sustainable economic growth
-
-
-
-
-
2. Reducing poverty in rural zones -
0.20
1.57
1.45
-
3. Reducing poverty in urban zones -
9.18
9.76
4.90
-
4. Investing in human capital
6.50
23.12
23.68
28.55
5. Strengthening social protection for specific groups.
3.70
13.40
11.75
7.32
6. Guaranteeing the strategy’s sustainability 0.00 9.75
10.76
11.12
TOTAL 10.20 55.64 57.51 53.33 59.95
PERCENTAGE OF GDP
1. Accelerating equitable and sustainable economic growth
-
-
-
-
-
2. Reducing poverty in rural zones -
-
0.02
0.02-
-
3. Reducing poverty in urban zones -
0.14
0.15
0.07
-
4. Investing in human capital 0.10
0.36
0.36
0.41
5. Strengthening social protection for specific groups
-
0.21
0.18
0.11
6. Guaranteeing the strategy’s sustainability 0.04
0.15
0.16
0.16
TOTAL 0.14 0.87 0.87 0.77 0.88
Source: BCH/SEFIN

39
Source: BCH
c. HIPC Debt Relief for the PRSP beyond the Completion Point
85. The amount of HIPC debt relief that is expected after achieving the Completion Point (estimated for March 2005) is calculated on the basis of the following assumptions. Each participating creditor (the World Bank, IDB, IMF, IFAD and OPEC) will calculate the remaining amount of debt relief taking account of Interim Relief already given, so that the total will be equal to the amount defined on the basis of the Common Reduction Factor specified in the Decision Point Document.
86. The debt relief modality proposed by OPEC is to award a new loan whose resources, combined with the profit from the investment of the same, are used to pay the debt service. In this way, relief that is channeled to the PRSP is calculated on the basis of the methodology (PANE/VPN) agreed upon by the WB and the GOH. In the case of the BCIE, debt relief is calculated on the basis of the prepayment agreement signed in March 2000, and using the same methodology. Debt relief for the CDC has been calculated on the basis of a 100% write of the balance at the moment of the Culmination Point, minus 67% of traditional relief and 10% of additional relief.
87. For the Paris Club creditors, the relief has been calculated on the basis of a debt restructuring and write off modality, reducing the eligible debt by 90% of its present net value according to the Cologne financial terms, effective as of April 2005, and subtracting the service resulting from application of the Cologne balance operation from the debt service remaining after the (hypothetical) balance operation in Naples terms.
88. For the bilateral creditors who are not members of the Paris Club, debt relief has only been calculated for Costa Rica, based on this nation’s willingness to receive such relief (according to responses to notifications sent by the Central Bank of Costa Rica). In addition, the case of Venezuela has also been considered in the negotiations that the GOH is currently conducting. Meanwhile, the remaining bilateral creditors who are not members of the Paris Club have indicated that they will not take part in awarding debt relief.
89. Based on the information expressed in the paragraphs above, it is calculated that US$838.2 million in external debt relief will be received for the 2000-2018 period for PRSP spending in the framework of the HIPC Initiative. Of this amount, US$256.8 million will have been received by the end of 2004, thus US$581.4 million will be received in the 2005-2018 period.
Table V.7 Honduras: Reconciliation of HIPC Debt Relief received and applied to the PRSP, 2000-2004
2000 2001 2002 2003 2004 TOTAL HIPC Relief received for the PRSP, US$ 10.2 55.6 57.5 58.6 74.9 256.8
HIPC Relief Utilized, US$ 10.2 55.6 57.5 53.3 59.9 236.7
Annual difference - - - 5.3 14.9 20.2
Accumulated difference - - - 5.3 20.2 -
Exchange Rate 14.8 15.5 16.4 17.2 18.2 -
Debt Relief Utilized (Millions of Lempiras) 152.0 860.8 940.3 917.3 1,091.1 3,961.5

40

41
VI. PROGRESS BY PROGRAMMATIC AREA
90. This chapter centers on progress made in the financial and physical implementation of PRSP programs and projects. In addition, it enumerates the reforms to sector policies that adjust them to the PRSP’s programmatic structure, and the evolution of intermediate indicators of the fulfillment of program goals.
A. AREA I: EQUITABLE AND SUSTAINABLE ECONOMIC GROWTH
a. Policy Measures
91. PRSP implementation has taken an important turn, shifting its focus to economic growth that favors the poor. The presentation of the 2004-2006 PRSP Implementation Plan at the Meeting of the Consultative Group in Tegucigalpa marked the launching of this proposal, whose purpose is revitalizing the economy in a framework of general well being. Some of the most noteworthy actions developed were: • Approval of the Administrative Simplification Law. • Approval of the Finance System Law and reform of the CNBS Law, the BCH Law
and the Insured Deposits Fund (FOSEDE) Law. • Approval of Copyright Protection Laws and norms. • As part of Central American integration efforts, approval of the work program for
the Central American Customs Union by the presidents of Central America. • Conclusion of the FTA negotiations with the United States. • Creation of the National Competitiveness Commission. • Establishment of the National Center to Promote Agro-Business. • Creation of the Tourism Cabinet and Tourism Police. • Approval of a policy to support competitiveness among MIPYMEs.
92. The nation’s possible qualification for the US Government’s Millennium Challenge
Accounts (MCA) will provide access to resources for productive infrastructure development, such as: the Logistical Corridor, which links the Atlantic and Pacific littorals; access roads linked to the Logistical Corridor; and a series of irrigation projects for the neediest sectors.
b. Program and Projects
93. The Government is strengthening the road network through investments in rural roads and primary and secondary road networks, and through improving access both within and outside of the country. This takes place in the context of the CAFTA agreement and support to the productive sector via micro-enterprises. Currently, 50 micro-enterprises located in different zones of the country are generating direct benefits to more than 600 people, and indirect benefits to close to 4,000. Approximately 2,777 kilometers of the paved road network are being serviced, and the goal for next year is inclusion of another 5 micro-enterprises. In addition, approximately L.7.5 million have been allotted to implementing “aperture,” maintenance and small-scale construction projects (bridges, modules, etc.) as part of specific attention to ethnic communities.
94. The percentage of the maintained road network has grown from 21.03% (2000) to
49.98% (2003), and some 50.49% of the road network has received maintenance to date in 2004. In addition, roads constructed that are not part of the official road

42
network have increased from 96 kilometers (2001) to 225 kilometers (through September 2004). This clearly demonstrates the Government’s commitment to public investment in this area, whose Road Fund is expected to cover 60% (7,920 km) of the road network in 2004, 70% in 2005, and 25% in 2006. .
95. With respect to the energy sector, ENEE has provided technical assistance through
developing biomass, wind, geothermal and hydroelectric projects. In 2003, 18 renewable energy contracts were approved—both biomass and hydroelectric—and 6 additional contracts are anticipated in 2004. The electricity coverage indicators show that 2.6% increases had been registered between December 2003 (62.09%) and September 2004 (63.71%), as a result of the national electrification process. In 2003, 241 social electrification works were concluded nationwide, with an approximate investment of US$6.6 million, which signified an additional 17,725 households receiving electricity service. A total of 134 projects were concluded by September 2004, with an investment of US$3.5 million and 7,950 households electrified. By the end of 2004, national electricity coverage is expected to reach 65.94% of the population.
96. With respect to sector reforms to improve efficiency, the Government is planning to
expand its generation capacity through contracting private generators, to adjust tariffs in order to compensate ENEE for operational losses and the rises in oil prices, and to restructure the organization of electricity services through separating generation, transmission and distribution.
97. In the area of telecommunications, and in the context of the “competitiveness”
agenda, progress has been made in deregulating markets. This effort began in 2003 and the goal is to have achieved definitive deregulation by late 2005. Thus, the “Telephones for All” program was implemented (via private providers with rates set freely on the basis of costs), to deregulate the local call market, and a second cell phone concession was awarded to the Megatel Company. Progress restructuring HONDUTEL has continued, with the goal of readiness for deregulation by 2006.
98. In this context, the National Fiber-Optic Network was created, the Domestic Satellite
Network was modernized, and the National Microwave Network was also modernized with 70 new links, the total digitalization of the network, and expansion of the MAYA 1 submarine cable. In addition, rate plans that reduce the cost per minute for local, national and international calls were instituted. Other noteworthy advances included the installation of 15,000 lines in Tegucigalpa, San Pedro Sula and Catacamas, the acquisition of 20,000 lines for different neighborhoods in the Central District and 8,000 lines for Tegucigalpa and San Pedro Sula through the copper pairs multiplier system as an access network. All of these efforts increased the fixed line density for every 100 inhabitants by 5.3%, which increased from 4.87 (2003) to 5.13 (September 2004).
99. As part of its plans and strategies for developing tourism, the Government of
Honduras is carrying out actions to develop the first Comprehensively Planned Tourism Center (CIP) in the Tela Bay Region. This is expected to form a comprehensive tourism cluster, which will join sites that have already been consolidated at the international level (the Bay Islands and the Copán Ruins). The CIP is an element that “detonates” tourism development, acting as a distribution center for consolidated tourism development poles and the rest of the country. In this context, initiatives that tend to strengthen micro- and small-scale tourism enterprises and/or

43
tourism-related activities are being supported, through managing the Sustainable Coastal Tourism Project and activating the Prosperity Fund, placing special emphasis on capital support to this productive sector, employment generation, productive development and business opportunities.
c. Intermediate Indicators
100. The main macroeconomic indicators have shown a certain level of stability. For instance, the Monthly Economic Activity Index (IMAE) rose from 216.9 in 2003 to 221.3 in 2004, which predicts a 4.0% or more increase in the real GDP. The external value of currency has had acceptable variations, with an average 4.7% drop in relation to the dollar in recent years, and a drop of 4.5% in 2004. The cost of money has tended to decrease in recent years, with a decrease in the real active interest rate from 13.4% in 2003 to 11.0% in 2004, for a 2.4% reduction. Public investment had reached 1.8% of the GDP in September of 2004, which makes it likely that the percentage invested in 2003 (2.3%) will be surpassed.
101. The amount of foreign exchange generated by tourism has tended to grow,
reaching 12.8% of total exports in 2004 (by September 2004), already surpassing the amount generated by the end of 2003 (12.4% of total exports). Substantial increases were also observed among traditional exports and non-traditional exports, and the promotion of foreign investment also increased the aggregate value of maquila industries, accounting for 1 in 12 companies opened during 2003 and 2004.
B. AREA II: REDUCING POVERTY IN RURAL ZONES
a. Policy Measures 102. To reduce rural poverty, the equitable, safe and sustainable access to factors of
production is sought, along with the generation of employment and income and access to basic services through participatory mechanisms. Some of the key actions aimed at achieving these goals included: • Approval of the Law to Strengthen Agricultural Producers (June 2003), which
consolidated corresponding benefits into one single legal instrument and restructured and relieved the debts of more than 13,000 producers.
• Approval of the Property Law on May 28, 2004, which also creates the Property Institute.
• A total of 25,132 property titles have been issued, benefiting 629 farmers from the agrarian reform sector, especially peasant businesses; 24,482 independent farmers obtained individual titles and some 21 ethnic groups received community titles. Thirty percent of the titles have been issued to women.
• Between 2001 and September 2004, the National Fund for Production and Housing (FONAPROVI) awarded L.4.09 billion for reactivating agricultural production. Through BANADESA, approximately L.1.027 billion was awarded between 2001 and September 2004, mostly to finance the agriculture sector. Alternative Rural Financing Systems (SIFARs) have been created to benefit small-scale farmers who plant on terraced lands and upper watersheds, and different ethnic groups.
• With financing from the private finance sector, the Land Access Project (PACTA) has generated profitable business opportunities and developed business skills

44
among the agriculture sector, through establishing productive enterprises on private lands. A total of 355 families have benefited from setting up 25 productive enterprises in 23 municipalities located in 9 provinces of the country.
• A Gender Equity Policy for Honduran Agro (PEGAH) is being implemented, which crosscuts all levels of this sector. By 2004, the incorporation of rural women under equal conditions had increased by 54% through the coordination and articulation of the public agricultural sector, INAM, local governments/AMHÖN, NGOs and women’s organizations linked to development.
• Around 23,000 hectares of land were incorporated into the irrigation system during the 2002-2004 period, which signified 58% of the Government’s goal of 40,000 hectares (10,000 hectares per year).
• In June 2004, in the framework of the Agro-Forestry Roundtable, the Agro-Forestry Sector Strategic Plan for 2004-2006 was concluded, which defines priority policy measures for the sector.
• Agricultural diversification was promoted as a production alternative for national producers of grapes, papaya (for vegetable use), oriental vegetables, pitahaya, annatto, medicinal plants, stevia and cassava. The program on Lethal Cocotero Yellowing was continued, to help supply plant varieties that are resistant to this pest. The first Map of Potential Agricultural Zones in Honduras was produced using precision techniques.
• The State Policy on Food and Nutritional Security for 2004-1015 is being formulated.
b. Program and Projects
103. Programs and projects financed with approximately L.4.712 billion were
implemented during the 2001-2004 period, some 29% of which were financed with national funds and 66% with foreign loans. The most important of these programs included:
• The National Sustainable Development Program (PRONADERS), which has
benefited a total of 288,461 rural families during the 2001-2004 period through 21 rural development projects. The resources of these projects mainly target improvements in productivity, natural resource management, crop diversification, and strengthened food security. Approximately 30.3% of the funds earmarked for Reducing Poverty in Rural Zones are used for this project. The main projects implemented by PRONADERS are:
• Rural Areas Administration Project (PAAR—now called the Honduran Land Administration Program, or PATH), with L.467.8 million (10% of the funds for Reducing Poverty in Rural Zones);
• Development of Water Resources in the Nacaome Valley, with L 351.8 million; • National Reconstruction Master Plan/FHIS, with L.350.8 million. This project has
benefited a total of 894,000 inhabitants in rural zones with water and sanitation projects;
• The Department of Agricultural Science and Technology (DICTA), with L.265.6 million. Technical assistance has been provided for the production of basic grains, vegetables, and fruits, among others.
• Diverse Communal Support Projects for the Poor, with L.185.0 million; • Electricity Social Development Fund, with L.149.5 million; and

45
• Sustainable Rural Development Project in Ecologically Fragile Zones of the Trifinio Region (PRODERT), with L.26.4 million.
• Rehabilitaiton of the El Coyolar Dam and improvement of the Irrigation Network of the Flores and Selguapa District, with L.105.3 million.
c. Intermediate Indicators
104. Six agro-food chains that work with dairy products, African palms, vegetables,
honey, pork and beef products were set up (benefiting approximately 70,000 farmers nationwide); and the Center for Agro-Business (CDA) was created, to help strengthen skills for negotiating and commercializing products
105. Some 300 forestry agro-businesses are currently operating on an area of 250,000
hectares with the participation of more than 13,000 families. In addition, 50 micro-enterprises have been set up for small-scale production of non-agricultural products, promoted mainly by PRONADERS.
C. AREA III: REDUCING POVERTY IN URBAN ZONES
a. Policy Measures 106. To stimulate development of Micro, Small and Medium Scale Enterprises
(MIPYMEs), more actions that support innovative financial services and products have been undertaken to satisfy immediate needs. The Competitiveness Policy has been developed and implemented, to support MIPYMEs and the economy’s social sector. Through this, programs and projects that stimulate economic and productive development will be defined, to improve and consolidate the competitiveness of this sector’s enterprises and organizations.
107. To support social interest housing, a legal and institutional framework was
defined to strengthen regulations for this sector and better synchronize the construction of human settlements while reducing ecological vulnerability. These factors are included in the draft framework law for the sector, which is currently being reviewed and will later be presented to the National Congress.
108. To improve access to basic services in priority areas, a framework Law for
Potable Water and Sanitation was approved. Its objective is promoting an expansion of coverage, assuring quality, and establishing a management framework for protecting and preserving water sources and managing sanitation. It also establishes the criteria for assessing services, setting tariffs and defining compensatory and “social solidarity” mechanisms to guarantee access to these services by the most vulnerable social groups. It is also aimed at better organizing the management of services, giving municipalities preference for making use of surface or underground waters.
. b. Program and Projects
109. The total amount invested in this programmatic area during the 2001-September
2004 period was L.2.407 billion. Interventions were mainly financed with reimbursable external resources (47.3%), followed by donations (31.2%) and the rest with national resources.

46
110. Most of the resources were used for providing access to basic services in priority
areas where the potable water and sanitation projects are located. Financial implementation for this area was L.1.616 billion.
111. A total of L.713.0 million was used to finance “social interest” housing. Some of the
key projects in this area included the IDB-1037 Post-Hurricane Housing Program, the Solidarity Housing Reconstruction Program, the Minimal Rural Housing Program and Urban Dwelling Improvement Program (PRIMHUR), and finally L.78.5 million for the sub-component to develop intermediate-sized cities.
112. One of the actions supporting the development of social interest housing was the
SOPTRAVI- AMHON Agreement (Association of Honduran Municipalities), whose objective is assisting families with high poverty levels in urban or rural zones. This agreement has total funding of more than L.30.0 million, and finances both the construction of new homes and improvements to existing homes (as long as they are not in high risk zones), benefiting a total of 1,187 families. The project is located in six of the nation’s poorest provinces. It is expected to conclude in December 2004.
113. One of the main investments related to access to basic services is the SANAA
projects, some of the most noteworthy of which are: Supplying Water to Developing Neighborhoods, with an accumulated implementation of over 80%; Rehabilitation and Improvement of the Potable Water and Sewage Systems, with 50% implementation; Sewage and Water Systems for Marginal Neighborhoods of Tegucigalpa (PRRAC), which is in the pre-investment stage; and the Water Purification Plant Project, which has concluded its second phase and is beginning its third.
114. The objective of Investing in Potable Water and Sewage Systems is to expand and
improve potable water and sanitation coverage through renovating existing infrastructure and building new works. The following related documents have been written: i) Basic Document for Pre-Classifying Construction Works in the Catacamas and Tela Municipalities; ii) Initial Report on the Development of Municipal Policies (Consultancy); iii) Description of the scope of the Siguatepeque Municipality Program; and iv) Strategy for Transferring Potable Water Services from SANAA to the Municipalities.12
D. AREA IV: INVESTING IN HUMAN CAPITAL 115. The component on developing human capital receives the largest amount of PRSP
resources. When implementation of the PRSP began in 2001, 52% of PRSP spending was earmarked for investments in education and health. In 2004, this percentage is closer to 60%. An average of approximately L.4.8 billion has been invested annually, 68.9% of which has been used to expand the coverage and improve the quality of education, and 31.1% for guaranteeing more and better access to health services.
12 Actions underway: i) Bidding by consulting firms for the development of feasibility studies and final designs for the Choloma municipality; ii) the Tela municipality signed a contract for purchase of land where the sewage treatment plant will be constructed; iii) a competition was organized for hiring the firm that will review and expand the existing study about the Choluteca water system, which will be financed with a donation from the Swedish Government.

47
1. EDUCATION
a. Policy Measures
116. The PRSP policy measures for the education area are mainly intended to improve the coverage, quality, efficiency and equity of education, at different levels. The following progress has been made in this respect: • The Education for All Plan for Honduras for 2003-2015 has been designed,
approved and initiated, with resources totaling US$86 million. The objective is to achieve universal sixth grade graduation for all school-age children by 2015.
• Draft legislative reforms—the General Education Law and the UNAH Organic Law—have been harmonized by the National Congress’s Education Commission.
• The norms that will regulate obligatory preschool attendance by five-year-old children were defined.
• The Deconcentrated Management Model was implemented, which includes the new organic-operational structure for different Education Departments and their corresponding regulations, and the transformation of District Departments to Municipal Departments.
• The twelve teacher training schools were converted into higher education centers for the initial training of already working teachers, and academic and/or vocational training centers (secondary level).
• The national network for educational research and training was created, made up of four schools associated with the INICE, and 2,725 Teacher Education Centers (CADs).
• The national curriculum for preschool and primary education was officialized and is being used in the nation’s 18 provinces.
• Teachers received comprehensive training about the National Primary School Curricula (CNB).
• New school textbooks related to the new CNB were produced. • The UMCE conducted academic performance tests with students about basic
subjects so that corrective measures related to teacher and student performance could be applied.
• 719 primary schools were converted into middle schools (7th-9th grades). • 4,240 positions were created in the preschool and primary levels in 2002 and 2003,
and 812,915 hours/class were assigned for attending to primary and vocational education.
• The National Primary School Curricula was adapted to the Bilingual Inter-Cultural Education model, and educational materials were reviewed and adjusted.
• The Information and Statistics System and the Comprehensive Teacher Administration System (SIARHD) are operating.
b. Financial and Physical Implementation of Programs and Projects
117. Of the total funds implemented in the education sector between 2001 and September 2004, 86.4% were national funds, 6.3% loans, 6.5% HIPC funds, and 0.8% donations.
118. Of the total funds invested during the period, 75.8% were for projects aimed at
expanding the coverage of primary, secondary and technical education, 9.3% for

48
formal preschool education, 6.5% for PROHECO, 2.3% for scholarships, 1.7% for alternative education, and the remainder for school infrastructure and pedagogic and technical support.
119. Although financing for different programs and projects came from national sources,
loans, HIPC resources and donations, some 86% of national resources were focused on projects to expand primary, secondary and technical education, while 93% of loans were earmarked for PROHECO, community education, primary and secondary education, and Education for All (EFA). Some 75% of donations were assigned to formal primary schools and alternative education, while 39% of HIPC resources were used for PROHECO, 23% for formal primary education, and 20% for formal primary schools.
120. These projects had the following results:
• 1,697 Central Education Projects (PEC) were implemented. • 4,000 ADELs were organized, trained and legalized as uni- and bi-teacher
schools and primary schools (“basic education centers”). The equivalent of US$1,000.00 is contributed to 3,023 of these schools annually.
• 1,000 student governments were organized. • 5,937 PROHECO schools were created, with annual transfers of approximately
L95,018 per year per school. • 603 Preschools (CEPREBs) were organized. • Educational software was installed in 400 computers of different schools, and
teachers from innovative education rooms received training. • 150,000 young people and adults who were not enrolled in the formal school
system were attended annually through alternative service delivery systems. • 5,818 facilitators were trained in alternative education. • 18,000 teachers were trained about different themes related to the educational
transformation and the CNB. • An average of 142,000 students has received scholarships and vouchers every
year. • 2,097 projects to build expand and repair schools—preschools, primary,
vocational and secondary schools—were implemented.
c. Intermediate Indicators
121. Institutional indicators tended to improve during 2001-2004 (see Appendix B2). The proportion of fiscal spending in the sector with respect to the GDP grew systematically, although not as specified in Appendix D.1 (Appendix C from the First Report). Meanwhile, net coverage goals for the first and second cycle of primary education are consistent with the intermediate indicators for dropouts and grade repetition.
122. On the other hand, although there is no comparative data about dropouts, this rate reached 7% in 2003, which means that 93 out of every 100 children who enroll in school remain there. This result can be explained in part by the expansion of programs aimed at reducing school dropouts, such as the school snack program and other incentives to generate demand.

49
2. HEALTH SECTOR a. Policy Measures
123. The PRSP priorities for the health sector are focused on strengthening primary
care, mother and child care, and better quality health services all around. During the 2001-2004 period, the main policy measures linked to these goals were:
• Developing the framework for the reform process based on separating
functions within the health sector, and strengthening the regulatory role of the Health Secretariat, which includes:
Establishment of eighteen Provincial (Departmental) Health Regions and two Metropolitan Health Regions, and implementation of the process.
Initiation of licensing, accrediting and certifying public and private health establishments.
Initiation of certifying private health service providers that offer basic health service packages.
Auditing work posts (underway), to organize and manage personnel linked to the Health Secretariat.
Incorporation of the decentralization of 9 hospitals into the general budget allotments for 2005, as an initial experience.
• Initiating implementation of the Maternal-Infant Mortality Initiative, which includes:
Implementation of the training program for addressing maternal and infant mortality during the neonatal period.
Development of national norms for maternal-neonatal care. Implementation of a program to monitor and analyze maternal and infant
deaths. Development of a proposal for expanding Community-AIN. Adaptation of the service network, to strengthen implementation of the
Comprehensive Care Strategy for Children (AIEPI). • Updating graduate level curricula on child and adolescent care, in collaboration
with the School of Nursing of the UNAH.
• Strengthening the framework of health policies through formulating the Strategic Health Plan for 2021, the mother-child health policy, and the nutrition policy.
b. Programs and Projects
124. Of the total funds utilized in the health sector through September 2004, 76.3% were national funds, 11.1% were loans, 6.4% were HIPC funds and 6.2% were donations. Approximately 86% of these resources have been invested in programs and projects related to outpatient care, epidemiological control of diseases, and hospital care. An average of L.1.2 billion has been assigned annually to finance these projects.
50
125. Some 91% of national resources have been earmarked for the hospital network via acquisition of medicines and surgical equipment and strengthening primary care, particularly the sustainability of the expanded program of immunizations and comprehensive community-based care for children (AIN-C).
126. Donated resources complement or strengthen the performance of the primary care
network. One outstanding program has been “sustainable improvements to family health,” through which child survival services are provided, along with the use of practices to prevent Sexually Transmitted Diseases and HIV/AIDS, services to control and prevent malaria, tuberculosis and dengue, and reproductive health care. Also, the PRRAC project in health and sanitation provides training to institutional and community personnel, equips health centers, provides communal medication funds, and constructs health care infrastructure.
127. Loan resources are used for the “institutional reorganization and health service
expansion” program (PRIESS), and the health sector reform project. The main interventions include:
• Implementing local level strategies, currently covering 64 municipalities, 675
communities, and a population of more than 200,000. • Extending coverage through new management and financing models for health
service provision, through external service providers in Mancorsaric in Copan and el Guante in Francisco Morazan.
• Modernizing (underway) the management, expansion and remodeling of infrastructure, and equipping 18 hospitals that are part of the public health network.
• Beginning the rehabilitation and equipping of 12 maternal-infant clinics.
155. Loan and donation resources have been used mainly for building and equipping the Tela, Danlí and Comayagua Hospitals. Construction of the Maternal-Infant Ward of San Pedro Sula’s Leonardo Martínez Hospital. Through the FHIS, some 168 projects to build, expand and repair Rural Health Centers and Dentist Offices. 1,465 locations for attending to “chagas” disease were set up, and 163 rural basic sanitation projects were implemented.
156. In addition, the Global Fund made the following progress with non-reimbursable
resources: HIV/AIDS
Strengthening of the national ombudsman network of the national human rights commissioner in addressing the special law on HIV/AIDS.
Drafting and signing of project implementation agreements to tackle vulnerable populations affected by HIV/AIDS:
Consolidation of a comprehensive care model and access to antiretroviral therapy at a national level that permits access to antiretroviral therapy to be provided to approximately 3,000 people.
Tuberculosis
Support to the consolidation of the Health Secretary’s National Program to tackle Tuberculosis
Signing and initiating the implementation of 25 local management agreements at the municipal government level to tackle tuberculosis.

51
Definition of a protocol to tackle multiresistant tuberculosis. Support to the consolidation of the Health Secretary’s National Program to
Tackle Malaria. Signing and initiation of the implementation of 44 local management
agreements at the municipal government level to tackle malaria. 157. A model that ensures universal and equitable access to quality health services is
being promoted through Project ACCESO, based on health promotion and primary or preventive care with the participation of the community and the municipal governments.
158. Congruent with the Millennium Goals related to reducing the incidence of malaria
and other serious illnesses, the National Chagas Plan was approved, whose objectives are: i) Control and eliminate vectors, ii) Strengthen the sifting of blood for Chagas diseas at a national level, iii) Diagnose and treat cases of Chagas, iv) Epidemiological monitoring emphasizing community participation, and v) Improve housing in areas with conditions of extreme poverty.
c. Intermediate Indicators
159. The PRSP goals in the health sector related to maternal and infant mortality and
nutrition cannot be fully evaluated, since there are no systematic measurement instruments that would demonstrate trends.
160. Available information about maternal mortality—108 deaths per 100,000 live
births—dates from 1997. However, it could be expected that maternal mortality has tended to decrease, given both the emphasis on implementing mother-child health policies and the trends found in intermediate indicators for institutional birth coverage, births attended by trained birth attendants (midwives), and the average number of prenatal checkups, which all have improved over the past four years (appendix).
161. Similarly, no recent data is available for infant mortality and malnutrition rates
among children younger than 5 years. Actions in this area related to strengthening the community-based AIN strategy, and positive trends in indicators such as immunization coverage, diarrhea and pneumonia incidence and the main causes of infant mortality are generating positive progress in global goals.
E. AREA V: STRENGTHENING PROTECTION FOR SPECIFIC GROUPS
a. Policy Measures 162. With respect to social security networks, actions have been undertaken to develop
a conceptual and operational social policy framework for implementing the PRSP. Thus, work has been underway to define a Plan of Attention for the Most Socially Vulnerable Groups: street children, sexually exploited children, children orphaned by HIV/AIDS, gang members, the disabled, the elderly and female victims of violence.
163. In a parallel manner, actions to improve the living conditions of the poorest
populations living in rural zones are continuing through the Honduran Social Investment Fund, which finances 104 small social infrastructure projects benefiting

52
children, adolescents, the disabled and the elderly. Its investment had reached L.85.2 million through September 2004.
164. The National Policy for the Prevention of Disabilities, the Comprehensive Care and
Rehabilitation of Disabled Persons, and Protection of their Rights and Duties was approved, and the development of a corresponding National Plan of Action is underway. Cooperation agreements have been signed to support a community-based rehabilitation strategy in the Honduran Mosquitia region.
165. The Permanent Commission on the Protection of Children’s Moral and Physical
Integrity has continued (through 2004) implementing the Plan of Action for eradicating child labor.
166. The National Policy on Women and an Equal Opportunities Plan were formulated
and approved through a nationwide consultative process. 167. The National Commissioner on Human Rights developed the Special Program on
Women’s Rights, and work is underway to incorporate a gender approach into the formulation of public policies, plans of action and institutional budgets.
168. To improve the socio-economic situation of indigenous groups and Afro-
Caribbeans, the Commission to Eliminate All Forms of Racial Discrimination was created. Moreover, the Support Program for Indigenous and Black Populations (PAPIN) is being implemented, whose main component is implementing an ethnic-engineering model in two pilot communities (Belén in Mosquitia and Nueva Esperanza, Lempira) with 34 projects at a cost of L. 21.9 million.
169. The Government and Justice Secretariat is coordinating actions to guarantee
compliance with the Law on Special Treatment for the Elderly, Retirees, and Invalid Pensioners, more commonly known as the Elderly Law. Other actions are carried out through the Health Secretariat, under its Elderly Care Program.
b. Programs and Projects
170. From 2001 to September 2004, spending for this program area has fluctuated. The
majority of resources have been earmarked for the “Social Security Networks” component, followed by “Development of Ethnic Peoples” and finally the “Gender Equity and Equality” components. The main source of financing was national funds (50% during the entire period), followed by loans (39%).
171. By September 2004, some L.365.9 million had been implemented, which was 11% higher than the previous year. Of L.362.1 million destined for the Social Security Networks component, most of the resources were invested in vouchers for education, health and nutrition, maternal-infant care, school and families. Under the Family Allotment program, the sum of L.638,987.6 was implemented during the 2002-September 2004 period for income compensation vouchers benefiting a total of 394,024 children, young people, women and the elderly. As part of the Development of Ethnic Persons component, L.4.8 million were invested in projects from the Innovative Development and Social Assistance Fund and Our Roots (both from the

53
FHIS program), the Support Program for Indigenous and Black Populations (PAPIN), and the Ethnic Improvement Program.
172. Most of the resources assigned to the Gender Equity and Equality component were used for the PRAF program, the Women’s Comprehensive Development project, and to a lesser extent for the Rural Women’s Equal Opportunity Project.
F. GUARANTEEING THE STRATEGY’S SUSTAINABILITY 1. STRENGTHENING PARTICIPATORY DEMOCRACY, JUSTICE, AND CITIZEN SECURITY
a. Policy Measures
173. The following policy reforms have been carried out to consolidate good
governance, guarantee “transparent” public management and improve the quality of political representation: • Legislative Decree 153-2003 eliminated the figure of Presidential Designate, and
replaced it with the figure of Vice-President. • The constitutional reform decree that will separate the National Elections Tribunal
(TNE) from the National Registry of Persons (RNP) was ratified. • The Superior Accounts Tribunal was created with approval of the Tribunal’s
Organic Law. The Tribunal began operating in January 2003 with the inauguration of the three magistrates, as established by Law.
• A Constitutional Reform was adopted which incorporates plebiscites and referendums as democratic options, ratified on November 24, 2004.
• The New Electoral Political Organizations Laws were approved in April 2004. • Through Legislative Decree 62-2004, the New Law on the National Registry of
Persons was approved and entered into force in May 2004. 174. The project, “Strengthening a State of Law and Respect for Human Rights,” was
initiated, through which 10,747 case files have been dismissed during the February-August 2004 period alone, and 41,560 expedients have been collected nationwide.
175. Loan agreement 115/SF-HO was signed with the IDB in December 2002, to finance
the second stage of the Program to Support Modernization of the Administration of Justice. The program in comprised of two sub-programs: Legal Reform and Efficiency and Accountability.
176. The theme of citizen security has been one of the Government’s main priorities.
This refers to monitoring not only the conditions set in both the PMRTN and the PRSP, but also other citizen concerns expressed during consultative arenas such as the Great National Dialogue and regional consults about the PRSP. In this context, some of the most important initiatives have included: • Reduction of the crime rate. • Implementation of Preventive Education Projects managed by the Gang Prevention
Division. • Approval of the Legislative Decree 117-2003 that reforms Article 332 of the Penal
Code and constitutes the Anti-Gang Law, which sets severe penalties for the types of illicit association that give rise to gangs or “maras.”

54
• Implementation of the “Safer Community” Program, in which citizens work together with the National Police to insure community safety.
• Implementation of the Strategy to Combat Drug Trafficking in the Gracias a Dios and Colón provinces.
• Reform of the Transit Law and the Law on Firearm Ownership, Registration, and Possession and Control of Munitions, Explosives and Other Similar Devices (published in La Gaceta No. 30-224 on November 19, 2003).
b. Programs and Projects
177. A budget of L.5.355 billion was implemented during the 2001-2003 period, used
mostly for modernizing public administration and decentralization, as well as for protecting the environment and risk management. Although no budgetary allotment was made to “Strengthening Justice and Citizen Security” during the first two years, HIPC resources were assigned beginning in 2004 to improve special investigation services and strengthen preventive police work.
2. TRANSPARENCY AND ACCOUNTABILITY
a. Policy Measures 178. To reduce the risk of corruption, various processes aimed at increasing public
sector accountability have been promoted, key to which as been approval of the new “Money Laundering Law.”
179. With respect to transparency in state procurements, the Government has
implemented the Program for Efficiency and Transparency in State Procurements and Hiring. To support the Program, a Consultative Council was set up (CCPET) in February 2003, which was constituted through Executive Agreement 045-2002.
180. The regulations for the Normative Office for State Acquisitions and Hiring were
developed and promulgated, and published in La Gaceta on May 13, 2004. A web site for the Normative Office for State Hiring and Acquisitions (ONCAE) has also been designed: www.oncae.gob.hn.
181. Another effort related to transparency and accountability that has been taking form
is the Social Audit initiative, which creates local citizen oversight networks that manage community resources. This effort has facilitated the appointment of Municipal Commissioners and Citizen Accountability Commissions assigned to the 15 regional and provincial CONADEH delegations, which cover the nation’s 18 provinces.13
182. The National Congress approved Legislative Decree 105-2004, a Constitutional
Reform that eliminates Article 200 and Section 15 of Article 205 that bestow impunity upon the President of the Republic, the Presidential Designates, magistrates and other high level State functionaries.
13 The Municipal Commissioners are citizens designated by the Municipal Corporation, while the Citizen Commissions are structures that involve citizens in evaluating, auditing, overseeing and monitoring the transparent use of the municipality’s public resources.

55
3. MODERNIZATION OF PUBLIC ADMINISTRATION AND DECENTRALIZATION
a. Policy Measures 183. The Plan of Action of the National Decentralization and Local Development
Program (PRODDEL) has been approved, to effectively decentralize the economic sector. In addition, municipal administration in the areas of planning, taxation and municipal civil service are being strengthened.
184. Training was provided to 219 municipalities throughout the country about:
budgetary development, implementation and liquidation; municipal legislation, production of arbitration plans; tax administration; and local management. Currently, the municipalities present their budgets, arbitration plans and budgetary liquidations.
185. Development Commissions were created through Decree 21-2002, and a Draft
Municipal Finance Law was jointly developed with AMHON to simplify and modernize the tax system, regulate municipal indebtedness, and strengthen financial management and the 5% transfer. It is worth noting that municipal transfers have risen from 1.9% in 2001 to 3.65% in 2004.
b. Programs and Projects
186. The projects with the largest investment implemented during this period included:
Municipal Social Investment Plans (L.2.443 billion), transfers to Municipalities (L.1.613 billion), Allotments for Community Development Programs (L.259 million), and Loans to Municipalities (L.241.3 million).
187. The responsibility for different project cycles was transferred to 120 municipalities
through the first project. This includes: (i) identification (pre-cycle); (ii) formulation; (iii) implementation; and (iv) maintenance (post-cycle). Training and technical assistance activities were financed for three areas of the Preventive Maintenance pilot program: finances, institutional norms and local works. The results were essential for developing a program budgetary manual and promoting active participation in financing maintenance activities.
188. In addition, municipal finances were strengthened through training about designing
municipal debt policies, which included components on accountability and social auditing, and through developing a plan to simplify and modernize municipal tax systems.
4. IMPROVING ENVIRONMENTAL PROTECTION AND RISK MANAGEMENT
a. Policy Measures 189. The National Congress approved the Territorial Planning Law, which emphasizes
administrative aspects of organization and creates the Territorial Planning Executive

56
Council (CEOT). Also, both the Water Law and Forestry Law are close to passage, and restructuring of AFE-COHDEFOR is underway.14
190. To support the territorial organization process, the National Territorial Information System (SINIT) is being implemented, which creates and maintains a baseline of biophysical and socio-economic information and is the technological instrument used by the Registry of Territorial Organization Norms (RENOT).
191. The National Environmental Information System (SINIA) is operative, with 89
environmental indicators classified into 14 areas. The Climatic Change and Biodiversity nodes were also set up.
192. Efforts have been made to improve water management and planning, including: the
development of a National Water Inventory, the development of a hydro-meteorological information database, the rehabilitation of the National Telemetric Network (16 stations), and the operation of 37 hydrometric and 71 climatology stations.
193. The Non-Formal Environmental Education Manual has been updated for the
municipal governments; a “National Publicity Campaign on Environmental Awareness” will be developed with coverage all over the country and emphasis on 25 municipalities of 6 provinces, in which environmental strategic plans will be drawn up. In addition, 274 Municipal Environmental Units (UAMs) have been created, of which 192 have been technically strengthened.
194. In the area of energy, the Special Executive Commission for Developing
Hydroelectricity Projects was created through Executive Decree 002-2003, to coordinate the actions of governmental agencies involved with this resource. The development of the Renewable Energy, Rural Energy and Energy Efficiency Policy is of particular importance, since it is based on a broad-based social consensus. At the regional level, the Central America Bio-Power Project is being developed to promote the generation of energy from biomass.
195. To prevent and mitigate the risk of disasters in ecologically and socially high risk
zones, the National Action Plan for Combating Drought and Desertification was developed with the participation of local populations from the 76 most vulnerable municipalities in Lempira, Intibucá, La Paz, Valle, Choluteca, the southwest region of Paraíso and the southern region of Francisco Morazán.15
196. Through the Sula Valley Executive Commission (CEVS), La Lima has been
effectively and fully protected against regular annual flooding. Protective works have been constructed in high risk zones (Chamelecón to Choloma), most outstanding of which are the construction of the Chotepe, Maya and Chambers water channels, and the recently initiated Calán Channel, at a cost of L.700 million, providing protection to 65,000 hectares.
14 Responds to the need to regulate productive functions of forest conservation and protection with a sustainable approach, reducing central level personnel and strengthening regional structures in rural areas. 15 This Plan contains strategic elements related to sustainable agricultural and livestock production; the organization, conservation and reforestation of watersheds; environmental education and awareness; institutional strengthening, and building local capacities.

57
197. The creation of a National Civil Protection System is underway, which consists of
emergency actions in response to natural occurrences, expanding the coverage of COPECO actions. The seismic station network has also been strengthened, and the hydro-meteorological station network has been linked into early warning systems. The “113” call system for emergencies was also introduced, providing immediate responses 24 hours per day.
b. Programs and Projects
198. A total of L.189.6 million was used between 2000 and 2004 for the environmental
protection and risk management sub-component. The most important investment project (45.7% of the total) is the Natural Resources Management Program for Priority Watersheds (MARENA), located in the upper basins of 3 priority watersheds: Ulúa, Chamelecón and Nacaome. To date, the project has: i) strengthened and trained the National Watershed Network; ii) developed an informational and documentary database for the Higuito, Mejocote, Yojoa and Mid-Humuya sub-basins; iii) promoted the organization, training and operation of emergency committees in 5 of the mentioned sub-basins; and iv) established the basis for operating early warning systems combined with structural and bio-physical works to mitigate disasters.
199. The Disaster Mitigation Project received around 45% of the sub-component’s total
investment. It has fulfilled physical goals such as developing the Plan to Strengthen the National Hydro-Meteorological Network and providing rescue equipment to regional COPECO delegations. The Upper Lempa River Watershed Management Program absorbed some 6.1% of the sub-component’s total financing, with a radius of action in 5 municipalities of the Ocotepeque province (Dolores, Merendón, Concepción, Santa Fe, and Sinuapa), and at this stage 4 potable water systems, 22.5 kilometers of rural roads, sanitary sewage systems and irrigation systems have been developed.
200. The National Land Use Program (PRONOT) concluded its work in Comayagua,
leaving concrete land use plans in place for Comayagua, Ajuterique and Lejamaní, and a general land use planning methodology. The Climatic Change project is implementing the Refrigerants Plan, and the Plan to Eliminate Methyl Bromide from melon, tobacco and banana production through which a reduction in the use of gases and substances that damage the ozone layer is expected. The Social Forestry Program has incorporated 80,700 hectares of land into forestry management plans (10%), has maintained the operations of some 300 agro-forestry organizations on 250,000 hectares of land with the direct involvement of 13,000 families, and has contributed to a 21% increase in resin production.
c. Intermediate Indicators
201. Intermediate indicators for the environment reflect efforts undertaken to improve
management in this area, especially in the forestry sector. Within this policy framework, the indicator for the number of priority protected areas with management plans has improved significantly, increasing from 5 in 2000, to 12 in 2002, to 15 in 2003 and 23 in 2004. Other indicators such as the number of priority protected areas that have been legally declared as such had also improved between 2000 and 2002, but have since remained static. This can be explained, in part, by the grouping of the

58
Delgaditos, Jicarito and San Bernardo areas as the “Gulf of Fonseca,” and the Utila and Guanaja Islands as the “Bay Islands.”
202. Despite its lack of change since 2002, the indicator for priority protected areas with
community participation shows that more than 75% of priority protected areas are being managed with some form of community participation (including co-management), influenced by decentralization processes underway in the sector and the implementation of projects such as Forest and Water, PROBAP, MAFOR, PROCUENCA, PROMANGLE, and Transforma-CATIE, among others.
203. There has been an annual reduction in the indicator for the number of controlled
fires, explained by more active participation of municipalities, communities and civil society organizations in fighting forest fires. Nonetheless, it should be clarified that climatic factors also influenced the reduction of this number in 2004. Despite the fact that the indicator for the number of pests or outbreaks shows annual decreases, the number of outbreaks being controlled has actually dropped, explained by the AFE’s limited operational and financial capacity to support this activity.
204. The indicator for forest coverage is an important one, because it refers to the
nation’s most serious environmental problem. Unfortunately, there is no data available after 1995. The AFE estimates that approximately 100,000 hectares of land is deforested every year. An updated forest map needs to be developed to obtain more accurate information about deforestation.
205. Indicators related to creating, promoting, consolidating and strengthening Municipal
Environmental Units indicate progress resulting from SERNA’s efforts in decentralizing environmental management and empowering local communities vis-à-vis environmental themes.

59
VII. MEDIUM- AND LONG-TERM PLANNING
206. This chapter describes progress made in PRSP planning and programming processes, the basis of which is detailed in the PRSP 2004-2006 Implementation Plan (see Table 2), which the Honduran Government presented at the Consultative Group Meeting in June 2004, and which will be developed through the so-called Sector Wide Approach Programs (SWAps). Progress in Harmonizing and Aligning Official Development Assistance (ODA), which is fundamental to successful implementation of the PRSP, is also presented in this chapter.
A. MEDIUM- AND LONG-TERM STRATEGIC PLANNING
207. The current framework for planning and programming the nation’s development is established by the Public Administration Law. This Law assigns macro level planning functions to the Economic and Social Cabinets: it also creates Management Planning and Evaluation Units (UPEGs) that are responsible for sector planning by line ministries. Finally, it creates the Technical Support Unit of the Presidential Secretariat (UNAT), whose function is to coordinate the process at the sector level and to help the Economic and Social Cabinets to define policies and programs. Currently UNAT is designing an institutional framework that integrates coordination with international cooperation agencies and the public investment process into planning efforts. As part of this effort, it sent a proposal for Reforming the General Public Administration Law to the National Congress, aimed at improving the institutional structure and adapting it to the needs of the PRSP.
208. To strengthen the programmatic planning process and the definition of the medium
and long-term priorities, the new Organic Budgetary Law, which was enforced since January 2005, establishes that the National Budget must be prepared based on the medium-term goals. In order to do this, a Multi-Year Medium Term Plan must be
Table 2 Achieving the Goals of the Poverty Reduction Strategy
PRSP Implementation Plan, 2004-2006 The document presented to the Consultative Group outlines the Implementation Plan for the Poverty Reduction Strategy during the 2004-2006 period. It proposes a program for transforming the nation, including decisive actions in the areas of good governance, equitable economic growth, and investment aimed at improving the living conditions and opportunities of poor families. With a foundation of good governance, the Implementation Plan proposes increasing GDP growth rates through a healthy macroeconomic policy, reforms to the financial system, the conclusion of trade negotiations to improve our access to other markets, and actions to strengthen our competitiveness. In this framework, the programming of national resources and donations will be strengthened, to guarantee that Honduras will meet the PRSP’s priority goals and the Millennium Decade Goals. The document is divided into four sections which detail the PRSP’s main achievements in 2003, and also proposes key actions for the 2004-2006 period that were defined together with national stakeholders through the PRSP Consultative Council, Sector Roundtables, and consultative campaigns organized in northern and south-central Honduras. Finally, it enumerates the main risks to implementation that could emerge, and strategies for confronting these.

60
designed based on Sector Plans, in order to articulate the PRSP goals with their costs presented in the budgetary programming.
209. In addition, the structure of Sector Roundtables was redesigned to make the
process of defining Medium Term Programs more participatory, giving them responsibility for planning and monitoring sector programs; these programs are going forward in that way, and are being respectively consulted and validated. Six roundtables with six crosscutting themes were set up for that purpose. Currently, four of them (education, health, water and sanitation, and agro-forestry) have long-term programs that are aligned with PRSP goals. Together with the PRSP Implementation Plan, these plans will serve as the basis for developing the PRSP’s Multi-Year Implementation Plan that will later be linked to the national budget.
210. Another important element is the promotion of planning and management work
based on demands generated at the local level. To achieve this, the Decentralization and Local Development Program (PRODDEL) is being implemented with the support of various donors to assist Municipal Governments in prioritizing and managing their demands in a manner that is consistent with governmental supply. This objective is achieved through the instrument of Municipal Development Strategic Plans (PEDMs). To date, some 83 PEDMs have been developed in low-income municipalities, and another 153 are being designed. It is hoped that in 2005, all programs will be covered by these plans that link local supply with demand.
211. To strengthen the local planning process, work has been done with the CCERP
members since 2003 in designing and implementing the regional PRSPs, which seek to provide a holistic vision to the medium- and long-term planning, thus complementing national efforts. A commission made up of members of Civil Society, the Government and G-17 as observers is now discussing how to link the local and regional plan with the sector-wide planning initiated by the Roundtables.
212. Besides the effort of articulating the local demands, the commission appointed
within the CCERP has the main objective of prioritizing the debt-relief resources that will be obtained starting with the Completion Point of the HIPC Initiative in 2005. In order to do this a standard methodology was designed to ensure the inclusion of the demands coming from the various sectors of civil society, whether through the PEDMs or any other channel. The idea is that this methodology could be applicable in the future to the total PRSP budget.
B. HARMONIZING COOPERATION
213. The main objective of harmonizing cooperation is to determine the steps to ensure
that international cooperation efforts complement national efforts rather than substitute them, thereby achieving sustainable economic and social development and reducing the transaction costs as much as possible. Moreover, the provision of cooperation resources in accordance with the nation’s priorities is also sought, along with alignment of the strategies of cooperating agencies and nations with the Poverty Reduction Strategy (PRSP) or the equivalent national frameworks.16
16 See: Indicators 3 and 4 of the Monitoring Committee of the OCDE’s Development Support Committee (CAD).

61
214. The Government of Honduras has assumed the challenge of leading this harmonization process. Thus, following the High Level Forum in Rome (2003), the Government organized three workshops with support from the IDB (Zamorano I, II and III), with the goal of adapting international cooperation to national priorities in the framework of the PRSP. Agreements were reached at these workshops that tend to improve the efficiency of cooperation, such as: i) supporting programs rather than projects; ii) linking these programs in the framework of the PRSP; and iii) defining a series of appropriate management indicators. Also, the new proposal for participatory planning via Sector Roundtables was presented, and the progress of the H&A process was reviewed and corresponding recommendations were made.
215. Concrete progress has been made in harmonizing and coordinating donors, and
aligning ODA with the nation’s programs and priorities. This work also addresses the standardization of the national bidding processes and financial resource management systems through SIAFI and the System of State Purchases and Contracts, respectively. Furthermore, the National Congress approved the Law on Poverty Reduction Management, whose objective is to create a framework that sustains PRSP implementation through 2015. The G-17 has acted as a key coordination structure in this process, not only monitoring the fulfillment of investment programs and policy commitments made in the framework of the PMRTN and the PRSP, but also acting as the main counterpart for the H&A process since it began.
216. Moreover, actions aimed at building the nation’s capacity to define coherent
development programs have been carried out, making it possible to more effectively visualize the manner in which Honduras will fulfill the PRSP goals. Despite the progress mentioned, there are still a large number of projects—many of them relatively small and unrelated to one another—that tend to overstretch the nation’s coordination and management capacities. It is anticipated that the joint efforts of the Government and Cooperation will facilitate the operations through the reduction of transaction costs and the construction of standardized systems for more efficient program and project management.
217. The Government’s efforts to design and implement the PRSP, to improve its
capacity to manage resources and external cooperation efforts and thereby improve coordination and to promote harmonization and alignment initiatives have had important results. Most cooperation agencies now prioritize PRSP programs as a norm, since its six “pillars” include almost all fields relevant to external aid in Honduras. Nonetheless, not all of these programs have embraced the concept of Poverty Spending in the framework of the PRGF Program.

62

63
VIII. MONITORING AND EVALUATION A. THE PRSP INFORMATION SYSTEM 218. During implementation of the PRSP, activities have been carried out to speed up
monitoring of the Strategy. Since January 2004, the Technical Support Unit (UNAT) and the National Statistics Bureau (INE)—attached to the Office of the Presidential Secretariat and the Finance Secretariat—took the initiative to begin developing a prototype for a monitoring and evaluation system using available resources and information. On March 31, 2004, the PRSP Information System (SIERP) was presented on the official web site: www.sierp.hn.
219. The SIERP is a general information system that facilitates the monitoring and
evaluation of national anti-poverty measures. The system is based on analyzing the progress of global and intermediate indicators linked to the physical and financial advance of PRSP programs and projects. The System also generates impact analyses of the policy measures and the population programs and policies through instruments such as the PSIA.
220. As evidence of the PRSP’s monitoring and evaluation system, three PRSP
Progress Reports have been generated per quarter using information contained in the SIERP database. This information is also made available to the public through the web site.
221. During this period, an intensive review of the current prototype and the
consolidation of links with the national information network has been underway, to establish a solid foundation for the SIERP. The main result of this process has been the design of a Master Plan for SIERP Implementation, which is conceived as a tool that will determine the strategic guidelines, main theories and specific activities required for its short, medium- and long-term implementation.
222. In mid-2004, the work of defining, compiling and discussing indicators began
with all institutions. Model matrices were developed, so that each institution could include the indicators it considers pertinent. The matrices were designed for compiling information from the institution, existing information systems, and the indicators themselves. The attributes of these indicators are differentiated by time, level of breakdown, generation, among others.17
223. Following this first stage, a workshop was organized in to review and restructure
PRSP indicators. The inputs for this workshop were the matrices that had already been analyzed by participating institutions. The workshop began with an explanation of conceptual aspects related to social indicators and the indicators most frequently used internationally. Later, the group was divided into work groups organized according to PRSP pillars.
17 The indicator’s “generation” is determined by the real possibility of obtaining the data at this moment. In other words, first generation indicators are those that exist at this moment, and can be produced with no problems. Second generation indicators are those that are not produced at this moment, but for which mechanisms for producing them in the medium term already exist. Third generation indicators are those that are still not produced, and whose medium-term construction is problematic.

64
Table 3What is a PSIA?*
A Poverty and Social Impact Analysis (PSIA) refers to analyzing the distributional impact that policy reforms have on the well being of different groups of stakeholders, with particular interest in the most vulnerable and poorest groups. PSIAs also study the sustainability and risks associated with implementing reforms, helping to monitor poverty and the social impact of policy reforms. Adopting Poverty Reduction Strategies and the Millennium Goals has increased the need for systematic analysis of poverty and the social impact of policy reforms, in order to assist countries in filling analytical gaps and consolidating national strategies with very well designed policies. *Source: PSIA Users Manual, World Bank, 2002.
224. Once organized, the work groups were responsible for discussing each of the
indicators with the representatives of institutions present. The discussions led to a review and in some cases modification or improvement of each indicator. At the end of the workshop, a better catalogue of indicators was structured, each with its own characteristics and those responsible for oversight were defined.
225. For sectors that still did not have a primary list of indicators, the work of defining
these has continued. In such cases, meetings were held and the basis through which responsible institutions and UNAT technical staff would begin the work of defining and refining a minimum number of indicators was established.
226. Defining a “catalogue” of indicators is a process that will take form while the PRSP
is being implemented. It is important to see this task as a process, since the indicators can be modified as institutions begin producing more and better quality information.
227. Two of the most important aspects of the work carried out in recent months has
been the establishment of an information network that will be responsible for compiling a catalogue of increasingly more accurate and appropriate indicators, and the promotion of continuous updating of SIERP data for use in producing PRSP progress reports.
228. The results of this process may be found in the appendix on intermediate
indicators, where all of the information supplied by different institutions taking part in building the national information network is compiled.
B. IMPACT EVALUATION
229. Measuring progress toward the PRSP goals is an essential part of guaranteeing adequate monitoring and evaluation of specific improvements in the population’s living conditions. It is also essential for beginning a learning process that allows both policy proposals and the content of sector programs to be reviewed and corrected in a timely fashion when required. Thus, technical instruments and tools are needed that help design policy recommendations, which in turn facilitate decision-making.
230. In Honduras, the PSIAs are the instrument used for analyzing the distributional
impact of different policy reforms on the well being of different segments of the population, with a particular focus on the poorest and most vulnerable groups. Well-being is understood as both the income and non-income dimensions of poverty.

65
Table 4Evaluation of the Distributional Impact of Tax Reform in Honduras
The tax measures approved in 2002 and 2003—the Financial Equilibrium and Social Protection Law, the Tax Equity Law, and the Public Finance Rationalization Law—establish important changes in the Honduran tax system. A corresponding PSIA (Poverty and Social Impact Analysis) was carried out, which evaluated the distributional incidence of these reforms, using the “shifting assumptions” methodology to analyze information obtained from the National Survey of Household Spending and Income and the Permanent Survey of Multi-Purpose Households. This study uses both consumption and income adjusted to demographic factors as the alternative indicators of well being. In addition, the standard shifting assumptions are applied, and the distributional impact of each reform measure is evaluated on the basis of concentration and progressivity curves and indices. The study concludes that the Honduran Tax Reform measures are slightly progressive in distributional terms. If an effective increase in tax revenues will be achieved through their implementation, then distribution in Honduras will become less unequal than at present. If the revenues generated by the reform are distributed equally, extreme poverty could diminish by 5 percentage points. The study also presents an alternative scenario based on the elimination of tax exonerations to foreign trade and petroleum. The results help demonstrate that many reforms are still needed in order to make the tax system more progressive.
231. This tool has become more popular since 2001, when the International Monetary Fund (IMF) and the World Bank (WB) agreed to conduct a PSIA of the macroeconomic and structural policies of the programs they were developing in Honduras.
232. Similarly, the Department for International Development of the United Kingdom (DFID) has joined this agenda, initially supporting a pilot project to develop PSIAs in different countries. In Honduras, this took the form of a study about the impact of privatization of the electricity sector.
233. The main findings related to Honduras are that these studies may be carried out
using existing data and public knowledge about the reforms. To be effective, a PSIA must inform about policy options through sharing information and through its appropriation by a given society, and must be immersed in the context of the Poverty Reduction Strategy (PRSP).
234. Although the PSIAs are not new, they are still not regularly employed as part of
government reform initiatives. Thus, they must validate findings from a broad spectrum of sources and clearly demonstrate the implications that alternative policy decisions have on reducing poverty. They must also establish the basis for improving national capacities to generate and adopt methodologies for evaluating the impact of policies as well as programs and projects.
235. The essence of PSIAs is presenting policy options based on evidence, explicitly
demonstrating a specific reform’s impact on poverty and well being, and promoting the appropriation of such reforms through publicly debating the trade-offs of policy decisions.
236. Three PSIAs for Honduras have been conducted. The first was an analysis of “The
Possible Privatization of Electricity Distribution. A Case Study: Honduras 2002,” while the second entailed an “Evaluation of the Distributional Impact of the Honduran Tax Reform, 2004.” The third is about to conclude, and evaluates “The Impact of Oil Price Hikes on the Poorest Population.”

66
237. The Government has adopted an agenda for impact evaluations through the
Presidential Secretariat’s Technical Support Unit (UNAT), where a study division will be set up to coordinate and implement the use of this type of investigative tool. This division will be directly linked to the central SIERP unit, and will be responsible for evaluating and monitoring governmental reforms. In addition, a team led by one main researcher and supported by an inter-institutional and multi-disciplinary technical team will be set up for each study, with the goal of strengthening local capacities through the transfer of methodological tools. Finally, the results will be shared through a process that directly involves civil society organizations and donors in a tripartite effort to disseminate and validate the results.
238. A series of studies are planned in coordination with international cooperation
agencies, as outlined in the following schedule. All of these are aimed at developing local capacities to use different methodological tools and share the results nationwide, providing the nation with a technical instrument to support policy decisions.
239. To support this effort, the Government of Honduras will contract a permanent
research-analysis unit that will: contribute technical suggestions for decision-makers in the field of policy reform; organize workshops to explain the relationship between reforms and progress in reducing poverty to the general public and the international
Table 5Evaluation of the Impact of the Rise in Oil Prices
The rise in the international prices of oil and fuels, employed as raw materials, has been continuous over the past three years and reached record levels in late October 2004. A combined qualitative and quantitative analysis has been used to analyze the impact of these price hikes on the poor, complementing and validating the findings obtained through different methodologies. With respect to the quantitative analysis, an econometric approach was used to measure the impact of fuel price rises on the activities most sensitive to such increases, such as transportation services, household water and electricity services, and on other prices through measuring the impact on the general price index. In addition, the price elasticity of the demand for different fuels was quantified, as a useful instrument in designing and monitoring the tax policies for petroleum and fuels. In addition, the distributional effect was analyzed on the basis of the 1998 ENIGH (National Household Income and Spending Survey), assessing the average tendency to consume the items most affected by fuel price variations and some important basic foodstuffs that have experienced important price increases and have affected the poorest population (broken down by income level, location and gender). With respect to the qualitative analysis, semi-structured interviews were conducted in urban and rural households in order to obtain perceptions about the impact on household economies. CARE-Honduras and the UNAT played an active role in this methodology. Both methodologies supported the following conclusions: Oil price variations have an intensive effect on a reduced group of services related to transportation and housing, which are not transmitted with the same speed and intensity to the rest of the economy. This signifies a relatively insignificant—but not less important—effect on the general price index and therefore on the poorest members of society. Another result is that the demand for fuel—for automotive and domestic use—is sensitive to price variations. Fuels used for industrial and public transport purposes are not sensitive to such variations. The main recommendations are to stimulate competition in the commercialization of fuels, maintaining the current tax policy for fuels given its progressive nature. Similarly, competition needs to be improved in the electricity-generating sector, and road infrastructure needs to be improved to permit long-term expansion of public transport services. The transportation subsidy programs should be continued and framed in the PRSP, and a basic food package containing those foodstuffs whose prices undergo sustained increases due to fuel price rises should be put together and promoted in urban and rural areas.

67
community; and finally provide technical tools that help design social policies with a more “pro-poor” character.
Honduras: Schedule for Impact Studies and Evaluations
Study OCT 2004
NOV 2004
DEC 2004
JAN 2005
FEB 2005
MAR 2005
APR 2005
MAY 2005
JUN 2005
JUN 2006
Tax Reform in Honduras
Rise in Fuel Prices Salary Policy CAFTA Public Spending Subsidies for electricity Subsidies for public transportation
Note: The dates indicate when the study will be concluded and its results publicized. .

68

69
IX. CHALLENGES FACING PRSP IMPLEMENTATION 240. There is general consensus about the importance of providing continuity to PRSP
implementation as the motor force behind the nation’s development policy. However, national support must be obtained to guarantee the process’s sustainability, in light of the political cycle that will be confronted in late 2005. Thus, the Government has proposed a multi-level publicity plan to generate greater appropriation of the PRSP at a general level.
241. A massive PRSP publicity program must be promoted. It must consider the
structuring of popular versions of both the original document and the progress reports. this will allow the population to be duly informed about the progress of the proces and will ensure its appropriation by the beneficiaries.
242. National Congress approval of legislation that allows progress in key areas will be
needed, such as reforms to the Civil Service Law General, Public Administration Law and General Water Law, so that the nation’s institutional framework is adapted to the PRSP’s planning requirements.
243. Continued efforts to target spending on the most vulnerable sectors are essential,
so that this is reflected in the indicators. It will especially necessary to expand sustainable income generation programs for households living in relative poverty whose members are working in the informal sector or are unemployed.
244. With respect to harmonizing cooperation, although ODA is generally aligned with
the PRSP’s programmatic areas, there is still no effective coordination between donors and the Government with respect to expanding the quality and coverage of public services, or expanding other investments needed for achieving the PRSP’s goals. The Government considers the previously mentioned proposal for reforming the planning and management of external cooperation key to making progress in this area.
245. Although there has been progress with respect to improving the planning process
and harmonizing and aligning cooperation, there is still a great deal to be done. The PRSP needs to remain the key reference point for defining public investment priorities and aligning external cooperation. The reform proposed for rationalizing the “institutionality” of external cooperation planning and management needs to be approved and implemented. In addition, dialogue and involvement in the PRSP’s development needs to be strengthened, and coherency between the PRSP and civil society concerns and proposals needs to be assured.
246. Efforts aimed at linking the supply and demand for local level services should
continue, in the framework of Municipal Development Strategic Plans. In addition, these demands need to be consistent with the regional proposals that civil society organizations are promoting within the CCERP.
247. It is very important to strengthen the SIERP and impact studies (PSIAs), so that the
results of PRSP policies and programs may be effectively and adequately evaluated. 248. The Honduran economy’s resource absorption capacity as well as improved
efficiency of public investment continues to be one of the main challenges the country

70
faces to achieve socioeconomic development. It is fundamental that the governmental authorities double their efforts to increase the public sectors investment resource management capacity. The possibility of achieving this is subject to requirements such as development of an adequate legal public career framework, strengthening of the capabilities of government employees, institutional consolidation and transparency of executrices.

APPENDICES


CONTENTS
APPENDIX A.1 GROSS DOMESTIC PRODUCT BY TYPE OF ACTIVITY----------------------------------------- i APPENDIX A.2 GROSS DOMESTIC PRODUCT BY TYPE OF SPENDING---------------------------------------ii APPENDIX A.3 PER-CAPITA GROSS DOMESTIC PRODUCT------------------------------------------------------ iii APPENDIX A.4 HONDURAS BALANCE OF PAYMENTS ------------------------------------------------------------- iv APPENDIX A.5 CENTRAL GOVERNMENT FINANCIAL ACCOUNTS --------------------------------------------- v APPENDIX A.6 PUBLIC EXTERNAL DEBT BY SOURCE-------------------------------------------------------------vi APPENDIX A.7 AVERAGE CONSUMER PRICE INDEX BY REGIONS AND PRODUCT-------------------- vii APPENDIX B1. GLOBAL PRSP INDICATORS ------------------------------------------------------------------------ viii APPENDIX B2. INTERMEDIATE PRSP INDICATORS -------------------------------------------------------------- xiii APPENDIX C PROGRESS MATRIX OF THE PRSP POLICY MEASURES------------------------------------ xix APPENDIX D.1 POVERTY SPENDING --------------------------------------------------------------------------------- xxx APPENDIX D.2 SPENDING OF HIPC RESOURCES-------------------------------------------------------------- xxxvi APPENDIX D.3 ADJUSTED PRSP SPENDING ------------------------------------------------------------------- xxxviii APPENDIX D.4 DEFINITION OF POVERTY SPENDING--------------------------------------------------------------xl APPENDIX E: CONTRIBUTIONS BY CIVIL SOCIETY IN THE REGIONAL CONSULTATIONS:
CENTER EAST, SOUTH, WEST, NORTH, ATLANTIC SEABOARD AND AGUÁN --------xliii


i
APPENDIX A.1 GROSS DOMESTIC PRODUCT BY TYPE OF ACTIVITY
(Millions of Lempiras)
ITEM 1994 1995 1996 1997 1998 1999 2000p/ 2001p/ 2002p/ 2003p/
CURRENT PRICES
Agriculture, forestry, hunting and fishing 6,030 7,026 9,188 12,220 11,493 10,501 12,547 12,122 12,895 13,566Mining and quarry exploitation 454 629 763 920 1,102 1,325 1,497 1,591 1,794 1,998Manufacturing 4,275 5,818 7,455 9,535 11,186 12,916 15,207 17,540 19,640 21,980Construction 1,465 1,791 1,900 2,464 3,043 3,863 4,157 4,269 3,966 4,922Electricity, gas and water 939 1,778 2,540 2,946 3,093 3,208 3,655 3,728 4,263 5,052Transport, storage and communications 1,309 1,546 1,824 2,464 2,985 3,423 4,232 5,096 5,643 6,354Commerce, restaurants and hotels 2,555 3,915 4,903 6,264 7,360 8,365 9,633 10,870 12,050 13,412Financial establishments, insurance and goods
Real estate and business services 2,205 3,007 3,654 4,971 6,331 7,155 8,328 9,441 10,406 11,450Housing properties 1,441 1,832 2,317 2,941 3,478 3,990 4,579 5,201 5,840 6,552Public administration and defense 1,547 1,912 2,440 3,178 3,625 3,875 5,158 6,139 7,095 7,478Communal, social and personal services 2,550 3,372 4,176 5,207 6,372 7,261 8,529 10,561 12,177 13,577
GROSS DOMESTIC PRODUCT (factor cost) 24,770 32,626 41,160 53,110 60,068 65,882 77,522 86,558 95,769 106,341Plus: Indirect net taxes from subsidies 4,092 4,881 6,603 8,212 10,370 11,214 11,879 12,474 12,355 13,981
GROSS DOMESTIC PRODUCT (market prices) 28,862 37,507 47,763 61,322 70,438 77,096 89,401 99,032 108,124 120,322
CONSTANT PRICES Agriculture, forestry, hunting and fishing 1,416 1,540 1,578 1,646 1,614 1,477 1,650 1,642 1,723 1,755Mining and quarry exploitation 83 96 103 108 112 118 120 119 124 128Manufacturing 798 842 881 935 967 992 1,047 1,101 1,143 1,185Construction 282 264 234 227 239 264 268 254 218 248Electricity, gas and water 130 149 172 185 194 198 219 215 227 245Transport, storage and communications 443 477 498 520 534 543 570 600 621 644Commerce, restaurants and hotels 572 604 631 653 673 678 703 724 745 768Financial establishments, insurance and goods
Real estate and business services 479 524 547 605 662 659 674 695 708 720Housing properties 361 369 384 399 414 426 439 456 475 495Public administration and defense 281 269 277 300 301 288 345 375 402 394Communal, social and personal services 449 449 446 460 485 491 516 581 620 642
GROSS DOMESTIC PRODUCT (factor cost) 5,294 5,583 5,751 6,038 6,195 6,134 6,551 6,762 7,006 7,224
Plus: Indirect net taxes from subsidies 613 565 617 648 685 616 587 562 517 543
GROSS DOMESTIC PRODUCT (market prices) 5,907 6,148 6,368 6,686 6,880 6,750 7,138 7,324 7,523 7,767
p/ preliminary e/ estimated BP 19/1/04 Source: Department of Economic Studies, Central Bank of Honduras

ii
APPENDIX A.2 GROSS DOMESTIC PRODUCT BY TYPE OF SPENDING (Millions of Lempiras)
CURRENT PRICES 1994 1995 1996 1997 1998 1999 2000p/ 2001p/ 2002p/ 2003e/
FINAL CONSUMPTION COSTS 20,893 27,314 35,338 45,048 54,047 61,894 74,337 85,992 96,750 107,345 Private sector 18,113 23,819 30,782 39,626 46,930 53,168 63,119 72,200 81,825 91,136
Public sector 2,780 3,495 4,556 5,422 7,117 8,726 11,218 13,792 14,925 16,209
GROSS FIXED CAPITAL FORMATION 8,110 8,994 11,468 15,732 19,874 23,045 23,372 23,525 23,992 28,114 Private sector 4,908 5,237 7,275 11,573 16,078 18,191 18,113 16,833 18,778 21,564
Public sector 3,202 3,757 4,193 4,159 3,796 4,854 5,259 6,692 5,214 6,550
Inventory variation 2,751 2,842 3,400 3,994 1,910 3,687 4,095 5,756 3,710 4,897
Export of goods and services 11,498 16,390 22,378 28,322 32,699 31,627 36,959 37,479 41,137 46,054
Minus: import of goods and services 14,391 18,033 24,821 31,775 38,092 43,157 49,362 53,720 57,466 66,088
GROSS DOMESTIC PRODUCT (market prices) 28,862 37,507 47,763 61,322 70,438 77,096 89,401 99,032 108,124 120,322Net revenues from factors of production
Received from the rest of the world -1,843 -2,532 -3,069 -2,812 -2,845 -2,335 -2,325 -2,811 -3,179 -3,404
Income from factors 202 306 390 586 805 1,141 1,634 1,361 1,098 984
Minus: Payments for factors 2,045 2,838 3,459 3,398 3,650 3,477 3,959 4,172 4,277 4,388
GROSS NATIONAL PRODUCT (market prices) 27,019 34,975 44,694 58,510 67,593 74,761 87,076 96,221 104,945 116,918 Minus: net indirect taxes from subsidies 4,092 4,881 6,603 8,212 10,370 11,214 11,879 12,474 12,355 13,981 Minus: allotments for fixed capital consumption 1,707 2,258 2,845 3,528 4,086 4,645 5,269 5,908 6,507 7,180
NET NATIONAL PRODUCT (at factor cost) = NATIONAL INCOME
NATIONAL 21,220 27,836 35,246 46,770 53,137 58,902 69,928 77,839 86,083 95,757
CONSTANT PRICES
FINAL CONSUMPTION COSTS 4,402 4,454 4,687 4,813 5,086 5,105 5,508 5,803 6,066 6,250 Private sector 3,897 3,963 4,170 4,301 4,495 4,456 4,757 4,961 5,220 5,397
Public sector 505 491 517 512 591 649 751 842 846 853
GROSS FORMATION OF FIXED CAPITAL 1,514 1,296 1,378 1,596 1,761 1,876 1,733 1,600 1,506 1,634 Private sector 929 772 891 1,185 1,423 1,467 1,319 1,111 1,149 1,216
Public sector 585 524 487 411 338 409 414 489 357 418
Inventory variation 303 575 386 307 179 221 305 360 355 400
Export of goods and services 1,540 1,749 1,890 1,915 1,945 1,728 1,855 1,915 2,009 2,113
Minus: import of goods and services 1,852 1,926 1,973 1,945 2,091 2,180 2,263 2,354 2,413 2,630
GROSS DOMESTIC PRODUCT (market prices) 5,907 6,148 6,368 6,686 6,880 6,750 7,138 7,324 7,523 7,767Net revenues from factors of production
Received from the rest of the world -236 -270 -242 -168 -152 -113 -100 -113 -126 -129
Income from factors 27 33 33 40 48 62 82 70 54 45
Minus: Payments for factors 263 303 275 208 200 176 182 183 180 175
GROSS NATIONAL PRODUCT a p.m. 5,671 5,878 6,126 6,518 6,728 6,637 7,038 7,211 7,397 7,638 Minus: net indirect taxes from subsidies 613 565 617 648 685 616 587 562 517 543 Minus: allotments for fixed capital consumption 343 353 360 368 374 381 389 398 407 417
NET NATIONAL PRODUCT (at factor cost) = NATIONAL INCOME
NATIONAL 4,715 4,960 5,149 5,502 5,669 5,640 6,062 6,251 6,473 6,678
p/ preliminary e/ estimated BP19/1/04 Source: Department of Economic Studies, BCH.

iii
APPENDIX A.3 PER-CAPITA GROSS DOMESTIC PRODUCT
(In Millions of 1978 Lempiras) 1994 1995 1996 1997 1998 1999 2000 /p 2001 /p 2002 /p 2003 /e
Population (in thousands) 5,317.8 5,462.8 5,608.3 5,754.5 5,901.2 6,009.1 6,177.4 6,489.3 6,697.6 6,797.9
GDP 5,907 6,148 6,368 6,686 6,880 6,750 7,138 7,324 7,523 7,767
GNP 5,671 5,878 6,126 6,518 6,728 6,637 7,038 7,211 7,397 7,638
Per Capita GDP 1,111 1,125 1,135 1,162 1,166 1,123 1,156 1,129 1,123 1,143
Per Capita Income 1,066 1,076 1,092 1,133 1,140 1,104 1,139 1,111 1,104 1,124
/p =/p Preliminary /e =/e Estimated Source: UNAT, based on information from the Central Bank of Honduras, INE and DGEC.

iv
APPENDIX A.4 HONDURAS BALANCE OF PAYMENTS
(In Millions of US$) DESCRIPTION 1994 1995 1996 1997 1998 1999p/ 2000p/ 2001p/ 2002p/ 2003p/
CURRENT ACCOUNTS Exportation of Merchandise and Services 1389.6 1763.1 1944.3 2223.7 2504.1 2310.9 2600.7 2510.7 2570.6 2711.1
Importation of Merchandise and Services 1952.0 2204.0 2414.9 2705.6 3119.8 3288.7 3593.2 3742.2 3757.9 4060.9
Balance of Goods and Services -562.4 -440.9 -470.6 -481.9 -615.7 -977.8 -992.5 -1231.5
-1187.3
-1349.8
Transfers 210.9 264.0 276.7 321.0 487.5 736.9 746.9 929.2 968.7 1091.6Balance of Current Accounts -351.5 -176.9 -193.9 -160.9 -128.2 -240.9 -245.6 -302.3 -218.6 -258.2 CAPITAL ACCOUNTS Long and Medium Term 150.0 141.9 84.9 115.5 179.5 426.3 177.0 252.7 116.6 77.7 Short Term 98.9 72.4 142.3 111.9 -7.7 -90.7 -108.6 -24.0 116.1 -110.2Total 248.9 214.3 227.2 227.4 171.8 335.6 68.4 228.7 232.7 -32.5 Errors and Omissions 82.1 1.6 68.1 130.9 97.7 121.3 123.6 73.4 49.5 59.6 Global Balance -20.5 39.0 101.4 197.4 141.3 216.0 -53.6 -0.2 63.6 -231.1Change in NIR (-) means increase -17.2 -136.4 -173.0 -296.4 -230.0 -473.9 -118.8 -147.3 -214.0 88.2 Exceptional Financing 3.3 97.4 71.6 33.0 88.7 257.9 173.4 147.5 150.4 142.9
p/ preliminary
e/ estimated Source: Department of Economic Studies, Central Bank of Honduras

v
APPENDIX A.5 CENTRAL GOVERNMENT FINANCIAL ACCOUNTS
(Millions of Lempiras) DESCRIPTION 1994 1995 1996 1997 1998 1999 2000 2001 2002 2003p/
TOTAL INCOME 4707.5 6884.6 7982.7 10367.1 13192.2 14957.9 16753.0 19726.5 21141.1 23562.1Current Revenues b/ 4588.0 6857.4 7954.2 10342.1 13176.3 14841.9 15801.5 17848.9 19776.0 22175.1Capital Revenues c/ 119.5 27.4 28.5 25.0 15.9 18.9 10.5 31.4 0.0 0.0 Accrued Interest 97.1 60.0 External Transfers 881.0 1657.8 1302.3 1328.1
Current Spending 4289.0 5537.0 7377.1 9233.5 10287.6 12167.9 14690.0 17400.7 19593.3 22823.0Consumer Spending 2558.7 3263.1 4238.6 5281.2 6275.3 7746.5 10381.0 12680.9 14223.1 15441.1Wages and Salaries 1872.0 2315.9 2924.3 3453.4 4487.0 5655.0 7302.8 9140.9 10688.0 11564.4Employer Contributions (Social Security) 155.8 198.1 232.1 285.8 366.9 491.2 640.3 805.9 927.7 1080.5
Goods and Services 530.9 749.1 1082.2 1542.0 1421.4 1600.3 2437.9 2734.1 2607.4 2796.2 Debt Interest 1139.0 1409.1 1649.5 2084.0 1965.1 1716.8 1206.3 1065.6 1126.1 1224.3 Internal 348.1 444.0 695.7 971.5 557.7 580.3 362.4 271.9 282.7 363.2 External 790.9 965.1 953.8 1112.5 1407.4 1136.5 843.9 793.7 843.4 861.1 Transfers 591.3 864.8 1489.0 1868.3 2047.2 2704.6 2871.7 3533.5 4073.2 5912.0
Savings in Current Accts 299.0 1320.4 577.1 1108.6 2888.7 2674.0 1110.9 448.2 182.7 -647.9
Net Capital Spending and Loans 2008.5 2513.4 2266.6 3024.4 4078.4 6047.9 6485.3 7565.7 6695.7 7265.8
Real Investment 1010.6 1305.9 1352.6 1657.5 2264.7 2092.4 2420.2 2824.6 2448.9 2795.0 Financial Investment d/ 472.8 570.5 147.9 263.0 -20.8 1502.7 1220.9 821.0 1262.0 671.6 Transfers 525.1 637.0 766.1 1103.9 1834.5 2452.8 2844.2 3920.1 2984.8 3799.2
TOTAL SPENDING 6297.5 8050.4 9643.7 12257.9 14366.0 18215.8 21175.9 24966.4 16289.0 30088.8
Net Deficit -1590.0 -1165.6 -1661.0 -1890.8 -1173.8 -3257.9 -4422.9 -5239.9 -5147.9 -6526.7
DEFICIT FINANCING Internal Credit 52.1 41.0 27.3 -134.1 -781.4 109.2 1010.9 444.7 386.6 548.6 External Financing 1304.9 1728.2 1864.4 1958.4 1750.8 4650.4 1769.0 4000.2 1989.8 2929.4 External Credit 1159.2 1485.5 1691.9 1631.3 1361.5 3026.8 2016.7 3953.2 1983.7 2546.4 External Transfers 145.7 242.7 172.5 327.1 389.3 1623.6 611.8 47.0 166.9 0.0 Reduction of External Obligations f/ -260.1 -420.7 -749.2 -612.1 -646.4 -590.6 0.0 0.0 0.0 0.0
Delays on Debt Payment 67.0 52.3 78.7 138.7 94.2 0.0 0.0 0.0 0.0 External Bonds -859.5 0.0 0.0 0.0 Resources to Balance 656.4 Profits from Public Enterprises in Previous Yrs. 1731.6 0.0 2485.1 1810.0
Other Sources of Financing e/ 69.1 29.7 18.1 349.5 47.0 202.0 597.8 777.3 288.3 145.2
Variation of Cash Holdings g/ 357.0 -264.7) 421.7 190.4 434.3 -1113.1 -736.6 -339.3 -1.9 190.8
Source: SEFIN a/ Preliminary b/ Includes Net Assets Tax revenues c/ Income from sale of assets d/ Includes net loan conversion e/ Includes floating debt and reduction in deposits f/ Corresponds to loan recovery g/ Positive sign signifies cash surplus

vi
APPENDIX A.6 PUBLIC EXTERNAL DEBT BY SOURCE
(Balance in Millions of Dollars) DESCRIPTION 1994 1995 1996 1997 1998 1999 2000 2001 2002 2003p/
MULTILATERALS 2,188.50 2,293.30 2,231.10 2,246.30 2,403.30 2,753.20 2,707.20 2791.4 2904.4 3102.8 BCIE 384.5 393.3 409.1 406.7 406.1 391.3 365.7 340.5 329.1 320.7 IDB 971.2 982.6 991.4 988.1 1,035.90 1,091.60 1,093.80 1,136.60 1,184.50 1,288.00IBRD 353.8 326.8 286.4 248.2 209.9 174.1 836 906.6 1014.4 1143 IDA-WB 294.2 383.5 424.7 498.8 580.3 842.1 835 146.4 124.8 104.3 OPEC n.a. n.a. n.a. n.a. n.a. n.a. n.a. n.a. n.a. n.a. IDB Savings and Loans n.a. n.a. n.a. n.a. n.a. n.a. n.a. n.a. n.a. na
IFAD n.a. n.a. n.a. n.a. n.a. n.a. 25 n.a. n.a. n.a. Others 184.8 207.1 119.5 104.5 171.1 254.1 265.3 282.9 272.1 266.1 BILATERALS 1,394.20 1,516.80 1,465.20 1,361.90 1,398.10 1,397.20 1,417.10 1,372.30 1,499.30 1,661.20Canada n.a. n.a. n.a. n.a. n.a. n.a. 17 n.a. n.a. n.a.
United States 157.9 158.5 157.6 149.6 143 138.3 140.7 133.6 131.3 130.1
Venezuela n.a. n.a. n.a. n.a. n.a. n.a. 19 n.a. n.a. n.a. Japan 430.8 430.7 385.4 340.2 374.9 420.9 428.9 393.4 433.9 477.1 Germany 119.4 133.7 125.5 114.9 124.5 103.5 95.6 90.7 107.9 131.2 France 104.8 105.8 98.3 87.5 81.5 54.5 45 42.2 49.6 59.5 Spain 156.1 197.3 197.5 201.1 202.3 209.3 227.1 243 272.5 321.1 Italy 121.8 143.4 134.9 121.7 153.3 138.6 146 153.7 179.2 46.2 Others 303.4 347.4 366 346.9 318.6 332.1 333.8 315.7 324.9 496 PRIVATE 160.9 187 189 178.2 23.3 37.7 23.5 2.5 1.6 2.5
TOTAL 3,743.60 3,997.10 3,885.30 3,786.40 3,824.70 4,188.10 4,147.80 4166.2 4405.3 4766.5
n.a. Not Available
p/ Preliminary
e/ Estimated
SOURCE: Minutes 1985 – 2003. Secretariat of Finances

vii
APPENDIX A.7 AVERAGE CONSUMER PRICE INDEX BY REGIONS AND PRODUCT
(December 1999=100) Year 1994 1995 1996 1997 1998 1999 2000 2001 2002 2003
REGIONS
Central Metropolitan 45.2 57.6 70.5 78.7 90.7 100.0 106.4 119.2 130.2 141.0 Remaining Central 45.2 57.6 70.5 78.7 90.7 100.0 109.8 120.8 129.7 138.5 North Metropolitan 41.6 53.0 67.9 77.0 89.5 100.0 105.3 114.7 122.5 132.3 Remaining North 41.6 53.0 67.9 77.0 89.5 100.0 104.2 112.0 119.7 127.8 West 42.5 51.9 67.1 78.6 86.9 100.0 107.0 115.8 122.3 130.5 East 45.8 57.2 71.1 81.3 91.4 100.0 106.9 115.8 123.9 133.2 South 43.4 52.4 66.0 75.7 88.3 100.0 105.9 114.3 122.3 131.0
PRODUCTS
Food 47.6 58.3 73.5 81.6 94.1 100.0 104.9 114.1 118.5 122.8 Beverages and Tobacco 46.5 55.7 70.4 75.9 91.1 100.0 106.0 120.6 130.5 142.5 Health 37.2 46.5 56.2 69.4 81.9 100.0 111.9 137.6 150.5 160.3 Personal Care 42.5 54.8 68.9 80.9 95.8 100.0 107.3 114.8 120.9 127.9 Lodging 41.8 55.2 67.4 74.7 83.9 100.0 105.3 114.4 131.4 148.3 Recreation 38.2 52.7 69.9 78.5 98.2 100.0 104.9 114.7 121.0 125.4 Education 31.7 44.3 52.6 68.0 85.4 100.0 114.4 134.3 156.3 179.0 Transport 29.6 46.1 65.0 67.4 81.7 100.0 108.7 123.6 129.2 144.7 Clothing 40.8 51.5 66.2 79.2 91.3 100.0 105.3 114.5 126.0 135.4 Furniture 55.1 62.5 72.3 81.2 91.8 100.0 104.7 112.4 121.8 131.7
Communications 47.7 66.4 74.8 84.8 89.3 100.0 106.5 108.4 98.0 94.6
AVERAGE ANNUAL INDEX (December 1999 = 100) ANNUAL AVERAGE 39 50.5 62.5 75.2 85.5 95.4 106 116.2 125.1 134.7 CPI THROUGH DEC. 43.5 55.2 69.1 77.9 90.1 100 110.1 119.8 129.5 138.3 % VARIATION DEC - DEC 21.9 29.5 23.8 20.3 13.7 11.6 11.1 9.6 7.7 7.7
p/ Projected by UNAT, based on data from the Central Bank of Honduras Source: Department of Economic Studies, Central Bank of Honduras

viii
APPENDIX B1. GLOBAL PRSP INDICATORS
1. This Appendix explains the methodology used to calculate poverty and inequality indicators contained in Section IV-A “Behavior of Poverty” and Section IV-B “Performance of Global PRSP Indicators.”
Behavior of Poverty
2. With respect to Section IV-A, the databases used are from the Permanent Surveys of Multi-Purpose Households, conducted in the first half of each year by INE (1998-2004).
3. International methods are used for calculating poverty indicators. 4. The rate of poverty incidence, or the “headcount index” (H), measures the proportion of
people living below the poverty line, representing the “incidence” or “predominance” of poverty. If we use n to denote the total number of people and q to denote the number of people with income below the poverty line, this measurement is expressed as: H = q / n.
5. This measurement has the advantage of being easily interpreted and simple to communicate. However, it has been strongly criticized in academic literature, despite its extensive use. The headcount index is insensitive to essential characteristics of poverty (such as severity and profoundness), and has limited use for purposes of comparisons. This measurement, however, is very useful for poverty profiles, since it is additively separable. Thus, the proportion of poor people in the population is equal to the sum of the proportion of poor people in different sub-groups.
6. A measurement that overcomes some of the deficiencies of the headcount index is the “poverty gap,” or PG. This measures the “profoundness” of poverty and indicates poor people’s average distance from the poverty line, weighted by the incidence of poverty. If z is the poverty line and q the number of individuals with an income (i) below this line, then the income gap index may be defined as:
∑=
⎥⎦⎤
⎢⎣⎡ −
=q
i ziyz
nPG
1
1
This measurement may be interpreted in another manner if it is written in the following way:
IHPG *= I is the “income gap ratio,” defined as:
⎥⎦
⎤⎢⎣
⎡ −=
zyzI where y denotes the average income of the poor.
7. The “income gap ratio” is not a good indicator of poverty in and of itself, since if an individual with income just slightly below the poverty line is no longer “poor,” “y” will drop and the “I” (income) will increase despite the fact that there will be one less poor person and the remainder of the poor are still living in the same conditions. This problem is corrected when this indicator is multiplied by the headcount index, and the PG is thereby obtained.
8. A group of measurements that merit special attention are the family of parametric indices proposed by Foster, Greer and Thorbecke (1984). These indices can be interpreted as a poverty gap that assigns greater relative weight to individuals who are furthest away from the poverty line. As illustrated below, the formulation of this index is similar to the poverty gap, except for the presence of the “α” exponent that assigns a growing importance to individuals as their income decreases:
∑=
⎥⎦⎤
⎢⎣⎡ −
=q
i ziyz
nPG
1
1 α where α ≥ 0 and y is an indicator of the “aversion to inequality,” and
demonstrates the importance assigned to the poorest rather than those who are close to the poverty line.

ix
9. When α =0, this measurement is equal to the headcount index (H), and when α = 1, the
poverty gap is obtained—PG = H*I—which is the indicator of the relative income deficit of the poor in relation to the poverty line.
∑=
⎥⎦⎤
⎢⎣⎡ −
==q
i ziyz
nPGFGT
1
11
10. When α = 2 an index that also considers the degree of disparity in income distribution amongst the poor is also obtained. This indicator also measures the distance between the poverty line and the income of each person, but squares this distance to assign greater weight in the final result to those who are furthest from overcoming poverty
∑=
⎥⎦⎤
⎢⎣⎡ −
=q
i ziyz
nFGT
1
212
11. The values of the FGT2 index are not as easy to interpret as the H and PG indices. But its “complementariness” makes it preferable for designing and evaluating policies, as well as for comparing the poverty of different geographic units or social groups.
12. The inequality indices were also calculated based on international standards, and with databases used to calculate poverty indicators. This report presents a breakdown of the distribution of household per capita income, by income quintiles, and also synthetic indicators that summarize the general situation, in consideration of the income of the entire population and not only one specific sub-group (either a quintile or decile). These indicators are the Gini, Theil and Atkinson indices.
13. The Gini index is the most frequently used to evaluate income distribution. The Gini index corresponds geometrically to the area between the Lorenz curve and the distributional equilibrium (or equality) line, using values between (0,1) where the value of zero corresponds to absolute equality and one to absolute inequality.
∑∑= =
−=n
i
n
jyjyi
nG
1 122
1µ
14. The Theil index, also calculated, assigns greater importance to transfers made in the lower
part of the distribution and whose minimum value is zero (absolute equity) and maximum value is log(n) where n is the size of the population.
∑=
⎟⎟⎠
⎞⎜⎜⎝
⎛=
n
i
yyin
T1
log1µµ
15. Finally, the Atkinson index takes values between 0 and 1, using the inequality aversion
parameter (ε), which indicates the weight assigned to observations of the lower part of the distribution.
εε
µε
−
=
−
⎥⎥⎦
⎤
⎢⎢⎣
⎡⎟⎟⎠
⎞⎜⎜⎝
⎛−= ∑
11
1
111
n
i
yin
A
Performance of Global PRSP Indicators
16. With respect to the performance of the PRSP’s global indicators, the results of the process of validating indicators in line with SIERP implementation—which led to an exhaustive review of global indicators—were: 1) the substitution of one indicator used for the telecommunications sector, and the recalibration of its respective goals; 2) the change of

x
the source of information for the energy sector and recalibration of its goals; and 3) the review of indicators for environmental vulnerability.
17. With respect to the telecommunications sector, the PRSP goal has been reformulated as “triple the nation’s telephone density,” since the concept of indicators has been revised and these measure the penetration or density of telephone services rather than the geographic coverage as proposed in the First PRSP Progress Report and Update. In addition, it is worth mentioning that through SIERP implementation and as an outcome of a workshop on sector indicators, a global indicator is being developed (fixed line, cell and Internet service) for geographic coverage, which will be broken down into national, urban and rural coverage. This process will be carried out jointly with CPME, UNAT, CONATEL and HONDUTEL.
18. As a result, the indicator for the “number of population centers with more than 500 inhabitants without telecommunications” has been substituted by “mobile telephone penetration (users per 100 inhabitants), mostly because: i) the source of the indicator for population studies was a study about the nation’s infrastructure that lacked ongoing follow up; 2) the cell phone market has increased in the country, especially during the past year when the market was opened to a second concession, leading to a 55% increase during 2001-2003. In addition, the growth of Internet and other complementary services that are expanding communications coverage should also be considered in the future.
19. Through the review process, the goals of the two indicators for telephone coverage described in paragraph 17 were recalibrated. The methodology used to estimate goals is based on three policy measures that the sector will be implementing in the coming years: 1) full implementation of the Telephones for All-Modernization for Honduras program, which is expected to have direct impact beginning next year; 2) approval of the Telecommunications and Technology Investment Fund initiative, which is pending approval and is expected to be operating in the 2005-2006 period; 3) deregulation of the fixed telephone market, which will go into effect on December 31, 2005 and in which many “sub-operators” are expected to be converted into direct operators; and 4) approval of the Framework Law for the Telecommunications Sector.
20. The goals for the indicator for fixed line density were estimated based on the assumption of an annual 0.2 point increase for the 2002-2005 period, and later estimated based on the historic trend weighted by 1% and the required rate of growth to reach the goal of 99% by 2015, assuming that the significant increase would take place beginning in 2006, and that historical trends could be surpassed. The indicator for cell pone penetration was estimated based on actual growth weighted by 5% and the rate of growth required to reach the goal in 2015, or a 95% weighting for the entire period (2002-2015).
21. In relation to the energy sector, the decision was made to use ENEE’s administrative registries due to progress observed in the sector’s behavior and statistics. First, the history of electricity coverage between 2000 and September 2004 was obtained. Later, the goals were estimated on the basis actual growth weighted by 5% and by the rate of growth required to reach the goal in 2015 of a 95% weighting. Based on the nation’s efforts to deregulate and modernize this sector, it is expected that past performance will be surpassed and the goals set for 2015 will be achieved.
22. With respect to the environmental sector, the indicators proposed within the PRSP have been revised in the framework of the SIERP, obtaining better statistics through strengthening the UPEG of SERNA and the COHDEFOR Department of Statistics. Thus, the progress of PRSP indicators can now be more reliably measured.
23. The evolution of the PRSP’s global indicators during the 2000-2004 period is presented below.

xi
APP
END
IX B
1. G
LOB
AL
PRSP
IND
ICA
TOR
S G
OAL
IN
DIC
ATO
R (b
asel
ine
year
) B
ase-
line
2001
R
ep.
2001
G
oal12
Goa
l m
et in
20
01?17
2002
R
ep.
2002
G
oal
12
Goa
l met
20
02?
17
2003
R
ep.
2003
G
oal 12
G
oal m
et
in 2
003?
1720
04
Rep
. 20
04
Goa
l 12
Goa
l met
in
200
4?
17
2005
G
oal
2006
G
oal
2010
G
oal
2015
G
oal
Rea
l GD
P gr
owth
rate
%
real
GD
P gr
owth
(200
0) 1
5.
7 2.
6 3.
5 N
o 2.
7 4.
0 N
o 3.
75
3.0
Yes
4.6
15
3.75
Ye
s 4.
2 4.
5 4.
5 4.
5
Per c
apita
GD
P gr
owth
%
per
-cap
ita G
DP
grow
th (2
000)
2 2.
6 0.
2 1.
5 N
o 0.
3 1.
6 N
o 0.
8 0.
6 Ye
s 1.
9 15
1.
1 n.
a 1.
6 2.
1 2.
4 2.
4
Soci
al s
pend
ing
Po
verty
spe
ndin
g as
% o
f GD
P (2
000)
3 7.
0 8.
8 n.
a n.
a 7.
5 n.
a n.
a 7.
8 7.
5 Ye
s 8.
4 16
8.
1 Ye
s 8.
7 9.
4 9.
7 9.
7
Pove
rty ra
te (1
999)
4
66.0
64
.4
63.0
N
o 63
.3
61.5
N
o 63
.5
62.1
N
o 64
.2
13
60.2
N
o 58
.4
57.3
50
.0
42.0
R
educ
e po
verty
by
24
perc
enta
ge p
oint
s
Ext
rem
e po
verty
rate
(199
9) 4
49.0
47
.4
47.0
Ye
s 45
.2
45.0
Ye
s 44
.7
43.4
N
o 44
.6
13
41.5
N
o 39
.7
38.5
32
.2
25.0
Dou
ble
net p
resc
hool
co
vera
ge th
roug
h 5
year
s
Pres
choo
l edu
catio
n co
vera
ge ra
te
(199
9) 4
32.9
31
.9
33.5
N
o 32
.5
36.0
N
o 37
.7
34.9
Ye
s 36
.0
13
35.7
Ye
s 36
.5
38.6
42
.0
60.0
95%
net
cov
erag
e fo
r th
e fir
st 2
cyc
les
of
prim
ary
educ
atio
n
Net
cov
erag
e ra
te (e
xcl.
Ove
r-ag
e)
for 1
st a
nd 2
nd c
ycle
s (1
999)
4 89
.8
91.7
87
.0
Yes
88.9
88
.0
Yes
88.1
90
.7
No
89.3
13
91
.2
No
91.7
92
.5
93.2
95
.0
70%
net
cov
erag
e fo
r th
e 3rd
cyc
le (m
iddl
e sc
hool
) of p
rimar
y ed
ucat
ion
Cov
erag
e ra
te (e
xcl.
over
-age
) for
th
e 3rd
cyc
le o
f prim
ary
educ
atio
n (m
iddl
e sc
hool
) (19
99) 4
24.2
31
.0
26.0
Ye
s 30
.9
27.9
Ye
s 31
.2
32.9
N
o 38
.2
13
35
Yes
37.3
39
.7
51.1
70
50%
of t
he e
mer
ging
po
pula
tion
com
plet
es
seco
ndar
y ed
ucat
ion
Net
cov
erag
e (e
xcl.
over
-age
) of
Div
ersi
fied
Seco
ndar
y cy
cle
(10-
12
grad
e) (1
999)
4
12.4
12
.0
13.6
N
o 17
.5
14.9
Ye
s 18
.9
19.0
Ye
s 21
.3
13
20.6
Ye
s 22
.3
24.2
33
.4
50.0
Infa
nt m
orta
lity
rate
/1,0
00 li
ve b
irths
(1
996)
5 36
.0
34 .0
32
.0
No
n.a
31.0
n.
a n.
a 32
.0
n.a
n.a
30.0
n.
a 29
.0
27.0
22
.0
18.0
R
educ
e in
fant
and
U
nder
5 m
orta
lity
rate
by
hal
f U
nder
5 m
orta
lity
rate
(per
1,0
00
l.b.)
(199
6) 5
48
.0
45 .0
44
.0
No
n.a
43.0
n.
a n.
a 43
.0
n.a
n.a
41.0
n.
a 39
.0
37.0
30
.0
24.0
Red
uce
mal
nutri
tion
in
child
ren
Und
er 5
by
half
Infa
nt m
alnu
tritio
n ra
te (1
996)
5 37
.8
32.9
38
.0
Yes
n.a
36.0
n.
a n.
a 30
.9
n.a
n.a
29.9
n.
a 28
.9
27.0
22
.0
18.0
Red
uce
mat
erna
l m
orta
lity
by h
alf
M
ater
nal m
orta
lity
rate
per
100
,000
liv
e bi
rths
(199
6) 6
14
7.0
108
.014
3.0
Yes
n.a
138.
0n.
a n.
a 10
2.0
n.a
n.a
98.0
n.
a 95
.0
93.0
82
.0
70.0
Achi
eve
80%
co
vera
ge o
f ele
ctric
ity
serv
ices
Elec
trici
ty c
over
age
rate
(199
9) 7
54.9
57
.5
n.a
n.a
60.1
n.
a n.
a 62
.1
61.7
Ye
s 63
.7
13
63.3
0Ye
s 64
.9
66.5
72
.8
80.0
Fixe
d lin
e de
nsity
x 1
00 in
habi
tant
s (2
000)
8 4.
8 4.
8 n.
a n.
a 4.
8 n.
a n.
a 4.
9 5.
0 Ye
s 5.
18
14
5.2
Yes
5.4
6.1
9.7
14.1
Tr
iple
the
natio
n’s
tele
phon
e de
nsity
M
obile
tele
phon
e pe
netra
tion
(use
rs
per 1
00 in
habi
tant
s) 8
2.5
3.6
n.a
n.a
4.9
n.a
n.a
5.6
5.5
Yes
8.85
14
6.
4 Ye
s 7.
2 8.
1 11
.5
15.7
% o
f pop
ulat
ion
with
acc
ess
to
pota
ble
wat
er (1
999)
4 8
1 n.
a.
82.0
n.
a 81
.3
84.0
N
o 8
1 82
.1
No
82.2
13
82
.6
Yes
83.4
85
.0
90.0
95
.0
95%
acc
ess
to p
otab
le
wat
er a
nd s
anita
tion
%
of p
opul
atio
n w
ith a
cces
s to
ex
cret
a el
imin
atio
n sy
stem
s (1
999)
4
70.
2 69
.4
71.0
N
o 67
.6
72.0
N
o 68
.6
70.7
N
o 76
.7
13
71.9
Ye
s 73
.0
76.0
85
.0
95.0
HD
I rel
ated
to g
ende
r (1
999)
9 0.
6 0.
62
0.65
N
o 0.
6 0.
7 N
o 0.
65
0.65
Ye
s n.
a 0.
66
n.a
0.7
0.7
0.7
0.8
Rai
se h
uman
de
velo
pmen
t ind
ex
amon
g w
omen
by
20%
Gen
der e
mpo
wer
men
t ind
ex (1
999)
9
0.5
0.45
0.
46
No
0.5
0.5
No
0.43
0.
47
No
n.a
0.48
n.
a 0.
5 0.
5 0.
6 0.
6

xi
i
APP
END
IX B
1. G
LOB
AL
PRSP
IND
ICA
TOR
S G
OAL
IN
DIC
ATO
R (b
asel
ine
year
) B
ase-
line
2001
R
ep.
2001
G
oal12
Goa
l m
et in
20
01?17
2002
R
ep.
2002
G
oal
12
Goa
l met
20
02?
17
2003
R
ep.
2003
G
oal 12
G
oal m
et
in 2
003?
1720
04
Rep
. 20
04
Goa
l 12
Goa
l met
in
200
4?
17
2005
G
oal
2006
G
oal
2010
G
oal
2015
G
oal
Num
ber o
f prio
rity
prot
ecte
d ar
eas
(PPA
s) w
ith m
anag
emen
t pla
ns
(200
0)10
5.0
5.0
n.a
n.a
12.0
n.
a n.
a 15
.0
15.0
Ye
s 23
14
23.0
Ye
s 31
.0
39.0
39
.0
39.0
% o
f tot
al s
urfa
ce a
rea
cove
red
by
prio
rity
prot
ecte
d ar
eas
(PPA
s) w
ith
man
agem
ent p
lans
(200
0) 10
12.5
12
.5
30.0
N
o 30
.0
40.0
N
o 37
.5
60.0
N
o 57
.5
14
75.0
N
o 79
.5
100.
010
0.0
100.
0
Red
uce
the
natio
n’s
envi
ronm
enta
l vu
lner
abili
ty
Air p
ollu
tion
in u
rban
cen
ters
(ug/
m3
de P
TS) (
2000
) 11
668.
7 73
9.2
618.
8 N
o n.
a 58
3.9
n.a
708.
0 n.
a n.
a n.
a n.
a n.
a n.
a n.
a n.
a n.
a
1. B
CH
; 2.
UN
AT,
with
BC
H a
nd IN
E d
ata;
3.
SE
FIN
bas
ed o
n th
e ne
w d
efin
ition
of p
over
ty s
pend
ing;
4.
Est
imat
es b
ased
on
EP
HP
M; 5
. E
NE
SF;
6.
Sec
reta
riat o
f Hea
lth: R
esea
rch
abou
t mat
erna
l mor
talit
y an
d w
omen
of c
hild
bear
ing
age
in H
ondu
ras,
199
7; 7
. E
NE
E re
gist
ries;
8.
HO
ND
UTE
L/C
ON
ATE
L re
gist
ries;
9.
Hum
an D
evel
opm
ent R
epor
t (U
ND
P);
10.
CO
HD
EFO
R y
early
sta
tistic
s; 1
1. S
ER
NA
(Cen
ter
for t
he S
tudy
and
Con
trol o
f Con
tam
inan
ts C
ES
CC
O);
ther
e w
as n
o m
onito
ring
in 2
002
and
mon
itorin
g fo
r 200
4 w
ill b
e th
roug
h D
ecem
ber;
12.
Dat
a fo
r thi
s ye
ar a
re th
e re
vise
d go
als,
acc
ordi
ng to
the
Firs
t P
rogr
ess
Rep
ort;
13.
For 2
004,
the
estim
ate
is b
ased
on
the
May
200
4 E
PH
PM
; 14.
For
200
4, th
e es
timat
e is
thro
ugh
Sep
tem
ber,
acco
rdin
g to
the
regi
strie
s of
the
resp
ectiv
e S
ecre
taria
t; 15
. Th
e re
al G
DP
gr
owth
rate
is a
BC
H p
roje
ctio
n an
d th
e pe
r-ca
pita
GD
P a
lso
uses
INE
pop
ulat
ion
proj
ectio
ns; 1
6. T
he d
ata
obse
rved
cor
resp
onds
to P
RS
P S
pend
ing
prog
ram
med
and
app
rove
d fo
r 200
4. I
t is
wor
th
men
tioni
ng th
at im
plem
enta
tion
had
reac
hed
7.2%
of t
he G
DP
by
Sep
tem
ber;
17.
The
goal
is c
onsi
dere
d m
et if
the
diffe
renc
e be
twee
n th
e va
lue
obse
rved
and
the
goal
is n
o gr
eate
r tha
n 0.
5%.

xi
ii A
PPEN
DIX
B2.
IN
TER
MED
IATE
PR
SP IN
DIC
ATO
RS
His
toric
al s
erie
s N
o.
Nam
e of
Indi
cato
r D
escr
iptio
n R
espo
nsib
le
2000
20
01
2002
20
03
Sep.
200
4
MA
CR
OE
CO
NO
MIC
IND
ICA
TOR
S
1 P
RS
P s
pend
ing
as p
erce
ntag
e of
GD
P
This
is th
e pr
opor
tion
of P
RS
P sp
endi
ng in
rela
tion
to th
e G
DP
.
UP
EG
/ SE
FIN
-
8.8
7.54
7.8
7.2
2 P
RS
P s
pend
ing
as p
erce
ntag
e of
tota
l sp
endi
ng
This
is th
e pr
opor
tion
of P
RS
P sp
endi
ng in
rela
tion
to to
tal G
over
nmen
t spe
ndin
g.
UP
EG
/ SE
FIN
-
3430
.52
30.7
333
.29
3 P
RS
P s
pend
ing
as p
erce
ntag
e of
cen
tral
gove
rnm
ent s
pend
ing
Th
is is
the
prop
ortio
n of
PR
SP
spen
ding
in re
latio
n to
the
Cen
tral G
over
nmen
t’s to
tal
spen
ding
. U
PE
G /
SEFI
N
-31
.98
28.6
128
.12
29.3
5
4 In
com
e/G
DP
Th
is is
the
sum
of T
ax a
nd N
on-T
ax R
even
ues
in re
latio
n to
the
GD
P.
UP
EG
/ SE
FIN
17
.718
.218
.318
.419
.37
5 Ta
x re
venu
es/G
DP
Th
is is
the
sum
of d
irect
and
indi
rect
taxe
s as
wel
l as
impo
rt ta
xes
in re
latio
n to
the
GD
P.
UP
EG
/ SE
FIN
16
.416
.215
.916
.317
.3
6 N
on-ta
x re
venu
es/G
DP
Th
is is
the
sum
of r
ates
, tar
iffs,
dut
ies,
roya
lties
, and
cur
rent
tran
sfer
s to
the
Cen
tral
Ban
k in
rela
tion
to th
e G
DP.
U
PE
G /
SEFI
N
1.4
1.9
2.4
2.1
2.17
7 C
urre
nt s
pend
ing/
GD
P
This
is th
e su
m o
f wag
es a
nd s
alar
ies,
em
ploy
er c
ontri
butio
ns, g
oods
and
ser
vice
s,
inte
rest
on
the
publ
ic d
ebt,
and
curre
nt p
aid
trans
fers
incl
udin
g P
RS
P an
d no
n-P
RS
P
spen
ding
in re
latio
n to
the
GD
P.
UP
EG
/ SE
FIN
16
.417
.618
.119
16.8
8 C
apita
l spe
ndin
g/ G
DP
Th
is is
the
sum
of g
ross
cap
ital f
orm
atio
n sp
endi
ng (r
eal i
nves
tmen
t), n
et c
redi
t co
nces
sion
s, p
aid
capi
tal t
rans
fers
incl
udin
g P
RS
P an
d no
n-P
RS
P s
pend
ing
in
rela
tion
to th
e G
DP.
U
PE
G /
SEFI
N
7.3
7.6
6.2
64.
92
9 P
RS
P c
apita
l spe
ndin
g
This
is th
e su
m o
f gro
ss c
apita
l for
mat
ion
spen
ding
(rea
l inv
estm
ent)
and
paid
cap
ital
trans
fers
mad
e by
diff
eren
t PR
SP
prog
ram
s an
d pr
ojec
ts, i
n re
latio
n to
the
GD
P.
U
PE
G /
SEFI
N
-3.
92.
72.
72.
54
10
PR
SP
cur
rent
spe
ndin
g
This
is th
e su
m o
f spe
ndin
g fo
r wag
es a
nd s
alar
ies,
em
ploy
er c
ontri
butio
ns, g
oods
an
d se
rvic
es, a
nd c
urre
nt p
aid
trans
fers
by
diffe
rent
PR
SP
prog
ram
s an
d pr
ojec
ts, i
n re
latio
n to
the
GD
P.
UP
EG
/ SE
FIN
-
4.9
4.8
4.8
4.5
11
Pub
lic in
vest
men
t as
a pe
rcen
tage
of t
he
GD
P
This
is th
e su
m o
f gro
ss c
apita
l for
mat
ion
spen
ding
(rea
l inv
estm
ent)
real
ized
by
the
Cen
tral G
over
nmen
t, in
rela
tion
to th
e G
DP
. U
PE
G /
SEFI
N
2.7
2.9
2.3
2.3
1.8
12
IMA
E
Mon
thly
Eco
nom
ic A
ctiv
ity In
dex
U
PE
G /
SEFI
N
185.
920
2.3
211.
021
6.9
221.
3
13
Net
Inte
rnat
iona
l Res
erve
s (N
IR) f
or th
e nu
mbe
r of m
onth
s of
impo
rts
The
num
ber o
f mon
ths
for w
hich
impo
rts c
an b
e fin
ance
d, w
ith th
e N
et In
tern
atio
nal
Res
erve
s av
aila
ble
for o
ne y
ear.
BC
H
4.6
4.8
5.1
4.4
4.7
14
Cur
rent
bal
ance
as
% o
f GD
P
Def
icit
or s
urpl
us re
sulti
ng fr
om c
urre
nt B
alan
ce o
f Pay
men
t tra
nsac
tions
. B
CH
4.
14.
92.
65.
25.
8
15
Deb
t as
% o
f GD
P
Pub
lic e
xter
nal d
ebt b
urde
n on
the
Gro
ss D
omes
tic P
rodu
ct.
BC
H
52.5
50.3
49.6
48.2
45.0
16
Deb
t ser
vice
as
a %
of e
xpor
ts
Bur
den
of p
ublic
ext
erna
l deb
t am
ortiz
atio
ns a
nd fi
nanc
ial c
osts
on
tota
l exp
orts
. B
CH
10
.47.
89.
68.
87.
9
17
% o
f sho
rt te
rm fi
nanc
ing
Th
e sh
ort-t
erm
deb
t’s p
ropo
rtion
of t
he to
tal e
xter
nal d
ebt.
B
CH
2.
12.
22.
62.
32.
9
18
Infla
tion
rate
Th
e in
flatio
n ra
te is
the
perc
enta
ge c
hang
e in
pric
e le
vels
bet
wee
n tw
o sp
ecifi
c pe
riods
of t
ime.
The
rate
of v
aria
tion
of th
e C
onsu
mer
Pric
e In
dex
(CP
I) is
use
d to
m
easu
re in
flatio
n.
BC
H
10.1
8.8
8.1
6.8
8.0
- 8.5
19
Nom
inal
exc
hang
e ra
te
The
pric
e of
the
US
Dol
lar i
n Le
mpi
ras,
whi
ch is
offi
cial
ly c
alle
d th
e R
efer
ence
E
xcha
nge
Rat
e (R
ER
). T
he R
ER
is s
et b
y th
e Fo
reig
n C
urre
ncy
Auc
tion
Sys
tem
, us
ing
the
Bas
elin
e E
xcha
nge
Rat
e (B
ER
) as
a pr
ice-
para
met
er.
B
CH
14
.84
15.4
716
.43
17.3
518
.2

xi
v
APP
END
IX B
2. I
NTE
RM
EDIA
TE P
RSP
IND
ICA
TOR
S H
isto
rical
ser
ies
No.
N
ame
of In
dica
tor
Des
crip
tion
Res
pons
ible
20
00
2001
20
02
2003
Se
p. 2
004
20
Rea
l int
eres
t rat
es o
n de
posi
ts
This
is th
e pa
ymen
t rec
eive
d fo
r mai
ntai
ning
dep
osits
, elim
inat
ing
the
effe
ct o
f in
flatio
n.
BC
H
2.13
2.96
0.69
1.34
-0.5
8
21
Rea
l int
eres
t rat
es o
n lo
ans
Th
is is
the
finan
cial
cos
t of l
oans
, elim
inat
ing
the
effe
ct o
f inf
latio
n.
BC
H
14.4
714
.38
13.9
613
.44
10.9
8
22
Rea
l exc
hang
e ra
te in
dex
Th
is is
the
nom
inal
exc
hang
e ra
te a
djus
ted
for i
nter
nal a
nd e
xter
nal i
nfla
tion.
The
ap
prox
imat
e tre
nd o
f the
real
exc
hang
e ra
te is
mea
sure
d w
ith th
e va
riatio
n of
the
Rea
l E
ffect
ive
Exc
hang
e R
ate
Inde
x (IT
CE
R)
BC
H
72.5
72.6
771
.12
69.2
469
.47
23
Inve
stm
ent a
s a
% o
f GD
P
Cor
resp
onds
to th
e im
porta
nce
that
pub
lic a
nd p
rivat
e in
vest
men
t in
mac
hine
ry,
equi
pmen
t and
con
stru
ctio
n ha
s w
ithin
the
GD
P
BC
H
26.1
23.8
22.2
23.4
27.0
24
Trad
ition
al e
xpor
ts a
s %
of G
DP
Th
e su
m o
f the
val
ue o
f exp
orts
con
side
red
as “t
radi
tiona
l,” a
s a
perc
enta
ge o
f the
G
DP
.
BC
H
10.7
8.4
7.7
6.3
6.7
25
Non
-trad
ition
al a
gric
ultu
ral e
xpor
ts a
s %
of
tota
l exp
orts
V
alue
of t
he e
xpor
t of a
gric
ultu
ral e
xpor
ts s
uch
as fr
uits
and
veg
etab
les,
as
a pe
rcen
tage
of t
he v
alue
of T
otal
Exp
orts
.
BC
H
3.1
3.2
5.1
5.9
6.4
26
Woo
d an
d m
anuf
actu
ring
expo
rts a
s %
of
tota
l exp
orts
V
alue
of w
ood
and
man
ufac
ture
d ex
ports
as
a pe
rcen
tage
of t
he v
alue
of t
otal
ex
ports
. B
CH
3.
64.
34.
34.
52.
2
27
Agg
rega
te v
alue
of m
aqui
la in
dust
ries
as
a %
of t
he to
tal e
xpor
ts o
f goo
ds a
nd
serv
ices
Fore
ign
curr
ency
reve
nues
to th
e na
tion
com
ing
from
the
maq
uila
sec
tor,
for c
osts
in
curr
ed in
the
prod
uctio
n pr
oces
s, a
s th
e pe
rcen
tage
of t
otal
exp
orts
of m
erch
andi
se
and
serv
ices
.
BC
H
22.1
22.3
23.8
26.0
26.6
28
Am
ount
of f
orei
gn c
urre
ncy
gene
rate
d by
to
uris
ts, a
s %
of t
otal
exp
orts
Fo
reig
n cu
rren
cy re
venu
es to
the
natio
n fro
m th
e sp
endi
ng o
f tra
vele
rs, a
s a
perc
enta
ge o
f tot
al e
xpor
ts.
BC
H
10.0
10.2
11.7
12.4
12.8
RU
RA
L D
EV
ELO
PM
EN
T IN
DIC
ATO
RS
29
N
umbe
r of a
gro-
food
cha
ins
N
umbe
r of a
gro-
food
pro
duct
ion
chai
ns c
reat
ed.
S
AG
/CO
HD
EFO
R
--
--
6
30
Num
ber o
f agr
o-fo
od c
hain
pro
duce
rs
Num
ber o
f pro
duce
rs b
enef
iting
from
the
crea
tion
of a
gro-
food
cha
ins.
S
AG
/CO
HD
EFO
R
--
--
60,9
00
31
Num
ber o
f agr
o-bu
sine
ss c
ente
rs
Bus
ines
s ce
nter
s fo
r com
mer
cial
izin
g pr
oduc
ts.
S
AG
/CO
HD
EFO
R
--
--
1
32
Agr
o-fo
rest
ry b
usin
esse
s op
erat
ing
SAG
/CO
HD
EFO
R
--
--
300
33
Uni
ts p
rodu
cing
non
-agr
icul
tura
l non
-in
dust
rial g
oods
N
umbe
r of u
nits
pro
duci
ng n
on-a
gric
ultu
ral g
oods
. S
AG
/CO
HD
EFO
R
--
--
50
IN
DU
STR
Y A
ND
CO
MM
ER
CE
IND
ICA
TOR
S
34
Num
ber o
f ste
ps re
quire
d to
ope
n a
new
bu
sine
ss
- S
AG
/CO
HD
EFO
R
--
1212
12
35
Num
ber o
f bus
ines
ses
from
the
soci
al
sect
or o
f the
eco
nom
y an
d se
cond
and
th
ird d
egre
e in
tegr
atio
n or
gani
zatio
ns
- S
AG
/CO
HD
EFO
R
12.0
3816
718
110
0
36
Tota
l num
ber o
f job
s ge
nera
ted,
by
cate
gory
, in
free
trade
zon
es
- S
AG
/CO
HD
EFO
R
-43
,254
49,3
5358
,289
-
37
Num
ber o
f cer
tific
atio
ns is
sued
und
er
pref
eren
tial t
rade
sch
emes
. -
SAG
/CO
HD
EFO
R
-18
,632
33,4
9536
,152
35,7
28

xv
APP
END
IX B
2. I
NTE
RM
EDIA
TE P
RSP
IND
ICA
TOR
S H
isto
rical
ser
ies
No.
N
ame
of In
dica
tor
Des
crip
tion
Res
pons
ible
20
00
2001
20
02
2003
Se
p. 2
004
ED
UC
ATI
ON
IND
ICA
TOR
S
38
Net
urb
an p
resc
hool
cov
erag
e
Chi
ldre
n 5-
6 ye
ars
of a
ge a
ttend
ing
pres
choo
l, ou
t of a
ll ch
ildre
n 5-
6 ye
ars
of a
ge in
th
e ur
ban
sect
or.
IN
E
-43
.140
.228
.842
.4
39
Net
rura
l pre
scho
ol c
over
age
C
hild
ren
5-6
year
s of
age
atte
ndin
g pr
esch
ool,
out o
f all
child
ren
5-6
year
s of
age
in
the
rura
l sec
tor.
INE
-
34.7
25.5
19.8
32.1
40
Net
urb
an p
rimar
y sc
hool
cov
erag
e (1
st
and
2nd c
ycle
s)
Chi
ldre
n 7-
12 y
ears
of a
ge a
ttend
ing
prim
ary
scho
ol, o
ut o
f all
child
ren
7-12
yea
rs o
f ag
e in
the
urba
n se
ctor
. IN
E
-89
.389
.681
.990
.2
41
Net
rura
l prim
ary
scho
ol c
over
age
(1st
and
2nd c
ycle
s)
Chi
ldre
n 7-
12 y
ears
of a
ge a
ttend
ing
prim
ary
scho
ol, o
ut o
f all
child
ren
7-12
yea
rs o
f ag
e in
the
rura
l sec
tor.
INE
-
86.5
86.4
80.6
88.6
42
Net
urb
an m
iddl
e sc
hool
cov
erag
e (3
rd
cycl
e)
Chi
ldre
n 13
-15
year
s of
age
atte
ndin
g m
iddl
e sc
hool
(3rd
cyc
le) o
ut o
f all
child
ren
13-
15 y
ears
of a
ge in
the
urba
n se
ctor
.
INE
-
46.3
49.3
53.2
57.6
43
Net
rura
l mid
dle
scho
ol c
over
age
(3rd
cy
cle)
C
hild
ren
13-1
5 ye
ars
of a
ge a
ttend
ing
mid
dle
scho
ol (3
rd c
ycle
) out
of a
ll ch
ildre
n 13
-15
yea
rs o
f age
in th
e ru
ral s
ecto
r. IN
E
-24
.817
.419
.523
.4
44
Net
urb
an s
econ
dary
(div
ersi
fied)
co
vera
ge
Chi
ldre
n 16
-18
year
s of
age
atte
ndin
g se
cond
ary
scho
ol, o
ut o
f all
child
ren
16-1
8 ye
ars
of a
ge in
the
urba
n se
ctor
. IN
E
-28
.826
.132
.635
.3
45
Net
rura
l sec
onda
ry (d
iver
sifie
d)
cove
rage
C
hild
ren
16-1
8 ye
ars
of a
ge a
ttend
ing
seco
ndar
y sc
hool
, out
of a
ll ch
ildre
n 16
-18
year
s of
age
in th
e ru
ral s
ecto
r. IN
E
-8.
15.
46.
38.
6
46
1st g
rade
pro
mot
ion
rate
To
tal s
tude
nts
who
hav
e sa
tisfa
ctor
ily c
ompl
eted
the
requ
irem
ents
est
ablis
hed
in
stud
y pl
ans
and
prog
ram
s, a
llow
ing
them
to g
radu
ate
to th
e 2nd
gra
de.
S
E
--
-76
.85
-
47
3rd g
rade
pro
mot
ion
rate
To
tal s
tude
nts
who
hav
e sa
tisfa
ctor
ily c
ompl
eted
the
requ
irem
ents
est
ablis
hed
in
stud
y pl
ans
and
prog
ram
s, a
llow
ing
them
to g
radu
ate
to th
e 4th
gra
de.
S
E
--
-83
.25
-
48
6th g
rade
pro
mot
ion
rate
To
tal s
tude
nts
who
hav
e sa
tisfa
ctor
ily c
ompl
eted
the
requ
irem
ents
est
ablis
hed
in
stud
y pl
ans
and
prog
ram
s, a
llow
ing
them
to g
radu
ate
to th
e 7th
gra
de.
SE
-
--
92.0
2-
49
1st g
rade
failu
re ra
te
The
perc
enta
ge o
f stu
dent
s w
ho h
ave
not o
btai
ned
the
nece
ssar
y kn
owle
dge
esta
blis
hed
in th
e st
udy
prog
ram
s of
any
gra
de, a
nd a
s a
resu
lt m
ust r
epea
t the
1st
grad
e.
SE
-
--
14.7
1-
50
3rd g
rade
failu
re ra
te
The
perc
enta
ge o
f stu
dent
s w
ho h
ave
not o
btai
ned
the
nece
ssar
y kn
owle
dge
esta
blis
hed
in th
e st
udy
prog
ram
s of
any
gra
de, a
nd a
s a
resu
lt m
ust r
epea
t the
3rd
gr
ade
SE
-
--
8.94
-
51
6th g
rade
failu
re ra
te
The
perc
enta
ge o
f stu
dent
s w
ho h
ave
not o
btai
ned
the
nece
ssar
y kn
owle
dge
esta
blis
hed
in th
e st
udy
prog
ram
s of
any
gra
de, a
nd a
s a
resu
lt m
ust r
epea
t the
6th
grad
e S
E
--
-1.
92-
52
1st g
rade
dro
pout
rate
In
clud
es a
ll en
rolle
d st
uden
ts w
ho a
band
on th
eir s
tudi
es b
efor
e co
nclu
ding
the
scho
ol
year
(1st g
rade
). S
E
--
-8.
44-
53
3rd g
rade
dro
pout
rate
In
clud
es a
ll en
rolle
d st
uden
ts w
ho a
band
on th
eir s
tudi
es b
efor
e co
nclu
ding
the
scho
ol
year
(3rd
gra
de).
SE
-
--
7.81
-
54
6th g
rade
dro
pout
rate
In
clud
es a
ll en
rolle
d st
uden
ts w
ho a
band
on th
eir s
tudi
es b
efor
e co
nclu
ding
the
scho
ol
year
(6th g
rade
). S
E
--
-6.
06-
55
3rd g
rade
aca
dem
ic p
erfo
rman
ce in
S
pani
sh
Mea
n pe
rcen
tage
of c
orre
ct re
spon
ses
in 3
rd g
rade
Spa
nish
.
UM
CE
(*)4
0-
38.4
--
56
6th g
rade
aca
dem
ic p
erfo
rman
ce in
S
pani
sh
Mea
n pe
rcen
tage
of c
orre
ct re
spon
ses
in 6
th g
rade
Spa
nish
. U
MC
E (*
)46
-43
.5-
-
57
3rd g
rade
aca
dem
ic p
erfo
rman
ce in
M
athe
mat
ics
Mea
n pe
rcen
tage
of c
orre
ct re
spon
ses
in 3
rd g
rade
Mat
hem
atic
s.
UM
CE
(*)3
6-
43.2
--
58
6th g
rade
aca
dem
ic p
erfo
rman
ce in
M
athe
mat
ics
Mea
n pe
rcen
tage
of c
orre
ct re
spon
ses
in 6
th g
rade
Mat
hem
atic
s U
MC
E (*
)34
-38
.8-
-
59
3rd g
rade
aca
dem
ic p
erfo
rman
ce in
N
atur
al S
cien
ces
Mea
n pe
rcen
tage
of c
orre
ct re
spon
ses
in 3
rd g
rade
Nat
ural
Sci
ence
s.
UM
CE
--
40.6
--
60
6th g
rade
aca
dem
ic p
erfo
rman
ce in
N
atur
al S
cien
ces
Mea
n pe
rcen
tage
of c
orre
ct re
spon
ses
in 6
th g
rade
Nat
ural
Sci
ence
s U
MC
E -
-42
.2-
-
61
PR
OH
EC
O S
choo
ls
Num
ber o
f PR
OH
ECO
sch
ools
. S
E
820
1,02
51,
081
1,66
32,
168
62
Enr
ollm
ent i
n P
RO
HE
CO
sch
ools
E
nrol
lmen
t in
PR
OH
EC
O s
choo
ls.
SE
1,
109
1,25
11,
468
2,68
53,
377

xv
i
APP
END
IX B
2. I
NTE
RM
EDIA
TE P
RSP
IND
ICA
TOR
S H
isto
rical
ser
ies
No.
N
ame
of In
dica
tor
Des
crip
tion
Res
pons
ible
20
00
2001
20
02
2003
Se
p. 2
004
63
Ben
efic
iarie
s of
Sch
ool S
nack
N
umbe
r of c
hild
ren
enro
lled
in a
sch
ool b
enef
ited
by a
ratio
n of
food
S
E
136,
000
209,
435
390,
918
618,
083
800,
000
64
PR
SP
spe
ndin
g on
edu
catio
n as
a
perc
enta
ge o
f GD
P P
erce
ntag
e of
PR
SP s
pend
ing
as p
erce
ntag
e of
GD
P
UN
AT
-3.
2%3.
1%3.
2%2.
3%
65
PR
SP
spe
ndin
g on
edu
catio
n P
erce
ntag
e of
PR
SP s
pend
ing
on e
duca
tion
UN
AT
-36
.1%
40.9
%41
.2%
41.1
%
66
Illite
racy
rate
P
opul
atio
n ol
der t
han
15 y
ears
that
can
not r
ead
or w
rite
INE
-
19.4
19.7
19.0
18.5
HE
ALT
H IN
DIC
ATO
RS
67
Birt
h co
vera
ge b
y tra
ined
birt
h at
tend
ants
(m
idw
ives
).
The
perc
enta
ge o
f birt
hs a
ttend
ed b
y tra
ined
birt
h at
tend
ants
(mid
wiv
es).
S
ecre
taria
t of
Hea
lth
INE
24
.97
19.7
21.1
716
.64
18.4
9
68
Inst
itutio
nal b
irth
cove
rage
Th
e pe
rcen
tage
of i
nstit
utio
nal b
irths
atte
nded
in m
ater
nal-i
nfan
t clin
ics
or h
ospi
tals
. S
ecre
taria
t of
Hea
lth
IN
E
51.7
%44
.0%
45.4
%47
.7%
56.6
0%
69
Pre
vale
nce
of c
ontra
cept
ive
use
The
perc
enta
ge o
f sex
ually
act
ive
wom
en b
etw
een
10-4
9 ye
ars
of a
ge w
ho c
urre
ntly
us
e an
y m
etho
d of
con
trace
ptio
n, a
t a s
peci
fic ti
me,
exp
ress
ed a
s th
e pe
rcen
tage
of
the
corre
spon
ding
pop
ulat
ion
halfw
ay th
roug
h th
e ye
ar.
Sec
reta
riat o
f H
ealth
7%
8%9%
9%8%
70
Ave
rage
pre
nata
l che
ckup
s
The
num
ber o
f firs
t tim
e ch
ecku
ps a
mon
g pr
egna
nt w
omen
.
Sec
reta
riat o
f H
ealth
73
%70
%77
%94
%94
%
71
Ces
area
n de
liver
y ra
te
The
rela
tions
hip
betw
een
all b
irths
atte
nded
and
the
perc
enta
ge o
f ces
area
ns, a
s an
in
dica
tor o
f qua
lity.
S
ecre
taria
t of
Hea
lth
12.3
0%12
.00%
12.9
0%14
.30%
15.2
0%
72
Ave
rage
pue
rper
al c
heck
ups
Th
e av
erag
e nu
mbe
r of p
uerp
eral
che
ckup
s re
ceiv
ed d
urin
g a
give
n pe
riod.
Car
e th
at is
“pos
tpar
tum
” tak
es p
lace
dur
ing
the
42 d
ays
follo
win
g bi
rth.
Pue
rper
al c
are
is
prov
ided
in m
ater
nal-i
nfan
t clin
ics
(CM
Is) a
nd h
ospi
tals
.
Sec
reta
riat o
f H
ealth
47
%39
%44
%43
%51
%
73
Dia
rrhe
a in
cide
nce
amon
g ch
ildre
n U
nder
5
The
num
ber o
f new
dia
rrhe
a ca
ses
amon
g ch
ildre
n U
nder
5, d
urin
g a
give
n pe
riod,
in
rela
tion
to th
e to
tal n
umbe
r of c
hild
ren
Und
er 5
dur
ing
the
sam
e pe
riod.
Sec
reta
riat o
f H
ealth
24
.0
20.0
22
.0
18.0
18
.0
74
Pne
umon
ia in
cide
nce
amon
g ch
ildre
n U
nder
5
The
num
ber o
f new
pne
umon
ia c
ases
am
ong
child
ren
Und
er 5
, dur
ing
a gi
ven
perio
d,
in re
latio
n to
the
tota
l num
ber o
f chi
ldre
n U
nder
5 d
urin
g th
e sa
me
perio
d.
Sec
reta
riat o
f H
ealth
48
.08
59.2
251
.84
55.2
154
.77
75
Mal
aria
inci
denc
e ra
te
The
num
ber o
f new
mea
sles
cas
es a
mon
g ch
ildre
n be
twee
n 12
and
23
mon
ths
old.
S
ecre
taria
t of
Hea
lth
INE
0
00
00
76
DP
T im
mun
izat
ion
cove
rage
Th
e nu
mbe
r of t
hird
dos
es o
f DP
T va
ccin
e gi
ven
to c
hild
ren
youn
ger t
han
12 m
onth
s of
age
.
Sec
reta
riat o
f H
ealth
IN
E
9496
9592
95
77
Pre
vale
nce
of m
alnu
tritio
n in
chi
ldre
n un
der 5
Th
e pr
opor
tion
of c
hild
ren
unde
r 5 d
efin
ed a
s m
alno
uris
hed
acco
rdin
g to
the
heig
ht/a
ge in
dex
at a
giv
en m
omen
t ove
r the
tota
l num
ber o
f chi
ldre
n un
der 5
.
Sec
reta
riat o
f H
ealth
IN
E
1815
1210
10
78
Mal
aria
inci
denc
e Th
e nu
mbe
r of n
ew m
alar
ia c
ases
occ
urrin
g in
a s
peci
fic p
lace
and
dur
ing
a sp
ecifi
c pe
riod.
Sec
reta
riat o
f H
ealth
IN
E
6.85
4.53
3.21
2.16
2.16
79
Cha
gas
dise
ase
inci
denc
e Th
e nu
mbe
r of n
ew c
haga
s di
seas
e ca
ses
occu
rrin
g in
a s
peci
fic p
lace
and
dur
ing
a sp
ecifi
c pe
riod.
Sec
reta
riat o
f H
ealth
IN
E
0.01
00.
010
0.01
00.
040
0.04
0
80
Den
gue
inci
denc
e Th
e nu
mbe
r of n
ew d
engu
e ca
ses
occu
rrin
g in
a s
peci
fic p
lace
and
dur
ing
a sp
ecifi
c pe
riod.
Sec
reta
riat o
f H
ealth
IN
E
2.07
1.5
4.01
1.77
1.73
81
Tube
rcul
osis
inci
denc
e Th
e nu
mbe
r of n
ew tu
berc
ulos
is c
ases
occ
urrin
g in
a s
peci
fic p
lace
and
dur
ing
a sp
ecifi
c pe
riod.
Sec
reta
riat o
f H
ealth
IN
E
65.8
70.8
55.5
4848
82
AID
S in
cide
nce
The
num
ber o
f new
AID
S ca
ses
occu
rring
in a
spe
cific
pla
ce a
nd d
urin
g a
spec
ific
perio
d.
Sec
reta
riat o
f H
ealth
IN
E
0.16
0.16
0.15
0.18
0.17
83
Num
ber o
f hea
lth c
ente
rs in
rura
l are
as
- FH
IS
824
964
989
1033
1033

xv
ii
APP
END
IX B
2. I
NTE
RM
EDIA
TE P
RSP
IND
ICA
TOR
S H
isto
rical
ser
ies
No.
N
ame
of In
dica
tor
Des
crip
tion
Res
pons
ible
20
00
2001
20
02
2003
Se
p. 2
004
84
Num
ber o
f hea
lth c
ente
rs in
urb
an a
reas
. -
FHIS
28
924
925
125
125
1
85
Hos
pita
l bed
cov
erag
e Th
e av
erag
e nu
mbe
r of b
eds
avai
labl
e pe
r 1,0
00 in
habi
tant
s of
the
popu
latio
n, d
urin
g a
give
n ye
ar, i
n a
give
n co
untry
, ter
ritor
y or
geo
grap
hic
area
.
Sec
reta
riat o
f H
ealth
IN
E
0.64
0.65
0.61
0.64
0.64
86
Phy
sici
an c
over
age
The
ratio
for a
giv
en y
ear b
etw
een
the
refe
renc
e po
pula
tion
and
the
tota
l num
ber o
f ph
ysic
ians
.
Sec
reta
riat o
f H
ealth
IN
E
0.22
0.21
0.26
0.24
0.24
87
Pro
fess
iona
l nur
se c
over
age
Th
e ra
tio fo
r a g
iven
yea
r bet
wee
n th
e re
fere
nce
popu
latio
n an
d th
e to
tal n
umbe
r of
nurs
es.
Sec
reta
riat o
f H
ealth
IN
E
0.11
0.11
0.13
0.12
0.12
INFR
AS
TRU
CTU
RE
IND
ICA
TOR
S 88
N
umbe
r of e
lect
rifie
d dw
ellin
gs
Num
ber o
f dw
ellin
gs th
at h
ave
rece
ived
a c
onne
ctio
n to
the
elec
trici
ty n
etw
ork.
E
NE
E
1,20
6,10
11,
235,
5 291,
263,
3 041,
299,
0 211,
322,
814
89
Num
ber o
f rec
ipie
nts
of e
lect
ricity
ne
twor
k se
rvic
es.
N
umbe
r ben
efiti
ng fr
om c
onne
ctio
n to
the
elec
trici
ty n
etw
ork.
E
NE
E
661,
973
710,
124
759,
586
806,
563
842,
797
90
Cov
erag
e in
dex
(%)
Ele
ctric
ity c
over
age
inde
x na
tionw
ide.
E
NE
E
54.9
57.5
60.1
62.1
63.
71
91
Cos
t of a
loca
l tel
epho
ne c
all
Ave
rage
cos
t of a
loca
l cal
l (ra
te p
er m
inut
e) fo
r com
mer
cial
and
resi
dent
ial s
ervi
ces.
H
ON
DU
TEL-
CO
NAT
EL
0.02
30.
022
0.02
10.
020
0.01
9
92
% o
f roa
d ne
twor
k be
ing
mai
ntai
ned
P
erce
ntag
e of
kilo
met
ers
of ro
ad n
etw
ork
rece
ivin
g ro
utin
e m
aint
enan
ce.
Fo
ndo
Via
l/SO
PTR
AV
I 21
.03%
33.7
2%42
.18%
49.9
8%50
.49%
93
% o
f roa
d ne
twor
k re
habi
litat
ed
Per
cent
age
of k
ilom
eter
s of
the
road
net
wor
k re
habi
litat
ed.
Fo
ndo
Via
l/SO
PTR
AV
I 0
4.19
%0.
33%
0.84
%0.
59%
94
Num
ber o
f mic
ro-e
nter
pris
es w
orki
ng o
n ro
ad m
aint
enan
ce
Fo
ndo
Via
l 23
3648
5050
95
Kilo
met
ers
of ro
adw
ay c
onst
ruct
ed b
y th
e w
orkf
orce
.
Kilo
met
ers
of ro
adw
ay b
uilt
by th
e w
orkf
orce
that
are
not
par
t of t
he o
ffici
al ro
ad
netw
ork.
S
OP
TRA
VI
-96
148
291
225
96
% o
f the
road
net
wor
k w
ith c
ateg
ory
impr
ovem
ents
P
erce
ntag
e of
kilo
met
ers
of th
e ro
ad n
etw
ork
with
cat
egor
y ch
ange
s.
Fond
o V
ial/S
OP
TRA
VI
--
--
5.80
%
EN
VIR
ON
ME
NT
IND
ICA
TOR
S 97
N
umbe
r of U
MA
s cr
eate
d
Num
ber o
f UM
As
crea
ted.
S
ER
NA
(SG
A)
-22
526
027
227
4
98
Num
ber o
f UM
As
prom
oted
N
umbe
r of U
MA
s pr
omot
ed.
SE
RN
A (S
GA)
-
200
217
231
237
99
Num
ber o
f UM
As
cons
olid
ated
N
umbe
r of U
MA
s co
nsol
idat
ed.
SE
RN
A (S
GA)
-
13
37
100
Num
ber o
f UM
As
stre
ngth
ened
N
umbe
r of U
MA
s st
reng
then
ed.
SE
RN
A (S
GA)
-
102
163
188
192
101
Air
pollu
tion
in u
rban
cen
ters
To
tal P
artic
les
in S
uspe
nsio
n (T
PS
) S
ER
NA
(CE
SC
CO
)66
8.7
739.
2-
708.
0-
IND
ICA
TOR
S F
OR
SU
STA
INA
BIL
ITY
AN
D G
OO
D G
OV
ERN
AN
CE
102
Fina
ncia
l equ
ilibriu
m
Rel
atio
nshi
p be
twee
n to
tal m
unic
ipal
inco
me
and
spen
ding
. A
llow
s ve
rific
atio
n of
co
mpl
ianc
e w
ith A
rticl
e 17
8 of
the
Reg
ulat
ions
of t
he M
unic
ipal
ities
Law
, whi
ch
indi
cate
s th
at th
e sp
endi
ng b
udge
t will
be
base
d on
inco
min
g re
venu
es, a
nd a
stri
ct
equi
libriu
m w
ill b
e m
aint
aine
d be
twee
n th
ese.
SG
J -
-10
2.16
103.
84-
103
Fina
ncia
l aut
onom
y D
efin
ed a
s th
e qu
otie
nt b
etw
een
the
mun
icip
ality
’s o
wn
inco
me
and
tota
l inc
ome,
de
mon
stra
ting
the
degr
ee o
f aut
onom
y ac
hiev
ed.
S
GJ
--
58.2
463
.28
-

xv
iii
APP
END
IX B
2. I
NTE
RM
EDIA
TE P
RSP
IND
ICA
TOR
S H
isto
rical
ser
ies
No.
N
ame
of In
dica
tor
Des
crip
tion
Res
pons
ible
20
00
2001
20
02
2003
Se
p. 2
004
104
Ope
ratio
nal c
osts
as
a %
of c
urre
nt
reve
nues
Cal
cula
ted
as th
e qu
otie
nt b
etw
een
oper
atio
nal c
osts
and
cur
rent
inco
me.
Hel
ps
dete
ct w
hich
mun
icip
aliti
es a
re c
ompl
ying
with
the
requ
irem
ent e
stab
lishe
d in
Arti
cle
98, r
efor
med
by
Dec
ree
127-
2000
, of t
he M
unic
ipal
ities
Law
. Th
is a
rticl
e sp
ecifi
es
that
ope
ratio
nal c
osts
mus
t not
exc
eed
limits
of 4
0%-6
5% o
f the
per
iod’
s cu
rrent
in
com
e.
SG
J -
-88
.54
74.4
5-
109
Fina
ncia
l cap
acity
D
efin
ed a
s th
e m
unic
ipal
ity’s
cap
acity
to fa
ce it
s cu
rren
t cos
ts w
ith re
sour
ces
that
it
perio
dica
lly c
olle
cts
with
in it
s ju
risdi
ctio
n (o
wn
inco
me)
. If
the
indi
cato
r is
very
low
, de
pend
ency
is h
igh.
S
GJ
--
125.
2014
1.76
-
110
Per
cent
age
of re
venu
es fr
om tr
ansf
ers
of
tota
l mun
icip
al in
com
e.
Mea
sure
s th
e de
gree
of f
inan
cial
dep
ende
ncy
upon
the
cent
ral g
over
nmen
t. T
he
clos
er to
100
%, t
he g
reat
er th
e fin
anci
al d
epen
denc
y an
d lo
wer
the
degr
ee o
f au
tono
my.
S
GJ
--
16.0
118
.47
-
111
Loca
l tax
pre
ssur
e D
efin
ed a
s th
e qu
otie
nt b
etw
een
the
loca
l gov
ernm
ent’s
con
solid
ated
tax
reve
nues
an
d th
e G
DP
.
SG
J -
-1.
181.
06-
IND
ICA
TOR
S F
OR
VU
LNE
RA
BLE
GR
OU
PS
112
Num
ber o
f rep
orte
d ca
ses
of w
omen
who
ha
ve b
een
the
vict
ims
of p
sych
olog
ical
vi
olen
ce w
ithin
the
hom
e.
IN
AM
5,
560
6,67
58,
435
10,0
37-
113
Num
ber o
f rep
orte
d ca
ses
of w
omen
who
ha
ve b
een
the
vict
ims
of s
exua
l vio
lenc
e in
the
hom
e.
IN
AM
40
060
056
095
8-
114
Num
ber o
f soc
ially
at-r
isk
child
ren
atte
nded
by
the
INH
FA.
INH
FA
--
2,58
95,
261
2,25
4
115
Num
ber o
f pub
lic c
ente
rs p
rovi
ding
car
e to
soc
ially
at-r
isk
child
ren.
INH
FA
--
55
5
116
Num
ber o
f anc
estra
l titl
es le
galiz
ed.
Ti
tles
deliv
ered
to e
thni
c gr
oups
IN
AM
-
-4
161
(*
) Dat
a fro
m th
e 19
97 S
tudy
(UM
CE
). N
o st
udy
was
con
duct
ed in
200
0.

xi
x
APP
END
IX C
PR
OG
RES
S M
ATR
IX O
F TH
E PR
SP P
OLI
CY
MEA
SUR
ES
OB
JEC
TIVE
S PO
LIC
Y M
EASU
RES
O
rigin
al
Impl
emen
tatio
n D
ate
Cur
rent
Sta
tus
I. A
CC
ELE
RA
TIN
G E
QU
ITA
BLE
AN
D S
US
TAIN
AB
LE G
RO
WTH
1.1
MA
CR
OEC
ON
OM
IC F
RAM
EWO
RK
FO
R P
OVE
RTY
RED
UC
TIO
N A
ND
GR
OW
TH
II.
Shor
t-Ter
m P
olic
y G
uide
lines
i. C
reat
e m
ediu
m-te
rm fi
scal
via
bilit
y th
at in
turn
pe
rmits
gre
ater
soc
ial s
pend
ing.
20
01
The
fisca
l def
icit
is s
how
ing
a do
wnw
ard
trend
, dr
oppi
ng f
rom
5.9
% o
f th
e G
DP
in
2001
to 5
.3%
in 2
002.
It i
s ex
pect
ed th
at in
200
4 th
e C
entra
l Gov
ernm
ent d
efic
it w
ill
be 3
.5%
of t
he G
DP
.
ii.
Mak
e th
e m
onet
ary
and
cred
it va
riabl
es
cong
ruen
t w
ith t
he e
cono
mic
gro
wth
obj
ectiv
es a
nd
low
infla
tion
rate
s.
2001
Th
e cr
edit
inte
rest
rat
es h
ave
drop
ped
2.6
poin
ts in
rea
l ter
ms,
from
14.
4% in
200
1 to
11.
8% in
200
4.
Sim
ilarly
, th
e in
flatio
n ha
s be
en f
allin
g in
the
200
1-20
03 p
erio
d: 8
.8%
, 8.
1% a
nd
6.8%
, res
pect
ivel
y.
iii.
Con
tinue
stre
ngth
enin
g th
e fin
anci
al s
yste
m
as a
n es
sent
ial e
lem
ent
for
mac
roec
onom
ic s
tabi
lity
and
long
-term
gro
wth
.
2001
C
onso
lidat
ed s
uper
visi
on a
nd c
apita
l adj
ustm
ent n
orm
s im
plem
ente
d by
the
CN
BS
. C
apita
l adj
ustm
ent i
ndex
gre
ater
than
min
imum
requ
ired:
12.
9% in
200
1 an
d 13
.0%
in
200
4
iv.
Impr
ove
the
exte
rnal
se
ctor
ba
lanc
es
and
cont
inue
man
agin
g th
e fo
reig
n de
bt p
rude
ntly
20
01
In fu
lfillm
ent o
f the
Pub
lic C
redi
t Law
G
row
th is
dem
onst
rate
d in
the
conc
essi
onar
y de
bt le
vel r
elat
ive
to th
e to
tal f
orei
gn
debt
, fro
m 7
3.3%
in 2
002
to 7
4.8%
in 2
003.
It
is e
stim
ated
that
the
conc
essi
onar
y de
bt le
vel f
or 2
004
will
reac
h ab
out 7
5% o
f the
tota
l for
eign
deb
t. v.
C
ontin
ue m
akin
g st
ruct
ural
refo
rms.
20
01
App
licat
ion
of ta
x re
form
law
s
(A W
orld
Ban
k st
udy
conf
irmed
tha
t th
e ta
x m
easu
res
unde
rtake
n te
nd t
o be
pr
ogre
ssiv
e, i.
e. th
e ta
x bu
rden
falls
prim
arily
on
the
non-
poor
).
III.
Med
ium
-Ter
m P
olic
y G
uide
lines
i. S
treng
then
fisc
al in
com
e.
2002
– 2
015
App
licat
ion
of t
he F
EN
IX b
ank
colle
ctio
n sy
stem
; el
ectro
nic
decl
arat
ion
of D
ET
tribu
tes;
A
pplic
atio
n of
the
Fina
ncia
l Equ
ilibr
ium
and
Tax
Equ
ity L
aw
ii.
Rat
iona
lize
publ
ic s
pend
ing,
with
a p
riorit
y on
sp
endi
ng o
n po
verty
redu
ctio
n pr
ogra
ms.
20
02 –
201
5 A
pplic
atio
n of
the
Law
on
Reo
rder
ing
of th
e C
entra
l Gov
ernm
ent S
alar
y S
yste
m a
nd
Rat
iona
lizat
ion
of P
ublic
Fin
ance
s.
Gro
win
g ev
olut
ion
of p
over
ty s
pend
ing:
7.8
% o
f the
GD
P in
200
3, 8
.1%
in 2
004.
R
efor
ms
wer
e ap
prov
ed t
o th
e P
over
ty R
educ
tion
Fund
Law
and
the
Pov
erty
M
anag
emen
t Law
was
app
rove
d, a
s w
as th
e O
rgan
ic B
udge
t Law
iii.
Ach
ieve
su
stai
nabl
e le
vels
of
ex
tern
al
finan
cing
, lim
iting
th
e flo
ws
to
dona
tions
an
d co
nces
sion
ary
loan
s.
2002
- 20
15
Cur
rent
Net
Val
ue o
f the
fore
ign
publ
ic d
ebt a
s %
of t
he G
DP
has
sho
wn
a te
nden
cy
to d
rop,
falli
ng fr
om 5
0.3%
in 2
001
to 4
5.0%
in 2
004.
iv.
Mai
ntai
n in
flatio
n at
in
tern
atio
nal
leve
ls
thro
ugh
effe
ctiv
e m
onet
ary
cont
rol,
impr
ovem
ent
of
publ
ic fi
nanc
es a
nd a
refo
rm to
the
sala
ry p
olic
y.
2002
- 20
15
Mon
etar
y P
olic
y ge
ared
to
achi
evin
g pr
ice
stab
ility
. I
nfla
tion
tend
ed t
o dr
op in
the
20
01-2
003
perio
d, f
rom
8.8
% t
o 8.
1% t
o 6.
8%,
resp
ectiv
ely.
Th
e G
over
nmen
t’s
colle
ctio
n le
vels
hav
e im
prov
ed, a
nd ta
x pr
essu
re m
oved
from
16.
2% o
f the
GD
P to
17
.5%
. Th
e La
w to
Reo
rder
the
Cen
tral G
over
nmen
t Sal
ary
Sys
tem
was
app
rove
d.
v.
Cre
ate
a so
lid
and
com
petit
ive
finan
cial
sy
stem
that
sup
ports
eco
nom
ic g
row
th.
2002
- 20
15
The
Fina
ncia
l Sys
tem
Law
was
app
rove
d, to
geth
er w
ith r
efor
ms
to th
e La
ws
of th
e B
CH
, CN
BS
and
FO
SE
DE
Obj
ectiv
e:
Cre
ate
a st
able
mac
roec
onom
ic
fram
ewor
k th
at c
an h
elp
mak
e gr
eate
r sus
tain
ably
via
ble
publ
ic in
vest
men
t in
pove
rty
redu
ctio
n pr
ogra
ms
and
proj
ects
and
can
gen
erat
e co
nfid
ence
and
cer
tain
ty fo
r pr
ivat
e in
vest
men
t.
vi.
Cre
ate
the
cond
ition
s th
at
stim
ulat
e co
mpe
titiv
enes
s ba
sed
on t
effi
cien
t an
d pr
oduc
tive
inve
stm
ent
2002
- 20
15
The
Nat
iona
l Com
petit
iven
ess
Pro
gram
is c
urre
ntly
bei
ng im
plem
ente
d.

xx
APP
END
IX C
PR
OG
RES
S M
ATR
IX O
F TH
E PR
SP P
OLI
CY
MEA
SUR
ES
OB
JEC
TIVE
S PO
LIC
Y M
EASU
RES
O
rigin
al
Impl
emen
tatio
n D
ate
Cur
rent
Sta
tus
1.2.
STR
ENG
THEN
ING
INVE
STM
ENT
AN
D E
MPL
OYM
ENT
GEN
ERA
TIO
N
i. R
educ
e th
e co
sts
invo
lved
in e
stab
lishi
ng n
ew
inve
stm
ents
. 20
02 -
2015
Th
e A
dmin
istra
tive
Sim
plifi
catio
n La
w is
bei
ng im
plem
ente
d
ii.
Cre
ate
the
cond
ition
s th
at p
erm
it in
crea
sed
qual
ity i
n em
ploy
men
t, w
ith s
ubst
antia
l in
crea
ses
in
prod
uctiv
ity a
nd in
crea
sed
real
inco
me
for w
orke
rs
2002
Th
e N
atio
nal C
ompe
titiv
enes
s P
rogr
am is
bei
ng im
plem
ente
d.
Sev
eral
indu
stria
l com
pani
es h
ave
been
cer
tifie
d th
roug
h C
OH
CIT
in IS
O 9
000
and
ISO
140
00A
qua
lity
norm
s.
Ref
orm
s w
ere
appr
oved
to th
e La
bor C
ode
(Dec
ree
32-2
003)
La
bor
Inte
nsiv
e pr
ogra
ms
have
be
en
crea
ted
to
fost
er
empl
oym
ent
such
as
: H
ousi
ng fo
r Peo
ple,
maj
or in
frast
ruct
ure
proj
ects
, rur
al ro
ad m
aint
enan
ce, e
tc.
iii.
Pro
mot
e gr
eate
r pa
rtici
patio
n by
pr
ivat
e ca
pita
l in
the
prov
isio
n of
pub
lic s
ervi
ces.
20
01 -
2015
Th
e w
ay w
as o
pene
d to
the
par
ticip
atio
n of
priv
ate
capi
tal
in t
elep
hone
ser
vice
pr
ovis
ion
in th
e fra
mew
ork
of th
e Te
leph
ones
for
Eve
ryon
e M
oder
nity
for
Hon
dura
s pr
ogra
m.
iv.
Cor
rect
th
e pr
oble
ms
of
prop
erty
an
d in
vest
men
t in
secu
rity
thro
ugh
resp
ect
for
and
appl
icat
ion
of th
e la
w.
2001
- 20
15
The
prop
erty
law
was
app
rove
d.
Obj
ectiv
e S
treng
then
inve
stm
ent l
evel
s an
d im
prov
e th
eir e
ffici
ency
le
vel a
s a
basi
s fo
r inc
reas
ing
job
oppo
rtuni
ties
and
impr
ovin
g th
eir q
ualit
y.
v.
Pro
mot
e an
d pr
otec
t co
mpe
titio
n in
th
e m
arke
ts.
2002
A
ppro
val i
s be
ing
soug
ht fo
r the
Law
to P
rom
ote
and
Pro
tect
Com
petit
ion
1.3
IMPR
OVI
NG
CO
MPE
TITI
VE A
CC
ESS
TO IN
TER
NA
TIO
NA
L M
AR
KET
S
i. S
treng
then
H
ondu
ras’
pa
rtici
patio
n in
th
e C
entra
l Am
eric
an in
tegr
atio
n sc
hem
e.
2001
- 20
15
The
actio
ns n
eede
d to
uni
fy th
e cu
stom
s po
sts
and
liber
aliz
e m
igra
tory
mov
emen
t w
ith b
orde
ring
neig
hbor
cou
ntrie
s ar
e be
ing
deve
lope
d, w
hich
impl
ies
a si
gnifi
cant
ad
vanc
e to
war
d th
e co
nsol
idat
ion
of th
e C
usto
ms
Uni
on, a
fund
amen
tal f
acto
r in
the
Cen
tral A
mer
ican
eco
nom
ic in
tegr
atio
n pr
oces
s.
App
roxi
mat
ely
80%
of t
he d
uty
fract
ions
con
tain
ed in
the
Cen
tral A
mer
ican
Dut
y S
yste
m h
ave
been
har
mon
ized
. ii.
Im
plem
ent
the
Free
Tra
de A
gree
men
t w
ith
Mex
ico
and
the
Dom
inic
an R
epub
lic a
nd c
ulm
inat
e th
e ne
gotia
tions
with
Pan
ama,
Chi
le a
nd C
anad
a.
2001
- 20
15
A li
st o
f pro
duct
s of
nat
iona
l int
eres
t was
pre
sent
ed to
the
Gov
ernm
ent o
f Mex
ico
in
orde
r to
spe
ed u
p th
e du
ty l
ower
ing
proc
ess.
W
ith r
espe
ct t
o th
e D
omin
ican
R
epub
lic,
the
agre
emen
ts f
or t
he r
ules
of
orig
in r
efer
ring
to t
extil
es a
nd g
arm
ents
w
ere
reaf
firm
ed.
Impo
rtant
pro
gres
s ha
s be
en m
ade
in th
e fre
e tra
de a
gree
men
ts
with
Can
ada
and
Chi
le.
Obj
ectiv
e P
rom
ote
grea
ter a
cces
s fo
r na
tiona
l pro
duct
s to
bot
h ne
w
and
tradi
tiona
l exp
ort m
arke
ts
in c
ompe
titiv
e co
nditi
ons.
iii.
Cre
ate
the
cond
ition
s th
at
will
pe
rmit
expa
nded
and
com
petit
ive
parti
cipa
tion
by H
ondu
ras
in n
ew e
xpor
t mar
kets
.
2001
- 20
15
the
CA
FTA
neg
otia
tions
wer
e co
nclu
ded
The
Nat
iona
l Qua
lity
Cou
ncil
was
cre
ated
1.4
DEV
ELO
PMEN
T O
F SE
CTO
RS
OF
HIG
H P
RO
DU
CTI
VE A
ND
EM
PLO
YMEN
T PO
TEN
TIA
L
i. C
reat
e th
e N
atio
nal C
ompe
titiv
enes
s C
ounc
il w
ith p
artic
ipat
ion
by th
e pu
blic
and
priv
ate
sect
ors.
20
02
The
Nat
iona
l Com
petit
iven
ess
Com
mis
sion
was
cre
ated
. O
bjec
tive
Cre
ate
the
cond
ition
s th
at
faci
litat
e th
e de
velo
pmen
t of
sect
ors
with
hig
h pr
oduc
tive
pote
ntia
l, w
ithou
t neg
lect
ing
ii.
Def
ine
a st
rate
gy o
f pro
duct
ive
chai
ns fo
r th
e de
velo
pmen
t of c
lust
ers,
incl
udin
g sm
all a
nd m
ediu
m
busi
ness
es a
t bot
h th
e ve
rtica
l and
hor
izon
tal l
evel
s.
2001
- 20
15
The
Pol
icy
of S
uppo
rt to
the
Com
petit
iven
ess
of th
e M
IPYM
E w
as a
ppro
ved

xx
i
APP
END
IX C
PR
OG
RES
S M
ATR
IX O
F TH
E PR
SP P
OLI
CY
MEA
SUR
ES
OB
JEC
TIVE
S PO
LIC
Y M
EASU
RES
O
rigin
al
Impl
emen
tatio
n D
ate
Cur
rent
Sta
tus
iii.
Stre
ngth
en th
e de
velo
pmen
t of a
grib
usin
ess
2001
- 20
15
The
Nat
iona
l Agr
ibus
ines
s P
rom
otio
n C
ente
r was
est
ablis
hed
iv.
Pro
mot
e th
e de
velo
pmen
t of
th
e fo
rest
ry
clus
ter.
2001
- 20
15
Bus
ines
ses
are
bein
g ce
rtifie
d in
ratio
nal f
ores
t exp
loita
tion.
v.
Def
ine
and
impl
emen
t a
stra
tegy
to
achi
eve
grea
ter d
evel
opm
ent o
f lig
ht a
ssem
bly
2001
- 20
15
Und
erw
ay
supp
ort t
o th
e tra
ditio
nal
econ
omic
sec
tors
.
vi.
Stre
ngth
en
the
deve
lopm
ent
of
the
tour
ist
sect
or
2001
- 20
15
The
actio
ns n
eede
d fo
r de
velo
ping
the
first
Inte
gral
ly P
lann
ed T
ouris
t Cen
ter
(CIP
) w
ere
carr
ied
out
in t
he B
ahía
de
Tela
Reg
ion,
by
whi
ch i
t is
hop
ed t
hat
a co
mpr
ehen
sive
tour
ist c
lust
er w
ill b
e cr
eate
d.
The
tour
ist i
nves
tmen
t fun
d w
as c
reat
ed w
ith p
artic
ipat
ion
by th
e pr
ivat
e se
ctor
, the
go
vern
men
t and
fore
ign
inve
stm
ent.
II.
RE
DU
CIN
G P
OV
ER
TY IN
TH
E R
UR
AL
ZON
ES
2.1
IMPR
OVI
NG
EQ
UIT
Y AN
D S
ECU
RIT
Y IN
LA
ND
AC
CES
S
i. M
ake
effe
ctiv
e th
e ap
plic
atio
n of
gro
unds
for
af
fect
ing
idle
land
s an
d th
ose
abov
e th
e ce
iling
. 20
02 –
201
5
In p
roce
ss
ii.
Stre
ngth
en
the
prog
ram
s of
ad
judi
catio
n,
titlin
g an
d in
dem
nific
atio
n of
land
s, e
spec
ially
in t
he
refo
rmed
se
ctor
an
d w
ith
ethn
ic
grou
ps
and
inde
pend
ent p
easa
nts.
2001
– 2
015
25,1
32 p
rope
rty t
itles
hav
e be
en d
eliv
ered
thr
ough
200
4, b
enef
iting
629
pro
duce
rs
of th
e re
form
ed s
ecto
r, 24
,482
inde
pend
ents
and
21
ethn
ic g
roup
s.
Obj
ectiv
e G
uara
ntee
acc
ess
and
secu
rity
in la
nd te
nure
to o
rgan
ized
and
in
depe
nden
t pea
sant
s an
d to
th
e et
hnic
gro
ups.
iii.
Dev
elop
an
d im
plem
ent
mec
hani
sms
that
pe
rmit
clea
r de
limita
tion
and
secu
rity
of
rura
l pr
oper
ty.
2001
– 2
015
The
Pro
perty
Law
, w
hich
inc
lude
s th
e cr
eatio
n of
the
Pro
perty
Ins
titut
e, w
as
appr
oved
on
May
28
of th
is y
ear.
2.2
SUST
AIN
AB
LE D
EVEL
OPM
ENT
IN P
RIO
RIT
Y ZO
NES
i. C
onso
lidat
e an
d ex
pand
th
e N
atio
nal
Sus
tain
able
R
ural
D
evel
opm
ent
Pro
gram
(P
RO
NA
DE
RS
).
2001
– 2
015
21
proj
ects
w
ere
impl
emen
ted
unde
r P
RO
NA
DE
RS
, w
hich
pr
imar
ily
atte
nds
prod
ucer
s on
slo
ps, h
igh
wat
ersh
eds
and
ethn
ic g
roup
s.
The
rura
l dev
elop
men
t pro
ject
s su
pply
pla
n w
as p
repa
red.
ii.
Incr
ease
the
rur
al d
evel
opm
ent
actio
ns a
nd
thei
r ar
ticul
atio
n to
th
e na
tiona
l ec
onom
y in
th
e co
untry
’s b
orde
r zon
es.
2001
– 2
015
The
Sus
tain
able
Rur
al D
evel
opm
ent
Pro
ject
for
Eco
logi
cally
Fra
gile
Zon
es i
n th
e Tr
ifini
o R
egio
n (P
RO
DE
RT)
is b
eing
dev
elop
ed
iii.
Exp
and
the
train
ing
prog
ram
s on
sus
tain
able
de
velo
pmen
t of s
mal
l agr
ofor
estry
bus
ines
ses
for t
he
poor
pop
ulat
ion
livin
g in
fore
sted
zon
es
2001
– 2
015
App
roxi
mat
ely
300
peop
le h
ave
been
tra
ined
in
issu
es r
elat
ed t
o ag
rofo
rest
ry,
com
mun
ity
fore
stry
(h
uman
de
velo
pmen
t, ag
ro-p
rodu
ctiv
e de
velo
pmen
t, fo
rest
m
anag
emen
t), d
elim
itatio
n of
are
as a
nd p
artic
ipat
ion
in m
anag
emen
t pla
ns.
Obj
ectiv
e A
chie
ve th
e in
tegr
atio
n,
coor
dina
tion
and
sust
aina
bilit
y of
the
actio
ns g
eare
d to
redu
ce
pove
rty in
the
rura
l zon
es.
iv.
Incr
ease
th
e ac
tions
on
be
half
of
the
deve
lopm
ent o
f sm
all-s
cale
act
iviti
es.
2001
– 2
015
50 m
icro
-bus
ines
ses
exis
t in
non-
agric
ultu
ral s
mal
l-sca
le p
roce
ssin
g.

xx
ii
APP
END
IX C
PR
OG
RES
S M
ATR
IX O
F TH
E PR
SP P
OLI
CY
MEA
SUR
ES
OB
JEC
TIVE
S PO
LIC
Y M
EASU
RES
O
rigin
al
Impl
emen
tatio
n D
ate
Cur
rent
Sta
tus
2.3
IMPR
OVI
NG
TH
E C
OM
PETI
TIVE
NES
S O
F TH
E R
UR
AL
SMA
LL E
CO
NO
MY
i. P
rom
ote
the
deve
lopm
ent o
f agr
o-fo
od
chai
ns.
2001
– 2
015
6 ag
ro-fo
od
chai
ns
have
be
en
esta
blis
hed:
da
iry,
Afri
can
palm
, ho
rticu
lture
, ap
icul
ture
, pig
and
cat
tle.
The
Nat
iona
l Agr
ibus
ines
s P
rom
otio
n C
ente
r was
est
ablis
hed
Obj
ectiv
e
Incr
ease
pro
duct
ion
and
impr
ove
the
effic
ienc
y an
d co
mpe
titiv
enes
s of
sm
all r
ural
pr
oduc
ers.
O
bjec
tive
Incr
ease
pro
duct
ion
and
impr
ove
the
effic
ienc
y an
d co
mpe
titiv
enes
s of
sm
all r
ural
pr
oduc
ers.
ii.
Impr
ove
the
acce
ss o
f sm
all a
nd m
ediu
m
prod
ucer
s to
bas
ic s
uppo
rt se
rvic
es fo
r th
e de
velo
pmen
t of t
heir
econ
omic
ac
tiviti
es.
2001
– 2
015
Alte
rnat
ive
Rur
al F
inan
cial
Sys
tem
s (S
IFA
Rs)
hav
e be
en e
stab
lishe
d an
d st
reng
then
ed
PA
CTA
. In
corp
orat
ion
of a
roun
d 23
,000
ha
into
the
irrig
atio
n sy
stem
, is
bein
g de
velo
ped
Epi
dem
iolo
gica
l and
ani
mal
hea
lth m
onito
ring
syst
ems
have
bee
n im
plem
ente
d.
2.4
IMPR
OVI
NG
SO
CIA
L C
ON
DIT
ION
S IN
TH
E R
UR
AL
AR
EA
i. S
uppo
rt th
e ru
ral h
ousi
ng p
rogr
ams
that
in
clud
e th
e di
rect
par
ticip
atio
n of
the
bene
ficia
ries
and
finan
cial
sup
port
of th
e G
over
nmen
t, as
wel
l as
the
parti
cipa
tion
of L
ocal
gov
ernm
ents
and
NG
Os
in
the
cons
truct
ion
of ru
ral h
ousi
ng.
2001
– 2
015
Hab
itatio
ns s
olut
ions
are
bei
ng p
rovi
ded
thro
ugh
the
Foun
datio
n fo
r U
rban
and
R
ural
Soc
ial H
ousi
ng.
Dat
a on
hab
itatio
n so
lutio
ns a
nd b
enef
icia
ries
is p
endi
ng.
ii.
Exp
and
the
cove
rage
of t
he d
rinki
ng w
ater
an
d ba
sic
sani
tatio
n sy
stem
s.
2001
– 2
015
Drin
king
wat
er a
nd s
anita
tion
syst
ems
in t
he a
mou
nt o
f L
350.
8 m
illio
n ha
ve b
een
built
, ben
efiti
ng 8
94,0
00 in
habi
tant
s of
the
rura
l zon
e.
iii.
Inco
rpor
ate
the
prom
otio
n of
pro
duct
ive
hom
este
ad a
nd fo
od c
onse
rvat
ion
activ
ities
im
plem
ente
d by
pea
sant
wom
en in
to F
HIS
and
P
RA
F pr
ogra
ms.
2001
– 2
015
To d
ate,
app
roxi
mat
ely
5,00
0 w
omen
hav
e be
nefit
ed fr
om th
ese
activ
ities
.
Obj
ectiv
e S
treng
then
the
soci
al
infra
stru
ctur
e an
d ex
pand
the
cove
rage
of p
over
ty a
llevi
atio
n pr
ogra
ms
in th
e ru
ral z
ones
w
ith th
e gr
eate
st in
cide
nce
of
pove
rty.
iv.
Impr
ove
the
coor
dina
tion
of fo
od a
nd in
put
dona
tions
to s
uppo
rt th
e im
plem
enta
tion
of s
mal
l pr
oduc
tive
proj
ects
and
com
mun
ity w
orks
.
2001
– 2
015
The
Food
Sec
urity
Pla
n w
as d
rafte
d, w
hich
inc
lude
s co
ordi
natio
n le
vels
for
foo
d do
natio
ns.
III.
RE
DU
CIN
G U
RB
AN
PO
VE
RTY
3.1
STI
MU
LATI
NG
TH
E D
EVEL
OPM
ENT
OF
MIC
RO
, SM
ALL
AN
D M
EDIU
M B
USI
NES
S
i. S
treng
then
the
publ
ic a
nd p
rivat
e en
titie
s th
at
prov
ide
assi
stan
ce
to
mic
ro,
smal
l an
d m
ediu
m
busi
ness
.
2001
-201
5 Th
e S
uppo
rt P
rogr
am t
o th
e P
rodu
ctiv
e S
ecto
r an
d S
mal
l E
nter
pris
e is
bei
ng
impl
emen
ted.
A
bus
ines
s de
velo
pmen
t fun
d an
d an
impa
ct e
valu
atio
n sy
stem
are
bei
ng d
esig
ned,
al
l fra
med
in th
e C
ompe
titiv
enes
s P
olic
y.
Obj
ectiv
e S
uppo
rt th
e gr
owth
an
d co
mpe
titiv
enes
s of
mic
ro, s
mal
l an
d m
ediu
m
busi
ness
as
em
ploy
men
t an
d in
com
e ge
nera
ting
sour
ces
for
poor
fa
mili
es.
ii.
Sup
port
alte
rnat
ive
mod
aliti
es o
f sav
ings
and
cr
edit
with
the
parti
cipa
tion
of th
e be
nefic
iarie
s.
2001
-201
5 P
rogr
ams
and
proj
ects
in t
he c
ateg
orie
s of
sho
es,
met
al-m
echa
nics
, ag
roin
dust
ry,
trans
form
atio
n of
lum
ber,
text
iles
and
garm
ents
are
bei
ng i
mpl
emen
ted,
tog
ethe
r w
ith p
rodu
ctio
n, c
omm
erci
aliz
atio
n an
d tra
nsfo
rmat
ion
of g
oods
and
ser
vice
s.
SIC
, C
OH
EP
, FO
DE
SS
E, P
RE
FES
S II
and
CO
DE
SS
ES
are
par
ticip
atin
g.

xx
iii
APP
END
IX C
PR
OG
RES
S M
ATR
IX O
F TH
E PR
SP P
OLI
CY
MEA
SUR
ES
OB
JEC
TIVE
S PO
LIC
Y M
EASU
RES
O
rigin
al
Impl
emen
tatio
n D
ate
Cur
rent
Sta
tus
iii.
Stim
ulat
e th
e em
erge
nce
of y
oung
bu
sine
sspe
ople
, inc
orpo
ratin
g fo
rmat
ion
in p
roje
ct
desi
gn a
nd a
dmin
istra
tion
in th
e di
ffere
nt
educ
atio
nal m
odal
ities
and
leve
ls a
nd p
rovi
ding
fin
anci
ng w
ith fa
vora
ble
cond
ition
s.
2002
-201
5 Th
e C
OH
CU
T Le
arni
ng C
ente
rs a
re u
nder
con
stru
ctio
n.
iv.
Faci
litat
e th
e op
enin
g of
zon
al m
arke
ts a
nd
othe
r cen
ters
for t
he in
stal
latio
n of
sal
es s
talls
for
stre
et v
ende
rs w
ithin
info
rmal
com
mer
ce p
lann
ing
in
the
mun
icip
al s
pher
e.
2002
-201
5 U
nder
way
3.2
DEV
ELO
PMEN
T O
F IN
TER
MED
IAR
Y C
ITIE
S
i. O
rgan
ize
join
t-lia
bilit
y m
arke
ts a
t a re
gion
al
leve
l, pr
efer
ably
thro
ugh
the
asso
ciat
ion
of
mun
icip
aliti
es, g
ener
atin
g cu
rren
ts o
f mut
ually
be
nefic
ial c
omm
erci
al e
xcha
nge.
2002
-201
5 A
bus
ines
s co
nfer
ence
bei
ng p
repa
red
to b
e he
ld i
n S
an P
edro
Sul
a w
ith t
he
MIP
YME
s an
d th
e in
stitu
tions
that
indi
rect
ly s
uppo
rt th
e bu
sine
ss s
ecto
r.
ii.
Pro
mot
e th
e or
gani
zatio
n of
incu
bato
r bu
sine
sses
, con
side
ring
the
pote
ntia
litie
s of
the
inte
rmed
iary
citi
es.
2002
-200
6 Th
at o
f El P
rogr
eso
is in
the
form
atio
n st
age
Obj
ectiv
e P
rom
ote
the
deve
lopm
ent o
f in
term
edia
ry c
ities
, see
king
that
th
ey b
e cr
eate
d in
regi
onal
de
velo
pmen
t pol
es.
iii.
Pro
mot
e in
dust
rial a
ctiv
ity in
inte
rmed
iary
ci
ties.
20
02-2
015
The
Inve
stm
ent D
ecen
traliz
atio
n P
rogr
am is
cur
rent
ly b
eing
neg
otia
ted
3.3
SUPP
OR
T TO
HO
USI
NG
OF
SOC
IAL
INTE
RES
T
i. A
ppro
ve th
e H
ousi
ng S
ecto
r Mod
erni
zatio
n La
w a
nd in
crea
se th
e ef
ficie
ncy
of th
e se
ctor
’s
stan
dard
s en
tity,
with
out l
ettin
g it
dire
ctly
impl
emen
t pr
ojec
ts.
2002
Th
e bi
ll is
bei
ng re
view
ed b
efor
e be
ing
sent
to th
e N
atio
nal C
ongr
ess
ii.
Faci
litat
e ho
usin
g co
nstru
ctio
n or
im
prov
emen
ts fo
r the
low
-inco
me
popu
latio
n.
2001
-201
5 B
eing
impl
emen
ted.
Fun
d-ra
isin
g m
echa
nism
s ar
e be
ing
form
ulat
ed
iii.
Gra
nt ju
dici
al la
nd o
r hou
sing
tenu
re s
ecur
ity,
with
titli
ng m
odal
ities
that
par
ticul
arly
pro
tect
wom
en
and
child
ren.
2001
-201
5 A
ppro
val o
f the
cre
atio
n of
a n
ew P
rope
rty L
aw is
und
erw
ay
Obj
ectiv
e S
timul
ate
the
cons
truct
ion
of
low
-cos
t hou
sing
thro
ugh
lega
l, fin
anci
al a
nd p
artic
ipat
ory
mec
hani
sms.
iv.
Est
ablis
h no
rms
for t
he p
lann
ed d
evel
opm
ent
of h
uman
set
tlem
ents
, obs
ervi
ng ri
sk p
reve
ntio
n.
2002
U
nder
way
, the
re a
re p
ropo
sed
norm
s
3.4
AC
CES
S TO
BA
SIC
SER
VIC
ES IN
PR
IOR
ITY
AR
EAS
i. P
rom
ote
Mun
icip
al D
evel
opm
ent F
unds
for
the
effic
ient
pro
visi
on o
f bas
ic s
ervi
ces
in th
e co
untry
’s m
ain
citie
s.
2002
– 2
005
Pha
se 2
of t
he P
over
ty R
educ
tion
Pro
gram
and
Loc
al D
evel
opm
ent i
s ap
prov
ed fo
r im
plem
enta
tion
by th
e S
ecre
tary
of G
over
nmen
t, of
Jus
tice
and
FHIS
. O
bjec
tive
Impr
ove
the
acce
ss o
f the
in
habi
tant
s of
mar
gina
l urb
an
zone
s to
bas
ic s
ervi
ces.
ii.
P
rom
ote
the
mun
icip
aliz
atio
n of
the
wat
er a
nd
sani
tatio
n sy
stem
s.
2001
Th
e W
ater
and
San
itatio
n La
w is
app
rove
d.

xx
iv
APP
END
IX C
PR
OG
RES
S M
ATR
IX O
F TH
E PR
SP P
OLI
CY
MEA
SUR
ES
OB
JEC
TIVE
S PO
LIC
Y M
EASU
RES
O
rigin
al
Impl
emen
tatio
n D
ate
Cur
rent
Sta
tus
iii.
Adv
ance
alo
ng th
e ch
ain
of d
ecen
traliz
atio
n,
crea
ting
the
cond
ition
s th
at w
ill p
erm
it ef
fect
ive
loca
l pu
blic
ser
vice
pro
visi
on.
2001
201
5 Th
e D
ecen
traliz
atio
n P
rogr
am a
nd P
over
ty R
educ
tion
and
Loca
l D
evel
opm
ent
Pro
gram
are
und
erw
ay.
IV.
INV
ES
TIN
G IN
HU
MA
N C
AP
ITA
L
4.1
GR
EATE
R Q
UA
LITY
AN
D C
OVE
RA
GE
IN B
ASI
C A
ND
TEC
HN
ICA
L-PR
OD
UC
TIVE
ED
UC
ATI
ON
i. C
oncl
ude
the
form
ulat
ion
and
appr
ove
the
Gen
eral
Edu
catio
n Fr
amew
ork
Law
. 20
01
• Th
e bi
ll w
as fo
rmul
ated
and
sen
t to
the
Nat
iona
l Con
gres
s in
Sep
tem
ber 2
001.
ii.
Impr
ove
educ
atio
nal q
ualit
y at
the
vario
us
leve
ls.
2002
-201
5 •
Impl
emen
tatio
n of
the
CN
B in
pre
-bas
ic a
nd b
asic
in 1
6 de
partm
ents
of t
he c
ount
ry
and
the
curr
icul
ar s
essi
on.
• Im
plem
enta
tion
of th
e C
ompr
ehen
sive
Tea
cher
Tra
inin
g P
lan
at th
e na
tiona
l lev
el.
• D
efin
ition
of g
uide
lines
to o
rient
the
desi
gn o
f pro
ject
s to
exp
and
the
cove
rage
of
the
pre-
basi
c le
vel a
nd th
e no
rms
that
regu
late
the
oblig
ator
y as
sist
ance
of 5
-yea
r-ol
d ch
ildre
n at
this
leve
l. •
Impl
emen
tatio
n of
the
coor
dina
tion
plan
for t
he te
ache
r adv
ice
and
acco
mpa
nim
ent
mod
el, a
s w
ell a
s co
ordi
natio
n of
the
Initi
al T
each
er F
orm
atio
n pl
an.
• A
pplic
atio
n an
d pu
blic
izin
g of
aca
dem
ic p
erfo
rman
ce te
sts
in b
asic
mat
eria
ls.
• Th
e E
FA P
lan
(All
with
Edu
catio
n) w
ill b
e im
plem
ente
d st
artin
g in
Feb
ruar
y 20
05.
iii.
Exp
and
the
educ
atio
nal s
yste
m’s
sup
ply,
with
sp
ecia
l em
phas
is o
n pr
e-ba
sic
educ
atio
n, th
ird c
ycle
of
bas
ic e
duca
tion
(7th
to 9
th g
rade
) and
mid
dle-
scho
ol e
duca
tion
for b
oth
the
stud
ent a
nd n
on-
stud
ent s
ecto
r.
2001
-201
5 •
Def
initi
on o
f the
nor
ms
that
will
regu
late
the
oblig
ator
y at
tend
ance
of 5
-yea
r-ol
ds a
t th
e pr
e-ba
sic
leve
l.
• O
rgan
izat
ion
of 6
03 P
re-b
asic
Edu
catio
nal C
ente
rs (C
EP
RE
Bs)
. •
Con
vers
ion
of 7
19 B
asic
Edu
catio
n C
ente
rs o
f 7th
to 9
th g
rade
. •
Ann
ual a
ttent
ion
to 1
50,0
00 y
outh
s an
d ad
ults
who
are
out
side
the
form
al s
yste
m
thro
ugh
alte
rnat
ive
serv
ice-
prov
isio
n sy
stem
s.
• 2,
097
proj
ects
to
cons
truct
, ex
pand
and
rep
air
educ
atio
n ce
nter
s fo
r pr
e-ba
sic,
ba
sic
from
1st
to 9
th g
rade
and
div
ersi
fied
cent
ers.
iv
. Im
prov
e m
echa
nism
s an
d pr
ogra
ms
that
rais
e th
e de
man
d fo
r edu
catio
n by
the
popu
latio
n.
2002
-201
5 •
Exp
ansi
on o
f de
man
d st
imul
atio
n pr
ogra
ms
(Sch
ool
bond
s, s
choo
l sn
ack
and
scho
lars
hips
)
v.
Stre
ngth
en te
chni
cal-p
rodu
ctiv
e, fo
rmal
and
no
n-fo
rmal
, mid
dle
educ
atio
n.
2002
-201
5 •
Neg
otia
tion
and
appr
oval
of
U
S$2
0.0
mill
ion
in
finan
cing
to
su
ppor
t m
iddl
e ed
ucat
ion.
iv
. S
treng
then
the
man
agem
ent
and
effic
ienc
y of
the
ed
ucat
iona
l sys
tem
2002
-200
3 •
Impl
emen
tatio
n of
the
Dec
once
ntra
ted
Man
agem
ent
Mod
el,
whi
ch i
nclu
des
the
new
org
anic
-func
tiona
l stru
ctur
e of
Dep
artm
enta
l Edu
catio
n di
visi
ons
(DD
E),
and
thei
r cor
resp
ondi
ng re
gula
tions
.
Obj
ectiv
e Im
prov
e th
e ed
ucat
ion
leve
l of
the
Hon
dura
n po
pula
tion
thro
ugh
grea
ter q
ualit
y,
effic
ienc
y an
d eq
uity
of
educ
atio
n at
the
diffe
rent
leve
ls,
guar
ante
eing
an
impr
oved
pr
ofile
of t
he la
bor f
orce
and
gr
eate
r effi
cien
cy in
hig
her
educ
atio
n.
vi.
Impr
ove
the
effic
ienc
y of
hig
her e
duca
tion.
20
02 –
200
6 •
Rev
iew
of
the
Edu
catio
n bi
ll pr
esen
ted
by t
he S
E a
nd t
he b
ill o
f re
form
s to
the
O
rgan
izat
iona
l La
w o
f th
e U
NA
H b
y th
e C
N E
duca
tion
Com
mis
sion
in
orde
r to
ha
rmon
ize
the
two
proj
ects
.

xx
v
APP
END
IX C
PR
OG
RES
S M
ATR
IX O
F TH
E PR
SP P
OLI
CY
MEA
SUR
ES
OB
JEC
TIVE
S PO
LIC
Y M
EASU
RES
O
rigin
al
Impl
emen
tatio
n D
ate
Cur
rent
Sta
tus
vi
i. Fo
ster
the
crea
tion
and
diss
emin
atio
n of
di
vers
e ar
tistic
man
ifest
atio
ns a
t the
nat
iona
l lev
el.
•
In th
e fra
mew
ork
of th
e P
ilot C
ompr
ehen
sive
Pro
gram
to C
omba
t Urb
an P
over
ty
(PP
ICP
U),
the
exhi
bit
hall
of t
he N
atio
nal
Arc
hive
was
rem
odel
ed a
s w
ere
the
Mer
cedi
tas
Agu
rcia
cul
tura
l cen
ter
and
the
Nat
iona
l Lib
rary
, whe
re s
ocia
lly a
t-ris
k ch
ildre
n w
ill re
ceiv
e w
orks
hops
on
draw
ing,
pai
ntin
g, th
eate
r, da
nce
and
mus
ic a
s an
alte
rnat
ive
for
appr
opria
ting
the
cultu
ral
herit
age
and
valu
es o
f th
e po
ores
t gr
oups
.
4.2
MO
RE
AN
D B
ETTE
R A
CC
ESS
TO H
EALT
H S
ERVI
CES
i. S
treng
then
prim
ary
and
prev
entiv
e he
alth
ca
re
2002
-201
5 •
Ext
ensi
on o
f cov
erag
e w
ith n
ew m
anag
emen
t and
fina
ncin
g m
odel
s w
ith p
rovi
ders
ou
tsid
e th
e H
ealth
Sec
reta
riat.
ii.
Pro
vide
gre
ater
atte
ntio
n to
wom
en’s
hea
lth
cond
ition
s 20
02-2
015
• In
itiat
ion
of th
e im
plem
enta
tion
of th
e m
ater
nal-i
nfan
t mor
talit
y in
itiat
ive.
•
Form
ulat
ion
of th
e m
ater
nal-i
nfan
t pol
icy
• Fo
rmul
atio
n of
the
nutri
tion
polic
y
Obj
ectiv
e E
nsur
e ac
cess
with
qua
lity
and
equi
ty to
hea
lth s
ervi
ces,
pr
efer
entia
lly in
prim
ary
care
an
d nu
tritio
nal m
onito
ring
on
beha
lf of
the
poor
pop
ulat
ion.
iii.
Ach
ieve
gre
ater
effi
cien
cy a
nd q
ualit
y in
he
alth
ser
vice
pro
visi
on
2002
-201
5 •
Def
initi
on o
f 18
Dep
artm
enta
l S
anita
ry R
egio
ns a
nd 2
Met
ropo
litan
San
itary
R
egio
ns a
nd im
plem
enta
tion
of th
e pr
oces
s.
• In
corp
orat
ion
of t
he d
ecen
traliz
atio
n pr
oces
s of
9 h
ospi
tals
in t
he g
ener
al b
udge
t di
spos
ition
s fo
r 200
5 as
an
initi
al e
xper
ienc
e.
• M
oder
niza
tion
of th
e m
anag
emen
t, ex
pans
ion
and
rem
odel
ing
of th
e in
frast
ruct
ure
and
equi
pmen
t of
12
hosp
itals
in
the
publ
ic n
etw
ork
and
the
proc
ess
is b
eing
in
itiat
ed in
the
rest
.
V.
STR
EN
GTH
EN
ING
SO
CIA
L P
RO
TEC
TIO
N F
OR
SP
EC
IFIC
GR
OU
PS
5.1
SOC
IAL
SEC
UR
ITY
NET
S
i. S
treng
then
and
impr
ove
the
impa
ct o
f the
ex
trem
e po
verty
alle
viat
ion
prog
ram
s.
2001
-201
5 W
ork
is b
eing
don
e on
a P
lan
of A
ttent
ion
to p
eopl
e in
Ext
rem
e S
ocia
l Vul
nera
bilit
y;
ii.
Sup
port
the
prog
ram
s of
pro
tect
ion
for
child
ren
and
youn
g ad
oles
cent
s.
2001
-201
5 Th
e H
ondu
ran
Inst
itute
of C
hild
ren
and
the
Fam
ily (I
HN
FA) i
s at
tend
ing
933
child
ren
with
pro
blem
s of
labo
r exp
loita
tion,
beg
ging
, vag
ranc
y, e
tc.,
and
29 s
choo
ls fo
r pa
rent
s ha
ve b
een
orga
nize
d.
iii.
Com
preh
ensi
vely
atte
nd in
divi
dual
s w
ith
disa
bilit
ies
in a
situ
atio
n of
pov
erty
. 20
02-2
015
App
rova
l of
the
Nat
iona
l P
olic
y fo
r th
e P
reve
ntio
n of
Dis
abili
ties,
Com
preh
ensi
ve
Car
e an
d R
ehab
ilita
tion
of P
eopl
e w
ith D
isab
ility
and
the
prom
otio
n an
d pr
otec
tion
of
thei
r rig
hts
and
dutie
s.
Inco
rpor
atio
n of
a m
odul
e in
the
Nat
iona
l In
stitu
te o
f S
tatis
tics
(INE
) su
rvey
s to
m
easu
re d
isab
ility
.
Obj
ectiv
e R
educ
e th
e ris
k fa
ctor
s in
the
spec
ific
grou
ps o
f gre
ater
vu
lner
abili
ty.
iv.
Impr
ove
the
atte
ntio
n to
the
elde
rly.
2002
U
nder
way
5.2
GEN
DER
EQ
UIT
Y A
ND
EQ
UA
LITY

xx
vi
APP
END
IX C
PR
OG
RES
S M
ATR
IX O
F TH
E PR
SP P
OLI
CY
MEA
SUR
ES
OB
JEC
TIVE
S PO
LIC
Y M
EASU
RES
O
rigin
al
Impl
emen
tatio
n D
ate
Cur
rent
Sta
tus
i. E
nsur
e th
e co
nditi
ons
that
per
mit
effe
ctiv
ely
equa
l opp
ortu
nitie
s fo
r wom
en, e
spec
ially
for t
hose
w
ho li
ve in
a s
ituat
ion
of p
over
ty.
2002
-201
5 Th
roug
h th
e E
qual
Opp
ortu
nitie
s fo
r R
ural
Wom
en p
roje
ct (
PIO
N R
UR
AL)
, 16
pr
ojec
ts h
ave
been
app
rove
d, b
enef
iting
2,7
51 ru
ral w
omen
. Tr
aini
ng h
as b
een
done
on
guid
elin
es o
f th
e G
ende
r E
quity
Pol
icy
for
Hon
dura
n ag
ricul
ture
dire
cted
to m
unic
ipal
ities
and
ass
ocia
tions
.
ii.
Rev
iew
and
app
ly th
e La
w A
gain
st D
omes
tic
Vio
lenc
e in
ord
er to
pre
vent
and
elim
inat
e th
e in
cide
nce
of th
is p
robl
em a
gain
st w
omen
.
2002
Th
e R
efor
m to
the
Law
Aga
inst
Dom
estic
Vio
lenc
e ha
s be
en s
ocia
lized
and
is b
eing
pr
esen
ted
to th
e N
atio
nal C
ongr
ess.
Obj
ectiv
e C
ontri
bute
to th
e co
mpr
ehen
sive
dev
elop
men
t of
wom
en in
con
ditio
ns o
f pov
erty
th
roug
h th
eir f
ull a
nd e
ffect
ive
parti
cipa
tion
iii.
Inco
rpor
ate
info
rmat
ion
mor
e di
ffere
ntia
ted
by
sex
in th
e ce
nsus
and
sur
veys
in o
rder
to b
e ab
le to
se
e th
e ec
onom
ic c
ontri
butio
n of
wom
en a
nd m
ore
spec
ific
info
rmat
ion
abou
t the
m.
2002
-200
5 In
Sep
tem
ber
2003
, a
mod
ule
on d
omes
tic v
iole
nce
was
inc
orpo
rate
d in
to t
he
Hou
seho
ld S
urve
y.
In M
ay 2
004
info
rmat
ion
was
requ
este
d in
this
sam
e su
rvey
diff
eren
tiate
d by
sex
5.3
DEV
ELO
PMEN
T O
F ET
HN
IC P
EOPL
ES
i. C
reat
e th
e N
atio
nal C
ounc
il of
Eth
nic
grou
ps,
with
the
obje
ctiv
e of
def
inin
g a
natio
nal a
gend
a an
d fa
cilit
atin
g ad
equa
te c
oord
inat
ion
in th
e im
plem
enta
tion
of p
rogr
ams
and
proj
ects
.
2002
Th
e N
atio
nal C
omm
issi
on A
gain
st R
acia
l Dis
crim
inat
ion,
Rac
ism
, Xen
opho
bia
and
Rel
ated
For
ms
of In
tole
ranc
e w
as c
reat
ed, w
hich
see
ks to
coo
rdin
ate
actio
ns in
the
natio
nal s
pher
e w
ith C
ivil
Soc
iety
org
aniz
atio
ns to
def
ine
polic
ies
and
actio
ns o
f the
G
over
nmen
t of t
he R
epub
lic in
the
inte
rnat
iona
l sph
ere
rela
ting
to th
eir r
ight
s.
ii.
Inco
rpor
ate
the
cate
gory
“eth
nic
grou
p of
be
long
ing
or re
fere
nce”
with
in th
e ce
nsus
sta
tistic
s or
as
a m
odul
e of
the
Hou
seho
ld S
urve
y.
2002
-200
3 A
mod
ule
was
inco
rpor
ated
in th
e H
ouse
hold
Sur
vey
in M
ay 2
002
Obj
ectiv
e H
elp
stre
ngth
en th
e lo
cal
capa
citie
s of
the
ethn
ic a
nd
blac
k po
pula
tion
of H
ondu
ras.
iii.
Mak
e th
e na
tiona
l leg
isla
tion
unifo
rm w
ith th
e IL
O C
onve
ntio
n 16
9 w
ith re
spec
t to
indi
geno
us
peop
les,
of w
hich
Hon
dura
s is
a s
igna
tory
, for
its
corr
espo
nden
t app
licat
ion.
2002
-200
5 Th
e In
tern
atio
nal C
onve
ntio
n on
the
Elim
inat
ion
of A
ll Fo
rms
of R
acia
l Dis
crim
inat
ion
was
ratif
ied.
Th
e N
atio
nal C
omm
issi
on A
gain
st R
acia
l Dis
crim
inat
ion,
Rac
ism
, Xen
opho
bia
and
Rel
ated
For
ms
of In
tole
ranc
e w
as c
reat
ed
VI.
GU
AR
AN
TEE
ING
TH
E S
TRAT
EGY
’S S
UST
AIN
AB
ILIT
Y
6.1
STR
ENG
THEN
ING
TR
ANSP
AR
ENC
Y A
ND
PA
RTI
CIP
ATO
RY
DEM
OC
RA
CY
Obj
ectiv
e C
onso
lidat
e go
od g
over
nanc
e,
ensu
ring
trans
pare
ncy
in p
ublic
ad
min
istra
tion
and
impr
ovin
g th
e qu
ality
of t
he p
opul
atio
n’s
polit
ical
repr
esen
tatio
n.
i. E
nsur
e tra
nspa
renc
y in
all
activ
ities
of p
ublic
ad
min
istra
tion,
and
esp
ecia
lly in
the
impl
emen
tatio
n of
soc
ial p
rogr
ams
and
proj
ects
2001
-200
5 •
Ove
r 800
insp
ectio
ns w
ere
mad
e of
sta
te in
stitu
tions
thro
ugh
the
Pro
gram
of
effi
cien
cy a
nd tr
ansp
aren
cy in
pur
chas
ing
and
cont
ract
ing.
• S
treng
then
ing
of th
e pu
rcha
ses
and
cont
ract
ing
adm
inis
tratio
n of
4 S
tate
S
ecre
taria
ts, a
s w
ell a
s FH
IS a
nd S
AN
AA
.
• Tr
aini
ng o
f app
roxi
mat
ely
200
offic
ials
of 5
4 in
stitu
tions
in p
urch
asin
g an
d co
ntra
ctin
g.
• Th
e O
ffice
of S
tate
Con
tract
ing
and
Acq
uisi
tions
Nor
ms
(ON
CA
E)
star
ted
func
tioni
ng.

xx
vii
APP
END
IX C
PR
OG
RES
S M
ATR
IX O
F TH
E PR
SP P
OLI
CY
MEA
SUR
ES
OB
JEC
TIVE
S PO
LIC
Y M
EASU
RES
O
rigin
al
Impl
emen
tatio
n D
ate
Cur
rent
Sta
tus
•
The
Sup
erio
r Cou
rt of
Acc
ount
s be
gan
to fu
nctio
n as
of J
anua
ry 2
003.
• Th
e ne
w “
Law
Aga
inst
the
Crim
e of
Ass
ets
Laun
derin
g” w
as a
ppro
ved,
w
hich
am
ong
othe
r as
pect
s “w
ill f
acili
tate
inv
estig
atio
ns o
f ev
en f
orm
er o
ffici
als
who
can
not j
ustif
y th
eir i
ncom
es.”
ii.
Form
ulat
e an
d ap
prov
e, in
con
sulta
tion
with
th
e se
ctor
s in
volv
ed, a
lega
l ord
erin
g an
d pr
uden
tial
supe
rvis
ion
that
per
mits
the
NG
Os
to fu
nctio
n w
ell.
2002
•
Sta
rting
in 2
003,
thr
ough
the
Sec
reta
riat
of G
over
nanc
e an
d Ju
stic
e, t
he
on-li
ne r
egis
try o
f Non
gove
rnm
enta
l Org
aniz
atio
ns (
NG
Os)
has
got
ten
unde
rway
, th
roug
h w
hich
they
mus
t als
o re
port
thei
r fin
anci
al s
tatu
s.
iii.
Impr
ove
the
parli
amen
tary
pro
cess
thro
ugh
adeq
uate
tech
nica
l ass
ista
nce,
aut
omat
ing
of
cont
rols
and
mec
hani
sms
for t
he d
efin
ition
of
legi
slat
ive
prio
ritie
s.
2002
-201
5 •
The
Nat
iona
l Con
gres
s is
cur
rent
ly im
plem
entin
g th
e C
NH
Mod
erni
zatio
n P
rogr
am,
finan
ced
by
the
Inte
r-A
mer
ican
D
evel
opm
ent
Ban
k (ID
B)
and
the
Gov
ernm
ent o
f the
Rep
ublic
of H
ondu
ras,
thro
ugh
Con
tract
No.
107
0/S
F-H
O.
• Th
e el
ectro
nic
votin
g sy
stem
ha
s be
en
put
into
op
erat
ion,
an
d th
e re
spec
tive
test
ing
and
train
ing
of t
he d
eput
ies
for
its p
rope
r ut
iliza
tion
are
now
un
derw
ay.
• Th
e co
nsul
tatio
n m
echa
nism
of
th
e M
obile
C
ongr
ess
has
been
im
plem
ente
d.
• A
Cen
ter o
f Nat
iona
l Leg
isla
tive
Atte
ntio
n ha
s be
en p
ut in
to e
ffect
thro
ugh
the
Con
gres
s’ w
eb p
age,
who
se o
bjec
tive
is t
o pr
omot
e th
e fo
rmat
ion
of a
new
cu
lture
of
civi
c pa
rtici
patio
n th
roug
h w
hich
the
peo
ple
can
have
acc
ess
to t
he
legi
slat
ive
agen
da.
iv.
Rea
ch c
onse
nsus
and
app
rove
the
polit
ical
re
form
s in
ord
er to
impr
ove
parti
cipa
tory
dem
ocra
cy.
2002
D
iver
se p
oliti
cal r
efor
ms
pact
ed b
y th
e po
litic
al p
artie
s in
200
01 h
ave
been
app
rove
d an
d ra
tifie
d, a
mon
g w
hich
the
mos
t im
porta
nt a
re:
a. T
he fi
gure
of P
resi
dent
ial D
esig
nate
s is
elim
inat
ed, w
ith it
s ap
prov
ed s
ubst
itute
the
figur
e of
one
Vic
e P
resi
dent
. b.
Dis
qual
ifyin
g of
the
Nat
iona
l Con
gres
s (C
N)
pres
iden
ts f
rom
bei
ng c
andi
date
s to
th
e P
resi
denc
y of
the
Rep
ublic
. c.
Sep
arat
ion
betw
een
the
Nat
iona
l Ele
ctio
ns T
ribun
al (
TNE
) an
d th
e N
atio
nal C
ivil
Reg
istry
(RN
P).
d. T
he
figur
es
of
pleb
isci
te
and
refe
rend
um
are
inco
rpor
ated
as
co
nsul
tatio
n m
echa
nism
s an
d as
mea
ns fo
r dee
peni
ng p
artic
ipat
ory
dem
ocra
cy.
e. T
he n
ew E
lect
oral
Law
and
Pol
itica
l Org
aniz
atio
ns L
aws
wer
e ap
prov
ed a
nd p
ut
into
effe
ct
f. A
new
Law
of N
atio
nal C
ivil
Reg
istry
was
app
rove
d an
d pu
t int
o ef
fect
g.
Con
stitu
tiona
l ref
orm
s an
d ra
tific
atio
n to
elim
inat
e th
e pr
erog
ativ
e of
imm
unity
for
top
stat
e of
ficia
ls.
6.2
STR
ENG
THEN
ING
JU
STIC
E A
ND
PU
BLI
C S
ECU
RIT
Y
Obj
ectiv
e: G
ener
ate
the
cond
ition
s fo
r the
real
1.
St
reng
then
the
inde
pend
ence
of t
he a
ctor
s in
the
just
ice
syst
em.

xx
viii
APP
END
IX C
PR
OG
RES
S M
ATR
IX O
F TH
E PR
SP P
OLI
CY
MEA
SUR
ES
OB
JEC
TIVE
S PO
LIC
Y M
EASU
RES
O
rigin
al
Impl
emen
tatio
n D
ate
Cur
rent
Sta
tus
i. Ju
dici
ary
Cou
ncil
and
Judi
cial
Car
eer b
ills
2001
-200
4 Th
e do
cum
ent i
s re
ady
for a
soc
ializ
atio
n an
d re
view
pha
se w
ith re
pres
enta
tives
of
dive
rse
soci
al s
ecto
rs b
efor
e be
ing
pres
ente
d to
the
Nat
iona
l Con
gres
s fo
r pas
sage
.
effe
ctiv
enes
s of
a s
yste
m th
at
ensu
res
the
prot
ectio
n of
hu
man
righ
ts, l
egal
sec
urity
for
inve
stm
ent a
nd p
eace
ful l
ife in
so
ciet
y.
ii.
B
ill fo
r the
Org
aniz
atio
n of
the
Judi
cial
Bra
nch
20
01-2
004
A b
ill fo
r the
Org
aniz
atio
n of
the
Judi
cial
bra
nch
exis
ts, r
evie
wed
by
the
Coa
litio
n fo
r th
e S
treng
then
ing
of J
ustic
e an
d re
ady
to b
e su
bmitt
ed to
a fi
nal s
ocia
lizat
ion
proc
ess
befo
re b
eing
sen
t to
the
Nat
iona
l Con
gres
s.
iii.
Pro
ject
to M
oder
nize
the
Judi
cial
Bra
nch
– W
orld
Ban
k.
2001
-200
4 In
the
med
ium
term
, the
judi
cial
ref
orm
is a
imed
at a
com
preh
ensi
ve r
efor
m o
f the
ju
stic
e sy
stem
, whi
ch o
n th
e on
e ha
nd in
volv
es a
ll as
pect
s, e
ven
the
adm
inis
trativ
e,
and
on th
e ot
her,
the
lega
l and
org
aniz
atio
nal a
spec
t is
incl
uded
in e
ach
of th
em.
Maj
or a
ctiv
ities
to b
e im
plem
ente
d in
200
4:
Rei
nitia
te t
he s
ocia
lizat
ion
and
valid
atio
n pr
oces
s of
the
bill
s dr
afte
d to
be
the
Judi
ciar
y C
ounc
il La
w a
nd t
he J
udic
ial C
aree
r La
w,
the
Org
aniz
atio
nal L
aw o
f th
e Ju
dici
al B
ranc
h.
Initi
ate
the
orga
niza
tiona
l de
sign
for
the
set
ting
up o
f ci
tatio
n an
d no
tific
atio
n ce
nter
s, a
utom
ated
cen
ters
for t
he re
cept
ion
and
dist
ribut
ion
of c
ases
. W
ith r
espe
ct t
o ci
vil
refo
rm,
cond
uct
a qu
alita
tive
and
quan
titat
ive
stud
y of
the
ju
dici
al b
ackl
og o
f civ
il ca
ses
as a
bas
e fo
r in
itiat
ing
the
Pro
gram
to C
lean
Out
Civ
il C
ases
nex
t yea
r.
With
res
pect
to
cont
rol
and
trans
pare
ncy,
sup
port
the
desi
gn o
f th
e co
ncep
tual
fra
mew
ork
for
the
role
of
the
Offi
ce o
f C
ourt
Insp
ecto
r as
the
bas
is f
or t
he n
ew
orga
niza
tiona
l de
sign
. I
nitia
te a
ctio
ns t
o su
ppor
t de
cent
raliz
atio
n of
acc
ess
to
juris
prud
ence
and
judi
cial
info
rmat
ion
2.
Im
prov
e th
e ap
plic
atio
n of
ju
stic
e an
d eq
uity
in a
cces
s to
just
ice
i. Im
prov
emen
ts to
the
Pen
al P
roce
ssin
g C
ode
(CP
P) a
nd m
ake
the
Pen
al C
ode
bill
com
patib
le w
ith th
e C
PP
.
2001
-200
4 Th
e ap
prov
al o
f con
sulta
nts
has
been
obt
aine
d fo
r pre
parin
g in
stru
ctio
ns fo
r im
prov
ing
the
appl
icat
ion
of th
e P
enal
Pro
cess
ing
Cod
e, a
n ac
tivity
pla
nned
for
Oct
ober
200
4
ii.
Civ
il P
roce
ssin
g C
ode
2001
-200
4 A
tech
nica
l rev
iew
of t
he C
ivil
Pro
cess
ing
Cod
e bi
ll w
as c
ondu
cted
with
sup
port
from
th
e C
oalit
ion
for t
he S
treng
then
ing
of J
ustic
e, b
ut th
e do
cum
ent m
erits
mor
e in
/dep
th
revi
ew a
nd th
e co
nduc
ting
of a
bro
ad p
rogr
am o
f dis
cuss
ion
and
revi
sion
.
3.
Pr
even
t an
d sa
nctio
n cr
ime
to
ensu
re
soci
al o
rder
and
the
right
to li
fe a
nd p
rope
rty.
i.
Saf
er C
omm
unity
Pro
gram
20
02-2
004
The
Saf
er C
omm
unity
Pro
gram
has
mad
e ve
ry im
porta
nt a
dvan
ces
in s
ecur
ity in
20
04, a
mon
g w
hich
the
reco
very
of 5
8 st
olen
veh
icle
s, 1
2,44
6 pa
trols
, 276
sei
zure
s of
mar
ihua
na, 3
20 c
onfis
catio
ns o
f veh
icle
s

xx
ix
APP
END
IX C
PR
OG
RES
S M
ATR
IX O
F TH
E PR
SP P
OLI
CY
MEA
SUR
ES
OB
JEC
TIVE
S PO
LIC
Y M
EASU
RES
O
rigin
al
Impl
emen
tatio
n D
ate
Cur
rent
Sta
tus
ii.
Pro
gram
s of
Pre
vent
ive
Edu
catio
n,
Div
isio
n of
Pre
vent
ion
agai
nst V
iole
nt G
angs
(M
aras
)
2004
5
prog
ram
s ar
e be
ing
impl
emen
ted:
Edu
catio
n to
Res
ist a
nd A
void
Mar
as
(E.R
.E.M
.), B
asic
Kno
wle
dge
of M
aras
(CO
.BA
.MA
), D
ES
AFI
OS
(CH
ALL
EN
GE
S),
a pr
ogra
m e
spec
ially
cre
ated
for t
he a
dole
scen
t stu
dent
pop
ulat
ion.
11
,121
peo
ple
wer
e tra
ined
in P
reve
ntio
n A
gain
st M
aras
in 2
004,
incl
udin
g pr
imar
y,
seco
ndar
y an
d un
iver
sity
stu
dent
s, p
aren
ts, t
each
ers
and
com
mun
ity le
ader
s.
iii
. In
tern
al P
olic
y Fo
rmat
ion
Pro
gram
20
04
Des
igne
d to
com
bat l
ack
of p
olic
e kn
owle
dge
on th
e is
sue
of M
aras
, the
Hon
dura
n pe
nal s
yste
m, i
mpr
ison
ed M
aras
6.3
MO
DER
NIZ
ATI
ON
OF
PUB
LIC
AD
MIN
ISTR
ATI
ON
AN
D D
ECEN
TRA
LIZA
TIO
N
i. C
ontin
ue im
plem
entin
g th
e P
ublic
A
dmin
istra
tion
Mod
erni
zatio
n P
rogr
am.
2001
U
nder
way
and
con
tinui
ng w
ith t
he r
e-to
olin
g of
pilo
t st
ate
secr
etar
iats
(E
duca
tion,
H
ealth
, S
AG
); se
ctor
al r
efor
ms
(tele
com
mun
icat
ions
, en
ergy
, tra
nspo
rt an
d w
ater
an
d sa
nita
tion)
; an
d th
e pr
ofes
sion
aliz
atio
n of
hum
an r
esou
rce
man
agem
ent
in
publ
ic a
dmin
istra
tion.
ii.
A
ppro
ve th
e La
w o
f Adm
inis
trativ
e S
impl
ifica
tion
2001
A
ppro
ved
iii.
Mak
e th
e de
cent
raliz
atio
n an
d de
conc
entra
tion
of C
entra
l Gov
ernm
ent f
unct
ions
to
the
mun
icip
aliti
es e
ffect
ive.
2001
-201
5 Th
ere
are
now
dec
entra
lizat
ion
stra
tegi
es f
or t
he e
duca
tion
and
heal
th s
ervi
ces.
Th
e O
pera
tiona
l de
cent
raliz
atio
n of
the
FH
IS p
roje
ct c
ycle
and
env
ironm
enta
l un
derg
radu
ate
degr
ee a
re b
eing
pro
mot
ed.
Obj
ectiv
e
Ach
ieve
an
effe
ctiv
e pr
oces
s of
m
unic
ipal
dec
entra
lizat
ion
and
deve
lopm
ent t
hat h
elps
redu
ce
pove
rty, i
n th
e fra
mew
ork
of
mod
ern
and
effic
ient
pub
lic
adm
inis
tratio
n.
iv.
Stre
ngth
en th
e ro
le o
f Loc
al
Gov
ernm
ents
as
deve
lopm
ent p
rom
otin
g en
titie
s w
ith b
road
par
ticip
atio
n of
thei
r com
mun
ities
.
2002
M
unic
ipal
adm
inis
tratio
n is
bei
ng s
treng
then
ed t
hrou
gh P
RO
DD
EL
in t
he a
reas
of
plan
ning
, tax
sys
tem
and
mun
icip
al c
ivil
care
er.
6.4
IMPR
OVI
NG
EN
VIR
ON
MEN
TAL
PRO
TEC
TIO
N A
ND
RIS
K M
AN
AG
EMEN
T
i. A
djus
t the
lega
l fra
mew
ork
and
impr
ove
the
effic
ienc
y an
d ef
fect
iven
ess
of th
e le
gal
fram
ewor
k to
redu
ce e
colo
gica
l vul
nera
bilit
y.
2002
Th
e Te
rrito
rial P
lann
ing
Law
and
Law
of P
otab
le W
ater
and
San
itatio
n w
ere
App
rove
d, a
nd th
e w
ater
and
fore
stry
law
s ar
e in
the
proc
ess
of b
eing
pas
sed.
AFE
-C
OH
DE
FOR
is b
eing
rest
ruct
ured
. ii.
Im
prov
e th
e en
viro
nmen
tal p
lann
ing
and
man
agem
ent s
yste
ms.
20
02 –
200
3 Th
ere
is n
ow a
Ter
ritor
ial P
lann
ing
met
hodo
logy
and
info
rmat
ion
syst
em;
SIN
IA is
be
ing
impl
emen
ted;
inst
rum
ents
hav
e be
en d
evel
oped
for
wat
er p
lann
ing;
the
rura
l el
ectri
ficat
ion
polic
y an
d po
licy
to fi
ght d
eser
tific
atio
n an
d dr
ough
t for
mun
icip
aliti
es
with
hig
h ec
olog
ical
and
soc
ial v
ulne
rabi
lity
are
bein
g dr
afte
d.
iii.
Pro
mot
e th
e fin
anci
al s
usta
inab
ility
of th
e en
viro
nmen
tal p
rote
ctio
n an
d m
anag
emen
t ac
tions
.
2002
– 2
015
Bei
ng n
egot
iate
d
iv.
Pro
mot
e ci
vic
parti
cipa
tion
in
envi
ronm
enta
l pro
tect
ion
and
risk
man
agem
ent
activ
ities
.
2002
– 2
015
Trai
ning
and
aw
aren
ess
build
ing
actio
ns a
re b
eing
pro
mot
ed; 7
10 M
unic
ipal
E
nviro
nmen
tal U
nits
hav
e be
en c
reat
ed, a
nd th
e en
viro
nmen
tal m
anag
emen
t pr
oces
ses
are
bein
g de
cent
raliz
ed.
Obj
ectiv
e
Red
uce
the
coun
try’s
eco
logi
cal
risks
and
vul
nera
bilit
y by
im
prov
ing
envi
ronm
enta
l m
anag
emen
t and
risk
m
anag
emen
t at h
e ce
ntra
l and
de
cent
raliz
ed le
vels
.
v.
Pre
pare
and
app
ly a
stra
tegy
for
prev
entin
g, m
itiga
ting
and
resp
ondi
ng to
em
erge
ncie
s th
at is
root
ed in
a p
erm
anen
t and
de
cent
raliz
ed s
truct
ure
unde
r the
coo
rdin
atio
n an
d pa
rtici
patio
n of
diff
eren
t act
ors
and
entit
ies.
2002
– 2
015
Wor
k is
bei
ng d
one
on th
e cr
eatio
n of
a N
atio
nal C
ivil
Pro
tect
ion
Sys
tem
. R
egio
nal
CO
PE
CO
offi
ces
have
sta
rted
to fu
nctio
n, E
mer
genc
y O
pera
tions
Cen
ters
and
P
reve
ntio
n an
d E
mer
genc
y C
omm
ittee
s ar
e be
ing
orga
nize
d an
d tra
ined
, and
C
omm
unity
Ear
ly W
arni
ng s
yste
ms
are
bein
g de
velo
ped.

xx
x
APP
END
IX D
.1 P
OVE
RTY
SPE
ND
ING
PR
OG
RA
M /
PRO
JEC
T A
REA
20
01
2002
20
03
2004
1.
A
CC
ELER
ATI
NG
EQ
UIT
AB
LE A
ND
SU
STA
INA
BLE
EC
ON
OM
IC G
RO
WTH
-
-
1
3.88
21
.10
1.1
Str
engt
heni
ng In
vest
men
ts a
nd Im
prov
ing
thei
r Effi
cien
cy
-
-
-
-
-
1.2
Im
prov
ing
Com
petit
ive
Acc
ess
to In
tern
atio
nal M
arke
ts
-
-
-
-
-
1.3
Sup
port
ing
the
Dev
elop
men
t of S
ecto
rs w
ith H
igh
Prod
uctiv
ity a
nd E
mpl
oym
ent P
oten
tial
-
-
13.
88
21.1
0 Lo
cal S
elf-M
anag
ed D
evel
opm
ent t
o R
educ
e P
over
ty in
Nor
ther
n C
opan
.
-
-
13.
88
21.1
0
-1.
4 S
tren
gthe
ning
Inve
stm
ent a
nd G
ener
atin
g Em
ploy
men
t
-
-
-
-
-2.
R
EDU
CIN
G P
OVE
RTY
IN R
UR
AL
ZON
ES
1,54
3.51
1
,124
.77
1,1
84.2
9
879
.60
2.1
Im
prov
ing
Equi
ty a
nd S
ecur
ity in
Acc
ess
to L
and
2
37.0
1
249
.45
1
31.4
5
7
.70
Rur
al A
reas
Adm
inis
tratio
n P
roje
ct (P
AA
R)
180
.70
1
72.1
0
109
.98
27.
50
Act
ion
Pla
n fo
r Lan
d O
rgan
izat
ion,
Con
serv
atio
n an
d E
nviro
nmen
tal M
anag
emen
t of t
he S
ico
and
Pau
laya
Val
leys
.
1.91
7
.75
-
-
Land
Acc
ess
Pilo
t Pro
gram
(PA
CTA
)
54.
40
69.6
0
21
.47
22.
50
-
-
2.2
Sus
tain
able
Dev
elop
men
t in
Prio
rity
Zone
s
290
.88
2
98.3
2
428
.86
3
21.4
4 H
ighe
r Man
agem
ent a
nd C
oord
inat
ion
of P
rona
ders
(DIN
AD
ER
S)
2
2.80
14
.98
2
6.33
73
.60
DIN
AD
ER
S -
CO
HA
SA
III R
egio
nal L
empi
ra-In
tibuc
á
5.93
-
Nat
iona
l Loc
al D
evel
opm
ent P
rogr
am (P
RO
NA
DE
L)
-
94.4
0
78.
31
56.0
0 R
ural
Dev
elop
men
t in
Sou
thw
este
rn H
ondu
ras
( PR
OS
OC
)
82.
30
76.8
0
71.
89
33.6
0 R
ural
Dev
elop
men
t Pro
ject
in C
entra
l-Eas
tern
Hon
dura
s (P
RO
DE
RC
O)
6
7.40
58
.30
3
8.82
7
.70
Rur
al E
cono
mic
Rea
ctiv
atio
n P
roje
ct, R
ER
UR
AL
4.30
16
.80
4.5
3
41
.20
Sou
ther
n Le
mpi
ra C
ompr
ehen
sive
Dev
elop
men
t Pro
ject
7.
00
7.3
0
10.
49
-S
uppo
rt to
Sm
all a
nd M
ediu
m S
cale
Far
mer
s in
the
Ola
ncho
Pro
vinc
e
5.50
2
.00
2
5.68
-
Rur
al D
evel
opm
ent F
ound
atio
n (F
UN
DE
R)
6.75
3
.40
1
1.60
4
.64
Sus
tain
able
Rur
al D
evel
opm
ent i
n E
colo
gica
lly F
ragi
le Z
ones
in T
rifin
io
2.40
-
7.4
0
26
.40
Hig
her M
anag
emen
t and
Coo
rdin
atio
n of
Pro
nade
rs (F
ON
AD
ER
S)
8
6.50
24
.34
5
6.64
71
.50
Rur
al E
cono
mic
Rea
ctiv
atio
n P
roje
ct, R
ER
UR
AL
-
-
83.
30
6.8
0 S
usta
inab
le A
gric
ultu
re a
nd R
ural
Dev
elop
men
t
-
0
.31
-Fo
od S
ecur
ity in
the
Gul
f of F
onse
ca
-
3.9
0
-
Wes
tern
Nat
ural
Res
ourc
es P
rogr
am (P
RO
RE
NA
)
-
9
.66
-
-2.
3 I
mpr
ovin
g th
e C
ompe
titiv
enes
s of
the
Smal
l Rur
al E
cono
my
7
56.4
9
399
.43
3
67.1
2
505
.13
Reh
abili
tatio
n of
the
Ange
les
San
Jua
n de
Flo
res
Val
ley
-
4
7.32
-
Reh
abili
tatio
n of
the
Yegu
are
Riv
er b
ridge
-
6
.50
-S
an J
uan
Gra
cias
Hig
hway
20.
26
-R
ehab
ilita
tion
of th
e S
anta
Ele
na C
edeñ
o H
ighw
ay
-
0.5
6
2
.95
39.2
0
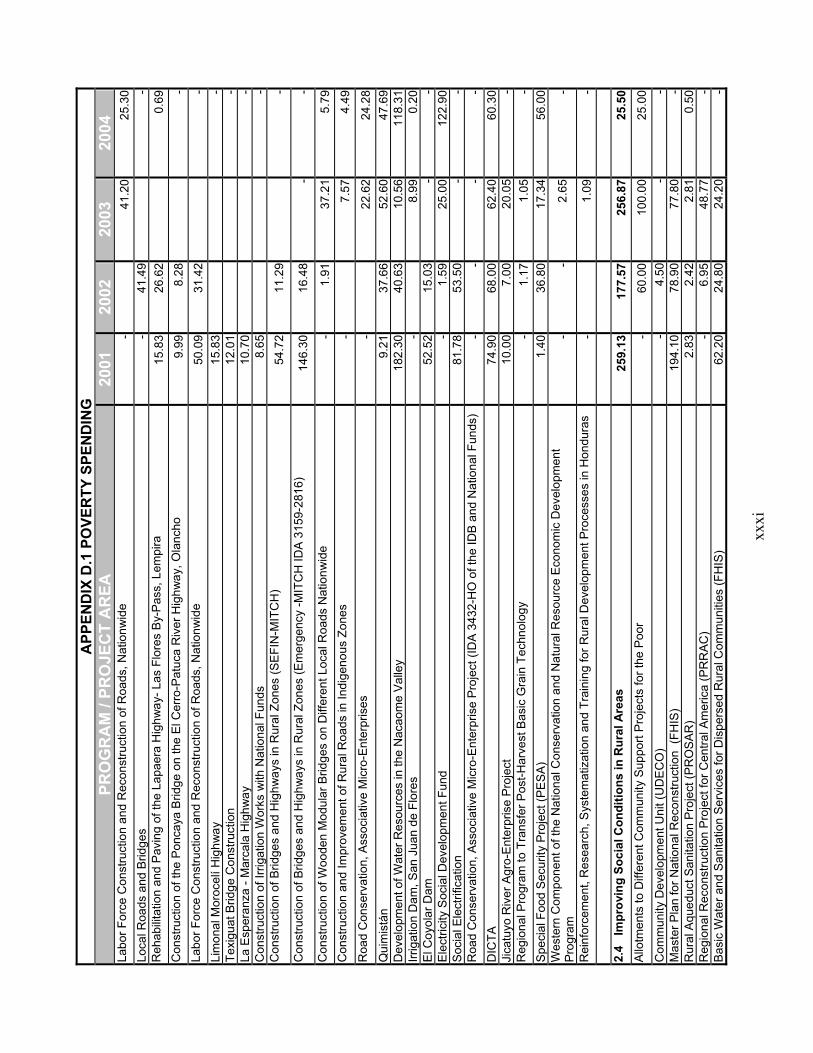
xx
xi
APP
END
IX D
.1 P
OVE
RTY
SPE
ND
ING
PR
OG
RA
M /
PRO
JEC
T A
REA
20
01
2002
20
03
2004
La
bor F
orce
Con
stru
ctio
n an
d R
econ
stru
ctio
n of
Roa
ds, N
atio
nwid
e
-
4
1.20
25
.30
Loca
l Roa
ds a
nd B
ridge
s
-
41.4
9
-
Reh
abili
tatio
n an
d Pa
ving
of t
he L
apae
ra H
ighw
ay- L
as F
lore
s B
y-P
ass,
Lem
pira
15.
83
26.6
2
0
.69
Con
stru
ctio
n of
the
Pon
caya
Brid
ge o
n th
e El
Cer
ro-P
atuc
a R
iver
Hig
hway
, Ola
ncho
9.
99
8.2
8
-
Labo
r For
ce C
onst
ruct
ion
and
Rec
onst
ruct
ion
of R
oads
, Nat
ionw
ide
50.
09
31.4
2
-
Lim
onal
Mor
ocel
í Hig
hway
15.
83
-Te
xigu
at B
ridge
Con
stru
ctio
n
12.
01
-La
Esp
eran
za -
Mar
cala
Hig
hway
10.
70
-C
onst
ruct
ion
of Ir
rigat
ion
Wor
ks w
ith N
atio
nal F
unds
8.
65
-C
onst
ruct
ion
of B
ridge
s an
d H
ighw
ays
in R
ural
Zon
es (S
EFI
N-M
ITC
H)
5
4.72
11
.29
-C
onst
ruct
ion
of B
ridge
s an
d H
ighw
ays
in R
ural
Zon
es (E
mer
genc
y -M
ITC
H ID
A 3
159-
2816
) 1
46.3
0
16
.48
-
-C
onst
ruct
ion
of W
oode
n M
odul
ar B
ridge
s on
Diff
eren
t Loc
al R
oads
Nat
ionw
ide
-
1
.91
3
7.21
5
.79
Con
stru
ctio
n an
d Im
prov
emen
t of R
ural
Roa
ds in
Indi
geno
us Z
ones
-
7
.57
4.4
9 R
oad
Con
serv
atio
n, A
ssoc
iativ
e M
icro
-Ent
erpr
ises
-
22.
62
24.2
8 Q
uim
istá
n
9.
21
37.6
6
52.
60
47.6
9 D
evel
opm
ent o
f Wat
er R
esou
rces
in th
e N
acao
me
Val
ley
182
.30
40.6
3
10.
56
1
18.3
1 Irr
igat
ion
Dam
, San
Jua
n de
Flo
res
-
8.9
9
0
.20
El C
oyol
ar D
am
5
2.52
15
.03
-
-E
lect
ricity
Soc
ial D
evel
opm
ent F
und
-
1
.59
2
5.00
122
.90
Soc
ial E
lect
rific
atio
n
81.
78
53.5
0
-
-
Roa
d C
onse
rvat
ion,
Ass
ocia
tive
Mic
ro-E
nter
pris
e P
roje
ct (I
DA
343
2-H
O o
f the
IDB
and
Nat
iona
l Fun
ds)
-
-
-
-
DIC
TA
7
4.90
68
.00
62.4
0
60
.30
Jica
tuyo
Riv
er A
gro-
Ent
erpr
ise
Pro
ject
10.
00
7.0
0
20.
05
-R
egio
nal P
rogr
am to
Tra
nsfe
r Pos
t-Har
vest
Bas
ic G
rain
Tec
hnol
ogy
-
1
.17
1.0
5
-
Spe
cial
Foo
d S
ecur
ity P
roje
ct (P
ES
A)
1.40
36
.80
1
7.34
56
.00
Wes
tern
Com
pone
nt o
f the
Nat
iona
l Con
serv
atio
n an
d N
atur
al R
esou
rce
Econ
omic
Dev
elop
men
t P
rogr
am
-
-
2
.65
-
Rei
nfor
cem
ent,
Res
earc
h, S
yste
mat
izat
ion
and
Trai
ning
for R
ural
Dev
elop
men
t Pro
cess
es in
Hon
dura
s
-
1.0
9
-
2.4
Im
prov
ing
Soci
al C
ondi
tions
in R
ural
Are
as
259
.13
1
77.5
7
256
.87
25.5
0 A
llotm
ents
to D
iffer
ent C
omm
unity
Sup
port
Pro
ject
s fo
r the
Poo
r
-
60.0
0
100
.00
25.0
0 C
omm
unity
Dev
elop
men
t Uni
t (U
DE
CO
)
-
4
.50
-
-M
aste
r Pla
n fo
r Nat
iona
l Rec
onst
ruct
ion
(FH
IS)
194
.10
78.9
0
77.
80
-R
ural
Aqu
educ
t San
itatio
n P
roje
ct (P
RO
SA
R)
2.83
2
.42
2.8
1
0
.50
Reg
iona
l Rec
onst
ruct
ion
Pro
ject
for C
entra
l Am
eric
a (P
RR
AC
)
-
6
.95
48.7
7
-
Bas
ic W
ater
and
San
itatio
n S
ervi
ces
for D
ispe
rsed
Rur
al C
omm
uniti
es (F
HIS
)
62.
20
24.8
0
24.
20
-

xx
xii
APP
END
IX D
.1 P
OVE
RTY
SPE
ND
ING
PR
OG
RA
M /
PRO
JEC
T A
REA
20
01
2002
20
03
2004
Fo
od S
ecur
ity E
xten
sion
Pro
ject
(EX
TEN
SA
)
-
3
.30
- 3.
R
EDU
CIN
G P
OVE
RTY
IN U
RB
AN
ZO
NES
4
86.9
0
482
.07
7
92.5
3
646
.06
3.1
Dev
elop
ing
Mic
ro, S
mal
l and
Med
ium
Sca
le E
nter
pris
es
-
-
0
.10
-
-
-
-
3.2
Dev
elop
ing
Inte
rmed
iate
Citi
es
2.60
14
.03
2
2.40
39
.48
Com
preh
ensi
ve U
rban
Ant
i-Pov
erty
Pilo
t Pro
gram
2.
60
14.0
3
22.
40
39.4
8
-3.
3 S
uppo
rt to
Soc
ial I
nter
est H
ousi
ng
200
.30
1
20.9
0
196
.99
1
94.7
8 So
lidar
ity H
ousi
ng R
econ
stru
ctio
n Pr
ogra
m (L
oan
from
Gov
. of C
hina
) 1
23.3
0
43
.90
7
7.00
18
.95
Soc
ial H
ousi
ng P
rogr
am (I
DB
103
7)
-
Foun
datio
n fo
r Urb
an a
nd R
ural
Hou
sing
Dev
elop
men
t (FU
ND
EVI)
-
5.0
0
58.
80
3.9
5 H
ousi
ng s
ubsi
dy
-
60.7
0
-
-
Min
imal
Rur
al H
ousi
ng P
rogr
am
7
7.00
5
.00
5
7.44
1
6.03
U
rban
Hou
sing
Impr
ovem
ent P
rogr
am (P
RIM
HU
R)
-
6.3
0
3
.27
9.6
9 R
ural
Hou
sing
Impr
ovem
ent P
rogr
am
-
0.4
9
-
3.4
Acc
ess
to B
asic
Ser
vice
s in
Prio
rity
Are
as
28
4.00
347
.14
5
73.0
4
411
.80
SA
NA
A
284
.00
3
45.5
0
564
.80
4
07.5
0 W
ater
Qua
lity
Sol
utio
ns P
RO
CA
R
-
2.0
4
-
Pot
able
Wat
er a
nd S
anita
tion
Inve
stm
ent P
rogr
am
-
1.
64
6.2
0
4
.30
4.
INVE
STIN
G IN
HU
MA
N C
API
TAL
4,51
9.11
5
,014
.73
5,6
40.7
8 4
,116
.56
4.1
Bet
ter C
over
age
and
Qua
lity
in E
duca
tion
3,
161.
35
3,3
36.3
9 3
,811
.52
2,9
82.1
6 Ex
pand
ing
Hor
izon
s
18.
70
-
9
.93
16.0
0 Al
l Sch
olar
ship
s an
d Tr
ansp
orta
tion
Bonu
ses
incl
uded
in S
tude
nt B
enef
its
108
.49
1
05.7
0
95.
20
-C
entra
l Lev
el A
ctiv
ities
2
95.4
6
320
.90
7
86.9
0
443
.40
“Tel
e-B
asic
” Pro
gram
5.
30
5.0
0
5
.00
5.9
0 R
epai
r of S
choo
l Bui
ldin
gs
-
-
5
.70
-P
edag
ogic
Ser
vice
s, C
urric
ula,
Edu
catio
nal T
echn
olog
y, T
rain
ing,
Con
tinui
ng E
duca
tion,
and
Spe
cial
E
duca
tion
Pro
gram
s
1
2.30
16
.10
1
6.10
10
.30
Prov
inci
al C
oord
inat
ion
-
37.9
0
38.
30
22.8
0 Tr
ansf
orm
atio
n of
Edu
catio
n w
ith C
omm
unity
Par
ticip
atio
n
-
-
3
.32
35.9
1 Tr
ansf
orm
atio
n of
the
3rd C
ycle
(Mid
dle
Sch
ool)
and
Voc
atio
nal E
duca
tion
-
40
.54
9
6.18
59
.79
Hon
dura
n C
omm
unity
Edu
catio
n P
rogr
am P
RO
HE
CO
1
98.6
0
131
.08
2
22.9
3
316
.55
Dev
elop
men
t of E
duca
tion
in M
argi
nal U
rban
Com
mun
ities
of H
ondu
ras
DE
CU
MH
4.
90
6.9
0
15.
14
1.3
0 E
duca
tion
Pro
gram
on
Eth
ical
, Mor
al a
nd C
ivic
Val
ues
-S
uppo
rt to
Alte
rnat
ive
Prim
ary
and
Mid
dle
Sch
ool E
duca
tion
Pro
gram
s
-
-
40.
74
29.2
0 Fo
rmal
Pre
scho
ol
148
.84
1
89.3
0
196
.33
1
69.5
1 N
ew C
onst
ruct
ion,
Pre
scho
ols
-
-
-
-

xx
xiii
APP
END
IX D
.1 P
OVE
RTY
SPE
ND
ING
PR
OG
RA
M /
PRO
JEC
T A
REA
20
01
2002
20
03
2004
Fo
rmal
Prim
ary
Educ
atio
n 1
,414
.73
1,5
62.6
0 1
,379
.58
1,1
65.3
7 N
ew C
onst
ruct
ion,
Prim
ary
Sch
ools
6.
66
-
-
Adu
lt E
duca
tion
-
9.8
0
8
.90
6.8
0 P
RA
LEB
AH
1.
00
-
15.
50
12.2
0 E
duca
tion
for A
ll (E
FA)
-
-
-
4
.60
EDU
CAT
OD
OS
1st-6
th G
rade
and
7th
-9th
Gra
de
2
6.52
-
2
2.59
2
.80
Voc
atio
nal E
duca
tion
(tech
nica
l)
676
.90
7
66.3
0
703
.00
5
64.6
0 N
ew C
onst
ruct
ion,
Tec
hnic
al S
choo
ls
-
-
-
-
Con
stru
ctio
n, C
ontin
uing
Edu
catio
n
-
-
-
Tech
nica
l Edu
catio
n, C
orre
spon
denc
e C
ours
es
9.60
-
1
9.20
9
.30
Form
al P
rimar
y Sc
hool
s 2
13.3
5
124
.27
1
10.9
8
88
.53
Nat
iona
l Com
mis
sion
on
Non
-For
mal
Alte
rnat
ive
Educ
atio
n
2
0.00
20
.00
2
0.00
16
.80
4.2
Bet
ter a
nd G
reat
er A
cces
s to
Hea
lth S
ervi
ces
1,
357.
76
1,6
78.3
4 1
,829
.25
1,1
34.4
0 D
etec
tion
and
Trea
tmen
t of I
nfec
tious
-Con
tagi
ous
Dis
ease
s
-
-
57.
80
-C
entra
l Lev
el A
ctiv
ities
-
-
3
6.77
46
.41
Out
patie
nt E
pide
mio
logi
cal C
are,
Con
trol o
f Dis
ease
s
741
.14
7
90.1
4
591
.56
3
67.0
8 E
nviro
nmen
tal S
anita
tion
and
Pro
mot
ing
Hea
lth
5
7.35
14
.79
7
0.16
5
3.70
H
ospi
tal C
are
4
99.7
0
727
.02
8
98.1
8
563
.21
Glo
bal F
und
-
-
-
-
Con
stru
ctio
n of
Cen
tral L
abor
ator
y
-
-
-
-
Con
stru
ctio
n, B
uild
ing
Add
ition
s an
d Im
prov
emen
ts
1
6.71
-
8.4
9
-
Tela
and
Dan
lí an
d C
omay
agua
Hos
pita
ls
-
1
07.6
5
0
.01
-W
orld
Foo
d Pr
ogra
m
4.00
4
.00
5
5.32
2
.00
Hea
lthy
Scho
ols
3
8.86
34
.74
1
10.9
6
102
.00
4.3
Cul
tura
l Wea
lth a
nd N
atio
nal I
dent
ity
-
- 5.
ST
REN
GTH
ENIN
G S
OC
IAL
PRO
TEC
TIO
N F
OR
SPE
CIF
IC G
RO
UPS
482.
94
3
74.4
8
406
.21
3
65.9
1 5.
1 S
ocia
l Sec
urity
Net
wor
ks
407
.64
3
30.1
4
327
.18
3
61.1
1 H
ealth
and
Nut
ritio
n Vo
uche
r
60.
20
34.7
0
39.
85
-M
othe
r-Chi
ld V
ouch
er
2
8.00
4
1.44
23.
55
-E
lder
ly V
ouch
er P
roje
ct
1
5.50
6
.70
1
6.50
-
Edu
catio
nal V
ouch
er
4
9.70
62
.10
5
4.35
-
Scho
ol V
ouch
er
3
5.60
42
.48
2
9.92
-
Sch
ool “
Bag
”
2.
60
2.0
0
2
.00
-Fa
mily
Vou
cher
-
2
.10
2
8.19
156
.05
Hel
ping
Han
d Vo
uche
r
5.
20
-
-
-
Inst
itutio
nal S
treng
then
ing
(PR
AF)
42.
85
18.8
0
13.
84
1
04.6
0 Ju
ana
Lecl
erc
Psy
cho-
Ped
agog
ic In
stitu
te
0.29
-
2.0
0
1
.50
Sch
ool f
or th
e B
lind,
Teg
ucig
alpa
, MD
C
0.59
-
1.0
0
0
.75

xx
xiv
APP
END
IX D
.1 P
OVE
RTY
SPE
ND
ING
PR
OG
RA
M /
PRO
JEC
T A
REA
20
01
2002
20
03
2004
S
anpe
dran
o S
peci
al E
duca
tion
Inst
itute
0.
10
-
0
.26
0.2
0 S
ubsi
dy, H
ome
for t
he E
lder
ly (D
anlí)
-
0
.10
0.1
0
0
.10
Hon
dura
n R
ed C
ross
-
2.00
2
.00
2.8
0 H
ondu
ran
Can
cer A
ssoc
iatio
n
3.00
13
.00
6.0
0
4
.80
Reh
abili
tatio
n In
stitu
te fo
r the
Han
dica
pped
0.
40
0.3
2
0
.10
0.3
8 S
anta
Ros
a D
e C
opan
Hom
e fo
r the
Eld
erly
0.
12
0.1
2
0
.12
0.0
8 H
ondu
ran
Gre
en C
ross
0.
20
0.2
0
0
.20
0.1
6 S
ubsi
dy, R
ehab
ilitat
ion
Cen
ter (
Dan
lí)
0.10
0
.10
0.1
0
0
.10
Sub
sidy
, Hog
ar D
el N
iño
Nut
ritio
nal C
ente
r
0.
25
0.2
5
0
.25
0.2
5 Be
ncal
eth
Ref
uge
0.35
0
.44
0.7
0
0
.70
Subs
idy,
Ger
man
May
ner N
ursi
ng In
stitu
te, T
ela
Atlá
ntid
a
-
0
.15
0.1
5
0
.15
San
ta B
arba
ra H
ome
for t
he E
lder
ly
0.30
0
.30
0.3
0
0
.30
Hon
dura
s Te
leth
on
0.60
0
.60
0.6
0
1
.00
Am
igos
De
Los
Niñ
os S
ocie
ty
3.00
3
.00
3.5
0
2
.00
Hon
dura
n Fo
unda
tion
for C
hild
ren
with
Can
cer
1.80
2
.50
2.5
0
1
.25
Oth
er fo
rms
of a
ssis
tanc
e
5
5.49
-
Hon
dura
n In
stitu
te o
n C
hild
ren
and
the
Fam
ily
9
6.40
89
.24
9
2.10
78
.34
Hon
dura
n In
stitu
te fo
r the
Pre
vent
ion
and
Trea
tmen
t of A
lcoh
olis
m
5.00
7
.50
7.0
0
5
.60
-
-
5.2
Gen
der E
quity
and
Equ
ality
-
1
3.13
27.
06
-C
ompr
ehen
sive
Dev
elop
men
t of W
omen
-
12
.02
2
6.38
-
Pro
ject
to H
elp
Rur
al W
omen
Incr
ease
Foo
d P
rodu
ctio
n
Equ
al O
ppor
tuni
ty P
roje
ct fo
r Rur
al W
omen
-
-5.
3 D
evel
opm
ent o
f Eth
nic
Gro
ups
7
5.30
31
.21
5
1.96
4
.80
Sup
port
Pro
gram
for I
ndig
enou
s an
d B
lack
Pop
ulat
ions
(PA
PIN
)
-
0
.61
6.4
8
4
.80
Inno
vativ
e D
evel
opm
ent a
nd S
ocia
l Ass
ista
nce
Fund
(FH
IS)
5
8.50
23
.80
2
7.00
-
Our
Roo
ts (F
HIS
)
16.
80
6.8
0
11.
40
-E
thni
c Im
prov
emen
t
-
-
5.0
0
-
Impr
ovin
g G
arifu
na E
co-T
ouris
m
-
2.0
8
-
-
-
6.
GU
AR
AN
TEEI
NG
TH
E ST
RA
TEG
Y’S
SUST
AIN
AB
ILIT
Y 1,
722.
81
1,1
60.8
0 1
,217
.52
1,2
53.9
9 6.
1 S
tren
gthe
ning
Acc
ount
abili
ty a
nd P
artic
ipat
ory
Dem
ocra
cy
4.75
52
.50
7
4.77
42
.80
Pro
gram
on
Effi
cien
t and
Tra
nspa
rent
Sta
te P
rocu
rem
ents
and
Con
tract
s
4.75
52
.50
7
4.77
42
.80
-
-
6.2
Str
engt
heni
ng J
ustic
e an
d C
itize
n Se
curit
y
-
-
-
12.1
0 C
rimin
al In
vest
igat
ion
Ser
vice
s
-
-
-
2
.60
Pre
vent
ive
Pol
ice
Ser
vice
s
-
-
-
3.
80
Spe
cial
Inve
stig
atio
n S
ervi
ces
-
-
-
5
.70
-

xx
xv
APP
END
IX D
.1 P
OVE
RTY
SPE
ND
ING
PR
OG
RA
M /
PRO
JEC
T A
REA
20
01
2002
20
03
2004
6.
3 M
oder
nizi
ng P
ublic
Adm
inis
trat
ion
and
Dec
entr
aliz
atio
n
1,69
6.05
1
,057
.47
1,0
94.1
6 1
,130
.89
Allo
tmen
ts fo
r Com
mun
ity D
evel
opm
ent P
rogr
ams
1
02.4
0
62
.30
7
8.74
15
.60
Stre
ngth
enin
g Lo
cal I
nstit
utio
ns (F
HIS
)
95.
00
37.8
0
35.
90
-S
uppo
rt to
Tow
ns, V
illage
s an
d C
ounc
ils
5
7.70
20
.00
2
0.00
3
1.00
5%
Mun
icip
aliti
es N
atio
nwid
e 3
50.0
0
400
.00
4
50.0
0
413
.22
Loan
s to
Mun
icip
aliti
es
-
33.6
7
46.
76
1
60.8
4 S
uppo
rt to
Var
ious
Mun
icip
aliti
es
3
9.60
47
.30
2
6.86
10
.54
Mun
icip
al S
ocia
l Inv
estm
ent P
lans
(FH
IS)
1,05
1.35
456
.40
4
35.9
0
499
.70
-
-
6.4
Im
prov
ing
Envi
ronm
enta
l Pro
tect
ion
and
Ris
k M
anag
emen
t
22.
01
50.8
3
48.
59
68.2
0 Te
rrito
rial O
rgan
izat
ion
-
0.7
3
2
.72
0.5
4 C
limat
ic c
hang
es
0.57
0
.22
0.2
6
0
.15
Soc
ial F
ores
try P
rogr
am
0.29
0
.29
0.2
9 D
isas
ter M
itiga
tion
Pro
ject
21.
15
23.8
0
16.
80
23.5
0 N
atur
al R
esou
rce
Man
agem
ent P
rogr
am in
Prio
rity
Wat
ersh
eds
(MA
RE
NA
-DIN
AD
ER
) U
pper
Wat
ersh
ed M
anag
emen
t Pro
gram
, Lem
pa R
iver
N
atur
al R
esou
rce
Man
agem
ent P
rogr
am in
Prio
rity
Wat
ersh
eds
(MA
RE
NA
)
-
-PR
SP to
be
FIN
AN
CED
-
-
TOTA
L PR
OG
RA
MS
AN
D P
RO
JEC
TS
8,75
5.28
8,15
6.85
9,25
5.21
7,28
3.20
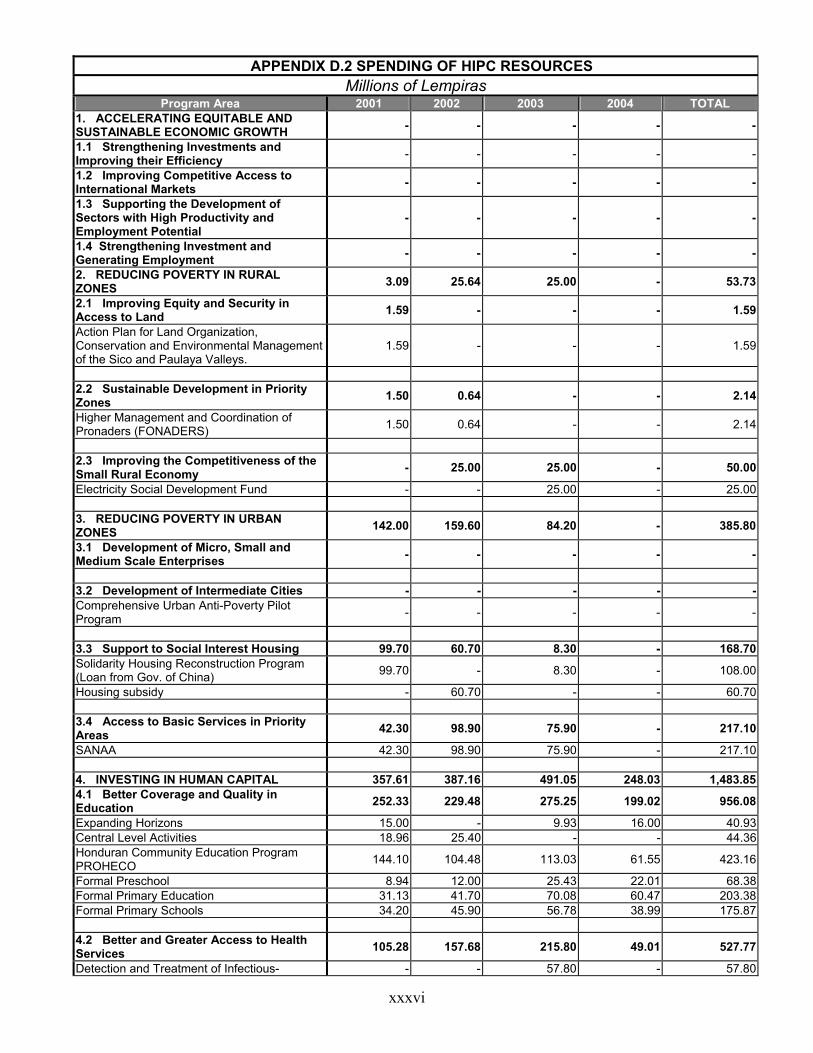
xxxvi
APPENDIX D.2 SPENDING OF HIPC RESOURCES
Millions of Lempiras Program Area 2001 2002 2003 2004 TOTAL
1. ACCELERATING EQUITABLE AND SUSTAINABLE ECONOMIC GROWTH - - - - -
1.1 Strengthening Investments and Improving their Efficiency - - - - -
1.2 Improving Competitive Access to International Markets - - - - -
1.3 Supporting the Development of Sectors with High Productivity and Employment Potential
- - - - -
1.4 Strengthening Investment and Generating Employment - - - - -
2. REDUCING POVERTY IN RURAL ZONES 3.09 25.64 25.00 - 53.73
2.1 Improving Equity and Security in Access to Land 1.59 - - - 1.59
Action Plan for Land Organization, Conservation and Environmental Management of the Sico and Paulaya Valleys.
1.59 - - - 1.59
2.2 Sustainable Development in Priority Zones 1.50 0.64 - - 2.14
Higher Management and Coordination of Pronaders (FONADERS) 1.50 0.64 - - 2.14
2.3 Improving the Competitiveness of the Small Rural Economy - 25.00 25.00 - 50.00
Electricity Social Development Fund - - 25.00 - 25.00 3. REDUCING POVERTY IN URBAN ZONES 142.00 159.60 84.20 - 385.80
3.1 Development of Micro, Small and Medium Scale Enterprises - - - - -
3.2 Development of Intermediate Cities - - - - -Comprehensive Urban Anti-Poverty Pilot Program - - - - -
3.3 Support to Social Interest Housing 99.70 60.70 8.30 - 168.70 Solidarity Housing Reconstruction Program (Loan from Gov. of China) 99.70 - 8.30 - 108.00
Housing subsidy - 60.70 - - 60.70 3.4 Access to Basic Services in Priority Areas 42.30 98.90 75.90 - 217.10
SANAA 42.30 98.90 75.90 - 217.10 4. INVESTING IN HUMAN CAPITAL 357.61 387.16 491.05 248.03 1,483.85 4.1 Better Coverage and Quality in Education 252.33 229.48 275.25 199.02 956.08
Expanding Horizons 15.00 - 9.93 16.00 40.93 Central Level Activities 18.96 25.40 - - 44.36 Honduran Community Education Program PROHECO 144.10 104.48 113.03 61.55 423.16
Formal Preschool 8.94 12.00 25.43 22.01 68.38 Formal Primary Education 31.13 41.70 70.08 60.47 203.38 Formal Primary Schools 34.20 45.90 56.78 38.99 175.87 4.2 Better and Greater Access to Health Services 105.28 157.68 215.80 49.01 527.77
Detection and Treatment of Infectious- - - 57.80 - 57.80

xxxvii
APPENDIX D.2 SPENDING OF HIPC RESOURCES Millions of Lempiras
Program Area 2001 2002 2003 2004 TOTAL Contagious Diseases Outpatient Epidemiological Care, Control of Diseases 105.28 - - 22.40 127.68
Hospital Care - 132.34 102.60 2.61 237.55 Healthy Schools - 25.34 55.40 24.00 104.74 4.3 Cultural Wealth and National Identity - - - - - 5. STRENGTHENING SOCIAL PROTECTION FOR SPECIFIC GROUPS 207.25 192.04 125.89 11.65 536.83
5.1 Social Security Networks 207.25 181.86 125.89 11.65 526.65 Health and Nutrition Voucher 9.46 - - - 9.46 Mother-Child Voucher 27.31 41.44 - - 68.75 Elderly Voucher Project 15.12 6.70 5.60 - 27.42 Educational Voucher 13.36 - - - 13.36 School Voucher 34.73 42.48 - - 77.21 School “Bag” 2.54 2.00 - - 4.54 Family Voucher - - 28.19 11.65 39.84 Helping Hand Voucher 5.07 - - - 5.07 Institutional Strengthening (PRAF) 3.25 - - - 3.25 Honduran Institute for Children and the Family 96.40 89.24 92.10 - 277.74 5.2 Gender Equity and Equality - 10.18 - - 10.18 Comprehensive Development of Women - 10.18 - - 10.18 5.3 Development of Ethnic Groups - - - - - 6. GUARANTEEING THE STRATEGY’S SUSTAINABILITY 150.85 175.90 191.20 12.10 530.05
6.1 Strengthening Accountability and Participatory Democracy - - - - -
6.2 Strengthening Justice and Citizen Security - - - 12.10 12.10
Criminal Investigation Services - - - 2.60 2.60 Preventive Police Services - - - 3.80 3.80 Special Investigation Services - - - 5.70 5.70 6.3 Modernizing Public Administration and Decentralization 150.85 175.90 191.20 - 517.95
Allotments for Community Development Programs 102.40 62.30 68.50 - 233.20
Strengthening Local Institutions (FHIS) - - 1.10 - 1.10 5% Municipalities Nationwide 45.00 50.00 51.60 - 146.60 Municipal Social Investment Plans (FHIS) 3.45 63.60 70.00 - 137.05 6.4 Improving Environmental Protection and Risk Management - - - - -
TOTAL PROGRAMS and PROJECTS 860.80 940.34 917.34 271.78 2,990.26

xxxviii
APPENDIX D.3 ADJUSTED PRSP SPENDING
Millions of Lempiras Original PRSP Spending
HIPC Funds Year National
Funds Loans Donations Paris Club Multilaterals /
Commercial Total HIPC
TOTAL PRSP
SPENDING2001 5,124.8 2,526.7 687.2 0.0 416.5 416.5 8,755.3
2002 5,580.7 1,665.0 443.1 0.0 468.0 468.0 8,156.8
2003 5,850.6 2,026.7 894.2 0.0 483.8 483.8 9,255.2
2004 6,514.6 2,193.8 1,476.8 0.0 538.8 538.8 10,724.0
2004 a/ 6,891.6 2,888.9 580.7 0.0 538.8 538.8 10,900.0
Adjusted PRSP Spending
HIPC Funds Year National
Funds Loans Donations Paris Club Multilaterals /
Commercial Total HIPC
TOTAL PRSP
SPENDING2001 -444.3 0.0 0.0 0.0 444.3 444.3 0.0
2002 -472.3 0.0 0.0 132.4 339.9 472.3 0.0
2003 -433.6 0.0 0.0 547.0 -113.4 433.6 0.0
2004 -552.4 0.0 0.0 598.8 -46.4 552.4 0.0
2004 a/ -552.4 0.0 0.0 598.8 -46.4 552.4 0.0
Adjusted PRSP Spending
HIPC Funds Year National
Funds Loans Donations Paris Club Multilaterals/
Commercial Total HIPC
TOTAL PRSP
SPENDING2001 4,680.5 2,526.7 687.2 0.0 860.8 860.8 8,755.3
2002 5,108.4 1,665.0 443.1 132.4 807.9 940.3 8,156.8
2003 5,417.0 2,026.7 894.2 547.0 370.4 917.3 9,255.2
2004 5,962.3 2,193.8 1,476.8 598.8 492.4 1,091.1 10,724.0
2004 a/ 6,339.2 2,888.9 580.7 598.8 492.4 1,091.1 10,900.0
The treatment of Paris Club debt relief in the analysis of Interim HIPC. After the Paris Club agreement was concluded in April 2004, negotiations began with the IMF and WB regarding the definition and use of HIPC debt relief funds. The product of bilateral debt relief was not originally considered part of the Poverty Reduction Fund, as agreed upon in the Decision Point Document (DPD). However, in practice, the GoH used a large proportion of the fiscal resources released by these agreements to fund spending programs that fall within the scope of the amplified definition of poverty spending adopted in 2004. It was agreed that these resources should be counted as part of HIPC debt relief and should be used to finance social programs under the expanded definition of poverty spending. To ensure inter temporal consistency in the poverty spending data, this implied a concomitant re-assignment of poverty programs that had been funded during 2000-2004, originally classified as having been paid for with national funds, which were re-classified as having been funded by HIPC. The adjustment does not change the amount spent on poverty, but reassigns part of the total from national funds to HIPC. The Table presented in this annex details the adjustments that were made. Concretely, PRSP spending with national resources in 2001-2004, based on the new definition of spending proposed in 2003,1 was reduced in each year by 0.4% of the GDP and spending funded by HIPC was increased by the same amount.
1 See the document, “Poverty Reduction Strategy: First Progress Report and Update,” Chapter V, Tables V1 and V2.

xxxix
At the same time, to permit an undistorted perception of the underlying trends in poverty spending, spending related to post-hurricane reconstruction was also removed from the net poverty spending definition. This reduced total poverty spending by 1.8% of GDP in 2000, 1.9% in 2001 and 1% in 2002. Within these totals, nationally funded poverty spending was adjusted downwards by 0.4% of GDP in 2002, 0.1% in 2001 and 0.2% in 2002.
ADJUSTED PRSP SPENDING Percentage of GDP
Original PRSP Spending HIPC Funds
Year National Funds Loans Donations
Paris Club Multilaterals / Commercial Total HIPC
TOTAL PRSP
SPENDING2001 5.2 2.6 0.7 0.0 0.4 0.4 8.8
2002 5.2 1.5 0.4 0.0 0.4 0.4 7.5
2003 4.9 1.7 0.8 0.0 0.4 0.4 7.8
2004 4.9 1.7 1.1 0.0 0.4 0.4 8.1
2004 a/ 5.1 2.1 0.4 0.0 0.4 0.4 8.1
Adjusted PRSP Spending
HIPC Funds Year National
Funds Loans Donations Paris Club Multilaterals /
Commercial Total HIPC
TOTAL PRSP
SPENDING2001 -0.4 0.0 0.0 0.0 0.4 0.4 0.0
2002 -0.4 0.0 0.0 0.1 0.3 0.4 0.0
2003 -0.4 0.0 0.0 0.5 -0.1 0.4 0.0
2004 -0.4 0.0 0.0 0.45 -0.04 0.4 0.0
2004 a/ -0.4 0.0 0.0 0.45 -0.03 0.4 0.0
Adjusted PRSP Spending
HIPC Funds Year National
Funds Loans Donations Paris Club Multilateral /
Commercial Total HIPC
TOTAL PRSP
SPENDING2001 4.7 2.6 0.7 0.0 0.9 0.9 8.8
2002 4.7 1.5 0.4 0.1 0.7 0.9 7.5
2003 4.6 1.7 0.8 0.5 0.3 0.8 7.8
2004 4.5 1.7 1.1 0.5 0.4 0.8 8.1
2004 a/ 4.7 2.1 0.4 0.4 0.4 0.8 8.1
Gross Domestic Product 2001 99,062.0 2002 108,175.0 2003 118,544.0 2004 132,080.0 2004 a/ 134,511.4 a/ ; New Projection, August 2004, due to change in the GDP and not in revenues from EFA and Global Fund donations.

xl
APPENDIX D.4 DEFINITION OF POVERTY SPENDING The expanded definition of poverty spending in Honduras includes all of the elements that were part of the original version adopted in 2001, and also adds a number of other programs and projects which, during the consultative process carried out in 2003, were identified as relevant to achieving the Poverty Reduction Strategy’s (PRSP’s) goals. This appendix provides a precise definition of the new elements. Original Definition The PRSP’s original definition incorporated in the 2001 PRSC was based on an analysis of the portfolio of projects included in the public spending program (financed with donations and loans) that were in some way related to the PRSP’s six “pillars.” The emphasis of the original definition was on programs and projects financed with external resources and with national counterpart funds corresponding to these projects. Also, a small number of projects financed solely with national resources were included. A financing gap was identified, which had to be covered by additional external resources that would be discussed in meetings with the Consultative Group or other similar structures. This financing gap was distributed among the PRSP’s six programmatic areas in an indicative manner, but no specific interventions with specified costs or results were assigned. In the original version of the PRSP, total spending for the 2001-2015 period was estimated at US$2.665 billion, approximately 2.6% of the GDP. Of this amount, some 60% was to be financed with external resources and donations, 35% with debt relief, and 5% with national funds. In programmatic terms, 1% of the poverty spending would be earmarked for programs aimed at accelerating sustainable and equitable growth, 21% for rural poverty reduction, 17% for urban poverty reduction, 40% for human capital programs (education and health), 10% for social protection and 8% for promoting social, political and environmental promotion of the strategy. During 2001-2002, the list of projects included in the original PRSP document was adjusted to include relevant projects that had originally been excluded; to incorporate new projects negotiated after 2001 (such as EFA and the Global Fund for HIV-AIDS); to exclude some projects that were not related to PRSP goals; and to correct duplications of projects (resulting from the use of different names in the different databases of agencies such as SETCO and SEFIN). New Definition This appendix presents the revised PRSP definition adopted in 2003, which follows: Programs Financed with External Resources
1. The PRSP includes programs and projects financed with external resources that are aimed at achieving specific goals in the program areas identified in the original PRSP document (six programmatic areas and 21 sub-areas). This includes not only investment projects but also projects that finance current spending to help achieve the PRSP goals.
2. Although most of the external financing is earmarked for direct investment, some externally financed
programs are primarily earmarked for current spending. These include the Family Allotment Program, technical assistance programs for small-scale farmers that are administered by PRONADERS via the SAG, and PRIESS, which provides basic medical care in remote rural communities.
3. The decision of which projects to include among the externally financed PRSP projects is made by a
technical committee with representatives from UNAT and SEFIN. The resulting list has been circulated among the interested parties, including civil society representatives, during the consultative process carried out in 2003. Some adjustments have been made to assure the list’s coherency.
Programs Financed with National Funds 4. The national counterpart funds of all PRSP projects that are financed with external resources are
automatically included within the PRSP budget.

xli
5. Capital spending financed by National Funds. Within the investment budget financed with national resources, the main components that are part of the PRSP include:
a. All investments in the Secretariats of Education and Health. b. In SOPTRAVI, investments in low-income housing, the construction and repair of secondary
highways and rural roads, and rural bridges. c. All Secretariat of Agriculture capital investments. d. All FHIS capital investments. e. Capital transfers to the Municipalities to finance their investment programs. f. All transfers to SANAA and other agencies for building potable water and sanitary sewage
systems. g. Capital transfers for expanding electricity and telecommunications coverage in rural and
marginal-urban communities.
6. Current spending financed by National Funds. The expanded definition includes current spending financed by national resources that are relevant to PRSP programmatic areas and fulfillment of its goals.
7. Secretariat of Education. The expanded version includes:
a. Salaries of teachers (excluding central administrative personnel of the Secretariat who are hired
under the Civil Service structure, such as Ministers, Vice-Ministers, Administrators, and other administrative personnel). For purposes of the PRSP, the number of teachers is calculated using data from the Secretariat’s teacher information system (SIARDH) for personnel assigned to non-administrative posts. In addition, data about teachers in administrative posts outside of the central administration (mainly Secondary School Principals, supervisors, technical assistants and Provincial Directors) is obtained from the SEFIN budgetary system. It is expected that all of this information will be consolidated in the SIARDH by 2005. Teacher salaries admissible as poverty spending are calculated at 3.5 times the per capita GDP. This figure was agreed upon with technical staff from the World Bank, based on benchmarks from neighboring countries (El Salvador and Nicaragua). To calculate the per capita GDP, information was obtained from official INE projections. The source for GDP information is the Central Bank. Once the admissible salary amount for PRSP purposes is computed, any remaining amount from total salaries is registered as non-PRSP spending for salaries. However, all salaries for personnel hired to improve the coverage and quality of education—and financed with HIPC debt relief funds—are included.
b. Current transfers and other spending related to developing and financing community education
(PROHECO, AECO and other similar). (Transfers to universities are not included). c. Other programs for developing alternative service delivery systems (including Basic Primary
Schools, Educatodos, and Telebásico for the primary and secondary levels, and programs for specific groups such as ethnic minorities and residents of marginal neighborhoods and rural communities).
d. Economic support programs to promote academic excellence and cover transportation costs, in
order to improve access to education.
8. Secretariat of Health (SS). The expanded version includes:
a. The salaries of personnel providing outpatient medical care, environmental health care and infectious-contagious disease oversight, and those from hospital care programs (excluding central administrative personnel from the Health Secretariat, such as Ministers, Vice-Ministers, administrators and other administrative personnel, not including auxiliary staff from service delivery units). For purposes of the PRSP, the number of medical personnel is calculated using information from the SEFIN budgetary system. The average salary admissible per person is calculated as 5 times the per capita GDP. This figure was agreed upon with technical staff from the World Bank, based on benchmarks from neighboring countries (El Salvador and Nicaragua). To calculate the per capita GDP, information was obtained from official INE projections. The source for GDP information is the Central Bank. Once the admissible salary amount for PRSP purposes is computed, any remaining amount from total SS salaries is registered as non-PRSP spending for salaries. However, all salaries for personnel hired to improve the coverage and quality of health care—and financed with HIPC debt relief funds—are included.

xlii
b. The cost of medicines for outpatient care, environmental health/infectious-contagious diseases
and hospital care. c. The cost of per diems related to implementing basic health programs (outpatient care,
environmental health/infectious-contagious diseases). d. Transfers to finance community programs and other third party contracts to expand and improve
the coverage of basic health care.
9. Secretariat of Agriculture (SAG). The expanded definition includes: a. All spending related to rural development and poverty reduction, but none destined for the
Secretariat’s central administrative costs. b. Transfers to COHDEFOR or other agencies for administering protected areas and watershed
management programs.
10. PRAF. The expanded version includes: a. All current transfers to finance programs aimed directly at beneficiaries, but not including the
program’s central administrative costs.
11. FHIS. The expanded definition includes: a. All current transfers to finance programs that directly reach beneficiaries, but not including the
program’s central administrative costs.
12. Secretariat of the Presidency. The expanded version includes: a. The School Snack program. b. The Healthy School program. c. The program on Efficient and Transparent State Procurements.
13. Secretariat of Public Security.
a. Salaries financed with debt relief funds for additional personnel hired to improve the security
conditions in low-income communities. A complete and detailed list of programs and projects included in the revised PRSP, organized by financial source and economic classification, is attached. This includes time series for previous expenditures and projected spending for the 2001-2007 period.

xl
iii
APP
END
IX E
: CO
NTR
IBU
TIO
NS
BY
CIV
IL S
OC
IETY
IN T
HE
REG
ION
AL
CO
NSU
LTA
TIO
NS:
CEN
TER
EA
ST, S
OU
TH, W
EST,
NO
RTH
, A
TLA
NTI
C S
EAB
OA
RD
AN
D A
GU
ÁN
O
bser
vatio
ns
Prop
osal
s R
egio
n III
. Mac
roec
onom
ic s
ituat
ion
Ther
e is
con
cern
abo
ut th
e im
pact
s th
at C
AFT
A w
ill h
ave
on
natio
nal p
rodu
cers
. •
See
k ov
eral
l ben
efit
for a
ll se
ctor
s (s
mal
l pro
duce
rs, b
ig b
usin
ess)
. •
Gua
rant
ee a
cces
s to
mar
kets
in e
qual
con
ditio
ns a
nd a
djus
t pro
duct
ion
to th
e si
ze o
f the
mar
kets
. •
The
capa
city
of t
he m
ost v
ulne
rabl
e pr
oduc
tive
sect
ors
mus
t be
stre
ngth
ened
to fa
ce th
e ch
alle
nges
of t
he F
TA
Cen
ter E
ast,
Sou
th,
Nor
th, A
tlant
ic
Sea
boar
d,
Wes
t Fa
mily
rem
ittan
ces
• Tr
ain
reci
pien
t fam
ilies
to m
ake
prod
uctiv
e ca
pita
l out
of t
hese
fund
s.
• P
ublic
ize
the
soci
al c
ost o
f the
rem
ittan
ces
(fam
ily d
isin
tegr
atio
n) to
cre
ate
awar
enes
s of
the
prob
lem
.
Cen
ter E
ast,
Sou
th
Red
uctio
n of
pub
lic s
pend
ing
and
grea
ter
effic
ienc
y by
the
in
stitu
tions
•
Get
rid
of
un
nece
ssar
y th
ings
(P
AR
LAC
EN
), re
duce
N
atio
nal
Con
gres
s co
sts,
di
spro
porti
onat
e sa
larie
s,
para
chut
ing,
unn
eces
sary
bur
eauc
racy
. •
Dec
entra
lize
the
assi
gnin
g of
fund
s, c
reat
ing
a le
gal f
igur
e fo
r cha
nnel
ing
fund
s to
regi
onal
pro
ject
s.
Cen
ter E
ast,
Sou
th
Nor
th,
Wes
t
Hon
dura
s ha
s sl
ow g
row
th
The
perc
enta
ge o
f soc
ial s
pend
ing
mus
t be
incr
ease
d.
Atla
ntic
Sea
boar
d S
tabi
lity
and
fisca
l equ
ilibr
ium
as
perm
anen
t sta
te p
olic
ies
• R
atio
nalit
y an
d ef
ficie
ncy
of p
ublic
spe
ndin
g, b
ette
r tax
col
lect
ion
(avo
id ta
x ha
vens
). C
ente
r Eas
t Fi
nanc
ing
for p
rodu
ctio
n
• Ti
mel
y, s
uffic
ient
and
low
inte
rest
rate
s.
• C
reat
e an
d st
reng
then
the
acce
ss m
echa
nism
s to
sof
t loa
ns fo
r the
MIP
YME
.
Cen
ter E
ast,
Sou
th,
Nor
th, A
tlant
ic
Sea
boar
d, W
est
VI. P
rogr
ess
by P
rogr
amm
atic
Are
as
A.
Equi
tabl
e an
d Su
stai
nabl
e Ec
onom
ic G
row
th
The
coun
try c
anno
t rem
ain
isol
ated
from
the
wor
ld tr
end.
•
Cre
ate
the
cond
ition
s th
at s
timul
ate
the
com
petit
iven
ess
of th
e bu
sine
sses
, bas
ed o
n ef
ficie
ncy
and
prod
uctiv
ity o
f in
vest
men
t (R
evie
w o
f the
fisc
al, m
onet
ary
and
finan
cing
pol
icie
s).
Cen
ter E
ast,
Sou
th
E
stab
lish
a st
rate
gy s
o th
at re
sour
ces
will
hav
e an
impa
ct.
Sou
th
• Lo
wer
inte
rest
rate
s an
d ex
tend
fina
ncin
g de
adlin
es.
Sou
th
• Im
prov
e th
e cr
edit
cond
ition
s fo
r use
rs.
Sou
th
• Tr
aini
ng o
f wor
kers
in th
e pr
oduc
tion
of fo
lklo
ric a
rticl
es in
eac
h zo
ne o
f the
cou
ntry
. La
Cei
ba
• Im
prov
e th
e ro
ad in
frast
ruct
ure
of z
ones
with
tour
ist p
oten
tial.
La C
eiba
• Fa
cilit
ate
acce
ss to
wor
king
cap
ital s
o th
at th
e bu
sine
sses
can
bec
ome
mor
e co
mpe
titiv
e.
Sou
th
• It
is n
eces
sary
to g
et m
ore
dona
ted
fund
s.
Cen
ter E
ast
• Th
e H
IPS
reso
urce
s m
ust b
e ge
ared
to fi
nanc
ing
soci
al p
rogr
ams
and
thei
r use
sho
uld
be v
erifi
ed th
roug
h au
dits
. C
ente
r Eas
t
• S
tream
linin
g of
reso
urce
dis
burs
emen
t pro
cess
es, e
limin
atio
n of
bur
eauc
ratic
bar
riers
. C
ente
r Eas
t
• S
treng
then
the
finan
cing
inst
itutio
ns in
sup
port
of th
e pr
oduc
tive
sect
ors
and
hous
ing.
(FO
NA
PR
OV
I, B
AN
AD
ES
A)
Cen
ter E
ast
• Th
ere
shou
ld b
e re
pres
enta
tion
of th
e pr
oduc
tive
sect
ors
with
in B
AN
AD
ES
A a
nd F
ON
AP
RO
VI.
Cen
ter
• Th
e de
stin
y of
reso
urce
s m
ust b
e th
e pr
oduc
tive
sect
or, n
ot th
e in
form
al o
ne
Cen
ter
• Th
e G
over
nmen
t sho
uld
dire
ctly
sup
port
the
soci
al s
ecto
r of t
he e
cono
my
Sou
th
Fina
ncin
g co
nditi
ons
are
not f
avor
able
.
• Th
ere
shou
ld b
e a
prog
ram
in th
e P
RS
P th
at d
evel
ops
the
land
tenu
re o
f the
indi
geno
us a
nd b
lack
peo
ples
. Th
ere
shou
ld b
e le
gal s
ecur
ity in
the
land
and
terr
itoria
l ten
ure
cont
aine
d in
the
ILO
Con
vent
ion
169
C
ente
r Eas
t, S
outh
B.
Red
ucin
g Po
vert
y in
Rur
al Z
ones

xl
iv
Obs
erva
tions
Pr
opos
als
Reg
ion
• C
onso
lidat
e, e
xpan
d an
d st
reng
then
PR
ON
AD
ER
S a
nd P
AC
TA
• A
void
the
polit
iciz
atio
n of
PR
ON
AD
ER
S
• FU
ND
ER
is n
ot fu
nctio
ning
effi
cien
tly
Nor
th -
Wes
t P
RO
NA
DE
RS
, PA
CTA
, FU
ND
ER
• Th
ere
shou
ld b
e cl
ear p
olic
ies
to p
rom
ote
deve
lopm
ent p
roje
cts.
Soc
ial
proj
ects
are
ref
lect
ed o
nly
in s
pend
ing
but
with
no
impa
ct.
• C
ondu
ct s
ocia
l aud
its.
Cen
ter E
ast,
San
Ped
ro S
ula
Pro
blem
in c
oord
inat
ion.
• In
tegr
ate
prod
ucer
s m
ore
into
pro
ject
impl
emen
tatio
n.
Cen
ter E
ast,
• S
treng
then
the
adju
dica
tion,
titli
ng a
nd la
nd c
lean
-up
proj
ects
, and
the
land
title
s sh
ould
be
gran
ted
in th
e na
me
of
the
coup
le (A
gric
ultu
ral M
oder
niza
tion
Law
) S
outh
N
orth
• Th
e st
ate
shou
ld re
duce
the
purc
hase
pric
e of
land
, sin
ce it
is d
iffic
ult f
or p
easa
nts
to c
ompe
te.
Sou
th
• Im
prov
e th
e ac
cess
of s
mal
l and
med
ium
pro
duce
rs to
sup
port
serv
ices
for i
mpr
ovin
g th
eir a
ctiv
ities
. S
outh
N
orth
The
titlin
g pr
ogra
ms
are
inef
ficie
nt
• C
reat
e so
cial
reac
tivat
ion
polic
ies
to a
void
pea
sant
em
igra
tions
to th
e ci
ties.
S
outh
- N
orth
• G
reat
er in
vita
tions
and
par
ticip
atio
n at
all
leve
ls o
f pro
duce
rs.
Cen
tral
Nor
th
• S
treng
then
ing
and
deve
lopm
ent o
f com
mer
cial
izat
ion
chai
ns, t
rain
ing
for p
rodu
cers
and
info
rmat
ion
for c
onsu
mer
s.C
ente
r Eas
t,
• Fa
cilit
ate
acce
ss b
y w
omen
’s g
roup
s (a
gric
ultu
ral,
lives
tock
) to
the
dive
rse
proj
ects
and
to p
rope
rty ti
tles.
S
outh
N
orth
•
The
loca
l mar
ket s
houl
d be
ens
ured
to s
uppo
rt sm
all p
rodu
cers
. S
outh
Agr
o-fo
od
Cha
ins
Pro
gram
s ha
ve
not
been
su
ffici
ently
so
cial
ized
with
the
prod
ucer
s in
gen
eral
.
• C
omm
unity
dev
elop
men
t pro
ject
s m
ust b
e su
stai
nabl
e.
Cen
tral
Supp
ort f
or R
ural
Hou
sing
Pro
gram
s
• M
ore
flexi
ble
cond
ition
s (m
echa
nism
s an
d re
quis
ites)
sho
uld
be p
rovi
ded
to a
cces
s ho
usin
g
Cen
ter E
ast,
Sou
th
Nor
th -
Wes
t •
Edu
cate
and
cre
ate
awar
enes
s in
ben
efic
iarie
s to
enc
oura
ge th
eir p
artic
ipat
ion
(lear
n do
ing)
. C
ente
r Eas
t,
• S
treng
then
and
con
solid
ate
the
prog
ram
. C
ente
r Eas
t, N
orth
•
The
Hou
sing
Pro
gram
s sh
ould
be
adeq
uate
and
sui
tabl
e, w
ith b
asic
ser
vice
s.
Cen
ter E
ast,
Sou
th
Acc
ess
to h
ousi
ng is
diff
icul
t and
infle
xibl
e.
• D
evel
op h
ousi
ng p
rogr
ams
for p
eopl
e w
ho e
arn
less
than
or e
qual
to th
e m
inim
um w
age
Nor
th -
Wes
t
Hou
sing
for t
he z
one
of th
e in
dige
nous
peo
ples
and
Afro
-H
ondu
rans
•
Pro
perty
title
s pr
ovid
ed b
y th
e st
ate
so th
ey c
an b
e us
ed a
s a
bank
gua
rant
ee fo
r hou
sing
fina
ncin
g.
Sou
th
Pro
pose
d m
oder
niza
tion
law
for t
he h
ousi
ng s
ecto
r •
Exp
and
the
supp
ort r
esou
rces
for h
ousi
ng a
nd th
ey s
houl
d be
adm
inis
tere
d by
org
aniz
ed s
ecto
rs o
f soc
iety
N
orth
C
. Pov
erty
Red
uctio
n in
Urb
an Z
ones
St
imul
us a
nd s
uppo
rt to
MIP
YME
PR
SP
is c
onsi
derin
g su
ppor
t to
the
MIP
YME
Th
ere
was
not
eno
ugh
disa
ggre
gatio
n of
the
inte
rven
tions
in
the
MIP
YME
s in
the
docu
men
t.
• R
efle
ct in
the
docu
men
t the
act
ions
impl
emen
ted
to s
treng
then
the
MIP
YME
s.
C
ente
r Eas
t,
The
role
of
peop
le w
ith d
isab
ilitie
s is
not
spe
cifie
d in
the
M
IPYM
E in
terv
entio
ns.
• Im
plem
ent m
icro
-bus
ines
s pr
ogra
ms
with
par
ticip
atio
n by
peo
ple
with
dis
abili
ty.
Cen
ter E
ast,
Atla
ntic
S
eabo
ard
The
tech
nica
l ass
ista
nce
is o
f bad
qua
lity.
•
Sen
d sp
ecia
lized
tech
nici
ans
to th
e ru
ral z
ones
, and
the
proj
ects
sho
uld
aris
e fro
m th
e co
mm
uniti
es th
emse
lves
an
d re
spon
d to
the
natu
re o
f the
pro
duct
ive
reso
urce
s.
Sou
th
Ava
ilabl
e re
sour
ces
for t
he d
evel
opm
ent o
f the
MIP
YME
• A
djud
icat
ion
of fu
nds
to m
icro
bus
ines
ses.
•
Soc
ial a
udit
of th
e fin
anci
al o
rgan
izat
ions
that
sup
port
the
MIP
YME
s.
• S
treng
then
the
natio
nal M
IPYM
Es
to m
ake
them
com
petit
ive.
• H
ave
a co
untry
stra
tegy
to s
uppo
rt th
e M
IPYM
ES
.
Cen
tral
San
Ped
ro S
ula
La C
eiba

xl
v
Obs
erva
tions
Pr
opos
als
Reg
ion
Trai
ning
• P
rovi
de tr
aini
ng to
the
peas
antry
to h
ave
acce
ss to
the
MIP
YME
. •
Giv
e IN
FOP
mor
e su
ppor
t to
prov
ide
train
ing
to th
e pe
asan
try.
• A
ssig
n m
ore
econ
omic
sup
port
to th
e or
gani
zatio
ns o
r ins
titut
ions
ded
icat
ed to
trai
ning
. •
Stre
ngth
ened
the
orga
nize
d w
omen
’s g
roup
s.
Nor
th, W
est,
Atla
ntic
Sea
boar
d S
outh
Com
petit
iven
ess
Pro
gram
s fo
r the
MIP
YME
S
• D
isse
min
ate
the
oppo
rtuni
ties
that
the
Nat
iona
l Cen
ter o
f Agr
ibus
ines
s P
rom
otio
n of
fers
. •
Iden
tify
expo
rt m
arke
t nic
hes
for t
he M
IPYM
ES
. C
opan
PR
SP
co
nsid
ers
supp
ort
to
the
MIP
YME
.
Not
en
ough
di
sagg
rega
tion
of th
e in
terv
entio
ns in
the
MIP
YME
s w
as d
one
in th
e do
cum
ent.
• R
efle
ct in
the
docu
men
t the
act
ions
impl
emen
ted
to s
treng
then
the
MIP
YME
s.
C
ente
r Eas
t
Prom
ote
the
mun
icip
aliz
atio
n of
the
Wat
er a
nd S
anita
tion
Syst
ems
Lack
of s
ocia
lizat
ion
of th
e la
w.
• D
isse
min
ate
the
law
bef
ore
it ex
pire
s.
Cen
ter E
ast
The
mun
icip
aliz
atio
n te
nden
cy is
tow
ard
priv
atiz
atio
n.
• W
ater
boa
rds
mus
t adm
inis
ter t
heir
syst
ems.
•
Fina
ncia
l sup
port
to W
ater
Boa
rds
at a
nat
iona
l lev
el.
Cen
ter E
ast
Cov
erag
e of
the
syst
ems
• A
void
the
priv
atiz
atio
n of
wat
er.
• Im
prov
e th
e co
vera
ge a
nd a
uditi
ng o
f the
cle
ansi
ng a
nd d
istri
butio
n of
wat
er.
• C
ondu
ct p
erio
dic
insp
ectio
ns o
f the
qua
lity
proc
esse
s of
the
wat
er th
e pe
ople
rece
ive.
Wes
t, A
tlant
ic S
eabo
ard
Sou
th
D. I
nves
tmen
t in
Hum
an C
apita
l. Im
prov
e ed
ucat
iona
l qua
lity
at th
e di
vers
e le
vels
A
ppro
ve th
e G
ener
al E
duca
tion
Law
. C
ente
r Eas
t,
• G
ive
parti
cipa
tion
to p
eopl
e w
ith d
isab
ility
in th
e Fr
amew
ork
Edu
catio
n La
w.
Cen
ter E
ast,
• S
uppo
rt th
e pr
ogra
ms
of th
e m
inis
tries
of e
duca
tion,
hea
lth a
nd la
bor i
n th
e se
nse
of in
clud
ing
peop
le w
ith d
isab
ility
C
ente
r Eas
t, Th
e ro
le fo
r sup
port
to p
eopl
e w
ith d
isab
ilitie
s is
not
refle
cted
• R
evie
w o
f org
aniz
atio
ns th
at w
ork
with
dis
abili
ty s
o th
at th
e S
ecre
taria
t of E
duca
tion
can
give
mor
e su
ppor
t and
th
ey c
an b
e su
stai
nabl
e.
Cen
ter E
ast,
Sou
th
• Im
plem
ent t
he s
choo
l BR
EA
KFA
ST
Cen
ter E
ast,
• D
eepe
n th
e re
form
of t
he e
duca
tiona
l sys
tem
. A
tlant
ic S
eabo
ard
• C
ontin
ue th
e pr
ogra
ms
of E
DU
CA
TOD
OS
and
PR
OH
EC
O.
Sou
th
• A
void
par
ty p
oliti
ciza
tion
in th
e ed
ucat
iona
l sys
tem
. S
outh
, La
Cei
ba
• In
crea
se e
duca
tiona
l cov
erag
e in
Cho
lute
ca a
nd V
alle
. S
outh
The
educ
atio
nal s
yste
m is
aw
ful
• E
xpan
d th
e lit
erac
y pr
ojec
ts to
par
ents
in th
e ru
ral z
ones
. S
outh
• In
crea
se th
e re
sour
ces
to e
xpan
d ac
cess
to e
duca
tion
Atla
ntic
Sea
boar
d •
Cre
ate
new
mec
hani
sms
for a
cces
s to
edu
catio
nal s
chol
arsh
ips.
A
tlant
ic S
eabo
ard
• C
reat
e a
diffe
rent
iate
d cu
rric
ulum
for i
nter
cultu
ral,
bilin
gual
edu
catio
n.
Atla
ntic
Sea
boar
d •
Impr
ove
the
sala
ry a
spec
t of t
he te
ache
rs w
ho v
isit
the
mos
t out
lyin
g zo
nes
of th
e co
untry
. A
tlant
ic S
eabo
ard
• Th
e sc
hool
sna
ck s
houl
d be
elim
inat
ed a
nd s
choo
l bre
akfa
st a
nd lu
nch
impl
emen
ted
in th
e ru
ral z
ones
.
Atla
ntic
Sea
boar
d •
Eng
lish
and
com
pute
r cla
sses
sho
uld
be im
plem
ente
d.
Atla
ntic
Sea
boar
d •
Gre
ater
acc
ess
to s
choo
l inf
rast
ruct
ure
in th
e m
ore
rem
ote
zone
s, e
spec
ially
in th
e zo
ne o
f the
Mos
quiti
a.
Atla
ntic
Sea
boar
d •
Alle
viat
e th
e ed
ucat
iona
l bur
den
on p
aren
ts b
y ha
ving
the
gove
rnm
ent a
ssum
e th
e re
spon
sibi
lity
for e
duca
tion
that
co
nstit
utio
nally
cor
resp
onds
to it
. A
tlant
ic S
eabo
ard
• C
hang
e th
e ed
ucat
iona
l pol
icie
s an
d pr
ogra
ms,
as
they
are
obs
olet
e.
Atla
ntic
Sea
boar
d
• Th
e ga
ins
of th
e te
ache
rs s
houl
d be
reco
gniz
ed to
avo
id lo
st c
lass
tim
e.
Atla
ntic
Sea
boar
d

xl
vi
Obs
erva
tions
Pr
opos
als
Reg
ion
• G
radu
atio
n co
sts
shou
ld b
e re
duce
d at
all
educ
atio
nal l
evel
s.
Atla
ntic
Sea
boar
d •
Impr
ove
acce
ss to
tech
nica
l edu
catio
n fro
m th
e pr
imar
y le
vel.
Atla
ntic
Sea
boar
d A
chie
ve g
reat
er e
ffici
ency
and
qua
lity
in th
e he
alth
ser
vice
s A
ctio
ns to
impr
ove
the
prov
isio
n of
hea
lth s
ervi
ces
need
to
addr
ess
both
qua
lity
and
quan
tity
• C
reat
e he
alth
pro
gram
s fo
r atte
ntio
n to
obe
sity
.
Cen
ter E
ast
The
med
ical
team
of t
he M
osqu
itia
isn’
t fun
ctio
ning
. •
Do
an a
udit
of p
osts
to d
epol
itici
ze a
reas
that
dea
l with
hea
lth is
sues
. C
ente
r Eas
t, S
outh
•
Aud
it th
e G
loba
l Fun
d.
Bur
eauc
ratiz
atio
n of
the
Ser
vice
. •
Exe
rcis
e st
rict c
ontro
l ove
r con
tam
inan
ts a
nd p
rodu
cts
that
dam
age
the
popu
latio
n’s
heal
th.
Cen
ter E
ast,
Sou
th
Ther
e ar
e de
lays
in g
ettin
g th
e pr
ogra
ms
unde
rway
. •
Est
ablis
h tru
ly p
reve
ntiv
e ac
tions
. S
outh
• Th
e go
vern
men
t sh
ould
effi
cien
tly s
uppl
y al
l ho
spita
ls a
nd h
ealth
cen
ters
of
urba
n zo
nes
with
med
ical
-hos
pita
l eq
uipm
ent a
nd m
edic
atio
ns.
Cen
ter E
ast,
Sou
th,
Atla
ntic
Sea
boar
d
• In
crea
se th
e bu
dget
ear
mar
ked
for p
reve
ntiv
e m
edic
ine.
C
ente
r Eas
t, S
outh
• C
ontin
ue im
plem
entin
g th
e he
alth
pro
ject
s C
ente
r Eas
t, S
outh
• In
corp
orat
e th
e in
dica
tors
of c
hild
ren
and
adul
ts a
ffect
ed b
y H
IV-A
IDS
and
thei
r im
porta
nce
to p
rodu
ctiv
ity
Cen
ter E
ast,
Sou
th
• Ta
ke th
e he
alth
pro
ject
s to
the
coun
try’s
mos
t ign
ored
and
vul
nera
ble
zone
s.
Cen
ter E
ast,
Sou
th
Ther
e is
hea
lth in
frast
ruct
ure
that
has
nei
ther
hum
an
reso
urce
s no
r med
icat
ions
.
• E
ncou
rage
the
use
of b
irth
cont
rol m
etho
ds to
redu
ce th
e hi
gh b
irth
rate
. S
outh
•
App
oint
doc
tors
in th
e co
untry
’s m
ost r
emot
e zo
nes.
A
tlant
ic S
eabo
ard
• Tr
ain
med
ical
per
sonn
el a
nd o
ther
s in
hum
an re
latio
ns.
Atla
ntic
Sea
boar
d •
Trai
n m
edic
al p
erso
nnel
in th
e in
dige
nous
and
bla
ck z
ones
A
tlant
ic S
eabo
ard
• R
egul
ate
the
phys
icia
ns’ p
rofe
ssio
nal s
ervi
ces
to im
prov
e at
tent
ion
to th
e pe
ople
. A
tlant
ic S
eabo
ard
• S
timul
ate
and
stre
ngth
en tr
aditi
onal
indi
geno
us a
nd b
lack
med
icin
e an
d ot
hers
. A
tlant
ic S
eabo
ard
Hig
h bi
rth ra
te
• P
rom
ote
the
use
of c
ontra
cept
ive
met
hods
. S
outh
E.
Str
engt
heni
ng th
e Pr
otec
tion
of S
peci
fic G
roup
s (A
ttent
ion
to p
eopl
e w
ith e
xtre
me
soci
al v
ulne
rabi
lity)
. N
atio
nal p
olic
y of
Atte
ntio
n to
Dis
abili
ty
Lack
of s
ocia
lizat
ion
of th
e A
ctio
n P
lan.
Tho
se in
tere
sted
are
no
t bei
ng p
artic
ipan
ts.
• Th
e se
ctor
of p
eopl
e w
ith d
isab
ilitie
s m
ust b
e in
volv
ed in
form
ulat
ing
the
Pla
n.
Cen
ter E
ast
Lack
of c
ompl
ianc
e w
ith th
e La
bor L
aw re
ferr
ing
to th
e pa
rtici
patio
n of
thos
e w
ith d
isab
ilitie
s.
• A
ppro
val o
f the
Law
of E
quity
and
Com
preh
ensi
ve D
evel
opm
ent f
or P
eopl
e w
ith D
isab
ility
C
ente
r Eas
t, La
Cei
ba
Ther
e is
a la
w to
pro
tect
the
elde
rly b
ut it
is n
ot h
onor
ed.
•
Writ
e of
f the
fine
s, in
tere
st p
aym
ents
and
pay
men
ts o
n re
al e
stat
e fo
r th
e el
derly
. C
reat
e ce
nter
s of
atte
ntio
n fo
r th
e el
derly
.
Cen
ter E
ast,
La C
eiba
Gen
der E
quity
Pol
icy.
The
re h
as b
een
disc
rimin
atio
n in
di
vers
e ar
eas
(pol
itics
, lab
or a
nd in
telle
ctua
l) •
Gen
der e
qual
opp
ortu
nitie
s sh
ould
be
appl
ied.
C
ente
r Eas
t
• S
uppo
rt th
e na
tiona
l Act
ion
Pla
n fo
r the
era
dica
tion
of c
hild
labo
r C
ente
r Eas
t
• A
ll st
ate
inst
itutio
ns s
houl
d be
gui
ded
in th
e po
licy
on w
omen
. S
outh
• C
omm
itmen
ts s
houl
d ex
ist i
n th
e m
unic
ipal
gov
ernm
ents
tow
ard
the
vuln
erab
le s
ecto
rs.
Sou
th
• P
roje
cts
in g
ener
al s
houl
d be
dep
oliti
cize
d an
d sp
ecifi
cally
thos
e im
plem
ente
d by
the
may
ors’
offi
ces.
S
outh
• Le
gally
regu
late
acc
ess
to e
mpl
oym
ent f
or p
eopl
e ov
er 3
5 ye
ars
old.
A
tlant
ic S
eabo
ard
• Im
plem
ent c
ouns
elin
g at
the
mun
icip
al le
vel o
n be
half
of w
omen
and
the
fam
ily
Atla
ntic
Sea
boar
d •
Incr
ease
the
HIV
-AID
S p
rogr
ams
for s
ocia
lly a
t-ris
k ch
ildre
n A
tlant
ic S
eabo
ard
Agr
eem
ent w
ith A
ctio
n P
lan
for t
he E
radi
catio
n of
Chi
ld L
abor
. Th
ere
has
been
no
genu
ine
impl
emen
tatio
n of
the
prog
ram
s.
• C
reat
e an
aw
aren
ess-
build
ing
prog
ram
for p
rivat
e en
terp
rise.
A
tlant
ic S
eabo
ard

xl
vii
Obs
erva
tions
Pr
opos
als
Reg
ion
• R
espe
ct th
e cu
ltura
l aut
onom
y an
d id
entit
y of
indi
geno
us a
nd b
lack
peo
ples
. A
tlant
ic S
eabo
ard
• D
esig
n pr
ogra
ms
to le
arn
abou
t cul
tura
l div
ersi
ty a
nd d
isse
min
ate
them
at a
nat
iona
l and
inte
rnat
iona
l lev
el.
Atla
ntic
Sea
boar
d •
The
basi
c ne
eds
of in
dige
nous
and
bla
ck p
eopl
e m
ust b
e fu
lfille
d.
Atla
ntic
Sea
boar
d •
Gre
ater
par
ticip
atio
n in
dec
isio
n-m
akin
g A
tlant
ic S
eabo
ard
• C
reat
e an
inst
itute
of B
lack
and
Indi
geno
us P
eopl
e A
tlant
ic S
eabo
ard
F. G
uara
ntee
ing
the
Stra
tegy
’s S
usta
inab
ility
Pa
rtic
ipat
ory
Dem
ocra
cy, J
ustic
e an
d Pu
blic
Sec
urity
A
gree
s w
ith th
e se
curit
y m
easu
res
adop
ted
• A
pply
just
ice
equi
tabl
y C
ente
r Eas
t
Muc
h pr
omot
ion
of th
e im
age
of th
e au
thor
ities
invo
lved
•
Ano
nym
ity o
f witn
esse
s C
ente
r Eas
t
Whi
te-c
olla
r thi
eves
go
free
• Im
prov
e th
e ju
stic
e sy
stem
. S
outh
P
ublic
sec
urity
pro
gram
s ar
e in
effic
ient
•
Cre
ate
adeq
uate
mec
hani
sms
such
as
mot
ivat
ion
and
crea
ting
awar
enes
s in
the
popu
latio
n.
Sou
th
The
secu
rity
polic
y m
ust b
e pr
even
tive
and
not r
eact
ive.
•
Cre
ate
prog
ram
s fo
r the
rein
serti
on o
f del
inqu
ents
into
soc
iety
. S
outh
• C
hang
e th
e el
ectio
n sy
stem
, ele
ctin
g th
e P
resi
dent
, leg
isla
tors
and
may
ors
on d
iffer
ent d
ates
.
•
The
activ
e po
litic
al fo
rces
of t
he z
one
shou
ld b
e th
e di
rect
rep
rese
ntat
ives
in th
e di
ffere
nt s
ecto
rs a
nd n
ot th
ose
who
onl
y ha
ve b
usin
esse
s in
the
zone
but
live
in th
e ci
ties.
S
outh
•
Cre
ate
a ci
vic
cultu
re fo
r the
dem
ocra
tic p
roce
ss th
roug
h ci
vic
educ
atio
n.
Sou
th
Tran
spar
ency
and
Acc
ount
abili
ty
• G
uara
ntee
tran
spar
ency
in a
ll P
ublic
Adm
inis
tratio
n ac
tiviti
es, e
spec
ially
in th
e im
plem
enta
tion
of s
ocia
l pro
gram
s C
ente
r Eas
t C
onst
itutio
n of
TS
C
•
The
Sup
erio
r Acc
ount
s C
ourt
shou
ld fu
lfill
the
func
tions
for w
hich
it w
as c
reat
ed.
Sou
th
• D
emoc
ratic
par
ticip
atio
n by
the
com
mun
ities
in
assi
gnin
g a
fund
s ad
min
istra
tor
for
the
proj
ects
. E
xpan
d ci
vil
soci
ety’
s pa
rtici
patio
n to
thos
e in
volv
ed d
irect
ly.
This
par
ticip
atio
n m
ust b
e re
flect
ed in
the
docu
men
ts.
Cen
ter E
ast
• C
reat
e a
supe
rvis
ory
entit
y w
ithin
the
com
mun
ity.
Sou
th
• A
ttack
cor
rupt
ion
to b
e ab
le to
impl
emen
t the
PR
SP
in a
bet
ter m
anne
r. S
outh
• C
reat
e an
ong
oing
mec
hani
sm fo
r fili
ng c
harg
es to
era
dica
te c
orru
ptio
n at
all
leve
ls.
Sou
th
• Im
prov
e th
e w
ork
of th
e M
unic
ipal
Com
mis
sion
ers
and
assi
gn th
em a
wag
e to
ens
ure
thei
r fun
ctio
ning
and
see
that
th
ey s
ubm
it re
ports
on
thei
r wor
k.
• E
xpan
d th
e tra
nspa
renc
y co
mm
issi
ons
to th
e m
unic
ipal
leve
l. S
outh
• N
ame
the
peop
le w
ho h
old
publ
ic p
osts
bas
ed o
n th
eir c
apac
ity a
nd h
onor
abili
ty to
war
d so
ciet
y.
Sou
th
• Th
e fu
nds
earm
arke
d fo
r soc
ial p
rogr
ams
shou
ld n
ot b
e di
verte
d to
oth
er p
lace
s.
Sou
th
Ther
e ha
s no
t bee
n en
ough
tran
spar
ency
in m
anag
emen
t of
the
reso
urce
s
• A
void
the
paym
ent t
o pe
ople
who
do
not w
ork
(par
achu
tists
) C
ente
r Eas
t, S
outh
G
. Im
prov
ing
Envi
ronm
enta
l Pro
tect
ion
and
Ris
k M
anag
emen
t E
lect
ricity
rate
s ar
e ve
ry h
igh.
•
Take
adv
anta
ge o
f the
pot
entia
l of h
ydric
gen
erat
ion
to re
plac
e th
erm
al g
ener
atio
n.
Cen
ter E
ast,
Sou
th
2. O
ther
act
ions
for F
oste
ring
Econ
omic
and
Soc
ial D
evel
opm
ent
•
Des
ign
a na
tiona
l em
ploy
men
t pol
icy
and
crea
te th
e co
nditi
ons
that
allo
w th
e qu
ality
of e
mpl
oym
ent t
o im
prov
e.
Cen
ter E
ast,
Sou
th
•
Go
to th
e zo
nes
and
do th
e st
udie
s ne
cess
ary
to le
arn
the
cond
ition
s in
ord
er to
gen
erat
e jo
b op
portu
nitie
s.
Sou
th
•
Ens
ure
perm
anen
t em
ploy
men
t and
not
tem
pora
ry c
ondi
tione
d em
ploy
men
t. S
outh
•
Rat
ifica
tion
of in
tern
atio
nal s
ocia
l con
vent
ions
and
trea
ties.
C
ente
r Eas
t
VII.
Med
ium
- and
Lon
g-Te
rm P
lann
ing
Pla
nnin
g an
d P
rogr
amm
ing
• U
rge
appr
oval
of t
he re
form
s to
the
Pub
lic A
dmin
istra
tion
and
Civ
il S
ervi
ce L
aws
• In
form
the
citiz
enry
abo
ut th
e op
portu
nitie
s an
d co
nditi
ons
of in
tern
atio
nal c
oope
ratio
n (e
.g. M
illen
nium
Acc
ount
)
Cen
ter E
ast,
Sou
th,
Wes
t, A
tlant
ic
Sea
boar
d

xl
viii
Obs
erva
tions
Pr
opos
als
Reg
ion
• D
isag
greg
ate
the
proj
ects
by
regi
ons,
in th
e fra
mew
ork
of th
e R
egio
nal S
trate
gy
• Th
e re
quire
men
ts a
nd m
easu
res
for t
he p
roje
cts
are
anno
ying
and
see
m to
be
a st
rate
gy to
avo
id c
oncr
etiz
ing
the
disb
urse
men
t of f
unds
to p
eopl
e
D
ecen
traliz
atio
n •
Gre
ater
par
ticip
atio
n an
d im
plem
enta
tion
oblig
atio
n by
the
mun
icip
al g
over
nmen
ts in
the
PR
SP
impl
emen
tatio
n •
Dec
entra
lizat
ion
of r
esou
rces
for
loca
l pro
ject
s th
at a
rise
out o
f com
mun
ity n
eeds
and
res
pond
to th
e pr
oduc
tive
natu
re o
f the
reso
urce
s (h
uman
and
oth
er)
• G
reat
er s
uppo
rt to
com
mun
ity o
rgan
izat
ions
and
con
stru
ctio
n of
ope
ratio
nal c
apac
ities
at t
he lo
cal l
evel
for d
rafti
ng
prof
iles
of lo
cal p
roje
cts.
Cen
ter E
ast,
Sou
th
Wes
t, N
orth
D
eman
d fo
r Pro
ject
s •
Pro
gram
pla
nnin
g co
nsid
erin
g th
e lo
cal d
eman
ds
• P
artic
ipat
ion
of th
e m
unic
ipal
ities
in th
e in
stitu
tiona
l fra
mew
ork
of th
e P
RS
P
• Fo
cus
prog
ram
s an
d pr
ojec
ts o
n th
e vu
lner
able
gro
ups
(dis
able
d an
d Th
ird A
ge)
• E
stab
lish
a sy
stem
of
Targ
et P
riorit
ies
for
natio
nal d
evel
opm
ent,
focu
sing
on
a C
ount
ry P
lan
that
con
side
rs t
he
need
s an
d av
aila
ble
reso
urce
s.
Cen
ter E
ast,
Sou
th,
Nor
th, W
est
P
rogr
ess
in F
ollo
w-u
p on
Indi
cato
rs
• U
pdat
e th
e di
sagg
rega
ted
indi
cato
rs (h
amle
ts, v
illag
es, c
omm
uniti
es, m
unic
ipal
ities
) •
In-d
epth
revi
ew o
f the
indi
cato
r cla
ssifi
catio
ns (o
f Inp
ut, P
roce
ss a
nd Im
pact
) •
Stre
ngth
enin
g of
the
SIA
FI to
mak
e th
e us
e of
bud
get r
esou
rces
tran
spar
ent
Cen
ter E
ast,
Wes
t
Wes
t
Nor
th
Im
pact
Eva
luat
ion
PS
IA s
tudi
es –
Exp
and
the
Pov
erty
Mea
sure
men
t ins
trum
ents
and
dis
sem
inat
ion
of re
sults
C
ondu
ct e
x-an
te P
SIA
stu
dies
.
Cen
ter E
ast,
Wes
t
Fo
llow
-up
and
Invo
lvem
ent o
f Civ
il S
ocie
ty (S
C)
Link
SC
pla
nnin
g w
ith P
RS
P p
lann
ing
and
the
gove
rnm
ent’s
Nat
iona
l Pla
n E
xpan
d th
e pa
rtici
patio
n of
the
prod
uctiv
e se
ctor
s La
ck o
f rep
rese
ntat
iven
ess
of C
S u
nder
an
expa
nded
sen
se
Fina
ncin
g fo
r the
SC
’s S
ocia
lizat
ion
Wor
ksho
ps
Est
ablis
h co
mm
unic
atio
n ch
anne
ls a
t the
diff
eren
t lev
els
of C
S (l
ocal
, reg
iona
l and
nat
iona
l) P
ublic
ize
the
topi
c an
d m
eani
ng o
f Pla
nnin
g an
d Fo
llow
-up
in p
opul
ar la
ngua
ge.
Cen
ter E
ast,
Sou
th,
Nor
th, A
tlant
ic
Sea
boar
d
VIII.
Mon
itorin
g an
d Ev
alua
tion
Par
ticip
atio
n le
vels
impo
rtant
for t
he fo
llow
-up
to p
olic
ies
and
prog
ram
s.
The
prev
ious
pro
gres
s re
ports
hav
e no
t bee
n di
ssem
inat
ed
enou
gh.
• C
reat
e a
mor
e flu
id, t
rans
pare
nt a
nd p
ublic
info
rmat
ion
syst
em fo
r the
PR
SP
pro
gres
s do
cum
ents
. C
ente
r Eas
t
Sec
tor-
wid
e ro
undt
able
s ar
e a
good
are
na fo
r con
sulta
tion
Com
mun
icat
ion
prob
lem
s w
ith th
e m
embe
rs in
som
e ta
bles
an
d th
ere
isn’
t the
pro
per c
onvo
catio
n.
• Im
prov
e th
e co
mm
unic
atio
n sy
stem
, est
ablis
hing
the
nece
ssar
y m
echa
nism
s.
Cen
ter E
ast
In th
e ca
se o
f the
agr
icul
tura
l rou
ndta
ble,
the
obje
ctiv
es
prop
osed
hav
e no
t bee
n fu
lfille
d.
• Fu
lfill
the
reco
mm
enda
tions
of t
he ro
undt
able
C
ente
r Eas
t
The
SIE
RP
is
a go
od i
nstru
men
t fo
r pr
ovid
ing
follo
w-u
p,
publ
icity
and
soc
ializ
atio
n of
eve
ryth
ing
rela
ted
to P
RS
P.
Littl
e co
vera
ge d
ue to
lim
ited
acce
ss to
com
pute
r tec
hnol
ogy.
• S
treng
then
the
SIE
RP
•
See
k ot
her m
echa
nism
s of
alte
rnat
ive
outre
ach.
•
Soc
ializ
e th
e fu
nctio
ns o
f the
SIE
RP
in d
etai
l •
Stre
ngth
en th
e di
ssem
inat
ion
of R
egio
nal I
ndic
ator
s
Cen
ter E
ast,
Wes
t, A
tlant
ic S
eabo
ard
Nat
iona
l Dia
logu
e is
a g
ood
mec
hani
sm f
or e
xter
naliz
ing
the
publ
ic’s
crit
eria
. It
has
not g
iven
the
resu
lts e
xpec
ted.
•
See
k ad
equa
te m
echa
nism
s so
that
the
resu
lts o
f the
dia
logu
e w
ill b
e fu
lfille
d.
Cen
ter-
Sou
th
Con
sulta
tion
on p
rogr
ess
repo
rts i
s a
good
inf
orm
ativ
e an
d co
nsul
tatio
n m
echa
nism
. Th
e ba
ckgr
ound
info
rmat
ion
rela
ted
• M
aint
ain
cons
ulta
tion
proc
esse
s ab
out t
he fu
ture
PR
SP
pro
gres
s re
ports
C
ente
r Eas
t, W
est

xl
ix
Obs
erva
tions
Pr
opos
als
Reg
ion
to re
ports
I an
d II
was
not
dis
sem
inat
ed.
• Lo
cal e
duca
tiona
l com
mitt
ees
shou
ld b
e fo
rmed
to r
epor
t on
the
PR
SP
impl
emen
tatio
n pr
oces
ses,
as
wel
l as
the
crea
tion
of T
echn
ical
Uni
ts o
f eva
luat
ion
and
mon
itorin
g at
the
loca
l lev
el to
then
add
it to
the
natio
nal l
evel
•
The
info
rmat
ion
is n
ot g
athe
red
in th
e pl
aces
whe
re it
is m
ost n
eede
d
Nor
th, S
outh
, Atla
ntic
S
eabo
ard
• Th
ere
shou
ld b
e m
unic
ipal
con
certa
tion
to le
arn
the
true
need
s of
the
com
mun
ities
.
Sou
th
• Th
ere
shou
ld b
e co
ordi
natio
n am
ong
civi
l so
ciet
y to
con
tinue
with
the
con
sulta
tion
spac
es s
o th
at t
here
is
cont
inui
ty o
f the
PR
SP
inde
pend
ent o
f the
gov
ernm
ent i
n of
fice
at th
e tim
e.
Sou
th
• S
treng
then
the
dia
logu
e an
d co
nsul
tatio
n pr
oces
ses
with
tra
inin
g fo
r th
e S
C’s
gra
ssro
ots
orga
niza
tions
on
the
Gov
ernm
ent P
lans
and
tech
nica
l doc
umen
ts (P
RS
P).
Nor
th,
Sou
th, A
tlant
ic
Sea
boar
d •
Gre
ater
dire
ct p
artic
ipat
ion
by w
omen
in th
e di
alog
ue a
rena
s.
Sou
th
• Th
ere
shou
ld b
e di
rect
par
ticip
atio
n by
the
invo
lved
sec
tors
for t
he fo
rmul
atio
n, im
plem
enta
tion
and
follo
w-u
p of
the
prog
ram
s an
d po
licie
s fra
med
with
in th
e P
RS
P.
Sou
th, A
tlant
ic
Sea
boar
d
It is
reco
gniz
ed th
at th
e pr
oces
ses
of c
ivil
soci
ety
parti
cipa
tion
are
expa
ndin
g.
• A
pplic
atio
n of
1%
of t
he p
roje
ct a
mou
nt fo
r mon
itorin
g by
CS
C
ente
r Eas
t, S
outh
IX
Cha
lleng
es in
the
impl
emen
tatio
n of
the
PRSP
• Th
e N
atio
nal P
RS
P s
houl
d be
ele
vate
d to
a s
tate
pub
lic p
olic
y.
C
ente
r Eas
t, S
outh
• S
treng
then
ing
of th
e or
gani
zatio
nal s
truct
ures
of t
he b
enef
icia
ry s
ecto
rs a
nd v
ulne
rabl
e gr
oups
of t
he P
RS
P.
• P
repa
re a
dis
sem
inat
ion
plan
that
is d
one
thro
ugh
popu
lar p
ublic
atio
ns
Cen
ter E
ast,
Sou
th
• E
nsur
e th
at t
he P
RS
P r
esou
rces
con
sign
ed i
n th
e G
ener
al B
udge
t of
the
Rep
ublic
are
im
plem
ente
d in
the
pr
ogra
ms
and
proj
ects
for w
hich
they
hav
e be
en e
arm
arke
d.
Cen
ter E
ast,
Sou
th
• E
nsur
e th
e co
ntin
uity
of t
he P
RS
P th
roug
h po
litic
al p
acts
with
pre
side
ntia
l pre
-can
dida
tes.
C
ente
r Eas
t, S
outh
• E
ncou
rage
gre
ater
par
ticip
atio
n of
wom
en a
s im
plem
ente
rs o
f the
PR
SP
and
soc
ializ
e th
e in
form
atio
n at
the
loca
l go
vern
men
t lev
el.
Nor
th –
Wes
t
Ens
ure
that
the
PR
SP
reso
urce
s co
nsig
ned
in th
e G
ener
al B
udge
t of t
he R
epub
lic a
re im
plem
ente
d in
the
prog
ram
s an
d pr
ojec
ts fo
r whi
ch th
ey h
ave
been
ear
mar
ked.
N
orth
– W
est
• Tr
ain
lead
ers,
faci
litat
ors
and
othe
r per
sonn
el w
ho c
an m
ake
the
PR
SP
kno
wn
in th
eir r
egio
ns.
Nor
th –
Wes
t •
Incl
ude
in th
ese
regi
onal
con
sulta
tions
repr
esen
tativ
es o
f the
com
pete
nt p
olic
y le
vels
who
hav
e de
cisi
on-m
akin
g po
wer
to b
e ab
le to
pro
vide
firm
resp
onse
s, th
is a
void
ing
disc
oura
gem
ent i
n th
e po
pula
tion,
sin
ce o
pini
ons
are
expr
esse
d th
at a
re n
ot im
plem
ente
d in
thes
e na
tiona
l pol
icie
s.
Nor
th –
Wes
t
• S
treng
then
the
CC
ER
P b
y ha
ving
the
soci
al s
ecto
rs r
epre
sent
ed in
the
deci
sion
-mak
ing
abou
t som
e go
vern
men
t ac
tions
N
orth
– W
est
• Jo
in t
he A
gric
ultu
ral
Rou
ndta
bles
, th
e G
rand
Nat
iona
l D
ialo
gue
and
the
PR
SP
to
have
a v
isio
n of
cou
ntry
de
man
ded
by c
ivil
soci
ety.
C
ente
r Eas
t, S
outh
• S
treng
then
the
civi
l soc
iety
org
aniz
atio
ns, e
spec
ially
the
boar
ds, f
or im
plem
enta
tion
of th
e P
RS
P.
Nor
th -
Wes
t •
Stre
ngth
en t
he i
ndig
enou
s co
mm
uniti
es,
supp
ortin
g th
em i
n th
e dr
aftin
g, e
ditin
g, i
llust
ratin
g, r
epro
duci
ng a
nd
dist
ribut
ing
of te
xts
in th
eir o
wn
lang
uage
. C
ente
r Eas
t, S
outh
C
ontin
uity
in im
plem
enta
tion
of th
e P
RS
P.
• H
old
late
r m
eetin
gs fo
r fe
edba
ck a
nd fo
llow
-up
to th
e C
onsu
ltatio
n P
roce
sses
bei
ng c
ondu
cted
, ens
urin
g si
ncer
e an
d tra
nspa
rent
dia
logu
e be
twee
n th
e go
vern
men
t and
the
regi
on c
onsu
lted.
N
orth
- W
est

l
Obs
erva
tions
Pr
opos
als
Reg
ion
App
rove
Bas
ic L
aws
• G
ener
al W
ater
Law
, bot
h m
ake
poss
ible
the
impl
emen
tatio
n of
the
stra
tegy
of p
aym
ent f
or e
nviro
nmen
tal g
oods
an
d se
rvic
es
• C
ompr
ehen
sive
Law
of P
rote
ctio
n fo
r the
Eld
erly
•
Law
of e
quity
and
com
preh
ensi
ve d
evel
opm
ent o
f peo
ple
with
dis
abili
ty
• R
efor
ms
to th
e A
gric
ultu
ral M
oder
niza
tion
Law
•
Com
preh
ensi
ve L
aw fo
r the
Eld
erly
•
Min
ing
and
Agr
ofor
estry
Law
•
Sim
plifi
catio
n of
the
proc
edur
es fo
r obt
aini
ng p
aten
ts, s
anita
ry re
cord
s, la
bels
and
bar
cod
es
• R
efor
ms
to th
e La
w A
gain
st D
omes
tic V
iole
nce
• A
ppro
val o
f law
s th
roug
h br
oad
cons
ensu
s am
ong
the
diffe
rent
sec
tors
of c
ivil
soci
ety,
gov
ernm
ent a
nd c
oope
rant
s to
avo
id fa
vorin
g pa
rticu
lar i
nter
ests
. •
Rev
iew
the
CN
A L
aw,
inco
rpor
atin
g go
vern
men
t pa
rtici
patio
n, p
artic
ular
ly t
he e
xecu
tive
bran
ch a
nd N
atio
nal
Con
gres
s •
Sim
plify
and
dep
oliti
cize
the
Pub
lic A
dmin
istra
tion
Law
•
Ref
orm
the
Civ
il S
ervi
ce L
aw
• Le
gisl
ate
rega
rdin
g th
e m
ass
med
ia s
o th
at it
can
pub
liciz
e th
e P
RS
P c
orre
ctly
and
ass
ume
a m
ore
info
rmat
iona
l an
d ed
ucat
iona
l rol
e.
• C
reat
e a
law
to
be a
ble
to p
rovi
de f
ollo
w-u
p to
the
PE
DM
pro
cess
es t
hat
oblig
e m
unic
ipal
cor
pora
tions
to
give
th
em c
ontin
uatio
n.
• Le
gisl
atio
n on
Soc
ial A
udits
•
Cre
ate
and
soci
aliz
e a
Law
of P
oliti
cal,
Fina
ncia
l and
Eco
nom
ic T
rans
pare
ncy,
to b
e ab
le to
see
all
gove
rnm
ent
budg
ets,
incl
udin
g th
at o
f the
Pre
side
nt, a
nd N
GO
S
• Th
e P
rope
rty L
aw s
houl
d be
fulfi
lled
Cen
ter E
ast,
Sou
th
C
ente
r Eas
t, S
outh
C
ente
r Eas
t, S
outh
C
ente
r Eas
t, S
outh
S
outh
C
ente
r Eas
t, S
outh
S
outh
S
outh
C
ente
r Eas
t
Wes
t, N
orth
Wes
t, N
orth
W
est
Wes
t
Wes
t
Nor
th
N
orth
Nor
th
Ta
rget
Spe
ndin
g to
Mos
t Vul
nera
ble
Sec
tors
• Im
plem
enta
tion
of th
e N
atio
nal D
isab
ility
Pol
icy
and
mak
e th
e N
atio
nal D
isab
ility
Pla
n av
aila
ble
for i
ts c
onse
nsus
. •
Pro
vide
con
tinui
ty a
nd s
uppo
rt to
pro
gram
s di
rect
ed to
vul
nera
ble
sect
ors,
par
ticul
arly
the
FID
AS
pro
gram
. •
Vis
ualiz
e th
e im
porta
nce
of q
ualit
y, n
ot o
nly
cove
rage
, in
educ
atio
n an
d he
alth
•
Civ
il so
ciet
y sh
ould
hav
e a
cons
ider
able
per
cent
age
of p
artic
ipat
ion
in t
he im
plem
enta
tion
and
eval
uatio
n of
the
P
RS
P p
roje
cts.
•
Sim
plify
adm
inis
trativ
e pr
oced
ures
that
hel
p st
ream
line
the
form
atio
n of
bus
ines
ses
dedi
cate
d to
tour
ism
. •
Elim
inat
e hi
gh le
vels
of p
oliti
ciza
tion
at a
ll its
leve
ls.
• Ta
rget
fund
s fo
r the
dev
elop
men
t of m
icro
bus
ines
s, p
rovi
ding
sof
t cre
dits
and
eas
y ac
cess
con
ditio
ns.
• Ta
rget
PR
SP
fund
s eq
uita
bly
to th
e di
ffere
nt re
gion
s of
the
coun
try, u
sing
inpu
t for
inve
stm
ent i
n pr
ogra
ms
and
proj
ects
with
in th
e re
gion
al P
RS
Ps.
•
See
k su
ppor
t for
the
peas
ant s
ecto
r, em
phas
izin
g pe
asan
t wom
en.
• In
spec
t the
fina
ncia
l acc
ount
s of
the
NG
Os.
•
Trai
ning
of t
he c
omm
uniti
es in
pro
ject
form
ulat
ion
and
prep
arat
ion
• G
enui
nely
mak
e us
e of
the
bene
fits
of th
e pr
ogra
ms
and
proj
ects
bei
ng im
plem
ente
d an
d de
taile
d in
the
docu
men
ts.
• D
irect
ly b
enef
it th
e ho
mel
ess
with
the
hous
ing
proj
ects
Cen
ter E
ast
C
ente
r Eas
t, S
outh
S
outh
S
outh
Sou
th
N
orth
– W
est
Nor
th –
Wes
t
Nor
th –
Wes
t
Nor
th –
Wes
t N
orth
– W
est
Nor
th –
Wes
t N
orth
– W
est
Nor
th -
Wes
t A
lign
Pub
lic In
vest
men
t and
Ext
erna
l Coo
pera
tion
• P
rovi
de c
ontin
uity
to th
e se
ctor
-wid
e ro
undt
able
s an
d in
corp
orat
e re
gion
al ro
undt
able
s •
Rea
ctiv
atio
n of
the
Dep
artm
enta
l Dev
elop
men
t Cou
ncils
and
thei
r in
corp
orat
ion
into
the
proc
esse
s of
the
sect
or-
wid
e ro
undt
able
s.
• A
void
the
Inte
rnat
iona
l Org
aniz
atio
ns w
orki
ng w
ithou
t coo
rdin
atin
g w
ith th
e G
over
nmen
t, to
wor
k on
the
prio
ritie
s.
• C
reat
e lo
cal s
truct
ures
for f
ollo
w-u
p on
pro
gram
s an
d pr
ojec
ts o
f ext
erna
l coo
pera
tion.
•
Cre
ate
an o
rgan
ism
for a
ssoc
iatin
g al
l the
NG
Os
and
they
sho
uld
coor
dina
te to
be
acco
unta
ble
for t
heir
wor
k.
• A
lign
supp
ly a
t the
nat
iona
l lev
el, o
rder
ing
ours
elve
s in
tern
ally
firs
t to
then
cre
ate
orde
r at t
he in
tern
atio
nal l
evel
•
The
mun
icip
aliti
es s
houl
d pr
esen
t the
ir an
nual
inve
stm
ent p
lan
to th
e G
17 to
sol
icit
the
perc
enta
ge th
ey a
re s
hort.
•
Impr
ove
the
capa
city
to lo
wer
the
debt
•
Ther
e sh
ould
be
a lin
k be
twee
n th
e P
RS
P a
nd th
e M
illen
nium
Goa
ls p
ropo
sals
Cen
ter E
ast
Cen
ter E
ast
Sou
th
S
outh
S
outh
N
orth
– W
est
N
orth
– W
est
Nor
th –
Wes
t

li
Obs
erva
tions
Pr
opos
als
Reg
ion
• R
eorie
nt n
atio
nal r
esou
rces
so
that
we
do n
ot d
epen
d on
ly o
n fo
reig
n re
sour
ces
for p
roje
ct im
plem
enta
tion.
Nor
th –
Wes
t N
orth
- W
est
Arti
cula
te L
ocal
Sup
ply
and
Dem
and
in th
e Fr
amew
ork
of th
e P
ED
Ms
• C
reat
e tra
nspa
renc
y in
reso
urce
use
by
the
loca
l gov
ernm
ent,
whe
re C
ivil
Soc
iety
has
to a
ct to
ver
ify th
is th
roug
h th
e C
ivil
Soc
iety
Tra
nspa
renc
y C
omm
issi
ons
at a
ll go
vern
men
t lev
els
(loca
l and
cen
tral),
Nat
iona
l Con
gres
s, c
usto
ms,
et
c.
• D
eman
d be
tter u
se o
f the
tim
e pa
id to
pub
lic e
mpl
oyee
s, te
ache
rs, p
hysi
cian
s, e
tc.,
and
mon
itorin
g of
it.
• S
eek
an e
ntity
, soc
ial a
udit
mec
hani
sms
and
com
mun
ity p
artic
ipat
ion
whe
n im
plem
entin
g a
proj
ect t
o de
mon
stra
te
trans
pare
ncy.
•
Elim
inat
e th
e pu
blic
ity c
ampa
igns
of c
andi
date
s to
pop
ular
ly e
lect
ed p
osts
with
sta
te m
oney
.
Nor
th –
Wes
t
Nor
th –
Wes
t
Nor
th –
Wes
t
Nor
th -
Wes
t
Pre
pare
d ba
sed
on th
e co
ntrib
utio
ns o
f the
gro
ups
in th
e C
ente
r-E
ast,
Sou
th, N
orth
(San
Ped
ro S
ula)
and
Wes
t reg
ions
. 18
/01/
05