homeland united states security coast guard · hc-130j missionized c-130 long-range reconnaissance...
TRANSCRIPT
Report of the International Ice Patrol in the North Atlantic
2012 Season Bulletin No. 98 CG-188-67
United States Coast Guard
Homeland Security


1
International Ice Patrol 2012 Annual Report
Contents
Abbreviations and Acronyms .........................................................................................2
Introduction ......................................................................................................................3
Summary of Operations ..................................................................................................4
Iceberg Reconnaissance and Oceanographic Operations ......................................... 12
Ice and Environmental Conditions ............................................................................... 20
Monthly Sea-Ice Charts ................................................................................................. 39
Semimonthly Iceberg Charts ........................................................................................ 45
Acknowledgements ....................................................................................................... 60
Appendix A: Ship Reports for Ice Year 2012 .............................................................. 61
Appendix B: NAIS Harmonization ............................................................................... 62
Appendix C: Nais Joint Reconnaissance Strategy .................................................... 70
Appendix D: BAPS Replacement ................................................................................. 73
Appendix E: Titanic Centennial Commemoration ...................................................... 76
To order past IIP Annual Reports, use the form provided inside the back cover
Cover: Titanic Centennial Commemoration Art, Mr. Chris Rose, COMDT (CG-1313).

2
Abbreviations and Acronyms
AIS Automated Information System
AOR Area of Responsibility
ATC Aviation Training Center
BAPS iceBerg Analysis and Prediction System
C-130J Non-missionized C-130 long-range reconnaissance aircraft
CALIB Compact Air-Launched Ice Beacon
CAMSLANT Communications Area Master Station Atlantic
CCG Canadian Coast Guard
CIS Canadian Ice Service
D1 First Coast Guard District
ECAS Air Station Elizabeth City
ELTA Brand name of radar system on HC-130J
FY Fiscal Year
HC-130J Missionized C-130 long-range reconnaissance aircraft
HC-144A Medium-range Maritime Patrol Aircraft
HF High Frequency
IIP International Ice Patrol
IDS Iceberg Detection Software
IRD Ice Reconnaissance Detachment
KT Knot or Nautical Mile Per Hour
M Meter
MB Millibar
MCTS Marine Communications and Traffic Service
M/V Motor Vessel
NAFO Northwest Atlantic Fisheries Organization
NAIS North American Ice Service
NAO North Atlantic Oscillation
NIC National Ice Center
NM Nautical Mile
NWS National Weather Service
OPCEN Operations Center
PAL Provincial Aerospace Limited
RADAR Radio Detection and Ranging (also radar)
SAR Synthetic Aperture Radar
SOLAS Safety of Life at Sea
SST Sea Surface Temperature
WOCE World Ocean Circulation Experiment

3
Introduction This is the 98th annual report of the International Ice Patrol (IIP). IIP was under the operational control of Commander, U.S. Coast Guard First District. The report contains information on IIP operations, environmental conditions, and iceberg conditions in the North Atlantic during 2012. The Ice Patrol was formed after the RMS Titanic sank on 15 April 1912. Since 1913, except for periods of World War, Ice Patrol has monitored the iceberg danger near the Grand Banks of Newfoundland and has broadcast the Iceberg Limit to mariners. The activities and responsibilities of IIP are delineated in U.S. Code, Title 46, Section 80302 and the International Convention for the Safety of Life at Sea (SOLAS), 1974. IIP conducted aerial reconnaissance from St. John’s, Newfoundland to search for icebergs in the North Atlantic and Labrador Sea. In addition to IIP reconnaissance data, Ice Patrol received iceberg reports from other aircraft and mariners in the North Atlantic. At the Operations Center (OPCEN) in New London, Connecticut, personnel analyzed iceberg and environmental data and used the iceberg Analysis and Prediction System (BAPS) computer model to predict iceberg drift and deterioration. Based on the model’s prediction, IIP produced a daily ice chart and text bulletin in 2012 under the North American Ice Service Collaborative Arrangement. In addition to these routine broadcasts, IIP responded to individual requests for iceberg information. RADM Daniel A. Neptun was Commander, U.S. Coast Guard First District through May 2012 when he was relieved by RDML Daniel B. Abel. CDR Lisa K. Mack was Commander, International Ice Patrol. For more information about the International Ice Patrol, including historical and current ice bulletins and charts, visit our website at www.navcen.uscg.gov/IIP.

4
Summary of Operations The International Ice Patrol monitors iceberg danger in the North Atlantic as mandated by the International Convention for the Safety of Life at Sea. IIP works within a collaborative arrangement with the Canadian Ice Service (CIS) and the U.S. National Ice Center (NIC) formally titled the North American Ice Service (NAIS). The mission of NAIS is to leverage the strengths of the three services to monitor and provide the highest quality, timely and accurate ice analysis, in order to meet the needs of maritime interests. Following successful harmonization of the iceberg chart between CIS and IIP in 2011, continued harmonization efforts were implemented in 2012 with an improved product distribution process. Previously, IIP products were distributed through various e-mails and file transfer protocols (FTP), manually intensive processes prone to error. Now, daily NAIS products are distributed through the product distribution system (PDS) operated by CIS. All products generated by IIP are sent to CIS via one FTP for distribution through the PDS (Figures 1 and 2). The PDS converts and distributes the products to IIP customers via e-mail and FTP. The lone exception is the chart to the National Weather Service (NWS). The PDS is not able to convert the NAIS Iceberg Chart into the file format that NWS requires for broadcast. IIP developed a script that converts the chart and distributes it via FTP directly to NWS. IIP utilization of the CIS PDS was a significant step forward towards harmonization and continuity of operations between the services. More details on the harmonization efforts are included in Appendix B.
Figure 1. Text product distribution flowchart.
5
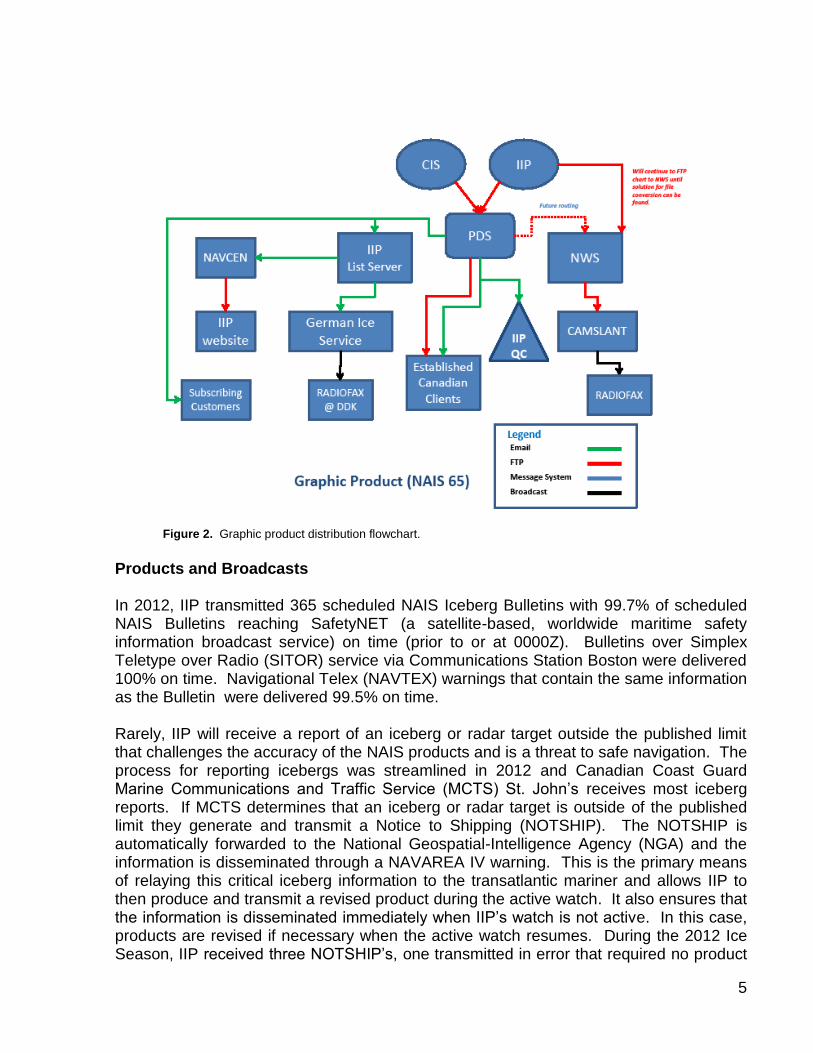
Figure 2. Graphic product distribution flowchart.
Products and Broadcasts In 2012, IIP transmitted 365 scheduled NAIS Iceberg Bulletins with 99.7% of scheduled NAIS Bulletins reaching SafetyNET (a satellite-based, worldwide maritime safety information broadcast service) on time (prior to or at 0000Z). Bulletins over Simplex Teletype over Radio (SITOR) service via Communications Station Boston were delivered 100% on time. Navigational Telex (NAVTEX) warnings that contain the same information as the Bulletin were delivered 99.5% on time. Rarely, IIP will receive a report of an iceberg or radar target outside the published limit that challenges the accuracy of the NAIS products and is a threat to safe navigation. The process for reporting icebergs was streamlined in 2012 and Canadian Coast Guard Marine Communications and Traffic Service (MCTS) St. John’s receives most iceberg reports. If MCTS determines that an iceberg or radar target is outside of the published limit they generate and transmit a Notice to Shipping (NOTSHIP). The NOTSHIP is automatically forwarded to the National Geospatial-Intelligence Agency (NGA) and the information is disseminated through a NAVAREA IV warning. This is the primary means of relaying this critical iceberg information to the transatlantic mariner and allows IIP to then produce and transmit a revised product during the active watch. It also ensures that the information is disseminated immediately when IIP’s watch is not active. In this case, products are revised if necessary when the active watch resumes. During the 2012 Ice Season, IIP received three NOTSHIP’s, one transmitted in error that required no product

6
revision, one significantly expanding the limit in early February, and one radar target outside the published limit. Only the significant expansion required a revision of the Iceberg Limit. As a result, the Iceberg Limit accuracy for the 2012 Ice Season was 99.5%. Iceberg Reports A critical factor contributing to IIP’s successful safety record is the support received from the maritime community. This support is measured annually by the number of voluntary iceberg reports IIP receives from the maritime community in a fiscal year (FY). In order to more efficiently serve the maritime community, IIP modified the reporting process in 2012. In consideration of reliable oceanographic information resources, IIP no longer solicits for stand-alone sea surface or water temperature reports as in years past and is solely requesting iceberg reports. Ship reports remain a critical source of information and IIP encourages vessels transiting within or near the Grand Banks of Newfoundland to report iceberg sightings in a timely manner. Receiving on-scene and near real-time information further enhances the accuracy of IIP products. IIP recognizes the vessel submitting the most iceberg reports for the year with the Carpathia Award (Appendix A).
Figure 3. Percentage of iceberg reports, reported icebergs incorporated into model, and reports of limit
setting icebergs by reporting source in 2012. As mentioned above, the process for submitting iceberg reports was streamlined in 2012 to improve effectiveness. Iceberg reports are now consistently being sent to Canadian Coast Guard MSCTS St. John’s via Inmarsat satellite or other means. The IIP Operations Center received, analyzed, and processed 370 iceberg reports (Figure 3,

7
column1), primarily via MCTS. The 370 iceberg reports were approximately double the 188 reports in 2011 primarily due to the moderate season in comparison to the light season in 2011. Commercially contracted reconnaissance by Provincial Aerospace Limited (PAL) provided 147 (38%) iceberg reports. Satellite reconnaissance was responsible for the second highest number of iceberg reports at 83 (22%). Merchant ships tallied the third highest number with 77 (20%). IIP aerial reconnaissance flights provided 27 (7%) and the Canadian Government, including Canadian Coast Guard vessels, Canadian Forces aircraft, and lighthouse operators, combined to deliver 43 (11%) iceberg reports. Various other sources, including scientific research vessels, fishing vessels, and one passenger vessel combined to relay the remaining 7 (2%) iceberg reports. The iceberg reports contained 6773 icebergs, growlers, bergy bits or radar targets, 5437 of which were incorporated (added or re-sighted) into the IceBerg Analysis and Prediction System (BAPS), the application that runs the iceberg drift and deterioration model. All iceberg reports are evaluated for accuracy and viability, accounting for the disparity between objects reported vice those incorporated into the model. Several factors are considered during this evaluation, including atmospheric and oceanographic conditions, recent reconnaissance in the area, method of detection, and any other amplifying information relayed with the ice report. This standard is applied to all ice reports, even IIP’s own reconnaissance, to ensure that accurate iceberg products are being broadcast to the maritime community. The percentage of updates to BAPS by reporting source is portrayed in Figure 3, Column 2. Commercial flights (56%) provided the majority of the information incorporated into BAPS this year. Icebergs used to establish the limit are of critical importance because they define the boundary for ice-free ship navigation. As a result, the majority of IIP’s reconnaissance missions focus on this boundary. IIP flights accounted for 42% of all limit-setting iceberg sightings or detections as shown in Figure 3, Column 3. PAL flights (42%) made an equivalent contribution to sightings of limit-setting icebergs. Satellite Reconnaissance In an effort to build confidence in incorporating satellite reconnaissance into operations, IIP continued satellite data ground truth comparisons in 2012. Last year, IIP ordered 81 Radarsat-2 (RSA2) images for acquisition and processing. NIC further supplemented this image tally by funding 100 TerraSAR-X (TSX) images. IIP also contracted C-CORE to process ~50 images to assist in an assessment of current SAR capabilities. The output from C-CORE is a coded message that is ingested directly into BAPS. This contract was awarded during fiscal year (FY) 2012 so that unused funds could be applied to the 2012 season as well. IIP received satellite messages from three different satellites, Radarsat-1 (RSA1), RSA2, and TSX, using various modes of search. These images were not used operationally due to time latency (IIP, 2011). For 2011 some basic comparisons between the satellite systems and modes tested could be documented however, due to an extremely light iceberg season, ordering conflicts, weather and aircraft issues, no aircraft ground truth information could be collected during the 2011 effort.

8
Figure 4: Satellite ordering and use flow chart.
During 2012, IIP worked with C-CORE again to expend the remainder of the funding, applying the same planning process as that used during the 2011 season. Figure 4 schematically shows the process followed to acquire satellite information for incorporation into IIP daily operations. IIP successfully collected ground truth data on four different dates for comparison to C-CORE derived iceberg information from RSA2 imagery. The first image was collected on 29 April using the Fine mode (50 km swath, ~7 m resolution). Though an IIP under-flight was scheduled on this date, the flight was cancelled due to a medical issue with a critical aircrew member. Fortunately, a PAL flight occurred a few hours after the satellite pass with excellent results. Figure 5 shows three PAL targets and three C-CORE/RSA2 targets with an approximately 3.5-hour time difference. The differences in position for these targets are consistent with expected iceberg drift during this short time period.
Figure 5: Satellite comparison results for 29 April 2012.
RSA2 Fine mode vs. PAL aerial reconnaissance.
9
The next image could not be collected until 26 May due to multiple conflicts with other satellite users, using the Wide-Fine mode (150 km swath, ~7 m resolution) with mixed results (several missed or improperly identified targets). The reason for the difference in performance between the 29 April and 26 May images is the subject of further IIP analysis. On 09 June, IIP collected ground truth data for another Fine mode satellite image. This image was collected in an area where IIP expected to see a mixture of icebergs and ships near the Grand Banks oil production facilities. However, no icebergs had drifted into the scene by the time of the satellite pass. Further, conducting an under-flight near the facilities created a challenging safety of flight environment while attempting to descend to identify and document iceberg targets in the vicinity of multiple aircraft and vessels servicing the oil rigs. Even though their were no icebergs, the comparison between satellite derived information and aircraft observations was excellent for targets present, i.e., the satellite did not report any false iceberg targets and only missed three out of 19 vessels sighted. On 08 July, IIP collected ground truth data further north between 52oN and 55oN along the southern Labrador coast. This image was also collected in the Fine mode (50 km swath, ~7 m resolution) with mixed results: there were several instances of missed satellite targets along with false positives. There were several factors that may have influenced the quality of this comparison to include the proximity to land and the presence of several clusters of growlers in the scene. Finally, at IIP’s request C-CORE processed a series of images along the Labrador coast that were requested in support of CIS iceberg reconnaissance on 8 days during the month of September. While there was no ground truth available for these images, some comparisons have been performed between the C-CORE Iceberg Detection Software (IDS) algorithm and a CIS analyst. IIP received multiple reports from C-CORE through their Iceberg Finder program. Together with the research reports described above, C-COREs satellite derived messages contained 934 reports of icebergs, 13.8% of the total icebergs reported in 2012. These reports were analyzed and processed, with assistance from Maritime Intelligence Fusion Center Atlantic (MIFC LANT) and ship information reports IIP received from other sources, allowing IIP to add or re-sight 614 icebergs, showing a presumed accuracy rate of 65.7%. Of the 614 icebergs used, 47 of them were used to set the iceberg limit, 5.2% of total limit-setting bergs.
IIP plans to dedicate several flights during the 2013 season to collect additional ground truth data to document the satellite detection and identification effectiveness and to guide an eventual transition to a mix of reconnaissance that relies more on satellites than aerial reconnaissance. IIP is in the process of analyzing data from both 2011 and 2012 and will document results in a more detailed technical report that will be provided as an Appendix to the 2013 Annual Report.

10
Historical Perspective To determine the severity of the Ice Season, IIP uses two traditional measurements. The first measurement is the number of icebergs crossing south of 48°N. This number includes icebergs initially sighted or detected south of 48°N as well as those originally sighted or detected further north that drifted south, as modeled by BAPS. The second measurement is season length, measured in the number of days that there were icebergs south of 48oN. Prior to 2011, the definition of season length was the period between decisions by Commander, International Ice Patrol to open and close the season. In 2012, 499 icebergs (not including bergy bits or growlers) were modeled to have drifted south of 48°N. These icebergs were reported and/or modeled south of 48°N from 17 March through 02 July, a season length of 109 days. The time period from 1983 through the present represents IIP’s modern era, when aircraft equipped with radars were used for iceberg reconnaissance. Figure 6 compares the number of icebergs south of 48oN (blue columns) and season length in days (red line) for this time period. The average number of icebergs south of 48°N during this period is 775.
Figure 6: Number of icebergs south of 48
oN (blue columns) and season length in days (red line),1983-present.
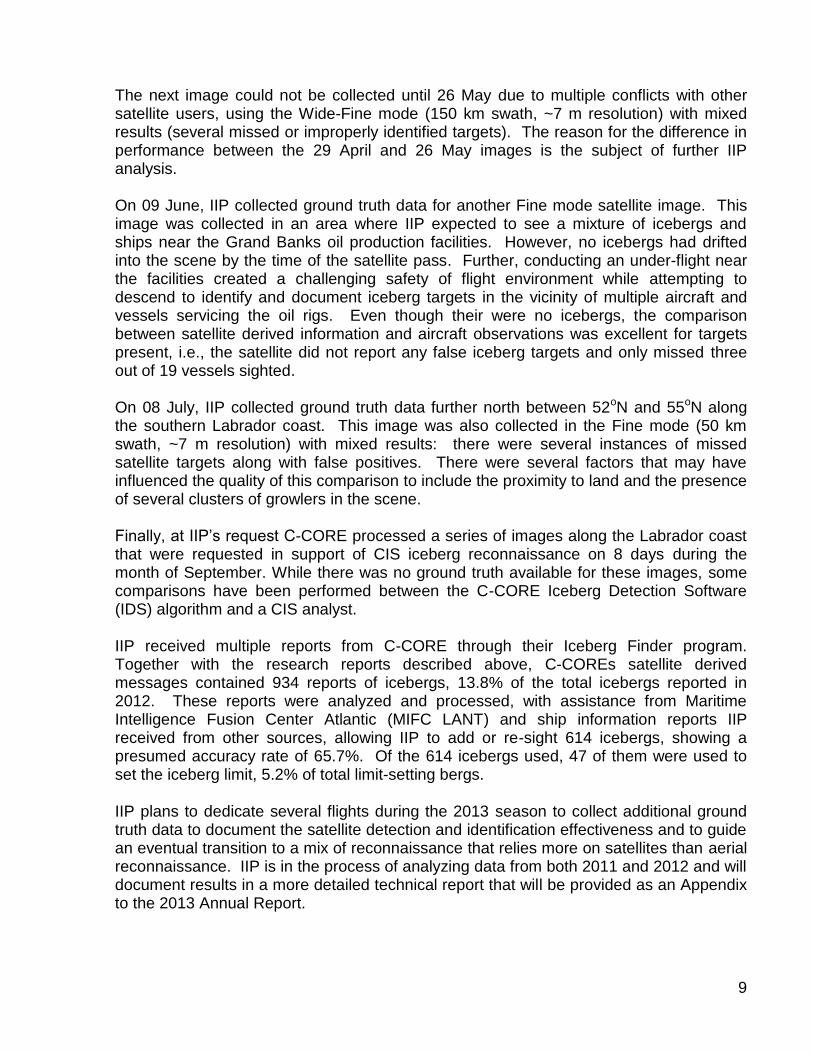
Customer Behavior Throughout the 2012 season, IIP monitored shipping traffic in the vicinity of the iceberg limit to gain insight into customer behavior. Several times per week, IIP staff performed a cursory review of the publicly available ship tracking webpage, http://www.sailwx.info/. In some instances, vessels appeared to maneuver to remain outside of the iceberg limit while others sailed through the warning area. In an effort to more systematically observe customer behavior, the IIP Program Manager at USCG Headquarters requested support from MIFC LANT. Using commercially available Automatic Identification System (AIS) broadcasts, MIFC LANT conducted an unclassified vessel traffic analysis in IIP’s area of responsibility off the Grand Banks for the period from 01 February through 03 June 2012. Figure 7 provides an excerpt from the MIFC LANT analysis on 15 May 2012 (right panel)
11
together with the IIP product for the same date (left). The small red square shows the approximate location of the Hibernia oil production facility.
Figure 7: NAIS Iceberg Limit (left panel) and excerpt from MIFC LANT Analysis for 14-16 May 2012 (right panel).
While it appears that there is significant vessel traffic remaining outside of the iceberg limit and a high traffic density between the Hibernia platform and St. John’s, it is difficult to state with any certainty the motivation for vessels to sail through the warning area without further analysis. To improve understanding of customer behavior, IIP has contracted Shearwater, LLC during FY 2012 to better identify customers and obtain insight into their behavior. Results of this study will be available after the 2013 season. Canadian Support The Canadian Government continued to provide excellent support, particularly in continued product and process harmonization efforts. CIS freely shared valuable reconnaissance data, environmental data from the Canadian Meteorological Centre, iceberg and information reports from Canadian Coast Guard and Canadian Forces assets, and their expertise regarding icebergs and sea ice. Additionally, CIS has significantly contributed to developing criteria for the iceBerg Analysis and Prediction System (BAPS) replacement. Both IIP and CIS rely on this modeling software to estimate where icebergs are located during the periods between reconnaissance. The BAPS replacement project is discussed further in Appendix D.
UNCLAS

12
Iceberg Reconnaissance and Oceanographic Operations
Ice Reconnaissance Detachment The Ice Reconnaissance Detachment (IRD) is a sub-unit under Commander, International Ice Patrol, which is partnered with U.S. Coast Guard Air Station Elizabeth City (ECAS). During the 2012 Ice Season, eleven IRDs deployed to observe and report icebergs, sea ice, and oceanographic conditions on and near the Grand Banks of Newfoundland. CIS also provided reconnaissance data from the Transport Canada aircraft, while PAL provided iceberg information for both CIS and Department of Fisheries and Oceans flights. All observations were transmitted to the IIP Operations Center where they were entered into BAPS and processed for incorporation into the model and iceberg products. The NAIS reconnaissance strategy is discussed further in Appendix C. Throughout the 2012 Ice Season, IRDs operated out of the IIP’s base of operations in St. John’s, Newfoundland for a total of 93 days conducting 28 iceberg patrols. The first IRD departed on 30 January to conduct training and official meetings with IIP partners in Elizabeth City, North Carolina and St. John’s. Furthermore, the deployment determined the early season iceberg distribution. The last IRD returned on 11 July to conclude IIP deployments to St. John’s. There were 23 flights cancelled due to weather, 9 flights cancelled due to maintenance, and 8 days in which the IRD did not fly due to crew status or scheduled meetings. A summary of IRD operations is provided in Table 1.
IRD Deployed
Days Iceberg Patrols
Transit Flights
Logistics Flights
Flight Hours
1 9 2 3 0 25.9
2 13 1 3 0 15.7
3 9 1 2 0 25.6
4 8 3 2 0 25.4
5 9 3 2 0 21.1
6 7 2 2 0 21.1
7 9 2 2 0 22.6
8 8 4 2 0 38.1
9 7 4 2 0 37.5
10 7 4 2 0 39.5
11 7 2 3 0 21.7
Total 93 28 25 0 294.2
Table 1. Summary of IRD operations.
Aerial Iceberg Reconnaissance Due to frequent poor weather in IIP’s area of responsibility, detecting and classifying targets was an ongoing challenge for IRD personnel. Therefore, the use of radar was

13
critical to IIP operations and was relied on as the primary means of classifying targets in reduced or no visibility conditions. The majority of 2012 aerial iceberg reconnaissance operations were conducted using HC-130J, long-range reconnaissance aircraft with cold weather capabilities provided by ECAS. The HC-130J aircraft is equipped with the ELTA-2022 360° X-Band Radar capable of detecting and classifying surface targets and the APN-241 weather Radar capable of detecting surface targets but not classifying them. The HC-130J is also equipped with an AIS receiver as an integrated component of the HC-130J mission system used to assist in differentiating vessels from icebergs. During IRD #2, IIP used the HC-144A medium-range reconnaissance aircraft provided by U.S. Coast Guard Aviation Training Center (ATC) Mobile. The HC-144A aircraft is equipped with a Telephonics APS-143 360° Radar capable of detecting and classifying surface targets. It is also equipped with an AIS receiver in a similar configuration as the HC-130J. IRDs conducted 28 patrols with 176.1 patrol hours and experienced only 0.6 hours of mission system down time and no visual only patrols. This means that the IRD patrolled without a mission system for only 0.4% of actual patrol time. This is a decrease from the 2011 ice season with a total of 3.6 hours of mission system down time.
Figure 8. Radar reconnaissance plan. The 360° coverage provided by the ELTA radar allows IIP to use 25 NM track spacing (Figure 8). This is based on the results of the HC-130J Ice Patrol Suitability Test Report dated 20 February 2009. This report determined that the ELTA radar detects small icebergs of 15 meters or longer with greater than 95% cumulative probability of detection
13
25
30
St. John’s, Newfoundland
25 nmtrack spacing
25 nm track spacing provides IIP with > 95% probability of detection.
Shaded area indicates ELTA RADAR Coverage (in NM)
25 nmtrack spacing
25
13
30
ELTA RADAR Coverage

14
within 25 NM track spacing. IIP maintained 25 NM track spacing throughout the season in an effort to maintain the integrity of patrols as further data analysis and testing of the ELTA radar is conducted. IIP plans to conduct tests for increased track spacing in 2013. In 2012, IRD personnel detected a total of 834 icebergs. Icebergs are detected in one of three ways: (1) combination of radar and visual, (2) radar only, or (3) visual only. This year, 47% of the icebergs were detected by a combination of radar and visual sightings. The remaining icebergs were either detected only by radar (10 %) or only by visual sighting (43 %) (Figure 9). The number of visual only sightings is larger than in previous years (15% in 2011) due to a greater presence of sea ice. Ice observers are invaluable when sea ice conditions are present.
Figure 9. Breakdown of Icebergs by detection method.
2012 Flight Hours In addition to the 28 iceberg patrols flown during the 2012 Ice Season, ECAS and ATC Mobile conducted 25 transit flights to and from St. John’s. One of those flights was on the first IRD to facilitate training and meetings with ECAS in preparation for the Ice Season. The HC-144A conducted three transit flights during IRD #2: (1) Mobile to Groton, (2) Groton to St John’s, and (3) return flight from St. Johns to U.S. Coast Guard Air Station Cape Cod. The numbers depicted in Figure 10 are the breakdown of the 294.2 flight hours used during the 2012 Ice Season for IIP operations. The flight hours are broken down into three categories; transit hours, patrol hours, and logistics hours. Transit hours are hours the aircraft transited to and from specific locations in support of the IIP mission. Patrol hours are hours used to patrol for icebergs. Logistics hours are hours that were used to support the overall mission of IIP, but do not fall into the previous two categories. Logistics hours are generally used to transport parts for an aircraft that has been designated for use in the execution of the IIP mission. In 2012, there were no requests to conduct concurrent Northwest Atlantic Fisheries Organization sightings from the First Coast Guard District. A comparison of flight hours to number of icebergs that drifted south of 48°N from 2008 to 2012 is shown in Figure 11.

15
Figure 10. Summary of flight hours (2008-2012).
Figure 11. Flight hours and icebergs south of 48°N (2003-2012).
Reconnaissance Challenges The Grand Banks are a productive fishing ground frequented by fishing vessels, ranging from 20 meters to over 70 meters in length. Even in low sea states, determining whether an ambiguous radar contact is an iceberg or a stationary vessel is particularly difficult.

16
These contacts (small vessels and ice) often present similar radar returns and cannot easily be differentiated. When a radar image does not present a distinguishable feature, the IRD classifies the contact as a radar target (R/T) in hopes of being able to identify it on a subsequent pass or patrol. During the 2012 Ice Season Ice Season, the IIP did not classify any radar targets. In addition, the oil industry continues to develop the Grand Banks region for its oil reserves and new exploration is conducted daily. The escalated exploration and drilling have increased air and surface traffic, further complicating target identification. This difficulty is mitigated by iceberg information reports generated from passing ships, aircraft, and drilling platforms which greatly aid IIP in the creation of an Iceberg Limit that is as accurate and reliable as possible. In 2012, the HC-144A was unable to perform any successful patrols. While this platform’s limitations in range and cargo weight were identified and well documented in previous missions, the lack of cold weather testing was a severe detriment in 2012. The HC-144A’s cold weather limitations were evident during IRD #2, from 14 to 26 February. IRD #2 was scheduled for 11 days; four transit days and seven patrol days. From the seven days allotted for ice reconnaissance, there were only two days in which weather conditions were favorable for conducting patrols with the HC-144A. The results from these two days were as follows: 18 February: Forecasted weather conditions were satisfactory for a successful patrol; however, the on-scene weather did not progress as expected. Ceilings were 1100 feet above ground level and the flight was cancelled due to the HC-144A limitations on in-flight de-icing; specifically, instrument flight rules conditions present directly after takeoff. 20 February: The aircraft departed St. John’s successfully; however, weather conditions in the search area were less than ideal. Again, the conditions called for the aircraft to employ de-icing measures and the rest of the search pattern was in areas conducive to icing. The HC-144A’s de-icing measures would not have been able to mitigate the ice accumulation on the airframe. The Aircraft Commander cancelled the flight due to unsafe conditions. In summary, IRD #2 resulted in only 1.8 hours of actual patrol time. The HC-144A’s cold weather capabilities were restricted due to its limited de-icing capabilities. If the HC-130J had been used for IRD #2, it is estimated that the IRD would have been able to fly approximately 11 patrol hours. While it is difficult to predict the weather on the Grand Banks or weather conditions that may arise during a particular IRD, the HC-144A does not appear suited for early season reconnaissance missions. It is better suited for late season missions when the iceberg limit extent is potentially smaller and the weather conditions, while still unpredictable, are generally less extreme. Oceanographic Operations Throughout the iceberg season, IIP deployed deploys drifting buoys on and near the Grand Banks of Newfoundland. The drifters provided near real-time ocean current information that were used to modify the historical current database within BAPS,

17
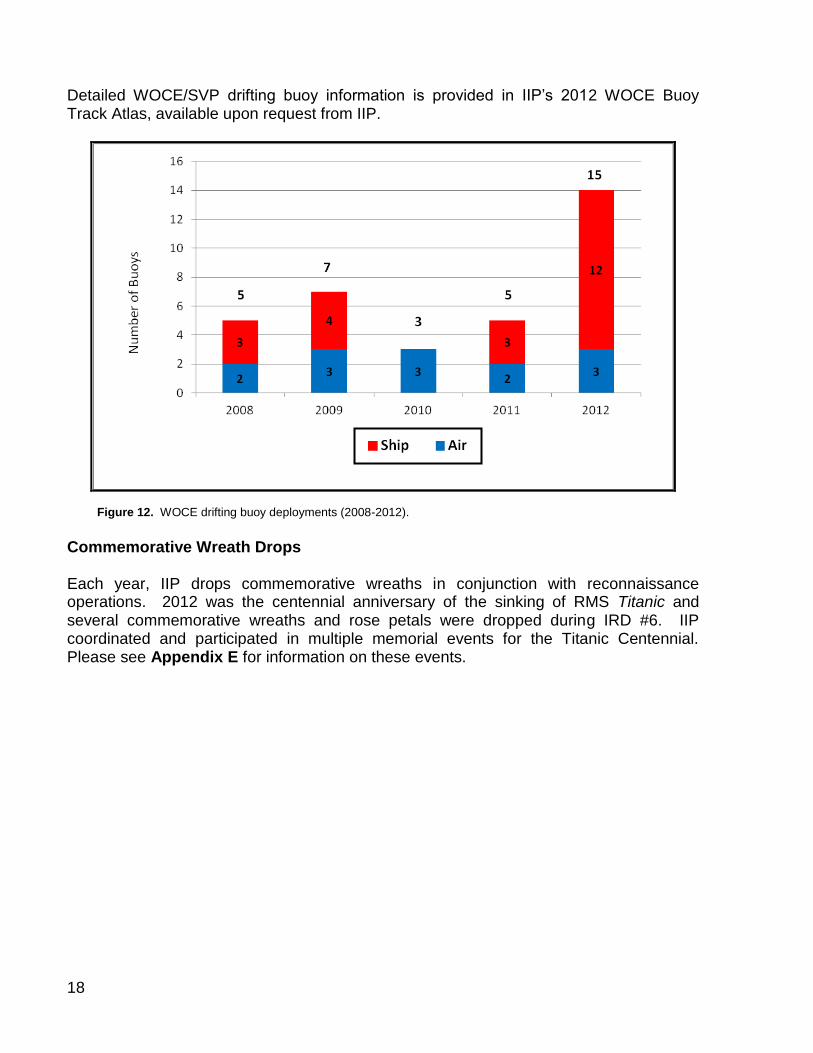
improving the accuracy of the model-calculated drift for each iceberg. The drifters also provided sea surface temperature (SST) information that was incorporated into an SST analysis product developed by the U. S. Navy. BAPS used both the current data and SSTs along with other environmental data to forecast the drift and deterioration of icebergs on and near the Grand Banks of Newfoundland. IIP used drifters based on the World Ocean Circulation Experiment/Surface Velocity Program (WOCE/SVP) design. The buoys deployed in 2012 differed only in the location of the holey sock drogue. The first type of buoy had a drogue centered at 50m, and the second at 15m. The drifters with drogues centered at 50m were deployed in the deep waters of the North Atlantic, most frequently in the offshore branch of the Labrador Current. This current brings icebergs southward along the edge of the continental shelf into the shipping lanes. The drifting buoys with the drogue centered at 15m, the standard WOCE/SVP drogue depth, were used to measure the currents in the shallower waters on the Grand Banks and in the inshore branch of the Labrador Current. IIP uses its reconnaissance aircraft and ships of opportunity to deploy the drifting buoys. Air-deployments are conducted during reconnaissance missions using an air-drop package prepared by IIP and ECAS personnel. Air deployments are typically much more expensive than ship deployments because of lost reconnaissance time and the cost of air-drop packages. Therefore, air-drops are generally conducted in areas not normally frequented by vessel traffic. Ship deployments are usually conducted near the Grand Banks through a cooperative arrangement with Canadian Coast Guard vessels operating out of St. John’s. In 2012, IIP deployed fifteen WOCE/SVP drifting buoys. Three 50m buoys were air-deployed from the IIP reconnaissance aircraft north of the Grand Banks of Newfoundland in the offshore branch of the Labrador Current. An additional twelve buoys were deployed from Canadian CG vessels: nine 15m and three 50m buoys. IIP has traditionally used the Argos system to track buoy positions and transmit data to the IIP Operations Center. During this season, IIP experimented with four GPS buoys that used the Iridium satellite system to transmit buoy positions and SST data. All fifteen WOCE/SVP buoys were deployed successfully and without incident. Thirteen buoys functioned properly and transmitted oceanographic data for sufficient durations. However, data from the Iridium buoys were not incorporated into the current update process. IIP is working with the buoy manufacturer to resolve data gaps observed in the GPS position data from these buoys. Pending resolution of this issue, IIP will consider incorporating Iridium tracked buoys into future operations. Of the Argos processed buoys, two were omitted from the current update process and were not forwarded to the Global Telecommunications System for use by the World Meteorological Organization. Both buoys were ship deployed. The first was transmitting suspicious temperature and position data and the second washed ashore along the Avalon Peninsula of Newfoundland shortly after deployment. All buoys eventually drifted out of IIP’s area of interest. Figure 12 shows 2008-2012 air and ship WOCE/SVP drifting buoy deployments. Figure 13 depicts composite drift tracks for the WOCE/SVP drifting buoys deployed in 2012.
18
Detailed WOCE/SVP drifting buoy information is provided in IIP’s 2012 WOCE Buoy Track Atlas, available upon request from IIP.
Figure 12. WOCE drifting buoy deployments (2008-2012).
Commemorative Wreath Drops Each year, IIP drops commemorative wreaths in conjunction with reconnaissance operations. 2012 was the centennial anniversary of the sinking of RMS Titanic and several commemorative wreaths and rose petals were dropped during IRD #6. IIP coordinated and participated in multiple memorial events for the Titanic Centennial. Please see Appendix E for information on these events.

19
Figure 13. Composite buoy tracks. Blue stars indicate ARGOS-tracked WOCE/SVP buoy
deployment positions. Green stars indicate Iridium-tracked WOCE/SVP buoy deployment positions. Red tracks indicate individual WOCE/SVP buoy paths.
20
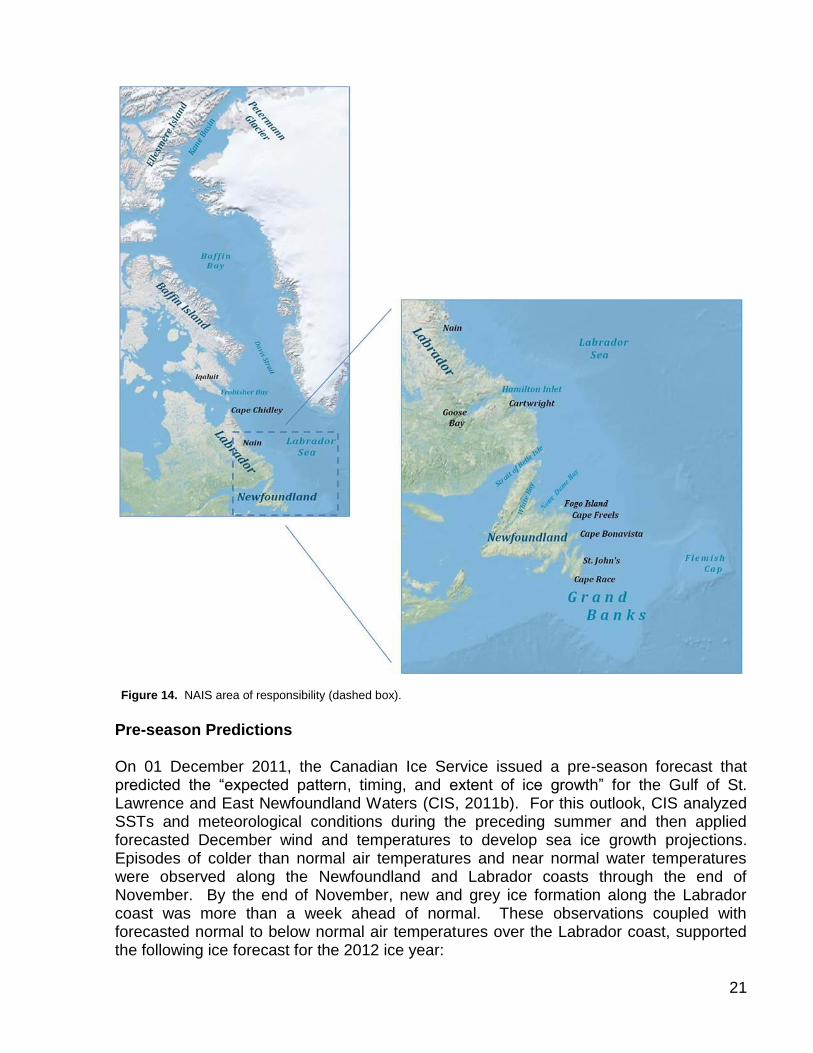
Ice and Environmental Conditions Introduction The 2012 ice year (October 2011-September 2012) began with warmer than normal air temperatures throughout southern Labrador and Newfoundland. A brief cooling period in late November initiated sea ice growth that was approximately 1.5 weeks ahead of normal conditions. More pronounced cold periods in southern Labrador during January, February and March coupled with predominantly offshore winter-time winds supported sea ice growth that promoted the drift of 499 icebergs south of 48o N into the transatlantic shipping lanes. This number is slightly above the average number of icebergs that have crossed 48o N from 1900-2011 (474) and classified the 2012 ice season as a “moderate” year based on this count (IIP, 1994). However, compared to the previous two seasons, when only one and three icebergs drifted south of 48o N for 2010 and 2011 respectively, the icebergs transiting Flemish Pass via the offshore branch of the Labrador Current posed a significant hazard to both transatlantic shipping and to the oil production facilities on the Grand Banks. A rapid retreat of the sea ice in early April coupled with the presence of a relatively warm, persistent protrusion of the North Atlantic Current near the Tail of the Grand Banks limited the southward extent of the iceberg limit, mitigating the risk to transatlantic shipping. This section describes the progression of the 2012 ice year and the accompanying environmental conditions. The following narratives are summarized by quarter beginning in October 2011 with the presence of a significant population of ice island fragments in Notre Dame Bay just west of Fogo Island and continuing as new ice began forming in the bays along the Labrador and Newfoundland coasts (Figure 14). This summary continues through the summer of 2012. The narrative draws from several sources, including sea-ice and iceberg analyses provided by the Canadian Ice Service and the U. S. National Ice Center; sea-surface temperature anomaly plots provided by the National Oceanic and Atmospheric Administration’s National Weather Service (NOAA/NWS, 2012a); and summaries of the iceberg data collected by the International Ice Patrol. The progress of the ice year is compared to observations from the historical record. The sea-ice historical data are derived from the Sea Ice Climatic Atlas, East Coast of Canada, 1981-2010 (CIS, 2011a). The average number of icebergs estimated to have drifted
south of 48N for each month was calculated using 112 years (1900 through 2011) of IIP records (IIP, 2011). Sea-level pressure data are from the National Centers for Environmental Prediction/National Center for Atmospheric Research (NCEP/NCAR) Reanalysis dataset (Kalnay et al., 1996) and the United Kingdom’s Meteorological Office (Met Office, 2012).
21
Figure 14. NAIS area of responsibility (dashed box).
Pre-season Predictions On 01 December 2011, the Canadian Ice Service issued a pre-season forecast that predicted the “expected pattern, timing, and extent of ice growth” for the Gulf of St. Lawrence and East Newfoundland Waters (CIS, 2011b). For this outlook, CIS analyzed SSTs and meteorological conditions during the preceding summer and then applied forecasted December wind and temperatures to develop sea ice growth projections. Episodes of colder than normal air temperatures and near normal water temperatures were observed along the Newfoundland and Labrador coasts through the end of November. By the end of November, new and grey ice formation along the Labrador coast was more than a week ahead of normal. These observations coupled with forecasted normal to below normal air temperatures over the Labrador coast, supported the following ice forecast for the 2012 ice year:
22
New and grey ice will be present along the Labrador coast northwest of Belle-Isle extending 10-20 NM off the southern coast of Labrador by the end of December.
By the end of January, the ice edge will extend into the Strait of Belle Isle and extend 40 NM off of the southern Labrador coast and Northern Peninsula.
By the end of February, the main pack ice will reach Fogo Island and Cape Bonavista and extend over 70 NM east of Cape Freels.
Ice concentration and coverage will diminish throughout March and will retreat “at faster than normal pace” from late March through mid-April.
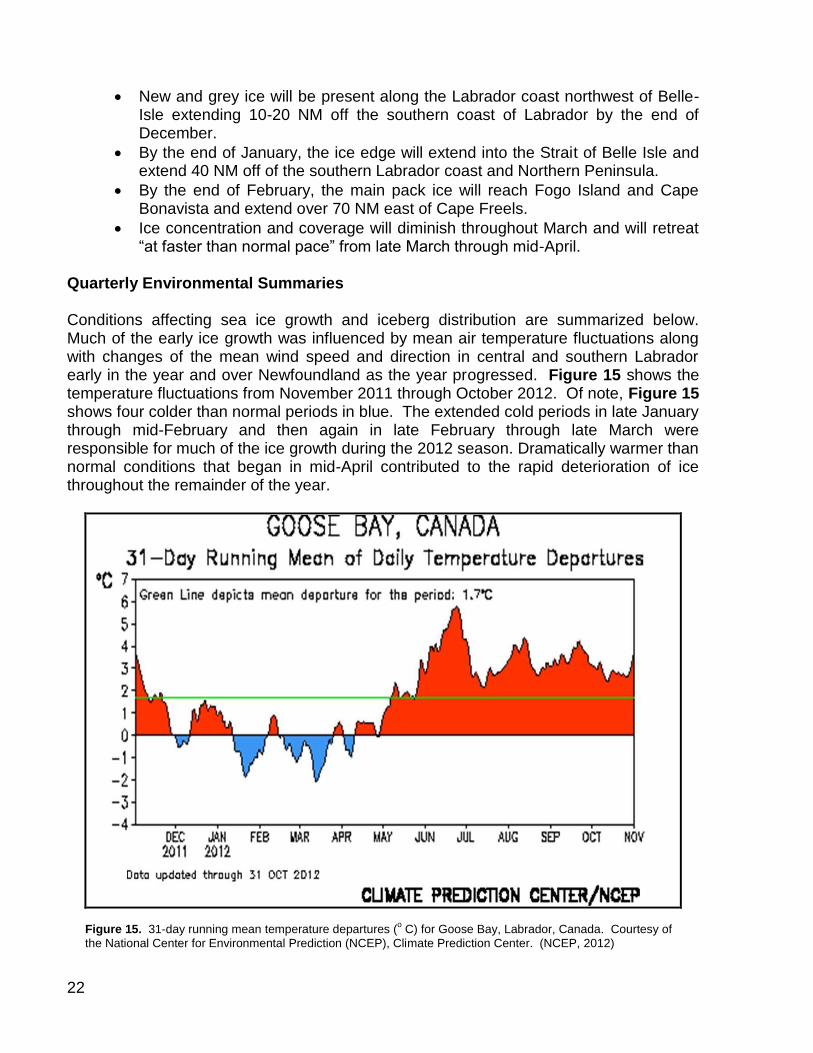
Quarterly Environmental Summaries Conditions affecting sea ice growth and iceberg distribution are summarized below. Much of the early ice growth was influenced by mean air temperature fluctuations along with changes of the mean wind speed and direction in central and southern Labrador early in the year and over Newfoundland as the year progressed. Figure 15 shows the temperature fluctuations from November 2011 through October 2012. Of note, Figure 15 shows four colder than normal periods in blue. The extended cold periods in late January through mid-February and then again in late February through late March were responsible for much of the ice growth during the 2012 season. Dramatically warmer than normal conditions that began in mid-April contributed to the rapid deterioration of ice throughout the remainder of the year.
Figure 15. 31-day running mean temperature departures (o C) for Goose Bay, Labrador, Canada. Courtesy of
the National Center for Environmental Prediction (NCEP), Climate Prediction Center. (NCEP, 2012)

23
October – December 2011 Cooler than normal air temperatures in late November in southern Labrador caused faster than normal ice growth along the Labrador coast, particularly, with respect to the previous two years. Sea surface temperatures were slightly above normal off the Newfoundland coast and near normal along the Labrador coast. The air temperature and sea surface temperature anomalies for the region were near normal leading to sea ice growth that was slightly faster than normal (CIS, 2012a). A large population of 165 ice island fragments remained in Notre Dame Bay at the beginning of the 2012 ice year. This population slowly diminished throughout November and December with only two remaining by 31 December 2011. Figure 16 shows the location of the iceberg population on 01 October 2011. While an iceberg population near Newfoundland at this early stage of the ice year is unusual, it is not unprecedented (IIP, 2011) and did not pose a hazard to transatlantic shipping.
Figure 16. Excerpt from NAIS Iceberg Limit Chart for 01 October 2011. The red shaded area
indicates the location of 2010 Petermann Ice Island fragments.
January – March 2012 While sea ice growth began in earnest during December, above normal mean air temperatures in southern Labrador slowed ice growth in January by approximately 1 week compared to normal conditions (CIS, 2012a). By the end of January, the ice edge had covered the Strait of Belle Isle and had advanced to approximately 50oN but had not yet reached Fogo Island. The ice edge extended approximately 75 NM east of the
24
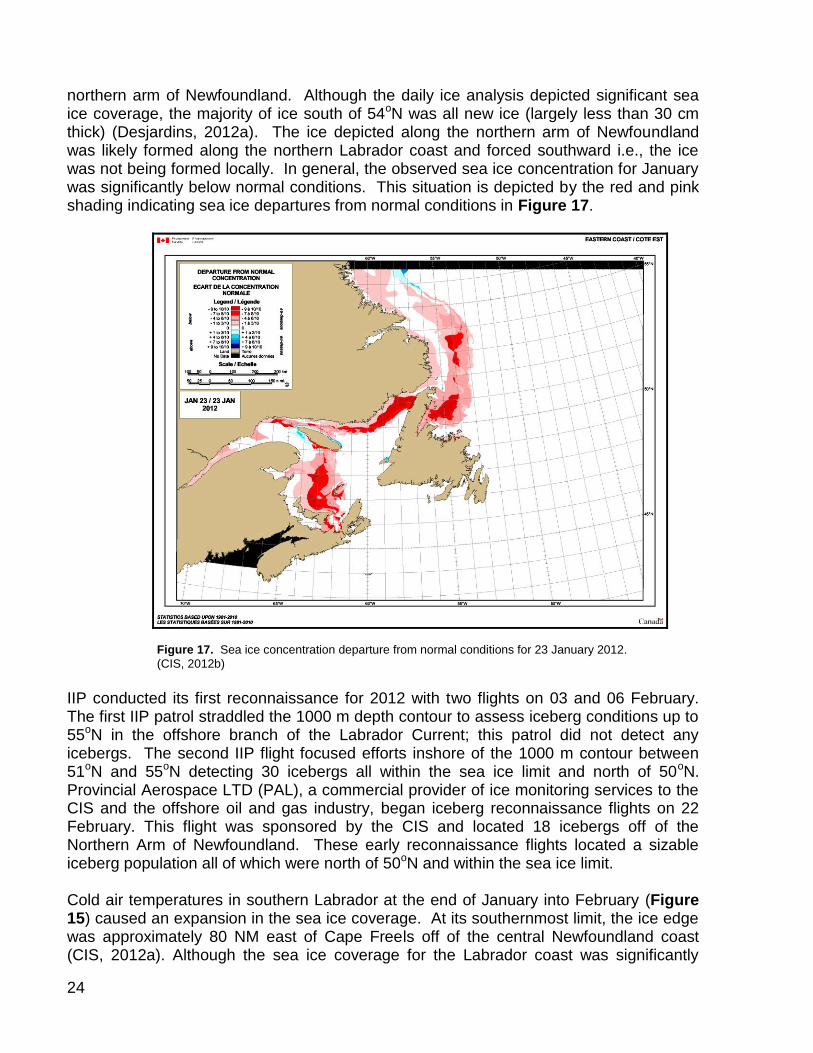
northern arm of Newfoundland. Although the daily ice analysis depicted significant sea ice coverage, the majority of ice south of 54oN was all new ice (largely less than 30 cm thick) (Desjardins, 2012a). The ice depicted along the northern arm of Newfoundland was likely formed along the northern Labrador coast and forced southward i.e., the ice was not being formed locally. In general, the observed sea ice concentration for January was significantly below normal conditions. This situation is depicted by the red and pink shading indicating sea ice departures from normal conditions in Figure 17.
Figure 17. Sea ice concentration departure from normal conditions for 23 January 2012.
(CIS, 2012b)
IIP conducted its first reconnaissance for 2012 with two flights on 03 and 06 February. The first IIP patrol straddled the 1000 m depth contour to assess iceberg conditions up to 55oN in the offshore branch of the Labrador Current; this patrol did not detect any icebergs. The second IIP flight focused efforts inshore of the 1000 m contour between 51oN and 55oN detecting 30 icebergs all within the sea ice limit and north of 50oN. Provincial Aerospace LTD (PAL), a commercial provider of ice monitoring services to the CIS and the offshore oil and gas industry, began iceberg reconnaissance flights on 22 February. This flight was sponsored by the CIS and located 18 icebergs off of the Northern Arm of Newfoundland. These early reconnaissance flights located a sizable iceberg population all of which were north of 50oN and within the sea ice limit. Cold air temperatures in southern Labrador at the end of January into February (Figure 15) caused an expansion in the sea ice coverage. At its southernmost limit, the ice edge was approximately 80 NM east of Cape Freels off of the central Newfoundland coast (CIS, 2012a). Although the sea ice coverage for the Labrador coast was significantly

25
higher than the previous two seasons (20% coverage vice 13% and 5% for 2011 and 2010, respectively), it still lagged median coverage for 1980-2011 by approximately 5%. By the end of February, IIP was tracking 86 icebergs all within the sea ice. No icebergs had drifted south of 48oN by this time. As shown in Figure 15, a third period of below-normal air temperatures in southern Labrador caused continued ice expansion to its maximum southern extent around 27 March 2012. At its maximum southern boundary, the sea ice edge extended to 46o- 40’N and approximately 180 NM east of St. John’s, Newfoundland. An image from the Moderate Resolution Imaging Spectroradiometer (MODIS) on the Terra Satellite provides an excellent, nearly cloud-free view from space of the extent and concentration of the sea ice on 15 March 2012 in Figure 18 (NASA/GSFC, 2012). This image has a 1 km resolution and is displayed in true color.
Figure 18. MODIS image over Newfoundland taken from the Terra Satellite on
15 March 2012 in True Color with 1 km resolution. Courtesy of the NASA/GSFC, Rapid Response System. (NASA/GSFC, 2012)
At the beginning of the March, IIP focused its reconnaissance efforts along the 1000 m contour between 53oN and 58oN to assess the iceberg population up stream. IIP’s focus shifted offshore and south toward Flemish Pass as well as the inshore branch of the Labrador Current near Newfoundland. PAL conducted one reconnaissance flight that was sponsored by CIS and seven additional flights for industry during March. Most of the icebergs seen by both IIP and PAL reconnaissance were confined to the inshore branch of the Labrador Current with only a few reported in Flemish Pass.
26
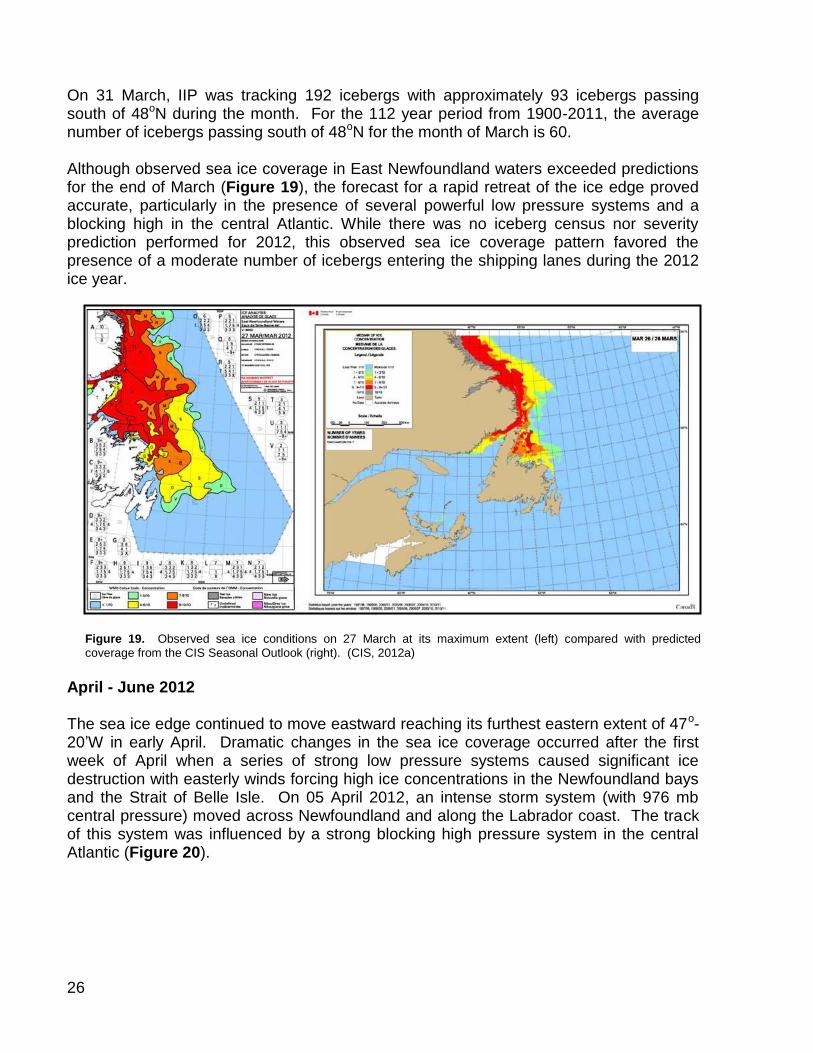
On 31 March, IIP was tracking 192 icebergs with approximately 93 icebergs passing south of 48oN during the month. For the 112 year period from 1900-2011, the average number of icebergs passing south of 48oN for the month of March is 60. Although observed sea ice coverage in East Newfoundland waters exceeded predictions for the end of March (Figure 19), the forecast for a rapid retreat of the ice edge proved accurate, particularly in the presence of several powerful low pressure systems and a blocking high in the central Atlantic. While there was no iceberg census nor severity prediction performed for 2012, this observed sea ice coverage pattern favored the presence of a moderate number of icebergs entering the shipping lanes during the 2012 ice year.
Figure 19. Observed sea ice conditions on 27 March at its maximum extent (left) compared with predicted
coverage from the CIS Seasonal Outlook (right). (CIS, 2012a)
April - June 2012 The sea ice edge continued to move eastward reaching its furthest eastern extent of 47o-20’W in early April. Dramatic changes in the sea ice coverage occurred after the first week of April when a series of strong low pressure systems caused significant ice destruction with easterly winds forcing high ice concentrations in the Newfoundland bays and the Strait of Belle Isle. On 05 April 2012, an intense storm system (with 976 mb central pressure) moved across Newfoundland and along the Labrador coast. The track of this system was influenced by a strong blocking high pressure system in the central Atlantic (Figure 20).

27
Figure 20. Surface pressure analysis for 05 April 2012. (UKMO Met Office, 2012)
This system, combined with the presence of warmer than normal SSTs for waters east of Newfoundland resulted in a dramatic retreat of the sea ice edge after the first week of April which continued throughout the remainder of the month. The absence of sea ice in IIP’s patrol area exposed icebergs in both the inshore and offshore branches of the Labrador Current to the open sea which hastened their ultimate destruction through April and into May. Average Newfoundland air temperatures were significantly above normal throughout the month of April with St. John’s, NL recording temperatures 3.9oC above normal for the period (NCEP, 2012). The sea ice edge had receded to the north of 50oN by the end of April. IIP reconnaissance continued through April patrolling for icebergs alternately near the Newfoundland coast (southwest iceberg limit) and the Flemish Pass (southeastern iceberg limit). IIP conducted five sorties that located over 130 icebergs in both areas. Of note, IIP detected several ice island fragments that were likely associated with the Peterman Ice Island that calved in 2010. Dates, locations and example photographs are presented below. Throughout the month, PAL increased reconnaissance flight frequency from every other day in the beginning of the month to multiple daily flights by the end of April. PAL flew three flights in April that were sponsored by the CIS, which focused primarily on the southern Labrador and northern Newfoundland waters. Toward the end of April, the iceberg population in the offshore branch of the Labrador Current had progressed into Flemish Pass. As a significant iceberg population approached the oil production facilities on the Grand Banks, PAL reconnaissance focused most of their
28
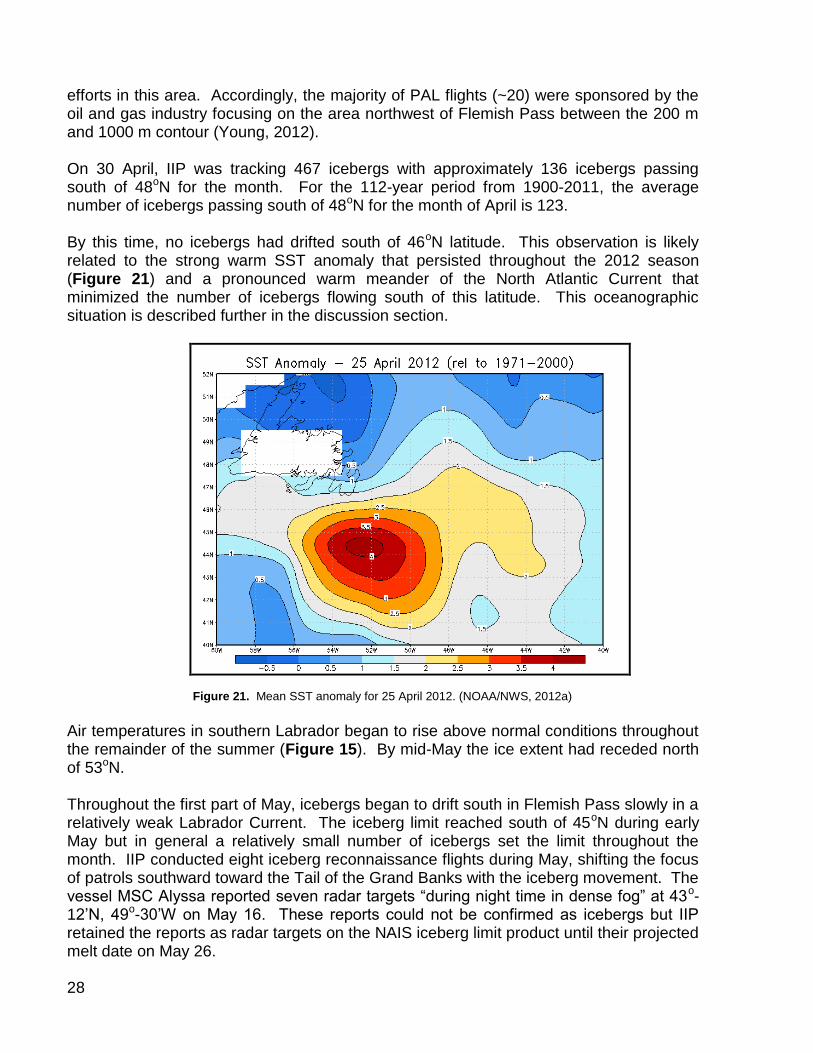
efforts in this area. Accordingly, the majority of PAL flights (~20) were sponsored by the oil and gas industry focusing on the area northwest of Flemish Pass between the 200 m and 1000 m contour (Young, 2012). On 30 April, IIP was tracking 467 icebergs with approximately 136 icebergs passing south of 48oN for the month. For the 112-year period from 1900-2011, the average number of icebergs passing south of 48oN for the month of April is 123. By this time, no icebergs had drifted south of 46oN latitude. This observation is likely related to the strong warm SST anomaly that persisted throughout the 2012 season (Figure 21) and a pronounced warm meander of the North Atlantic Current that minimized the number of icebergs flowing south of this latitude. This oceanographic situation is described further in the discussion section.
Figure 21. Mean SST anomaly for 25 April 2012. (NOAA/NWS, 2012a)
Air temperatures in southern Labrador began to rise above normal conditions throughout the remainder of the summer (Figure 15). By mid-May the ice extent had receded north of 53oN. Throughout the first part of May, icebergs began to drift south in Flemish Pass slowly in a relatively weak Labrador Current. The iceberg limit reached south of 45oN during early May but in general a relatively small number of icebergs set the limit throughout the month. IIP conducted eight iceberg reconnaissance flights during May, shifting the focus of patrols southward toward the Tail of the Grand Banks with the iceberg movement. The vessel MSC Alyssa reported seven radar targets “during night time in dense fog” at 43o-12’N, 49o-30’W on May 16. These reports could not be confirmed as icebergs but IIP retained the reports as radar targets on the NAIS iceberg limit product until their projected melt date on May 26.

29
Hazardous iceberg conditions in the vicinity of Grand Banks oil production facilities throughout May required daily PAL flights in the Flemish Pass area between 46o N and 47oN. PAL conducted three flights for CIS, two that were south of Flemish Pass and one along the Newfoundland coast. Again, most of PAL flights in May (57) were flown in support of the oil industry and were focused near the rigs. On 09 May, the Canadian Coast Guard Regional Operations Center in St. John’s, Newfoundland reported that the tug M/V Atlantic Raven moved the drill rig Henry Goodrich from the oil field to a position approximately 35 NM off or St. John’s due to the high number of icebergs in the vicinity. M/V Atlantic Raven returned Henry Goodrich to the oil field on 15 May after the iceberg threat subsided. The total number of icebergs on the Grand Banks and Labrador coast decreased through the month such that on 31 May, IIP was tracking 316 icebergs with approximately 256 icebergs passing south of 48oN for the month. For the 112 year period from 1900-2011, the average number of icebergs passing south of 48oN for the month of May is 147. While southern and central Labrador continued to exhibit warmer than normal mean temperatures during the month of June (Figure 15), the sea ice edge continued its rapid retreat northward throughout the remainder of the season. By the end of June, the edge of the main ice pack had retreated to Cape Chidley (~60oN) with only a small patch of ice near Nain, Labrador. This retreat was approximately 2 weeks ahead of the 30-year median (CIS, 2011a). IIP flew four reconnaissance flights from 6-11 June. Reconnaissance focused on the southern iceberg limit toward the Tail of the Grand Banks, the Flemish Pass area out to Sackville Spur and north along the 1000 m contour up to 52oN. Patrols detected only one iceberg in Flemish Pass and nine others that were all north of 50oN. These patrols provided radar and visual confirmation that a very small number of icebergs remained in the transatlantic shipping lanes. Iceberg density diminished throughout the Grand Banks in June. The iceberg limit reached its southern-most extent on 6 June and eastern & western-most limits on 10 June. On 11 June IIP reported a significant reduction of the iceberg limit up to 45o-30’N. Table 2 provides a summary of the extreme iceberg sightings, sources and modeled positions for the 2012 ice year.
Source Date Lat Long Date Lat Long
Southern Provincial Aerospace Ltd. 1-Jun-12 43-11.0N 049-11.6W 6-Jun-12 42-32.5N 049-41.4W
Eastern IIP C130 Reconnaissance 28-May-12 45-58.0N 045-49.0W 10-Jun-12 46-52.9N 040-44.6W
Western IIP C130 Reconnaissance 24-May-12 50-25.4N 059-34.2W 10-Jun-12 50-12.0N 059-55.7W
Sighted Modeled Extreme
Bergs
Table 2. Extreme iceberg sightings and modeled positions.
30
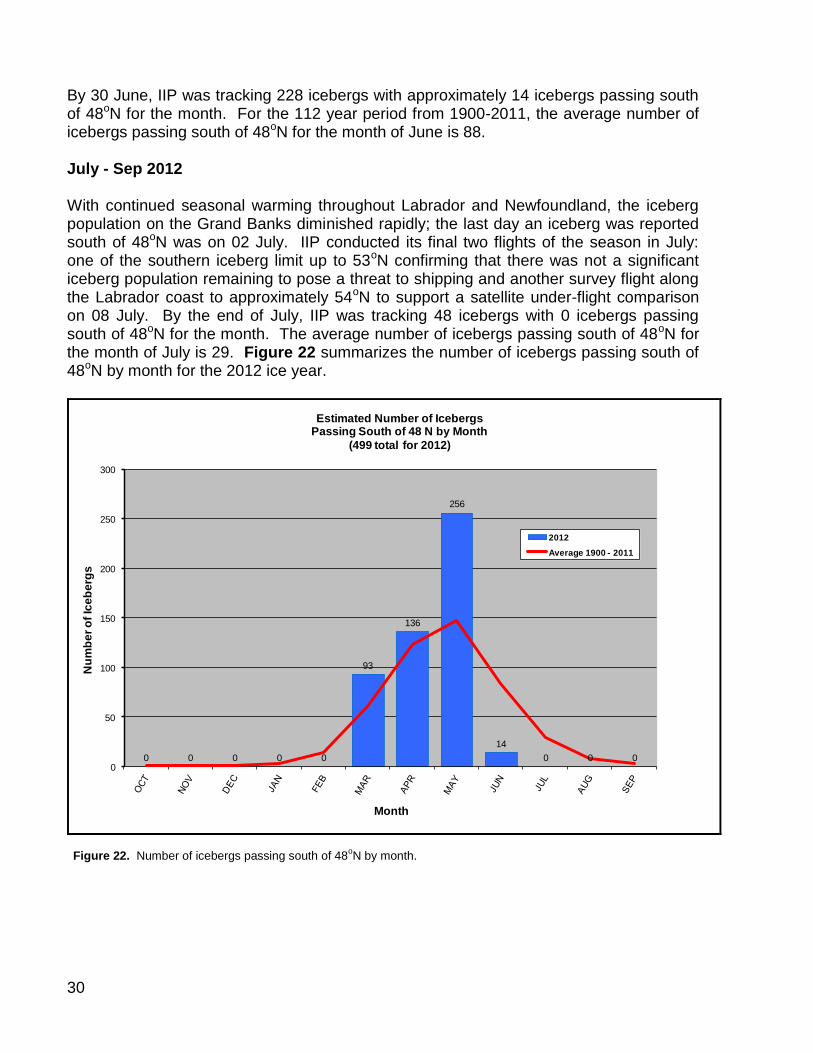
By 30 June, IIP was tracking 228 icebergs with approximately 14 icebergs passing south of 48oN for the month. For the 112 year period from 1900-2011, the average number of icebergs passing south of 48oN for the month of June is 88. July - Sep 2012 With continued seasonal warming throughout Labrador and Newfoundland, the iceberg population on the Grand Banks diminished rapidly; the last day an iceberg was reported south of 48oN was on 02 July. IIP conducted its final two flights of the season in July: one of the southern iceberg limit up to 53oN confirming that there was not a significant iceberg population remaining to pose a threat to shipping and another survey flight along the Labrador coast to approximately 54oN to support a satellite under-flight comparison on 08 July. By the end of July, IIP was tracking 48 icebergs with 0 icebergs passing south of 48oN for the month. The average number of icebergs passing south of 48oN for the month of July is 29. Figure 22 summarizes the number of icebergs passing south of 48oN by month for the 2012 ice year.
0 0 0 0 0
93
136
256
14
0 0 00
50
100
150
200
250
300
Nu
mb
er
of
Ice
be
rgs
Month
Estimated Number of Icebergs Passing South of 48 N by Month
(499 total for 2012)
2012
Average 1900 - 2011
Figure 22. Number of icebergs passing south of 48
oN by month.

31
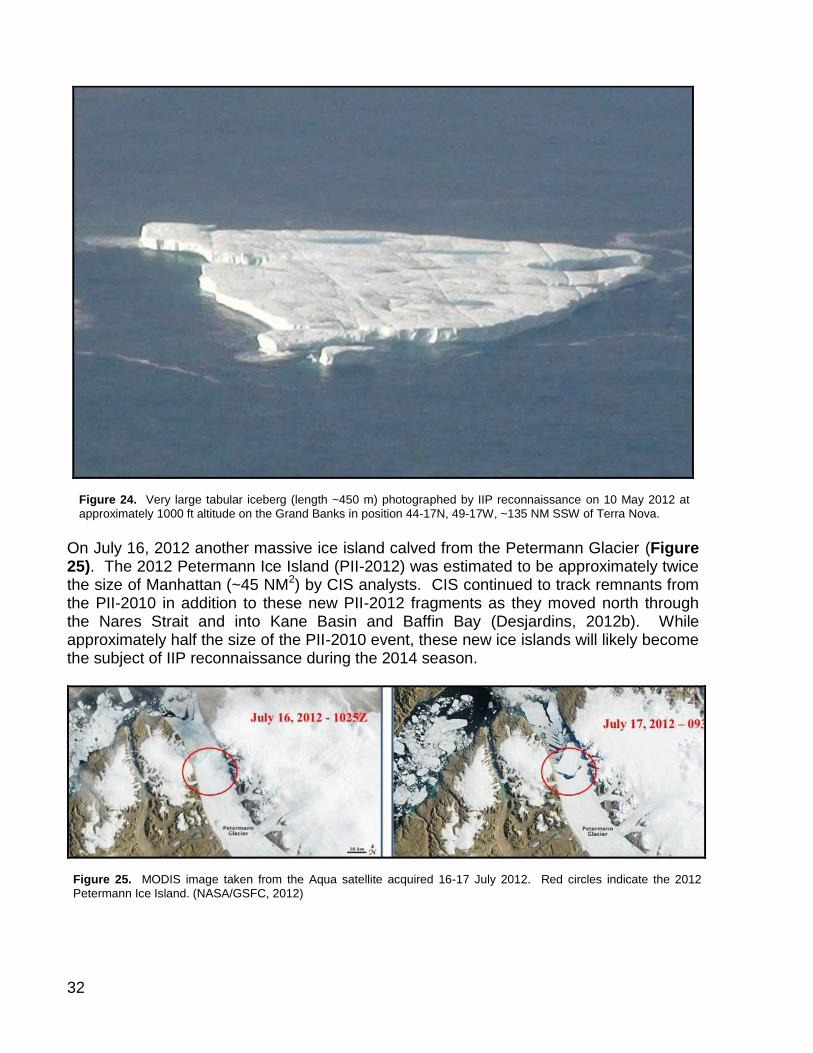
Petermann Ice Island During 2012, IIP detected several very large (length>200 m) and large (length between 120-200 m) tabular icebergs that had drifted south of 48oN and became hazards to transatlantic shipping. With the benefit of continued CIS tracking analysis, these ice hazards were likely associated with the 2010 Petermann Glacier event (Desjardins, 2012b). Of note, during the 15 and 16 April flights, IIP located two very large tabular bergs near 48oN at the northern entrance to Flemish Pass and one large berg approximately 12 NM northeast of Cape St. Francis on the Avalon Peninsula. Figure 23 shows a photograph of the inshore ice island fragment estimated to be about 200 m in length. IIP detected another very large tabular berg (~450 m in length) on 10 May (Figure 24). The berg sighted on 10 May was on the edge of the Grand Banks approximately 135 NM south-southwest of the Terra Nova oil production facility. This is likely the southernmost Petermann Ice Island sighting for 2012.
Figure 23. Large tabular iceberg (length ~200 m) photographed by IIP reconnaissance on 15 April 2012 at
approximately 1000 ft altitude near the Avalon Peninsula in position 47-54N 52-32W.
32
Figure 24. Very large tabular iceberg (length ~450 m) photographed by IIP reconnaissance on 10 May 2012 at
approximately 1000 ft altitude on the Grand Banks in position 44-17N, 49-17W, ~135 NM SSW of Terra Nova.
On July 16, 2012 another massive ice island calved from the Petermann Glacier (Figure 25). The 2012 Petermann Ice Island (PII-2012) was estimated to be approximately twice the size of Manhattan (~45 NM2) by CIS analysts. CIS continued to track remnants from the PII-2010 in addition to these new PII-2012 fragments as they moved north through the Nares Strait and into Kane Basin and Baffin Bay (Desjardins, 2012b). While approximately half the size of the PII-2010 event, these new ice islands will likely become the subject of IIP reconnaissance during the 2014 season.
Figure 25. MODIS image taken from the Aqua satellite acquired 16-17 July 2012. Red circles indicate the 2012
Petermann Ice Island. (NASA/GSFC, 2012)

33
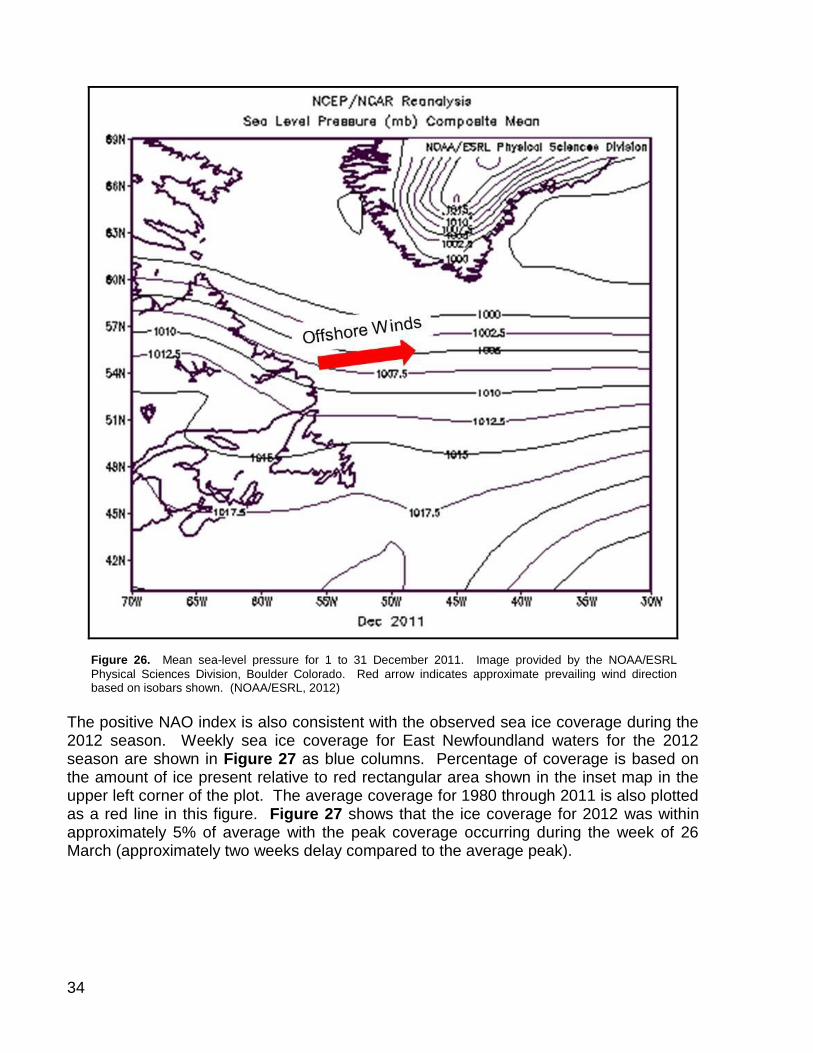
Atmospheric and Oceanographic Discussion The number of icebergs that drift south of 48oN is closely related to sea ice coverage during the winter months. Sea ice coverage depends not only on air and sea surface temperature but also on the predominant wind direction over IIP’s operating area during the winter months (December-March). The southern extent of the iceberg limit further depends on both the number of icebergs that reach the northern Grand Banks after the sea ice retreats and also on the strength and position of the Labrador Current south of Flemish Pass. The following paragraphs discuss how wintertime wind patterns (using the North Atlantic Oscillation index as an indicator) supported close-to-average sea ice coverage favoring an average number of icebergs crossing 48oN. While the iceberg ‘season’ (i.e., the number of days in which IIP tracked icebergs south of 48oN) can be described as ‘moderate’, the relatively low density of icebergs that reached the Tail of the Grand Banks was tempered by the presence of a relatively warm protrusion of the North Atlantic Current that impeded the southward flow of the Labrador Current. While not a predictive tool, the North Atlantic Oscillation (NAO) index provides insight into the mechanisms influencing the number of icebergs moving into the offshore branch of the Labrador Current. The NAO index has been associated with the iceberg season severity in terms of the number of icebergs reaching the shipping lanes via the Labrador Current. The NAO represents the dominant pattern of winter atmospheric variability in the North Atlantic, fluctuating between positive and negative phases. NAO dynamics have been extensively described by Hurrell et al. (2003). Persistent offshore winds in Labrador during winter are characteristic features of a positive phase of the NAO (Figure 26). The winter time 2012 NAO Index (December 2011 through March 2012) was strongly positive at 3.17 (Hurrell, 2012). This value, called the winter station-based NAO index, is calculated using the difference in normalized sea-level atmospheric pressure between Lisbon, Portugal and Stykkisholmu/Reykjavik, Iceland. The NAO index during these winter months has shown some correlation to the severity of the iceberg season. Both 2010 and 2011 winter time NAO indices were strongly negative, consistent with very light iceberg conditions with one and three icebergs south of 48o N, respectively.
34
Figure 26. Mean sea-level pressure for 1 to 31 December 2011. Image provided by the NOAA/ESRL
Physical Sciences Division, Boulder Colorado. Red arrow indicates approximate prevailing wind direction based on isobars shown. (NOAA/ESRL, 2012)
The positive NAO index is also consistent with the observed sea ice coverage during the 2012 season. Weekly sea ice coverage for East Newfoundland waters for the 2012 season are shown in Figure 27 as blue columns. Percentage of coverage is based on the amount of ice present relative to red rectangular area shown in the inset map in the upper left corner of the plot. The average coverage for 1980 through 2011 is also plotted as a red line in this figure. Figure 27 shows that the ice coverage for 2012 was within approximately 5% of average with the peak coverage occurring during the week of 26 March (approximately two weeks delay compared to the average peak).

35
Figure 27. Weekly ice coverage for East Newfoundland Waters. The percent coverage is relative to the area
shaded in red in the upper left map of this figure. (CIS, 2012c)
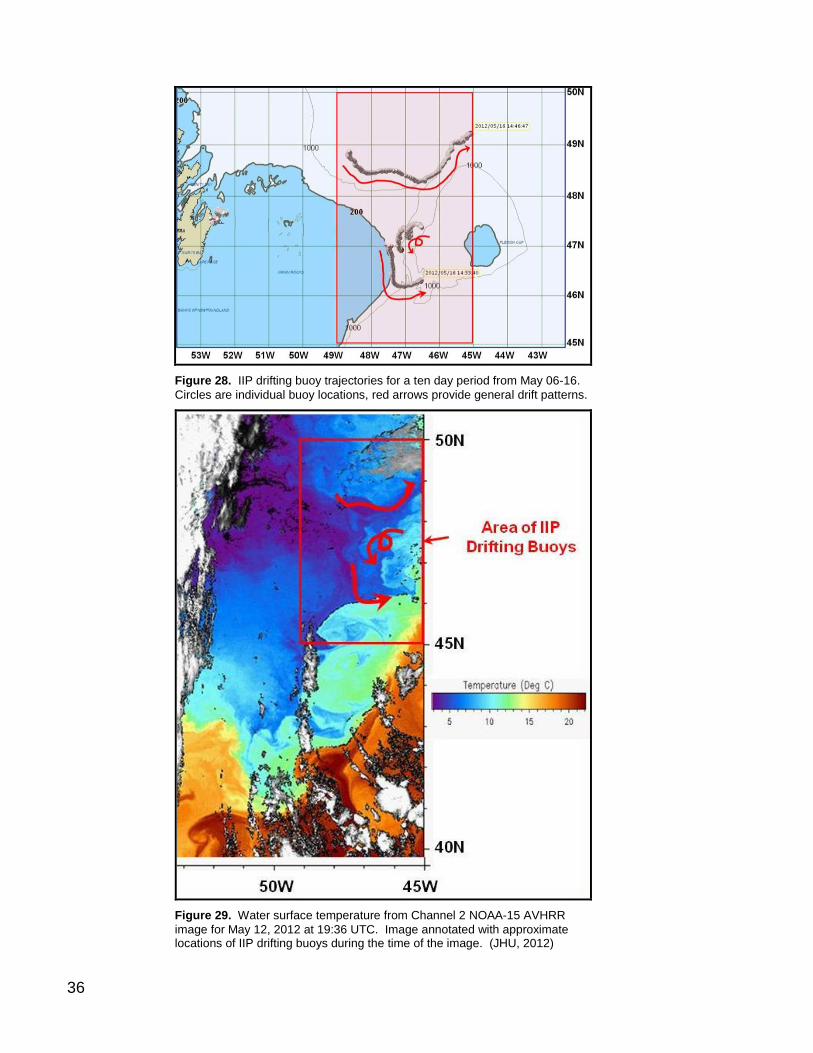
While the positive NAO index and observed sea ice coverage favored a higher number of icebergs on the Grand Banks compared to the previous two seasons, analysis of IIP drifting buoy trajectories and SSTs derived from Advanced Very High Resolution Radiometer (AVHRR) imagery provided insight into the relatively sparse population of icebergs that survived south of 45oN. Figure 28 shows positions and trajectories for three IIP drifting buoys for the period from 6-16 May. The northernmost buoy shows an eastward drift toward the top of Flemish Cap. While this track suggests a mechanism to transport icebergs north of Flemish Cap and out to the eastern extent of IIP’s operating area, IIP detected no icebergs north of the Cap throughout the season. The trajectory of the central buoy in Figure 28 shows a circular path implying that the buoy was not in the main branch of the Labrador Current and more likely was on the boundary of a meander of the North Atlantic Current. The trajectory of the southernmost buoy in Figure 28 shows a dramatic turn to the east. A rare glimpse at the SSTs from an AVHRR image acquired on May 12th provides tremendous insight into the oceanographic complexities affecting buoy and iceberg drift near the Tail of the Grand Banks (Figure 29). This image was obtained through John Hopkins University, Applied Physics Laboratory Ocean Watch program (JHU, 2012) and revealed the presence of a strong, east-west oriented thermal gradient (4oC–11oC) at approximately 46oN near the southern extremity of Flemish Pass and explains the dramatic buoy drift toward the east. This warm feature, associated with the North Atlantic Current persisted throughout May and created an extraordinarily complex ocean environment that ultimately acted as a barrier to the southward progression of icebergs for the 2012 season and thereby mitigating the risk to transatlantic shipping.
36
Figure 28. IIP drifting buoy trajectories for a ten day period from May 06-16.
Circles are individual buoy locations, red arrows provide general drift patterns.
Figure 29. Water surface temperature from Channel 2 NOAA-15 AVHRR
image for May 12, 2012 at 19:36 UTC. Image annotated with approximate locations of IIP drifting buoys during the time of the image. (JHU, 2012)

37
References Canadian Ice Service. (2011a). Sea Ice Climatic Atlas, East Coast 1981-2010. Retrieved 11 December 2012, from: http://www.ec.gc.ca/glaces-ice/default.asp?lang=En&n=090AF7D6-1&xml=AE4A459A-FFF4-4E38-A09E-7DF258873739 Canadian Ice Service. (2011b). Seasonal Outlook, Gulf of St. Lawrence and East Newfoundland Waters, Winter 2011-2012, Unpublished Manuscript, Canadian Ice Service, 373 Sussex Drive, Bock E-3, Ottawa, ON, Canada K1A 0H3, 18 pp. Retrieved 26 October 2012 from: https://www.ec.gc.ca/glaces-ice/default.asp?Lang=En&n=8801A900-1 Canadian Ice Service. (2012a). Seasonal Summary for Eastern Canada – Winter 2011-2012. Retrieved 26 October 2012 from: http://www.ec.gc.ca/glaces-ice/default.asp?Lang=En&n=2E4D9D6C-1 Canadian Ice Service. (2012b). Canadian Ice Service – Regional Ice Chart Departure from Normal Concentration. Retrieved on 26 October 2012 from: http://iceglaces.ec.gc.ca/prods/WIS57DPTCT/20121210180000_WIS57DPTCT_0006797952.pdf Canadian Ice Service. (2012c). Canadian Ice Service - IceGraph Version 2.0.4. Retrieved 04 December from: http://dynaweb.cis.ec.gc.ca/IceGraph20/page1.jsf Coast Guard Analysis Report, North Atlantic Vessel Behavior in Response to International Ice Patrol Products, 6 July 2012. Desjardins, Luc (2012a). Canadian Ice Service. Personal communications. Desjardins, Luc (2012b). Canadian Ice Service. Petermann Ice Island Updates received weekly through e-mail distribution. Hurrell, J.W., Y. Kushnir, G. Ottersen, and M. Visbeck (2003). The North Atlantic Oscillation: Climate Significance and Environmental Impact, Geophysical Monograph Series, 134, 279pp. Hurrell, James. (2012). Winter (Dec-Mar) Station Based NAO Index. National Center for Atmospheric Research. Retrieved 23 November 2012 from: https://climatedataguide.ucar.edu/sites/default/files/cas_data_files/asphilli/nao_station_djfm_0.txt IIP. (1994). Report of the International Ice Patrol in the North Atlantic (1994 Season), Bulletin No. 80, Appendix C. IIP. (2011). Report of the International Ice Patrol in the North Atlantic (2011 Season), Bulletin No. 97, Appendix D.

38
Johns Hopkins University. (2012)., Applied Physics Laboratory Ocean Remote Sensing Group, Water Surface Temperature, Land and Clouds from Channel 2 NOAA-15 AVHRR 2012 May 12, 19:36 UTC. Retrieved 14 May 2012 from: http://fermi.jhuapl.edu/avhrr/SW/ Kalnay, E., M. Kanamitsu, R. Kistler, W. Collins, D. Deaven, L. Gandin, M. Iredell, S. Saha, G. White, J. Woollen, Y. Zhu, M. Chelliah, W. Ebisuzaki, W. Higgins, J. Janowiak, K.C. Mo, C. Ropelewski, J. Wang, A. Leetmaa, R. Reynolds, R. Jenne, D. Joseph. (1996). The NCEP/NCAR Reanalysis 40-year Project. Bull. Amer. Meteor. Soc., 77, 437-471. Met Office. (2012). United Kingdom Meteorological Office. Sea Level Analysis Chart. Retrieved on 16 November 2012 from: http://www.wetterzentrale.de/topkarten/tkfaxbraar.htm Mobile Geographics, LLC, 8015 28th Ave NW, Seattle, Washington 98117. Contact webmaster @ sailwx.info. National Aeronautics and Space Administration/Goddard Space Flight Center (NASA/GSFC) (2012a). Terra MODIS imagery acquired using the Rapid Response system. Retrived 17 March 2012 from: http://rapidfire.sci.gsfc.nasa.gov/realtime NASA/GSFC (2012b). Aqua MODIS imagery acquired using the Rapid Response system. Retrived 17 March 2012 from: http://www.nasa.gov/topics/earth/features/petermann-calve.html National Oceanic and Atmospheric Administration/Earth System Research Laboratory. (2012). Physical Sciences Division. Retrieved 23 November 2012 from: http://www.esrl.noaa.gov/psd/cgi-bin/data/composites/printpage.pl National Oceanic and Atmospheric Administration/National Weather Service (2012a). NOAA Operational Model Archive & Distribution System. Retrieved 27 November 2012 from http://nomad3.ncep.noaa.gov/ncep_data/index.html National Oceanic and Atmospheric Administration/National Weather Service. (2012b). National Centers for Environmental Prediction, Climate Prediction Center. Retrieved 31 October 2012 from: http://www.cpc.ncep.noaa.gov/products/global_monitoring/temperature/ecanada_1yrtemp.shtml
Young, C. (2012). Provincial Aerospace LTD (PAL) - Review of 2012 Ice Season. Presented to the International Ice Patrol Conference on 06 December 2012.
39
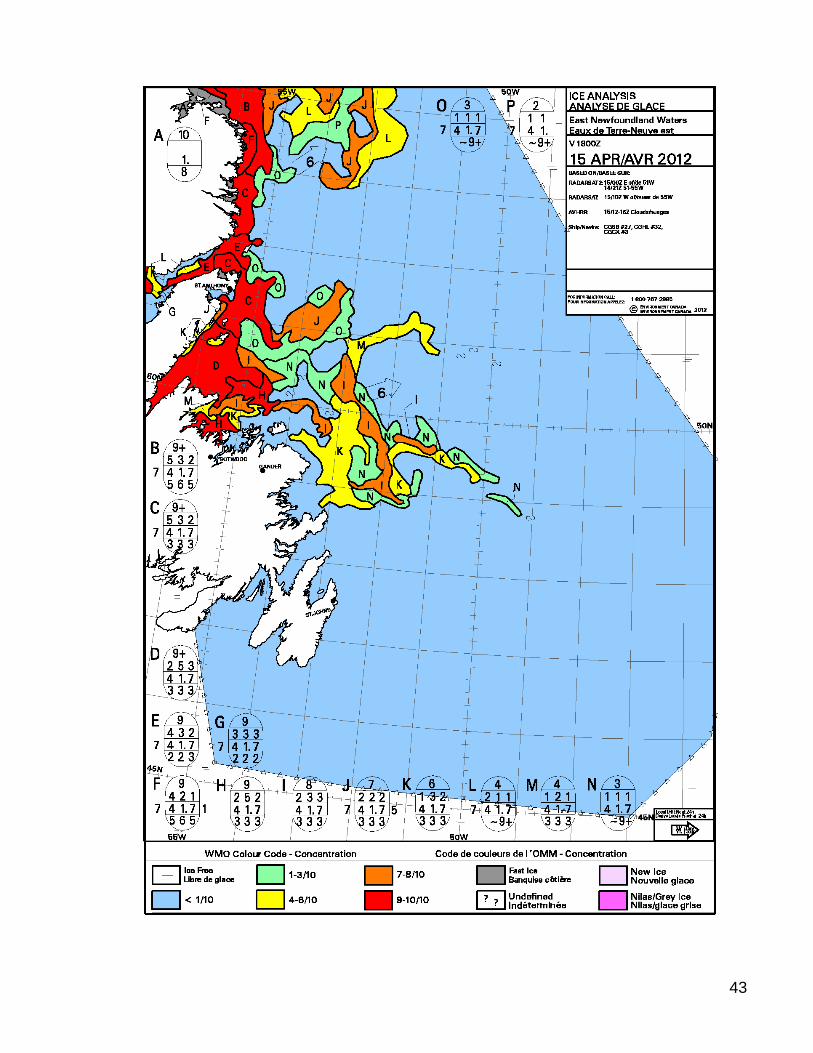
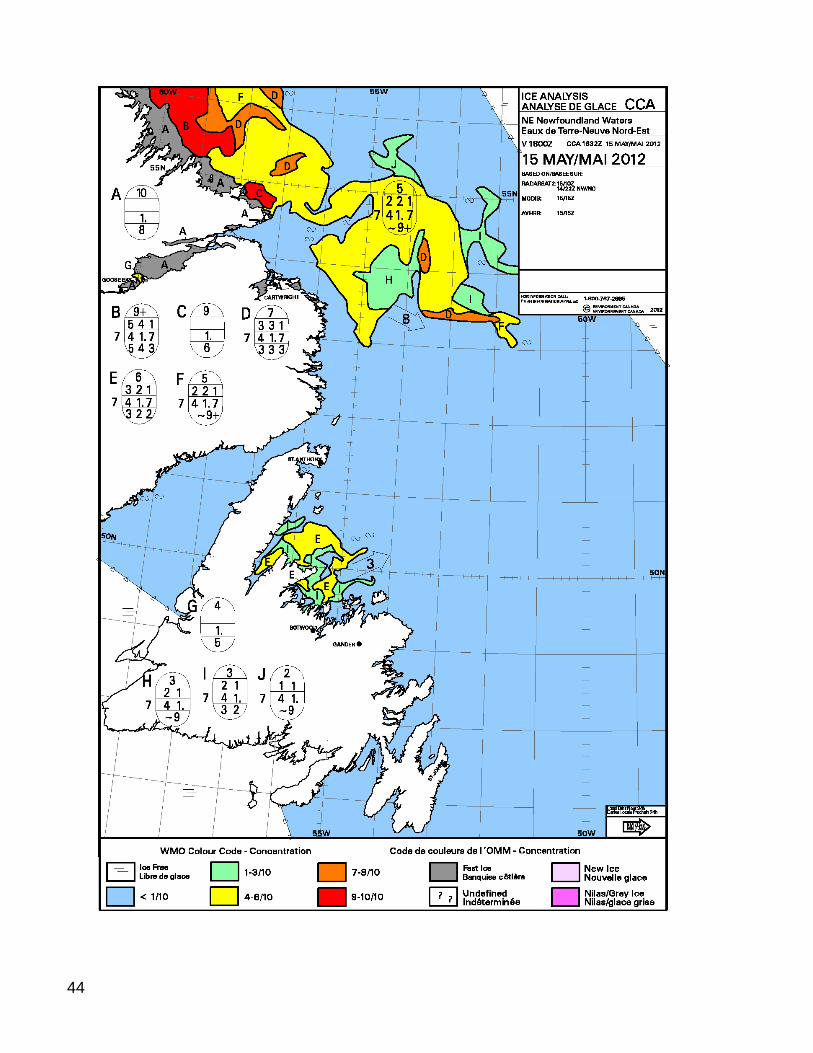
Monthly Sea-Ice Charts
Sea-ice charts are reprinted with permission of the Canadian Ice Service.
Sea ice symbols are in accordance with the World Meteorological Organization.

40

41

42
43
44
45
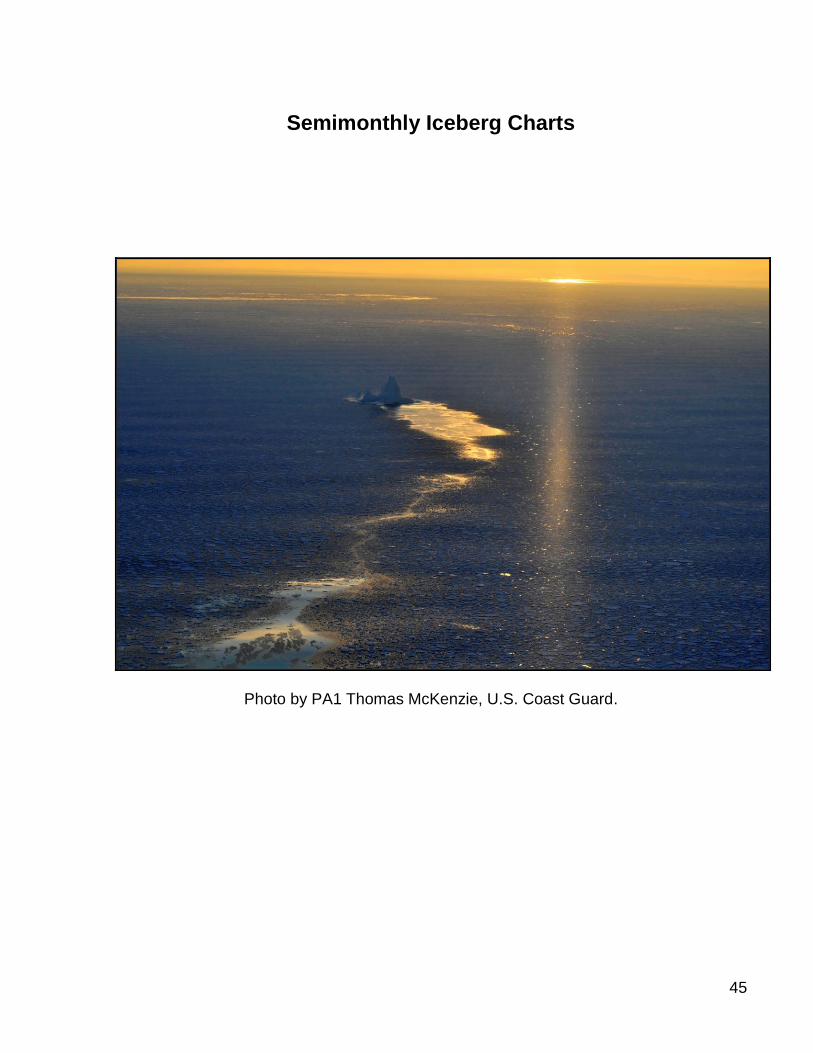
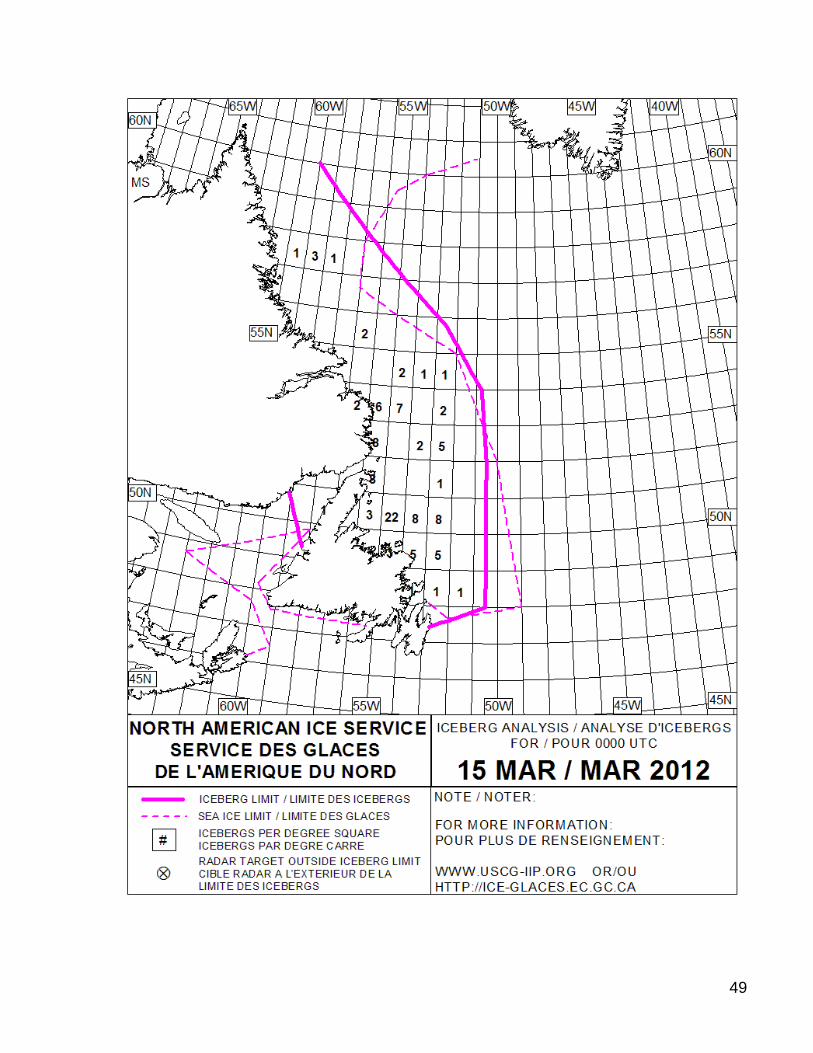
Semimonthly Iceberg Charts
Photo by PA1 Thomas McKenzie, U.S. Coast Guard.

46

47

48
49

50
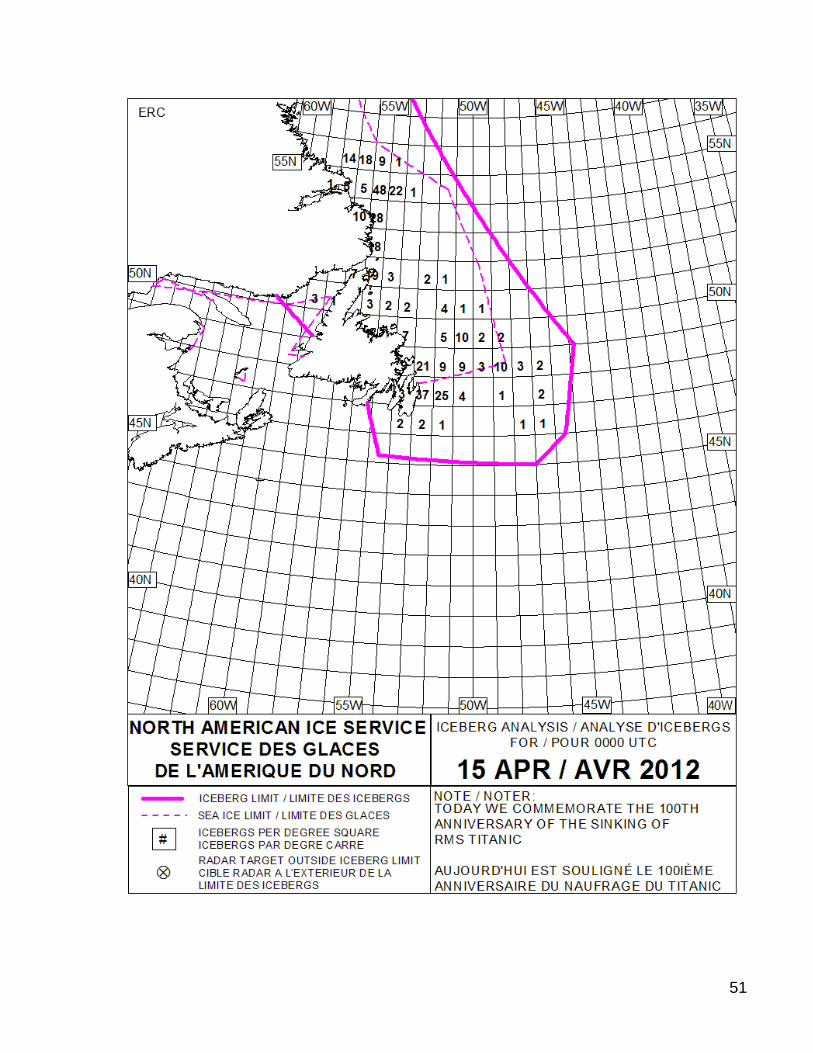
51

52

53

54

55

56

57
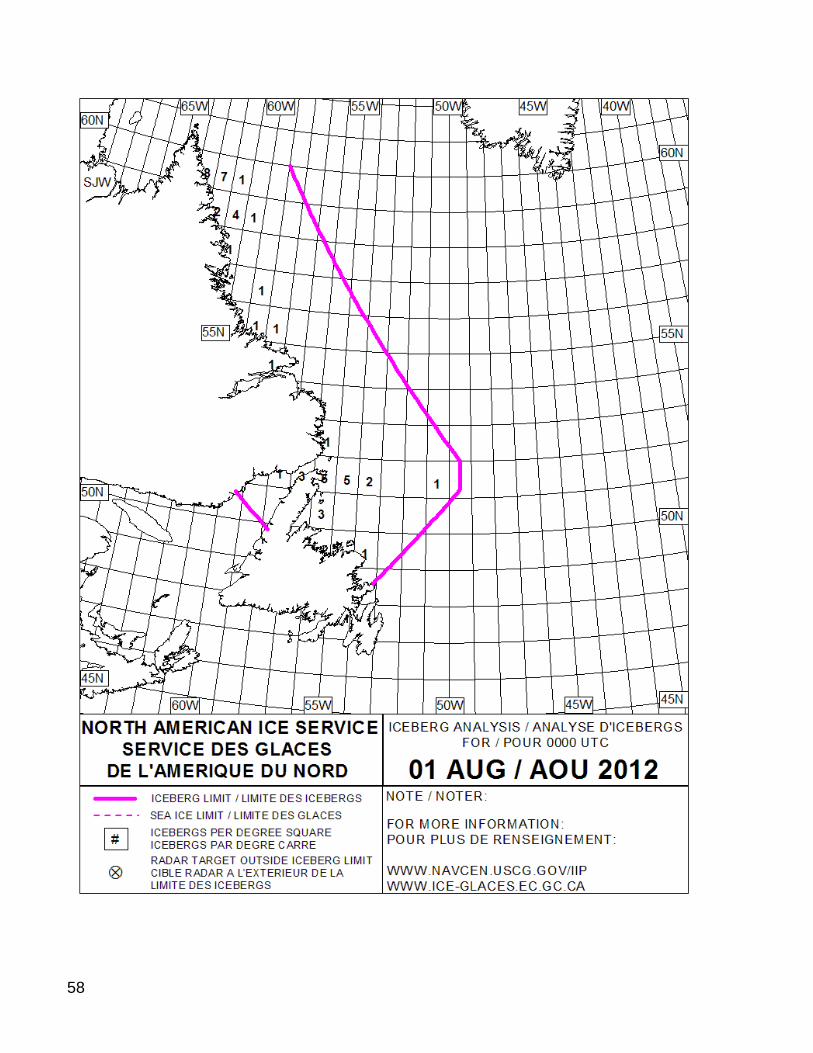
58

59
60
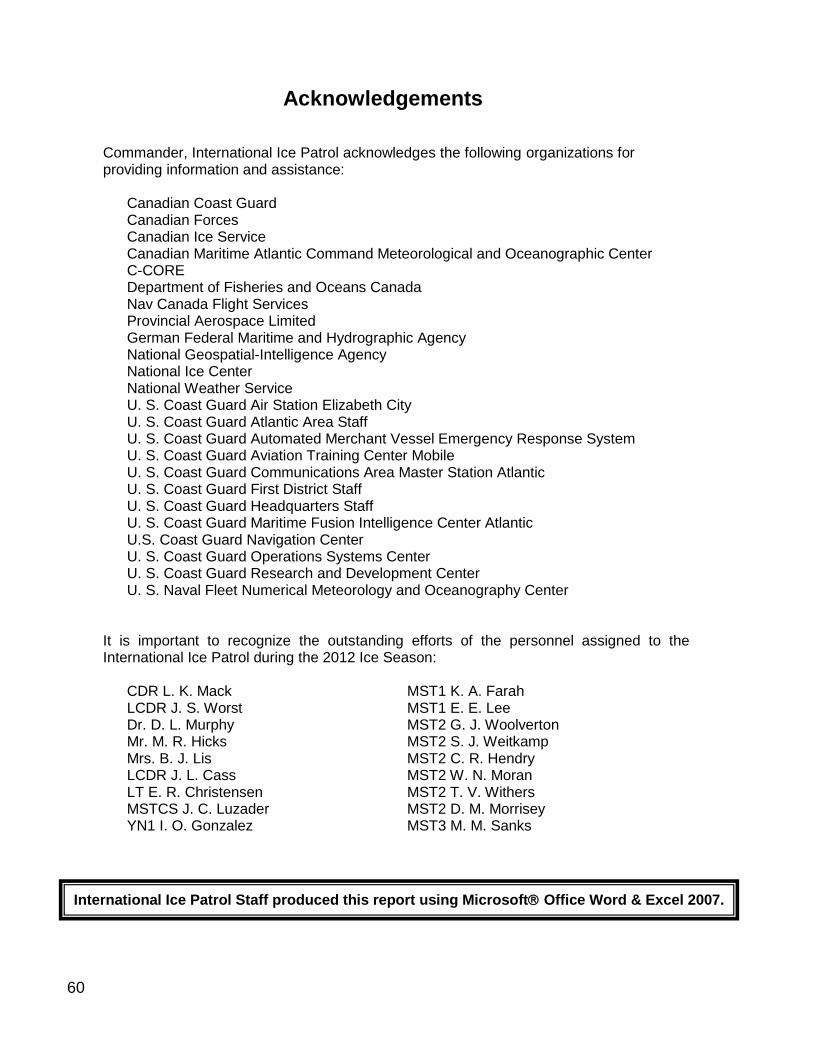
Acknowledgements
Commander, International Ice Patrol acknowledges the following organizations for providing information and assistance:
Canadian Coast Guard Canadian Forces Canadian Ice Service Canadian Maritime Atlantic Command Meteorological and Oceanographic Center C-CORE Department of Fisheries and Oceans Canada Nav Canada Flight Services Provincial Aerospace Limited German Federal Maritime and Hydrographic Agency National Geospatial-Intelligence Agency National Ice Center National Weather Service U. S. Coast Guard Air Station Elizabeth City U. S. Coast Guard Atlantic Area Staff U. S. Coast Guard Automated Merchant Vessel Emergency Response System U. S. Coast Guard Aviation Training Center Mobile U. S. Coast Guard Communications Area Master Station Atlantic U. S. Coast Guard First District Staff U. S. Coast Guard Headquarters Staff U. S. Coast Guard Maritime Fusion Intelligence Center Atlantic U.S. Coast Guard Navigation Center U. S. Coast Guard Operations Systems Center U. S. Coast Guard Research and Development Center U. S. Naval Fleet Numerical Meteorology and Oceanography Center
It is important to recognize the outstanding efforts of the personnel assigned to the International Ice Patrol during the 2012 Ice Season:
CDR L. K. Mack LCDR J. S. Worst Dr. D. L. Murphy Mr. M. R. Hicks Mrs. B. J. Lis LCDR J. L. Cass LT E. R. Christensen MSTCS J. C. Luzader YN1 I. O. Gonzalez
MST1 K. A. Farah MST1 E. E. Lee MST2 G. J. Woolverton MST2 S. J. Weitkamp MST2 C. R. Hendry MST2 W. N. Moran MST2 T. V. Withers MST2 D. M. Morrisey MST3 M. M. Sanks
International Ice Patrol Staff produced this report using Microsoft Office Word & Excel 2007.
61
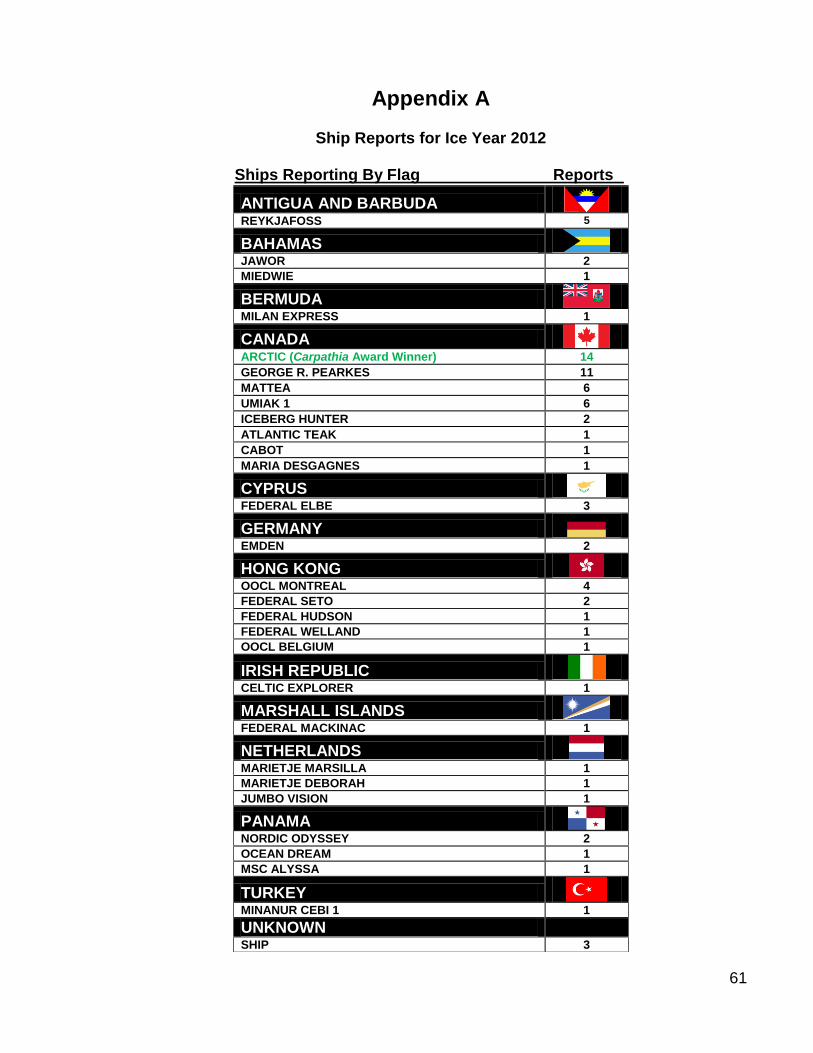
Appendix A
Ship Reports for Ice Year 2012 Ships Reporting By Flag Reports
ANTIGUA AND BARBUDA
REYKJAFOSS 5
BAHAMAS
JAWOR 2
MIEDWIE 1
BERMUDA
MILAN EXPRESS 1
CANADA
ARCTIC (Carpathia Award Winner) 14
GEORGE R. PEARKES 11
MATTEA 6
UMIAK 1 6
ICEBERG HUNTER 2
ATLANTIC TEAK 1
CABOT 1
MARIA DESGAGNES 1
CYPRUS
FEDERAL ELBE 3
GERMANY
EMDEN 2
HONG KONG
OOCL MONTREAL 4
FEDERAL SETO 2
FEDERAL HUDSON 1
FEDERAL WELLAND 1
OOCL BELGIUM 1
IRISH REPUBLIC
CELTIC EXPLORER 1
MARSHALL ISLANDS
FEDERAL MACKINAC 1
NETHERLANDS
MARIETJE MARSILLA 1
MARIETJE DEBORAH 1
JUMBO VISION 1
PANAMA
NORDIC ODYSSEY 2
OCEAN DREAM 1
MSC ALYSSA 1
TURKEY
MINANUR CEBI 1 1
UNKNOWN SHIP 3
62
Appendix B
NAIS Iceberg Product Harmonization
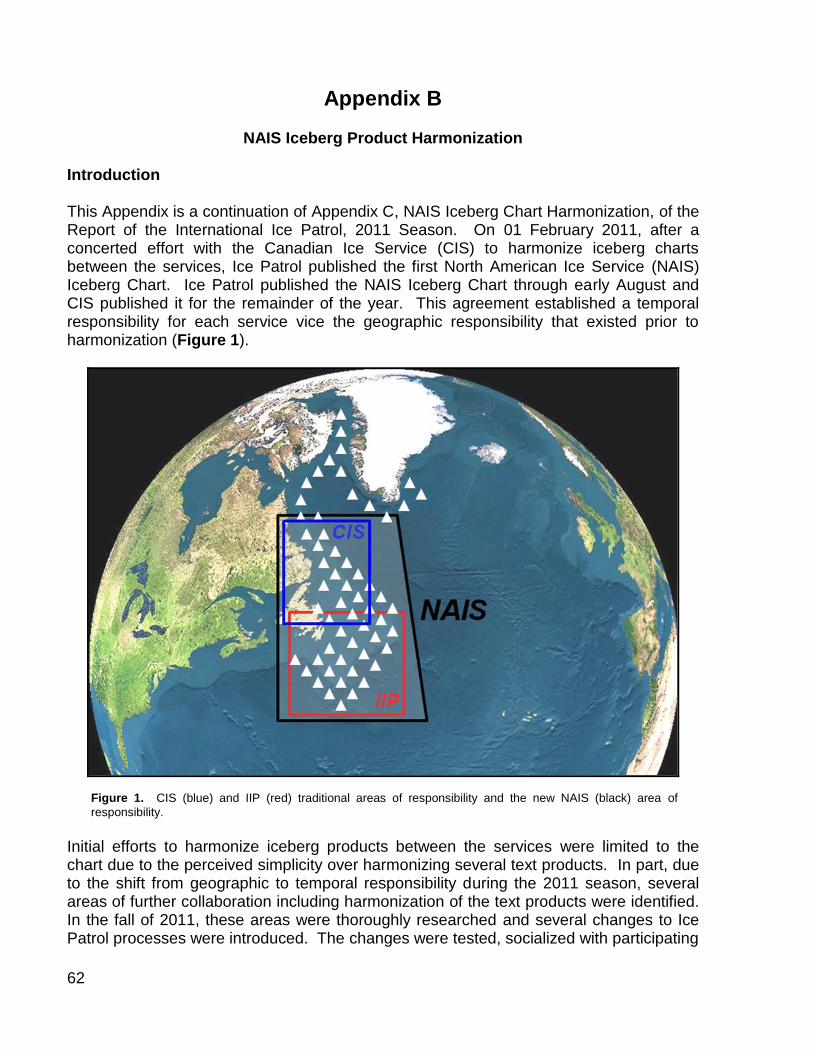
Introduction This Appendix is a continuation of Appendix C, NAIS Iceberg Chart Harmonization, of the Report of the International Ice Patrol, 2011 Season. On 01 February 2011, after a concerted effort with the Canadian Ice Service (CIS) to harmonize iceberg charts between the services, Ice Patrol published the first North American Ice Service (NAIS) Iceberg Chart. Ice Patrol published the NAIS Iceberg Chart through early August and CIS published it for the remainder of the year. This agreement established a temporal responsibility for each service vice the geographic responsibility that existed prior to harmonization (Figure 1).
Figure 1. CIS (blue) and IIP (red) traditional areas of responsibility and the new NAIS (black) area of
responsibility.
Initial efforts to harmonize iceberg products between the services were limited to the chart due to the perceived simplicity over harmonizing several text products. In part, due to the shift from geographic to temporal responsibility during the 2011 season, several areas of further collaboration including harmonization of the text products were identified. In the fall of 2011, these areas were thoroughly researched and several changes to Ice Patrol processes were introduced. The changes were tested, socialized with participating
63
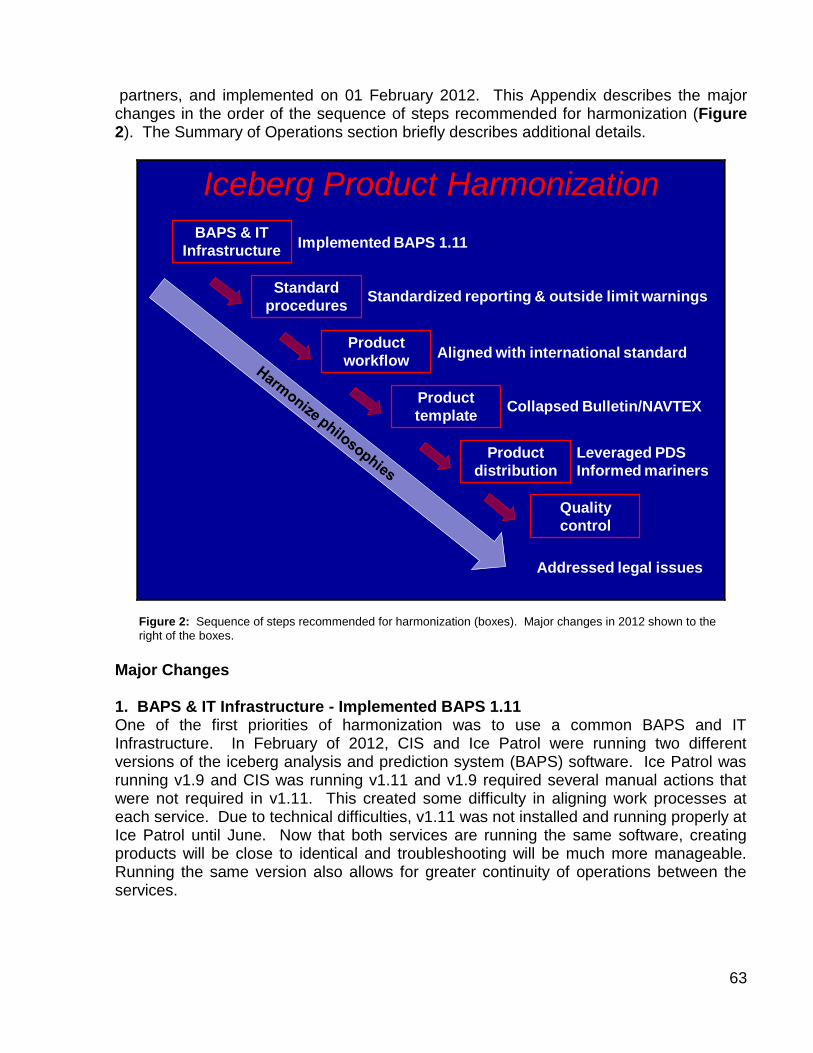
partners, and implemented on 01 February 2012. This Appendix describes the major changes in the order of the sequence of steps recommended for harmonization (Figure 2). The Summary of Operations section briefly describes additional details.
Iceberg Product Harmonization
Standard
procedures
Product
workflow
Product
template
Product
distribution
Quality
control
BAPS & IT
InfrastructureImplemented BAPS 1.11
Standardized reporting & outside limit warnings
Aligned with international standard
Collapsed Bulletin/NAVTEX
Leveraged PDS
Informed mariners
Addressed legal issues
Figure 2: Sequence of steps recommended for harmonization (boxes). Major changes in 2012 shown to the
right of the boxes.
Major Changes 1. BAPS & IT Infrastructure - Implemented BAPS 1.11 One of the first priorities of harmonization was to use a common BAPS and IT Infrastructure. In February of 2012, CIS and Ice Patrol were running two different versions of the iceberg analysis and prediction system (BAPS) software. Ice Patrol was running v1.9 and CIS was running v1.11 and v1.9 required several manual actions that were not required in v1.11. This created some difficulty in aligning work processes at each service. Due to technical difficulties, v1.11 was not installed and running properly at Ice Patrol until June. Now that both services are running the same software, creating products will be close to identical and troubleshooting will be much more manageable. Running the same version also allows for greater continuity of operations between the services.
64
2. Standard Procedures Standardized Iceberg Reporting One of the first areas of further collaboration identified was iceberg reporting by mariners. Previously, mariners were requested to report iceberg sightings to Ice Patrol when in season (producing daily products) and CIS when not in season (not producing daily products). Additionally, Ice Patrol was not staffed for 24-hour operations so relied on the U.S. Coast Guard First District Command Center to receive reports after working hours. Aligning iceberg reporting would provide one receiver of reports for mariners and was expected to minimize the exchange of reports. CIS used the Canadian Coast Guard Marine Communications and Traffic Services (MCTS) to receive iceberg reports under their Ice Information Services Partnership Agreement. Ice Patrol approached CCG to adopt this method of receiving iceberg reports for both CIS and IIP. MCTS St. John’s agreed to receive all iceberg reports and to relay them for all MCTS stations to CIS and IIP. This included reports via Inmarsat sent under a special code (42) that does not charge for reporting. Ice Patrol still receives a copy of Inmarsat reports at the Operations Center but all reports are routed through MCTS St. John’s. Standardized Iceberg Outside the Limit Warnings A second area of further collaboration also involved MCTS St. John’s. CIS’ process for notification of icebergs reported outside of or near the published limit was to have the Canadian Coast Guard issue a Notice to Shipping (NOTSHIP) distributed via several communication methods. This process was not aligned with Ice Patrol’s process that distributed a text product called a “Safety” via several communication methods. Ice Patrol proposed to use the NOTSHIP as the basis for all other notifications of icebergs reported outside or near the published limit. MCTS St. John’s was amenable to this change as it did not significantly change the process on their end. Ice Patrol made significant changes to how it handled the notification, primarily to make the first step after verification to engage MCTS St. John’s in issuing a NOTSHIP. Working with the National Geospatial-Intelligence Agency (NGA), Ice Patrol established a process to issue an urgent NAVAREA IV warning on receipt of a NOTSHIP. This ensured that the warning was broadcast over SafetyNet in a timely manner at any time of day because it did not require action by Ice Patrol personnel. It also allowed Ice Patrol to limit the active watch to 12 hours per day with robust and reliable coverage by this process for the overnight hours. A process to populate the product section of the webpage with the NOTSHIP is in progress. See Figure 3 for the distribution for warnings of icebergs or radar targets outside the limit. 3. Product Workflow - Aligned with International Standard Primary guidance on conduct of the Ice Patrol is provided by the International Convention for the Safety of Life at Sea (SOLAS). Ice Patrol evolved within SOLAS guidance but did not take steps to fully align with the Worldwide Navigation Warning Service (WWMWS) when it was implemented in 1977 or the Global Maritime Distress Safety System (GMDSS) when it was implemented in 1999. As a result of this, Ice Patrol started using SafetyNet, the primary means of long-range navigation warnings in 1998, five years after it was implemented. An analysis of WWNWS and GMDSS requirements clearly indicated the need to align products and distribution with these more modern warning services.

65
Mariner reports iceberg
sighting
NGA NAVAREA
IV
NGA/MSI
Website
SafetyNET
CAMSLANT
CIS
Icebergs or Radar Targets Outside the Limit
IIP
CCGMCTS
St Johns
LegendEmail
FTP
Message System
Broadcast
Via Email/radio/phone/INMARSAT
Revise Products
PLAD Groups
NAVTEX
Ap
pen
dix
N
List Server
NAVCEN IIP website
Subscribing Customers
MS Outlook Rule:Auto forward
messages with “NOTSHIP” in subject line to the List Server.
Figure 3: Icebergs or radar targets outside the limit product distribution flowchart.
Ice Patrol had an existing relationship with NGA to provide navigation warnings for icebergs in Navigational Area (NAVAREA) IV when Ice Patrol was not issuing daily products. Ice Patrol approached NGA to convert all products to NAVAREA IV warnings and they agreed. The effort required close coordination to meet the format requirements for NAVAREA IV warnings. In addition, the SafetyNet window for NAVAREA IV warnings required a revision of the valid time of iceberg products and adjusting the workflow at Ice Patrol. The adjustment to the workflow, in turn, required revising the broadcast times of some other products, particularly the high frequency radiofacsimile chart. This change required coordination with Communications Area Master Station Atlantic that transmits the charts and the National Weather Service (NWS) that receives and stores the charts for transmission. The broadcast times were successfully changed and a transmission was added to ensure around-the-clock coverage. The final distribution schematic prior to the 2012 season is depicted in Figure 4. Small changes to this schematic were made when IIP transferred responsibility for daily products back to CIS in September 2012 and those will be finalized prior to IIP resuming daily products.

66
15-17Z03-05Z 17-20Z00Z
1900Winter
2000Summer
12Z
00
Z E
nvi
ron
me
nta
lsA
rriv
eC
ha
rt(B
) 04
38
Z
Ch
art
(B) 1
03
9Z
Ch
art
(B) 1
60
0Z
00Z
Ch
art
(S) 1
74
1Z
NA
VTE
X(S
J) 1
82
0Z
(win
ter)
NA
VTE
X(S
J) 2
22
0Z
(Su
mm
er)
Ch
art
(G) 2
10
0Z
Ch
art
(B) 2
23
9Z
00Z Watch Routine and Product Distribution Rhythm
Pro
du
cts
Up
da
ted
NLT
21
30
Z
12
Z En
viro
nm
enta
lsA
rriv
e Up
dat
e C
urr
ents
Ru
n 1
2Z
An
alys
isR
un
00
Z P
rog
Gen
erat
e P
rod
uct
sQ
CP
ost
Watch hours – Immediately revise for target outside the iceberg limitOPCEN manned from 0800 – 1630 EST - while generating products0800 EST until checklist complete - while not generating products
Outside of Watch hours- Respond to iceberg outside limit NLT 1400Z
NG
A p
ost
to
Saf
etyN
ET2
20
0Z-
22
30
Z
NG
A p
ost
to
Saf
etyN
ET1
00
0Z-
10
30
Z
Ap
pen
dix
K
Ch
art
(G) 0
93
0Z
Ru
n 0
0Z
An
alys
isR
un
12
Z P
rog
Val
idat
e 0
0Z
Lim
itR
evis
e P
rod
uct
s if
req
uir
ed
13-14Z
Rev
ise
Pro
du
cts
(if
ap
plic
ab
le)
NLT
14
00
Z
SITO
R (B
) 01
40
-023
0Z
SITO
R (B
) 16
30
-172
0Z
Pro
du
cts
Dis
sem
ina
ted
No
Ea
rlie
r Th
an
18
30
Z
Figure 4: Schematic of product distribution.
4. Product Template - Collapsed Bulletin/NAVTEX Products During a visit to CIS in the fall of 2011, CIS and Ice Patrol thoroughly investigated iceberg product distribution. Analysis of how Canadian MCTS and U.S. Communications Stations were receiving iceberg products and broadcasting them led to the realization that the text Bulletin and Navigational Text (NAVTEX) products could be collapsed into one product. U.S. NAVTEX products required significant formatting whereas the Canadian product did not. The NAVTEX broadcast from Boston was eliminated due to limited range and not meeting NAVAREA and SafetyNet requirements for content (iceberg limit was not in NAVTEX range of Boston). This action removed the formatting requirements and only one text product was required for all other broadcasts including the NAVTEX broadcast from MCTS St. John’s. In addition, Ice Patrol made efforts to automate production of the Bulletin as much as possible based on the custom software, BULLPREP, at CIS. This eliminated some work for watchstanders, reduced chances of inducing error, and further improved continuity of operations as the Bulletin was being prepared in a similar way at both services. 5. Product Distribution Leveraged CIS’ Product Distribution System (PDS) In addition to #4 above, the visit to CIS in the fall of 2011 identified another useful tool, CIS’ product distribution system (PDS). The PDS is custom software designed to tailor

67
product distribution to customers. The idea of Ice Patrol using CIS’ PDS had been evaluated previously but not implemented, but harmonization made this a logical step. Ice Patrol worked with both Operations and IT personnel at CIS to make the changes necessary to distribute products via the PDS. Figures in the Summary of Operations section demonstrate how CIS or IIP can populate the PDS with iceberg products for distribution to the same customer base. This effort greatly automated the previously manually intensive distribution at Ice Patrol and vastly improved continuity of operations between the services. Informed Mariners of Changes One of the most important steps in implementing major changes to workflow and product distribution was to inform mariners. Both CIS and Ice Patrol distributed products via their webpages so this was a primary tool of publishing changes. Ice Patrol annually distributed an Announcement of Services that provided information on products and distribution. Ice Patrol also periodically distributed a brochure requesting iceberg reports. For 2012, these two documents were combined into a NAIS Iceberg & Information Services (IIS) brochure published on the webpage and printed for distribution to the traditional recipients of the Announcement of Services. In addition to the NAIS IIS brochure, Ice Patrol and CIS developed Iceberg Bulletin and Chart information sheets (Figure 5). Once the services agreed on the sheets, CIS converted them to French for their webpage.
Figure 5: Examples of communicating changes to mariners.
Leading up to the changes that became effective 01 February 2012, Ice Patrol advised mariners of the changes directly on daily products with guidance on how to obtain

68
additional information. These efforts led to a fairly seamless transition to a complete NAIS iceberg product suite. 6. Quality Control The above major changes took most of the time and effort of the off-season to research and implement so quality control of each services’ products was not assessed in detail. Each service continued to quality control its own products. As the 2012 season progressed, it was clear that one advantage of the above changes was that both services reviewed products daily so quality control was inherent in the harmonization. 7. Addressed Legal Issues Similar to the iceberg chart harmonization in 2011, a couple of legal issues arose as IIP researched and began implementing the changes discussed above. Commander, International Ice Patrol again reached out to the Office of International Law at U.S. Coast Guard Headquarters for a legal determination. In January 2012, a thorough legal review was complete and Ice Patrol proceeded with all of the changes discussed on 01 February. Question 1: Is sending a NAVAREA IV warning with a specific iceberg location outside of the iceberg limit consistent with SOLAS and U.S. Code? This question was primarily related to the lack of a 24-hour watch at Ice Patrol. Watchstanders were expected to be available for 12 hours of the watch day to create and distribute products as well as respond to iceberg reports. The other 12 hours of the watch day when the watchstander was out of the office was coordinated for MCTS St. John’s to issue a NOTSHIP if an iceberg was reported outside the published limit. The watchstander would then revise products if necessary upon return to the office. The legal question was if the NOTSHIP converted to a NAVAREA IV warning with the iceberg location was equivalent to publishing a new iceberg limit. The Office of International Law determined that use of NAVAREA IV warnings to notify ships of specific iceberg locations is consistent with SOLAS and U.S. Code. Neither SOLAS nor U.S. Code states exactly how vessels should be notified of ice conditions or dangerous areas, merely that the U.S. government should make such notifications. Notification via NAVAREA IV warnings, both for the iceberg limit and icebergs reported outside the published limit, were deemed acceptable. Question 2: Is using Canadian sourcing for NAVAREA IV warnings vice U.S. sourcing legally prohibited? This question was related to the first question in that it referred to the NOTSHIP being converted to a NAVAREA IV warning. The Office of International Law determined that NAVAREA IV warnings from Canadian sources vice U.S. sources is not legally prohibited in the law nor does it raise the potential for liability. Also recommended was making the public aware of the change in practice, memorializing the practice, and monitoring the practice for reliability. Ice Patrol took action on all of the recommendations and the practice worked well during the 2012 season.

69
Once the areas of concern were satisfactorily addressed, Ice Patrol briefed the First Coast Guard District, Ice Patrol’s Operational Commander, and the Program Manager at U.S. Coast Guard Headquarters on the changes. Future Steps Making the above major changes took organizational commitment to NAIS and dedicated effort by CIS and IIP personnel. The main benefits of moving to harmonized products between IIP and CIS were reducing redundancy, improving efficiency, and ultimately providing a better product to the maritime community with a customer-focused approach. The 2011 Appendix indicated that “an average iceberg season will be a true test of the overall concept”. The 2012 season proved to be an adequate test of the concept. Frequent communication between the services assisted in resolving issues that arose due to the major changes. Remaining steps include quantifying the improved efficiency. The chart harmonization itself reduced chart production between the services by one-third while maintaining the same level of service to mariners. The additional changes made in 2012 should be quantified in terms of savings in resources such as funding and time spent generating NAIS iceberg products. One intangible benefit of harmonization is that CIS and IIP operations are more similar than ever – product harmonization and continuity of operations are complementary processes that, when pursued in tandem, result in better alignment than if pursued separately. Next steps for Ice Patrol include formalizing the new relationship with NGA to disseminate iceberg information as NAVAREA IV warnings in the form of a memorandum of understanding. In addition, Ice Patrol is working with CIS and NWS to find a solution to CIS being able to transfer the chart for U.S. transmission.

70
Appendix C
This Appendix evaluates Canadian Ice Service (CIS) and International Ice Patrol (IIP) reconnaissance for the 2012 ice season in order to assess the effectiveness of the North American Ice Service (NAIS) joint reconnaissance strategy. The objective is to determine how actual reconnaissance aligned with the reconnaissance areas and goals depicted in Figure 1. Data provided includes hours flown by each service, coverage of the designated reconnaissance areas, and the gap in coverage, if any.
Figure 1: NAIS joint reconnaissance strategy.
In 2012, Ice Patrol flew 28 patrols for a total of 294.2 hours. CIS contracted 14 patrols flown by Provincial Aerospace Limited (PAL) for a total of 108.0 hours. Six iceberg patrols were conducted by Transport Canada for CIS for a total of 49.0 hours. The combined total for both agencies is 48 patrols for a total of 451.2 hours in support of NAIS. These figures are shown in Figure 2. The average number of IIP flight hours from 1983, when Ice Patrol began using the side-looking airborne radar, to present is also shown.
NAIS Joint Reconnaissance Strategy
MST1 Ken A. Farah MST2 Sara J. Weitkamp
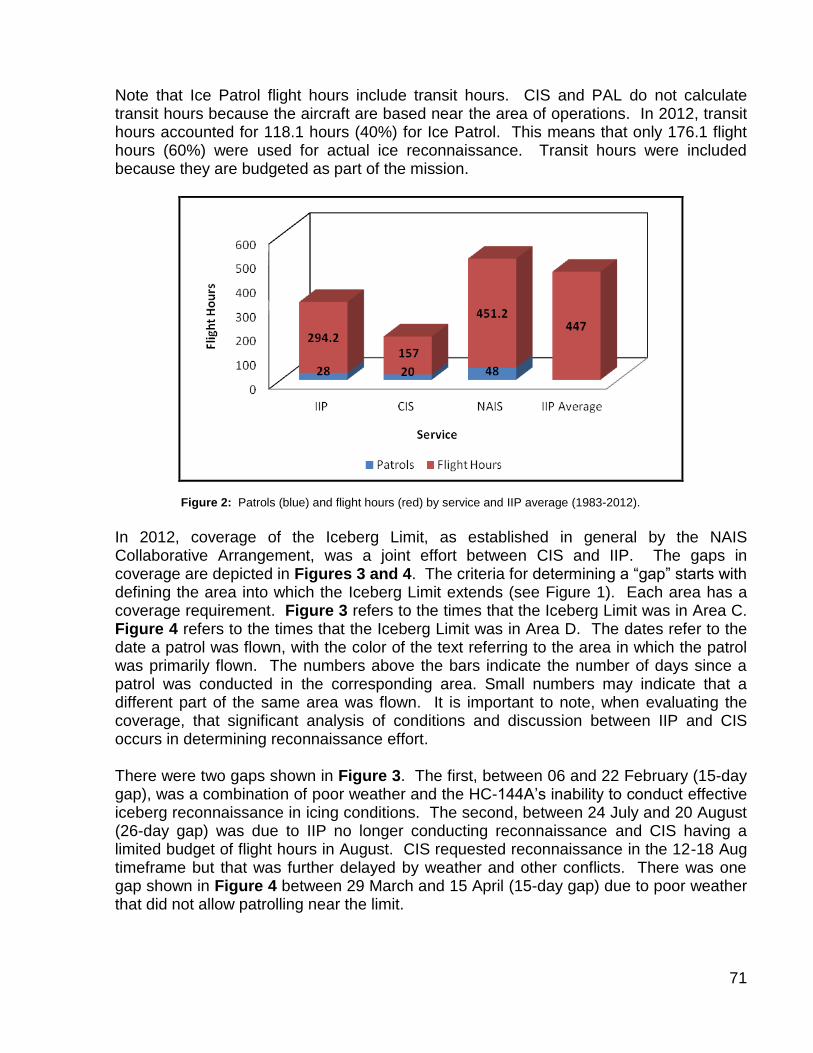
71
Note that Ice Patrol flight hours include transit hours. CIS and PAL do not calculate transit hours because the aircraft are based near the area of operations. In 2012, transit hours accounted for 118.1 hours (40%) for Ice Patrol. This means that only 176.1 flight hours (60%) were used for actual ice reconnaissance. Transit hours were included because they are budgeted as part of the mission.
Figure 2: Patrols (blue) and flight hours (red) by service and IIP average (1983-2012).
In 2012, coverage of the Iceberg Limit, as established in general by the NAIS Collaborative Arrangement, was a joint effort between CIS and IIP. The gaps in coverage are depicted in Figures 3 and 4. The criteria for determining a “gap” starts with defining the area into which the Iceberg Limit extends (see Figure 1). Each area has a coverage requirement. Figure 3 refers to the times that the Iceberg Limit was in Area C. Figure 4 refers to the times that the Iceberg Limit was in Area D. The dates refer to the date a patrol was flown, with the color of the text referring to the area in which the patrol was primarily flown. The numbers above the bars indicate the number of days since a patrol was conducted in the corresponding area. Small numbers may indicate that a different part of the same area was flown. It is important to note, when evaluating the coverage, that significant analysis of conditions and discussion between IIP and CIS occurs in determining reconnaissance effort. There were two gaps shown in Figure 3. The first, between 06 and 22 February (15-day gap), was a combination of poor weather and the HC-144A’s inability to conduct effective iceberg reconnaissance in icing conditions. The second, between 24 July and 20 August (26-day gap) was due to IIP no longer conducting reconnaissance and CIS having a limited budget of flight hours in August. CIS requested reconnaissance in the 12-18 Aug timeframe but that was further delayed by weather and other conflicts. There was one gap shown in Figure 4 between 29 March and 15 April (15-day gap) due to poor weather that did not allow patrolling near the limit.

72
Figure 3: Patrols conducted when the Iceberg Limit was in Area C.
Figure 4: Patrols conducted when the Iceberg Limit was in Area D.
D-Area Limit

73
Appendix D
BAPS Replacement
Mr. Doug Jackson Mobility & Ice Operations Division (CG-WWM-3), U. S. Coast Guard Headquarters
Background The iceberg analysis and prediction system (BAPS) is the framework for executing the iceberg drift and deterioration model. The model was developed by Ice Patrol in the early 1990s and incorporated into the BAPS application developed by the Canadian Ice Service (CIS) to produce a common tool between the services. BAPS was first used operationally by Ice Patrol in 1997 (Figure 1). In 2009, Ice Patrol provided input to their Program Manager, CG-WWM-3, to draft a resource proposal that requested ~$1.5M to start a BAPS replacement project. The FY 2012 request was not approved. Due to the increasing obsolescence of BAPS, in 2010, a detailed analysis by Ice Patrol’s Information Technology (IT) Specialist concluded that the authority to operate the system would most likely be rescinded when Microsoft stopped issuing security updates for Windows XP in April 2014. The lack of security updates would make the system too vulnerable to operate reliably. The obsolescence was preventing Ice Patrol from utilizing a new iceberg model adopted by the North American Ice Service. It was also preventing Ice Patrol from utilizing improved ocean current data or displaying satellite data. A BAPS replacement needed to resolve the obsolescence issue and provide additional functionality.
Figure1: Schematic of BAPS in Ice Patrol operations.

74
Alternatives Analysis During 2010, Ice Patrol conveyed the mission-critical urgency of BAPS replacement to the Program Manager in correspondence and meetings. The Program Manager, with funding from the First Coast Guard District and the Deputy Commandant of Operations (DCO), contracted with the U.S. Coast Guard Research & Development Center to conduct an Alternatives Analysis (AA) and create a Functional Requirements Document (FRD). The AA considered four alternatives: status quo - allow BAPS to fail, upgrade the hardware and software as a stand-alone system at the Ice Patrol, upgrade the hardware and software but host the server at a Department of Homeland Security data center, and upgrade the hardware and software but integrate BAPS into the Coast Guard One View system. The analysis demonstrated that allowing BAPS to fail would double Ice Patrol’s required aircraft support and increase Coast Guard costs exponentially. The analysis recommended:
BAPS be upgraded initially in its current configuration with the lowest non-recurring and recurring life cycle costs and the lowest acquisition risk given the fiscal climate and potential budget impact
A phased transition be developed to move the modernized BAPS to an enterprise-level application that is hosted on USCG infrastructure
Project Initiation On completion of the AA in early FY 2012, the Program Manager established a team to manage the BAPS replacement project. In addition to the Program Manager, the team consisted of the Office for C2 & Operations Information Systems (CG-7612) and the Operations Systems Management Division (CG-633). Ice Patrol’s IT Specialist was designated as the team’s subject matter expert. The Project Team established a software development life cycle (SDLC) process and formal connections between the offices. In 2011, the Assistant Commandant for C4&IT (CG-6) identified BAPS as a legacy C4&IT system in the Operations and Maintenance phase of the SDLC. All Coast Guard organizations involved in the planning, acquisition, production, deployment, support, operation, and disposition of C4&IT systems are required to follow the SDLC. Adherence to the SDLC supports compliance with the Office of Management and Budget Circular and DHS acquisition policies. In 2012, as a result of the AA, CG-6 designated BAPS 2.0 as a system upgrade, entering the SDLC at the Planning and Requirements phase. The Project Team had requested FY 2012 backlog funding to start the project. In late 2012, ~$1M in funding from CG-761 and DCO was provided to contract with the U.S Coast Guard Operations Systems Center to begin modifications to the BAPS software. By September 2012, the contract was in place and work had begun on a feasibility study to determine the best approach.
75
Future Steps Initially, BAPS will be modified to operate on a more current client workstation operating system, Windows 7 or greater. This will mitigate the anticipated system failure in 2014 and allow additional work to improve BAPS functionality. The initial modification is expected to be ready for testing in late FY 2013, initial operating capability in early FY 2014, and full operating capability by the start of the ice season in 2014. One of the functional requirements is to share the application with CIS and that timeline will be developed during the initial modification. In parallel with the recapitalization, the BAPS Project Team will complete the necessary documentation and tasks to satisfy the SDLC process and move BAPS into the Design phase. Once continued operation is assured, the project will move to improvements in functionality. The focus will be to ensure that BAPS meets all the requirements listed in the FRD. Among the requirements, BAPS will automate all inputs and outputs, assist the watchstander in decision-making related to iceberg products, and automate production and distribution. The length of time and cost of these updates is currently unknown. As part of the current project, a way forward and an estimate of costs will be developed. The final goal of the project, pending additional funding, is to move the modernized BAPS to an enterprise-level application hosted on the U.S. Coast Guard infrastructure. The intention is to eliminate the need for non-standard workstations, ensure connectivity between system environments (production, engineering, and continuity of operations), and provide BAPS with hardware and connectivity support through the C4&IT Service Center. During this phase of the project, the BAPS Project Team will work to move the system through the Design and Development SDLC phases. At the completion of these phases, BAPS 2.0 will be in the Operations and Maintenance phase. The project will have developed all SDLC artifacts and ensured that all segment architecture and a change management program have been implemented.

76
Appendix E
Introduction This appendix describes the events that Ice Patrol participated in during the 2012 season to commemorate the centennial of the sinking of RMS Titanic in April of 1912. Media and public interest for the centennial was expected to be significant and Ice Patrol relied on several other U.S. Coast Guard units and longtime partners to commemorate the centennial in a dignified and solemn manner. Photos included in this appendix are U.S. Coast Guard photos unless otherwise noted. Background In the late evening of 14 April 1912, RMS Titanic, steaming from Southampton, England, en route to New York City, struck an iceberg south of the Tail of the Grand Banks. Hours later, on 15 April 1912, Titanic sank with the loss of over 1500 lives. Over 700 survivors were rescued by the RMS Carpathia. The tragedy galvanized the international community to establish an ice patrol for the transatlantic shipping lanes. By May of 1912, the U.S. Navy was conducting patrols of the Grand Banks to warn ships of iceberg danger. In 1913, with the U.S. Navy unable to provide ships, the U.S. Revenue Cutter Service took over the mission and to this day, with the exception of the two World Wars, the U.S. Coast Guard has conducted this important maritime safety mission. The first International Convention for the Safety of Life at Sea in1914 formalized the ice patrol service, and based on the experience of the previous two years, the U.S. was asked and agreed to overall management of the service. From information contained in annual reports, the Ice Patrol has conducted a Titanic memorial ceremony to include a wreath laying or drop since at least 1923. The Titanic Historical Society has provided a wreath for this purpose since 1972 and the Titanic International Society has provided a wreath for several years. The centennial commemoration provided an opportunity to continue this tradition as well as highlight the unique mission and dedicated personnel of the Ice Patrol.
Titanic Centennial Commemoration
CDR Lisa K. Mack MST2 Sara J. Weitkamp MST3 Megan M. Sanks
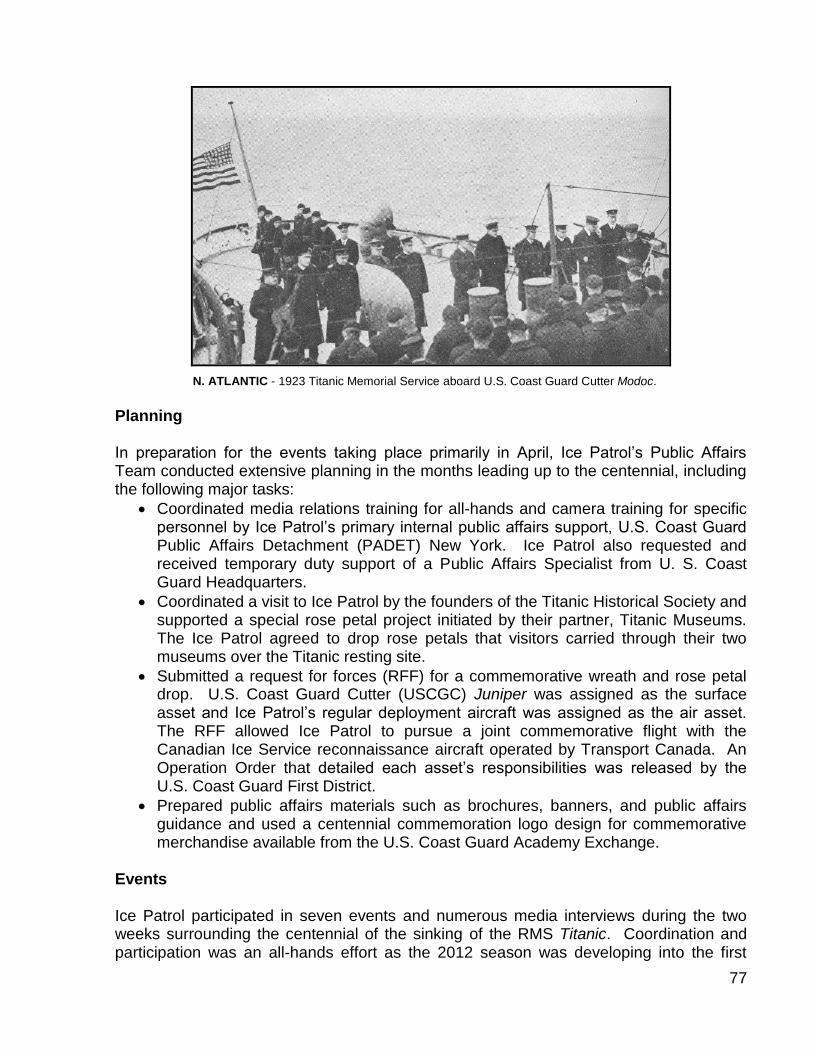
77
N. ATLANTIC - 1923 Titanic Memorial Service aboard U.S. Coast Guard Cutter Modoc.
Planning In preparation for the events taking place primarily in April, Ice Patrol’s Public Affairs Team conducted extensive planning in the months leading up to the centennial, including the following major tasks:
Coordinated media relations training for all-hands and camera training for specific personnel by Ice Patrol’s primary internal public affairs support, U.S. Coast Guard Public Affairs Detachment (PADET) New York. Ice Patrol also requested and received temporary duty support of a Public Affairs Specialist from U. S. Coast Guard Headquarters.
Coordinated a visit to Ice Patrol by the founders of the Titanic Historical Society and supported a special rose petal project initiated by their partner, Titanic Museums. The Ice Patrol agreed to drop rose petals that visitors carried through their two museums over the Titanic resting site.
Submitted a request for forces (RFF) for a commemorative wreath and rose petal drop. U.S. Coast Guard Cutter (USCGC) Juniper was assigned as the surface asset and Ice Patrol’s regular deployment aircraft was assigned as the air asset. The RFF allowed Ice Patrol to pursue a joint commemorative flight with the Canadian Ice Service reconnaissance aircraft operated by Transport Canada. An Operation Order that detailed each asset’s responsibilities was released by the U.S. Coast Guard First District.
Prepared public affairs materials such as brochures, banners, and public affairs guidance and used a centennial commemoration logo design for commemorative merchandise available from the U.S. Coast Guard Academy Exchange.
Events Ice Patrol participated in seven events and numerous media interviews during the two weeks surrounding the centennial of the sinking of the RMS Titanic. Coordination and participation was an all-hands effort as the 2012 season was developing into the first

78
moderate iceberg season in three years after two light seasons. Details of the events are described in the following pages. Tuesday, 10 April 2012 RMS Titanic Centennial Memorial Ceremony USCGC Juniper, U.S. Coast Guard Base Boston, Boston, Massachusetts -Remarks by: Rear Admiral Daniel Neptun, Commander, First Coast Guard District Mr. Edward Kamuda, President, Titanic Historical Society Mrs. Catherine Bernstein, Trustee, Titanic International Society -Presentation of rose petals by Mr. Rick Laney, Titanic Museums -Wreaths donated by Fisher’s Florist, Ship Society of South Africa, Titanic Heroes, Titanic Historical Society, and Titanic International Society
BOSTON - Rear Admiral Neptun, Commander, First Coast Guard District, speaks at the memorial ceremony onboard USCGC Juniper.
Wednesday, 11 April 2012 “Titanic – 12,450 Feet Below” Exhibit Opening Mystic Aquarium, Mystic, Connecticut -Remarks by Dr. Robert Ballard, Oceanographer and Discoverer of Titanic Media Interview/Photo Opportunity USCG HC-130J aircraft, Groton-New London Airport, Groton, Connecticut -Interviews by International Ice Patrol and Air Station Elizabeth City crewmembers
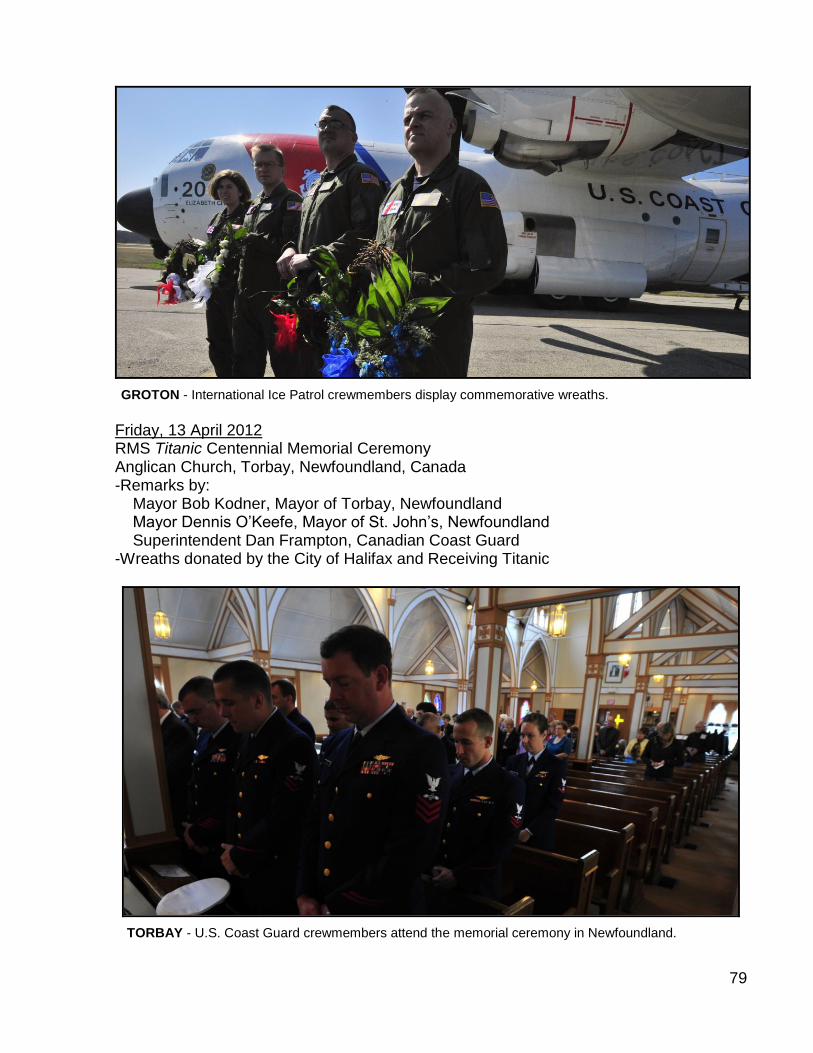
79
GROTON - International Ice Patrol crewmembers display commemorative wreaths.
Friday, 13 April 2012 RMS Titanic Centennial Memorial Ceremony Anglican Church, Torbay, Newfoundland, Canada -Remarks by: Mayor Bob Kodner, Mayor of Torbay, Newfoundland Mayor Dennis O’Keefe, Mayor of St. John’s, Newfoundland Superintendent Dan Frampton, Canadian Coast Guard -Wreaths donated by the City of Halifax and Receiving Titanic
TORBAY - U.S. Coast Guard crewmembers attend the memorial ceremony in Newfoundland.
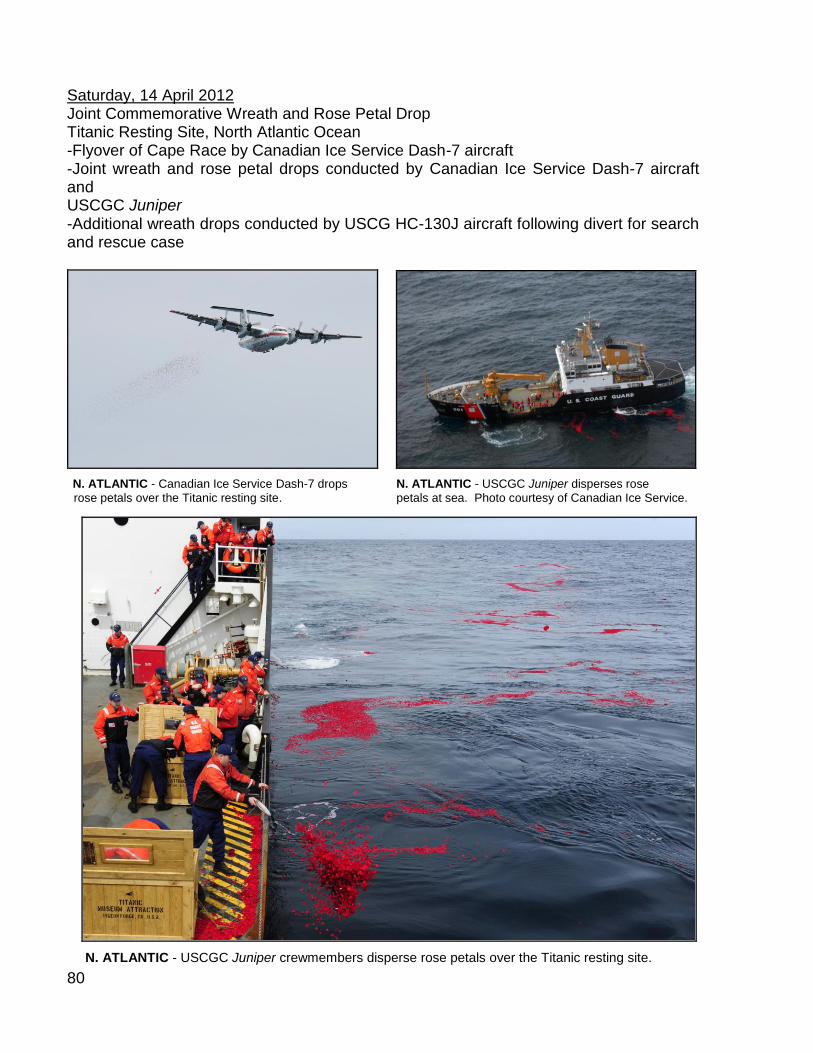
80
Saturday, 14 April 2012 Joint Commemorative Wreath and Rose Petal Drop Titanic Resting Site, North Atlantic Ocean -Flyover of Cape Race by Canadian Ice Service Dash-7 aircraft -Joint wreath and rose petal drops conducted by Canadian Ice Service Dash-7 aircraft and USCGC Juniper -Additional wreath drops conducted by USCG HC-130J aircraft following divert for search and rescue case
N. ATLANTIC - Canadian Ice Service Dash-7 drops N. ATLANTIC - USCGC Juniper disperses rose rose petals over the Titanic resting site. petals at sea. Photo courtesy of Canadian Ice Service.
N. ATLANTIC - USCGC Juniper crewmembers disperse rose petals over the Titanic resting site.

81
N. ATLANTIC - Air Station Elizabeth City crewmembers drop commemorative wreaths
over the Titanic resting site.
Sunday, 15 April 2012 Titanic 100 Society Titanic Spiritual Ceremony Fairview Lawn Cemetery, Halifax, Nova Scotia, Canada -Remarks by the Honourable Peter McKay, Minister of National Defence -U.S. Coast Guard remarks by CDR Lisa Mack, Commander, International Ice Patrol
HALIFAX - Flowers decorate graves of Titanic victims at Fairview Lawn Cemetery.
Vaughn, A. (2012). Fairview Lawn Cemetery [Photograph]. Retrieved from http://www.ctvnews.ca/victims-of-titanic-sinking-honoured-100-years-later-1.796513

82
Saturday, 22 April 2012 Titanic Historical Society Memorial Unveiling and Dedication Ceremony Oak Grove Cemetery, Springfield, Massachusetts -Remarks by the Honorable Richard Neal, United States House of Representatives, 2nd District of Massachusetts -U.S. Coast Guard remarks by Dr. Donald Murphy, Chief Scientist, International Ice Patrol
SPRINGFIELD - Dr. Murphy, Chief Scientist, International Ice Patrol, speaks at the Titanic Historical Society’s Titanic Memorial Unveiling and Dedication Ceremony.
Notable Coverage Print – International: Print – National: Agence France-Presse (France) ABC Science Daily Sun (Bangladesh) CNET News India Vision (India) Discovery News Jakarta Globe (Java) Scientific American Oman Tribune (Oman) The Atlantic Ottawa Citizen (Canada) U.S. Capitol Historical Society PAB News (United Kingdom) Süddeutsche Zeitung (Germany) Print – Military: Tendencias 21 (Spain) Seapower The Canadian Press (Canada) Navy Times The Chronicle Herald (Canada) Proceedings Magazine (USCG) The Guardian (United Kingdom) Coast Guard Magazine

83
Television: Radio: Bedlam Productions (United Kingdom) Canadian Broadcasting Corporation Dan Rather Reports Federal News Radio Discovery Channel Canada Irish National Radio ITV Meridian (United Kingdom)
BOSTON - YN1 Gonzalez and MST2 Weitkamp ST. JOHN’S - MSTCS Luzader and MST2 Hendry take
talk to students during an exhibit. turns conducting an interview at the airport.
ST. JOHN’S – Crewmembers pose for filming at the GROTON - CDR Mack conducts an interview at the
airport. airport.
Acknowledgement Thank you to our U.S. and Canadian partners for their outstanding support of International Ice Patrol’s Titanic Centennial Commemoration.

To Order International Ice Patrol Annual Reports from the National Technical Information Service (NTIS)
1. The Report of the International Ice Patrol in the North Atlantic, for each season from 1963 to 2011, may be ordered online through the NTIS webpage (http://www.ntis.gov) using the appropriate NTIS Accession Number as listed below. 2. Please see the NTIS webpage for additional ordering methods including phone, mail, fax, and e-mail as well as pricing and shipping information.
Year NTIS Accession Number Year NTIS Accession Number
1963 AD777952 1992 PB2002100029
1964 AD774510 1993 PB2002100028
1965 AD774511 1994 PB2002100030
1966 AD692936 1995 PB2002100023
1967 AD774504 1996 PB2002100025
1968 AD774505 1997 PB2002100024
1969 AD718504 1998 PB2002100022
1970 AD736981 1999 PB2002100514
1971 AD778013 2000 PB2003100304
1972 AD780537 2001 PB2003101111
1973 ADA020336 2002 PB2003107684
1974 ADA055267 2003 PB2004106733
1975 ADA058898 2004 PB2006106452
1976 ADA066081 2005 PB2007108145
1977 ADA075246 2006 PB2007112255
1978 ADA079474 2007 PB2009101762
1979 ADA093073 2008 PB2009101763
1980 ADA113555 2009 PB2011108676
1981 ADA134791 2010 PB2012107479
1982 ADA149595 2011 PB2013103508
1983 ADA259815
1984 ADA261408
1985 ADA259656
1986 ADA259816
1987 ADA259817
1988 ADA261407
1989 ADA259818
1990 ADA256161
1991 ADA256162

U.S. DEPARTMENT OF COMMERCE NATiONAl TEChNiCAl iN FOR MA TiON SERviCE
CUSTOMER MASTER NUMBER (IF KNOWN) DATE
ATTENTION/NAME
ORgANIzATION DIvISION / ROOM NUMBER
STREET ADDRESS
CITy STATE zIp CODE
pROvINCE / TERRITORy INTERNATIONAL pOSTAL CODE
COUNTRy
phONE NUMBER FAx NUMBER
CONTACT NAME INTERNET E-MAIL ADDRESS
$
$
$
$
$
$
$
$
ShiP TO ADDRESS (please print or type)
PRODUCT SElECTiON (please print or type)Most of the documents available from NTIS are reproduced on demand from our electronic archive and are not original stock.
NTIS ProducT Number ToTal PrIce
Order Most Recent Products Online at http://www.ntis.gov
Thank you for your order!GraNd ToTal
Sub-ToTal (Value of Order)
ShIPPING & haNdlING fee See charT
$
$
$
$
$
$
$
QuaNTITy Please indicate OutPut
pRINT-ON-DEMAND
OThERuNIT PrIce
2009-07
ORDER FORM
order by PhoNe (eliminate mail time) 8:00 a.m. - 6:00 p.m. Eastern Time, M – F. Sales Desk: 1-800-553-NTIS (6847) or (703) 605-6000 TDD: (703) 487-4639 (8:30 a.m. - 5:00 p.m.)
cuSTomer SerVIce E-mail: [email protected] phone: 1-888-584-8332 or (703) 605-6050
order by faX – (703) 605-6900To verify receipt of fax call: (703) 605-6090, 7:00 a.m. - 5:00 p.m. Eastern Time, M-F.
order by maIl National Technical Information Service 5301 Shawnee Road Alexandria, VA 22312
ruSh SerVIce is available for an additional fee. Call 1-800-553-6847 or (703) 605-6000.
cerTIfIcaTIoN SerVIce is available for an additional fee. This service guarantees that you are receiving the official publication. Call 1-800-553-6847 or (703) 605-6000.
INVoIcING fee (U.S., Canada, and Mexico only)NTIS will gladly bill your order, for an additional fee of $15.00. A request to be invoiced must be on a purchase order or com pa-ny letterhead. An authorizing sig na ture, contact name, telephone number, and Tax Identification Number (TIN) should be included with this request. Requests may be mailed or faxed.
mulTIPle coPy dIScouNTS – Please call the Sales Desk at 1-800-553-NTIS (6847) or (703) 605-6000 for information on multiple copy discounts available for certain documents.
❏ Check / Money Order en closed for $ __________ (pAyABLE TO NTIS IN U.S. DOLLARS) your check will be converted into an electronic fund transfer, see http://www.ntis.gov/help/eft.aspx for details.
CREDIT CARD NUMBER ExpIRATION DATE
CARDhOLDER’S NAME
METhOD OF PAYMENT (please print or type)
❏ NTIS Deposit Account Number:
❏ vISA ❏ MasterCard ❏ American Express ❏ Discover
Prices subject to change.
all SaleS are fINal – NTIS electronically stores many of the 3 million items in our collection and custom-reproduces a single copy specifically for your order. Therefore, NTIS does not accept cancellations, requests for modifications, or returns for credit or refund. All sales are final. NTIS strives to provide quality products, reliable service, and fast delivery. Please contact Customer Service for a replacement within 30 days if the item you receive is defective or if we have made an error in filling your order.
ShIPPING aNd haNdlING feeS
Value of Order U.S. and territories Canada and Mexico Outside North America
$0 - $100 $6 $12 $30
$101-$999 6% 12%
30%$1,000 - $4,999 4% 8%
$5,000+ 3.5% 7%
ProducT TITle ELECTRONIC-ON-DEMAND