historical changes in the distribution and functions of...
TRANSCRIPT

Historical changes in the distribution andfunctions of large wood in Puget Lowland rivers
Brian D. Collins, David R. Montgomery, and Andrew D. Haas
Abstract: We examined changes in wood abundance and functions in Puget Lowland rivers from the last ~150 years ofland use by comparing field data from an 11-km-long protected reach of the Nisqually River with field data from theSnohomish and Stillaguamish rivers and with archival data from several Puget Lowland rivers. Current wood abundanceis one to two orders of magnitude less than before European settlement in the Snohomish and Stillaguamish basins.Most importantly, wood jams are now rare because of a lack of very large wood that can function as key pieces andlow rates of wood recruitment. These changes in wood abundance and size appear to have fundamentally changed themorphology, dynamics, and habitat abundance and characteristics of lowland rivers across scales from channel unit tovalley bottom. Based on our field studies, rivers had substantially more and deeper pools historically. Archival data andfield studies indicate that wood jams were integral to creating and maintaining a dynamic, anastomosing river patternwith numerous floodplain channels and abundant edge habitat and routed floodwaters and sediment onto floodplains.Establishing the condition of the riverine landscape before European settlement sets a reference against which toevaluate contemporary conditions and develop restoration objectives.
Résumé: La comparaison d’observations de terrain sur un tronçon protégé de 11 km de la rivière Nisqually à desdonnées provenant des rivières Snohomish et Stillaguamish, ainsi qu’à des données anciennes sur plusieurs rivières desterres basses de Puget nous ont permis d’étudier les changements dans l’abondance et le rôle du bois dans ces rivièresau cours d’approximativement les dernières 150 années d’utilisation des terres. L’abondance actuelle du bois est de 10à 100 fois moins grande qu’avant la colonisation des bassins de la Snohomish et de la Stillaguamish par les européens.Ce qui est plus important, c’est la rareté des embâcles à cause de l’absence de très grandes pièces de bois pour servirde structures maîtresses et des taux réduits d’apport de bois. Ces changements dans l’abondance et la taille du boissemblent avoir modifié de façon fondamentale la morphologie, la dynamique, ainsi que la densité et les caractéristiquesdes habitats dans les rivières des terres basses à diverses échelles, depuis les unités individuelles de lit de rivièrejusqu’à l’ensemble du fond de la vallée. D’après nos observations de terrain, les rivières avaient des cuvettes plusnombreuses et plus profondes dans le passé. Nos données d’archives et nos études récentes sur le terrain indiquent queles embâcles jouaient un rôle essentiel dans la création et le maintien d’une structure fluviale dynamique et anasto-mosée, caractérisée par de multiples chenaux sur la plaine d’inondation et de nombreux habitats de lisière, de mêmeque dans le déversement des eaux de crue et des sédiments sur la plaine d’inondation. L’établissement des conditionsdu paysage fluvial existant avant la colonisation européenne fournit un point de référence pour évaluer la situationprésente et fixer les objectifs de restauration.
[Traduit par la Rédaction] Collins et al. 76
Introduction
Numerous studies have established that wood has a pri-mary influence on channel form in small forest streams, butless is known about wood in larger rivers. Recent literaturesummaries indicate that the influence of wood “decreaseswith increasing channel size” (Bilby and Bisson 1998).However, in large rivers of the Pacific Northwest, 19th and20th century stream cleaning greatly diminished wood abun-dance, and riparian forest clearing and levee construction re-
duced the potential for lowland floodplain rivers to recruitwood (e.g., Sedell and Luchessa 1981; Sedell and Frogatt1984). This suggests that the current condition of regionalrivers is not representative of their historical condition andhighlights the need for a benchmark against which to assessrestoration efforts. Recent work on the Hoh and Queetsrivers in Washington’s Olympic National Park (Sedell et al.1984; Abbe and Montgomery 1996) shows how woodshapes large channels and their aquatic habitat. The purposesof this paper are (i) to document historical conditions in
Can. J. Fish. Aquat. Sci.59: 66–76 (2002) DOI: 10.1139/F01-199 © 2002 NRC Canada
66
Received 8 September 2000. Accepted 13 November 2001. Published on the NRC Research Press Web site at http://cjfas.nrc.ca on14 January 2001.J15961
B.D. Collins1 and D.R. Montgomery. Department of Earth and Space Sciences, University of Washington, Seattle, WA 98195, U.S.A.A.D. Haas.2 Tulalip Tribes Natural Resources Department, 7615 Totem Beach Road, Marysville, WA 98271, U.S.A.
1Corresponding author (e-mail: [email protected]).2Present address: Snohomish County Department of Public Works, Surface Water Management Division, 2731 Wetmore Avenue,Suite 300, Everett, WA 98201, U.S.A.
J:\cjfas\cjfas59\cjfas-01\F01-199.vpThursday, January 10, 2002 9:25:02 AM
Color profile: DisabledComposite Default screen

Puget Sound rivers, to compare to current conditions docu-mented in the Olympic Peninsula studies for assessing thesestudies’ geographic generality, and to extend those studiesby evaluating a broader range of wood structures and ef-fects; (ii ) to document changes that have occurred sinceEuropean settlement; and (iii ) to use these changes as along-term removal experiment and to evaluate hypothesesabout wood functions. We do this by comparing the role ofwood in Puget Lowland rivers under current and historicalconditions by assessing amounts and types of wood accumu-lations, and their influence on channel structure, in relativelydeveloped and undeveloped rivers using both field and ar-chival studies.
To investigate representative current conditions, we exam-ined the Snohomish and Stillaguamish rivers. In the past ~150
years, both rivers have been snagged, leveed, and isolatedfrom their floodplains, which have been drained, ditched,and converted to agriculture and other uses. Their land-usehistory and current condition is typical of other rivers in theregion (Sedell and Luchessa 1981).
We took two approaches to investigating the historicalcondition of Puget Sound rivers. We collected field datafrom a reach of the Nisqually River (Fig. 1) that has beenprotected from development in the 20th century on theassumption that it has retained characteristics of the pre-European-settlement condition. The river has natural banks,and logging of the valley-bottom forest was limited to thelarger conifers late in the 19th century. There are no otherundeveloped rivers in the Puget Sound region, which limitsthe extent to which it can be inferred that the Nisqually
© 2002 NRC Canada
Collins et al. 67
Fig. 1. Locations of Puget Lowland rivers and study sites on the Nisqually, Snohomish, and Stillaguamish Rivers, Washington State, U.S.A.
J:\cjfas\cjfas59\cjfas-01\F01-199.vpThursday, January 10, 2002 9:26:15 AM
Color profile: DisabledComposite Default screen

River represents historical conditions. To provide contextfor interpreting the regional significance of the Nisquallydata, we also use archival sources, including annual reportsof the Army Engineers (Annual Reports of the Chief of En-gineers, U.S. War Department, 1875–1980; hereafter refer-enced as U.S. War Department), settlers’ accounts, mapsand reports by the U.S. Coast and Geodetic Survey, U.S.General Land Office, U.S. Department of Agriculture, U.S.Geological Survey (USGS), and other agencies. Archivaland process studies are complementary; field studies providedetail on and generate hypotheses about physical processes,whereas archival studies help characterize regional variation(which is not possible from field studies when the number offield sites is limited) and the applicability of hypothesesgenerated from field studies (Collins and Montgomery2001). Additionally, archival studies can describe processesand features at the river-valley scale that may no longer bepresent owing to human changes to the landscape.
Study areasThe Nisqually River begins at the terminus of the
Nisqually Glacier in Mount Rainier National Park (Fig. 1)and drains an 1890 km2 basin. The LaGrande and Alder hy-droelectric projects are at river kilometres 68 and 71, respec-tively (Ames and Bucknell 1981). The dams are not operatedfor flood control, but reduce some flood peaks. Below thesedams, the Nisqually River passes through a mix of agricul-tural, forested, and rural land and then traverses or bordersthe Fort Lewis military reservation, between river kilometres4 and 31. (River kilometres are from USGS topographicmaps or Ames and Bucknell (1981).)
The study reach is between river kilometres 7.4 and 18.7,above tidal influence, where the river has incised a valley~70 m deep into the land surface since the last glaciation,which ended ~14 000 years ago. The forested valley bottomis between 0.6 km and 1.1 km wide and includes numerousfloodplain channels. Bankfull channel width in 1999 aver-aged 100 m, and gradient ranges between 0.002 and 0.005.The mean annual discharge between 1948 and 1999 was37.3 m3·s–1 at a gage at river kilometre 35.1. The largest re-corded flood, on 8 February 1996, was estimated as1416 m3·s–1 (USGS 1997).
The reach is unique in the Puget Lowland in having a ma-ture valley-bottom forest and no artificial levees or bank pro-tection because it has been protected within the NisquallyIndian Reservation and Fort Lewis. The Nisqually Indiansceded most of their land to the federal government in the1854 Treaty of Medicine Creek, but they retained rights to areservation that included most of the study area. Althoughother Puget Lowland riparian forests had been cleared by theend of the 19th century, the Nisqually was not (Plummer etal. 1902) other than selective logging of conifers (primarilyThuja plicata (western red cedar) and secondarilyPseu-dotsuga menziesii(Douglas fir)), which were cut into boltsand floated downstream to a shake mill (George Walter,Nisqually Indian Tribe, 12501 Yelm Hwy. SE, Olympia,WA 98513, U.S.A., personal communication). In 1917, theUnited States annexed 3370 acres of the Nisqually IndianReservation for Fort Lewis, including the north side of thevalley. In the most downstream 1 km of the study reach onprivate land downstream of the reservation, some forest was
converted to agricultural and residential uses before 1910(Mangum 1911). Elsewhere, two fish hatcheries operated bythe Nisqually Tribe are the only substantial developments.
The Skykomish and Snoqualmie rivers join to form theSnohomish River, which flows westward 34 river kilometresto Possession Sound at the city of Everett (Fig. 1). The rivergradient declines downstream from 0.0004 to 0.00006. Itsplits into several major sloughs (Steamboat, Ebey, and Un-ion sloughs) and the main river, which is dredged to main-tain its navigability in its lowest approximately 5 km.Because of the river’s low gradient, tidal backwater extendsto about river kilometre 29.
The North and South forks of the Stillaguamish River(1770 km2) join at Arlington, at river kilometre 29. Fromthere, it flows westward to Port Susan and Skagit Bay. TheStillaguamish is steeper than the Snohomish; its gradient de-clines from 0.0009 to 0.0003. The Stillaguamish splits intotwo channels between kilometres 18 and 10, the approxi-mate upper limit of tidal influence. It then flows into PortSusan through Hat Slough. Before ~1906, the river flowedinstead northwest through what is now a minor tidal slough(U.S. Army Corps of Engineers 1929). Levees and bank ar-moring are extensive on the Stillaguamish and Snohomishrivers, and agriculture dominates both valley bottoms. Ripar-ian forests are generally either absent or narrow and domi-nantly small deciduous trees.
Methods
In-channel woodTo determine the abundance of wood and its location in
the channel, we inventoried wood and wood jams in theNisqually River in September–October 1998. We noted allwood greater than 0.15 m in diameter and 2 m in length andhaving any portion within the bankfull limits of the activechannel. We recorded whether wood was on a bank, bar,low-flow channel margin, or low-flow channel middle. Wemeasured dimensions (i.e., width, length, thickness, andheight) of 40 jams and recorded dimensions of 80 keypieces. We use “key” to refer to pieces that appear to haveinitiated jams and “racked” to refer to all other pieces in ajam. We estimated the number of pieces in jams by firstmeasuring the percent void space in four jams along planartransects orthogonal to racked-piece orientation. We thenused a distribution of calculated piece volumes from ourwood dimension measurements (see below) to estimatepieces per unit space. Finally, we measured the width,length, and height of all jams and the average piece per unitspace to estimate the number of pieces in each jam.
To characterize the size, species, and age of wood in theNisqually River, we also recorded characteristics of 173wood pieces in three jams and on one bar. Jams were sam-pled along transects at a right angle to racked pieces, and thebar sample included all pieces. For both, we measured piecelength and diameter, maximum and minimum rootball di-mensions, and visually identified species. In these four sam-ples, we also assigned pieces to one of three simplifieddecay classes: “recent” wood had most of its bark and hadsome limbs attached; “old” wood had no bark or limbs; and“intermediate” pieces were intermediate in characteristics.
© 2002 NRC Canada
68 Can. J. Fish. Aquat. Sci. Vol. 59, 2002
J:\cjfas\cjfas59\cjfas-01\F01-199.vpThursday, January 10, 2002 9:26:16 AM
Color profile: DisabledComposite Default screen
We conducted a similar inventory on the Snohomish Riverduring seasonal low flow in August–October 1998 to documentlocation, spacing, and size distribution of wood. We made thisinventory in locations selected visually to represent upstream,middle, and downstream parts of the Snohomish River (riverkilometres 32.2–33.9, 27.1–28.7, and 17, respectively). Wemeasured or visually estimated diameter and length of 456pieces and visually assigned each a decay class and species.For each piece, we noted the location as “on bar”, “on bank”,“snag” (a portion of the piece was emerging from the low-flowwater surface), “submerged” (entirely beneath the low-flow wa-ter surface), or “embedded in bar”.
We made an additional inventory in both the Snohomishand Stillaguamish rivers to estimate wood abundance. In thisinventory, we counted 436 pieces in six 1-km-long reachesof the Stillaguamish River, separated by 3-km-long intervals.We also noted the channel location and depth of wood to al-low us to compare current low-flow channel wood abun-dance to wood abundance inferred from late 1800s and early1900s snagging documented in annual reports of the Corpsof Engineers (U.S. War Department 1880–1910). Similar tothe first inventory, we counted pieces according to their lo-cation on a bar, on a bank, or as a snag, or if submerged, wesubjectively determined whether wood was in the thalweg ofthe river (in the main area of flow) or in the low-flow mar-gins. We also noted the depth (0–0.6 m below the surface,0.6–1.2 m below the surface, or >1.2 m below the surface).We counted 1245 pieces in the Snohomish River, countingwood in the thalweg for the entire river and the entire channel(i.e., in the low-flow margins, banks, and bars) in 10.9 km ofrepresentative locations. In the lower, tidally influenced por-tions of both rivers, we confined our work to minus tides toenhance our view of submerged wood. However, water clar-ity and visibility of wood in the deeper, tidal area of bothrivers varied with turbidity and weather.
PoolsIn each river, we measured pool depths using a hand-held
sonar device while navigating in a canoe, rubber raft, or jetboat. We measured pool lengths and widths with a laserrange finder or made visual estimates. We confirmed pooldepth measurements at most jams using a stadia rod whilestanding at the jam edge. For each pool, we noted the domi-nant pool-forming influence. These include the following:free formed; wood jam (and jam type); individual woodpieces (including whether or not a rootball was attached);and valley wall or boulder forced.
Riparian forestsWe documented riparian forests along the three rivers in
1866–1873, which was before widespread riparian logging,using field notes of the General Land Office cadastral sur-veys, which include the size and species of trees that servedas witness trees at survey control points in valley-bottomforests. Surveyors were instructed to identify witness trees,four trees nearest to the survey point in each of four quad-rants at section corners and two trees at midpoints betweencorners and at banks of navigable streams (White 1991).Field surveys of the Nisqually River riparian forest indicatethat these data underrepresent smaller-diameter species suchas vine maple (Acer circinatum) but adequately characterize
the basal area (Collins and Montgomery 2002). In Indianreservations such as the Nisqually study area, survey controlpoints were established at every quarter mile including sec-tion interiors. For clarity, we refer to these points in the im-mediate streamside area as “streamside” and to the regularlyspaced points at section corners and fractional corners as“valley bottom”.
Results
Quantity and location of woodWood is considerably more abundant in the Nisqually River
compared with the other two rivers. The Nisqually’s abun-dance of wood in jams accounts for most of the difference;about 90% of pieces in the Nisqually River are in jams(Fig. 2), followed by bars and banks, for a minimum total of1400 pieces·km–1 or 135 pieces·CW–1 (channel width), in-cluding jams. Excluding jams, there were 170 pieces·km–1 or17 pieces·CW–1. In contrast, neither the Snohomish norStillaguamish rivers had significant amounts of wood injams (Fig. 2). In both, most wood was scattered on banks oron the bed at the margins of the low-flow channel. The totalabundance in both was much lower than the Nisqually:116 pieces·km–1 (18 pieces·CW–1) in the Snohomish and52 pieces·km–1 (5.4 pieces·CW–1) in the Stillaguamish. Be-cause most wood is in jams, wood distribution in theNisqually River is highly “bunched” longitudinally. By con-trast, in the Snohomish River, wood is relatively evenly dis-tributed. (As indicated above, our point survey of abundancein the Stillaguamish did not permit assessment of clumping.)The spatial density of wood increases in the upper 10 riverkilometres of the tidally influenced reach, with the greatestamount of wood along the thalweg being at the head of tidalinfluence. The highest density of wood on the banks and es-pecially the low-flow margin was in the uppermost kilometre,below where the steeper Skykomish enters the Snohomishand where, unlike downstream, banks are not armored.
Age and species of woodRecent pieces accounted for roughly one-half (48%) of
the wood pieces measured in three jams and one bar in theNisqually (Table 1). In contrast, in the Snohomish River, oldpieces accounted for 59, 41, and 96% of wood for whichage-class could be determined in three sample areas, fromupstream to downstream, respectively (Table 1). (A portion(28, 27, and 0%) could not be assigned to any age-class.This was typically because wood could often not be clearlyviewed beneath the water surface, and so it is likely thatmost of these pieces not assigned to an age-class were alsoold because most identifiable submerged pieces were old.)Recent wood in the upstream, middle, and downstream sam-ples accounted for only 16, 18, and 2%, respectively, ofpieces that could be assigned to a decay class. Overall, woodwas old, with most recent and intermediate pieces on banks;nearly four-fifths of pieces on banks were either “young”(33%) or intermediate (46%). There were also a number ofrecent snags in the middle and upper river samples, whereeroding banks are a local source. In contrast, pieces sub-merged on the bed were nearly entirely old (89% of identifi-able pieces).
© 2002 NRC Canada
Collins et al. 69
J:\cjfas\cjfas59\cjfas-01\F01-199.vpThursday, January 10, 2002 9:26:16 AM
Color profile: DisabledComposite Default screen

In the Nisqually River, just over half of the wood that couldbe identified was conifer, distributed throughout age-classes(Table 1). In the Snohomish River, conifers (primarily cedar)dominated the population of older pieces (Table 1), whereasdeciduous species were the most common recent and interme-diate species.
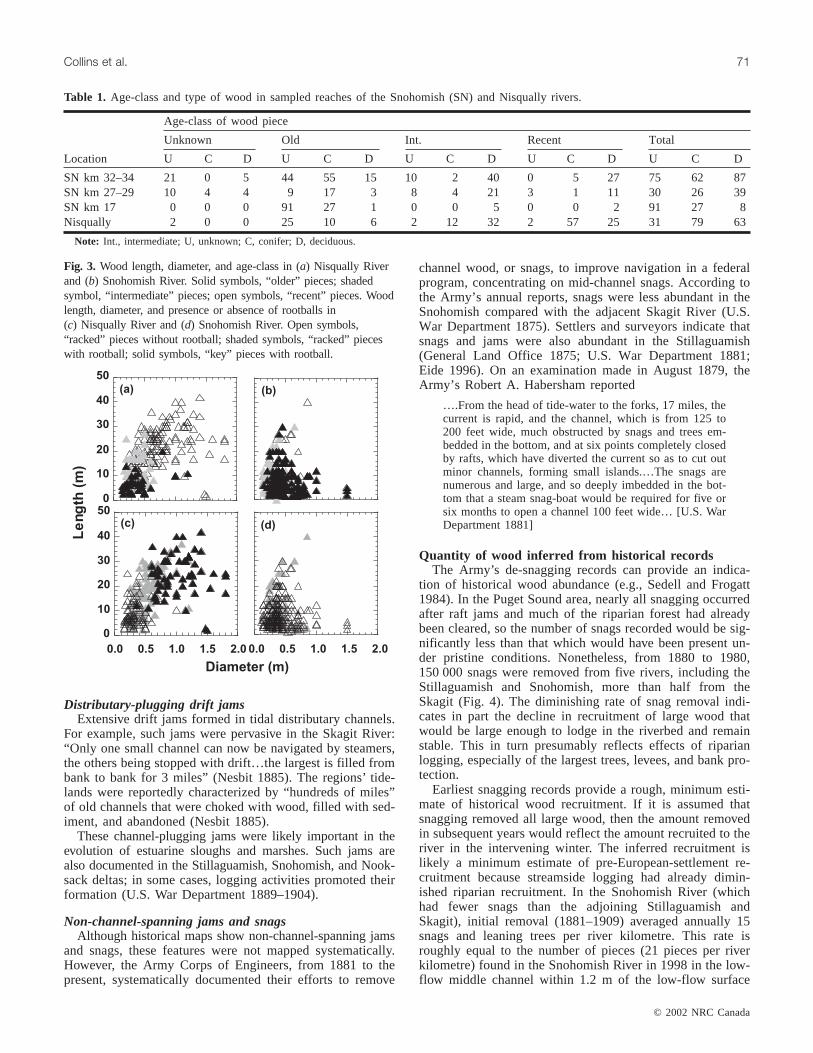
Size and shape of woodIn the Nisqually River, recently recruited pieces are greater
in diameter and length than older pieces (Fig. 3a), whereasin the Snohomish River, wood was dominated by smaller,older pieces (Fig. 3b). Wood on banks was smallest in diam-eter, averaging 0.33 m. Wood averaged between 10 and 12 min length, except on bars, where wood was slightly longer,averaging 14 m. Cedar pieces were more than twice as largein diameter (mean ± standard deviation (SD) of diameter =0.67 ± 0.29 m; unless otherwise indicated, subsequent fig-ures also refer to mean ± SD) as alder or unidentified decid-uous pieces (0.30 ± 0.06 m and 0.22 ± 0.07, respectively).Cedar was roughly half as long (6.8 ± 4.3 m) as alder or un-identified deciduous pieces (11.9 ± 4.8 m and 12.3 ± 8.6 m,respectively). Cottonwood pieces were the largest overall,with the greatest length (12.3 ± 8.6 m) and the second great-est diameter (0.35 ± 0.15 m).
Most pieces in the Nisqually River (68%) had rootballs(Fig. 3c). By contrast, relatively few (22%) had rootballs inthe Snohomish (Fig. 3d); more than twice as many recentpieces as old pieces had rootballs (36 and 15%, respec-tively). In addition, rootballs were generally small in theSnohomish; cross-sectional area (measured as the product ofthe maximum and minimum rootball dimensions) averaged2.7 ± 2.4 m2 compared with 9.5 ± 7.2 m2 for racked pieces
in the Nisqually River. The rootballs of recent pieces in theSnohomish were slightly larger (3.3 ± 2.9 m2) compared tothose of old pieces (2.7 ± 2.2 m2).
Most jams in the Nisqually had identifiable key pieces.Compared with racked pieces, they were longer (mean ± SDof length = 24.3 ± 8.6 m vs. 17.2 ± 9.6 m), larger in diame-ter (mean diameter 0.98 ± 0.34 m vs. 0.64 ± 0.36 m), andmore likely to have rootballs (97% vs. 54%). Rootballs werealso larger on key pieces than on racked pieces (13.1 ±6.9 m2 vs. 9.5 ± 7.2 m2). Key pieces in the Nisqually rangedfrom 0.2 to 0.9 times the bankfull depth of 2.6 m (Fig. 3d).By contrast, in the Snohomish River, there were no pieceswith a diameter larger than 1 m, and none of these had arootball (Fig. 3d).
Historical accounts and archival data on the historicalcondition of Puget Lowland rivers
How representative is the Nisqually River of the mid-19thcentury condition of Puget Lowland rivers? Early accountsdocument that rivers transported vast amounts of wood. Forexample, in a report on the White River (Fig. 1), the ArmyCorps’ Major Hiram Chittenden wrote
…the channels are strewn with immense trunks, often twohundred feet long, with roots, tops, and all …[forming]jams, which frequently block the channels altogether. Thisdrift constitutes the gravest feature of the flood problem,for the supply is practically unlimited, and the quantitycarried by a great flood is such that very little can be donewith it at the time by human agency. Levees or other pro-tection works are of little avail in the presence of thesedrift jams, and it seems like an almost useless expense tobuilt such works so long as they are menaced by so great acertainty of being destroyed or otherwise rendered useless.[Chittenden 1907]
In addition to such anecdotal accounts, archival sourcesalso provide descriptions and quantitative information usefulfor characterizing the types, locations, amount, and size ofwood in rivers draining to Puget Sound.
Types and locations of wood accumulations fromhistorical archives
Raft jamsMaps and reports show that wood accumulations took var-
ious forms. “Raft” jams that formed the largest accumula-tions, as much as 2 km in length, were documented in theNooksack, Skagit, and Stillaguamish rivers. These jamsfilled rivers from the bed to above the bank and spannedfrom bank to bank. A jam on the Skagit River at the town ofMount Vernon was described as 9 m deep, consisting of“from five to eight tiers of logs, which generally rangedfrom three to eight feet [0.9–2.4 m] in diameter” and existedfor at least a century, as its surface supported live trees 0.6–1.2 m in diameter (Interstate Publishing Company 1906). Asettler similarly describes “large trees growing in the midstof ” (Judson 1984) a 1.2-km-long channel-spanning jam atriver kilometre 8 in the Nooksack River (Fig. 1). Settlers andthe Army Corps cleared mainstem-plugging jams betweenthe late 1870s and late 1880s (U.S. War Department 1881,1889, 1930). Individual jams of this size could have storedseveral hundred thousand pieces of wood.
© 2002 NRC Canada
70 Can. J. Fish. Aquat. Sci. Vol. 59, 2002
Fig. 2. Distribution of wood pieces in the sampled reach of theNisqually River (upper panel), the Snohomish River (middlepanel), and the Stillaguamish River (lower panel) study reaches.
J:\cjfas\cjfas59\cjfas-01\F01-199.vpThursday, January 10, 2002 9:26:17 AM
Color profile: DisabledComposite Default screen
Distributary-plugging drift jamsExtensive drift jams formed in tidal distributary channels.
For example, such jams were pervasive in the Skagit River:“Only one small channel can now be navigated by steamers,the others being stopped with drift…the largest is filled frombank to bank for 3 miles” (Nesbit 1885). The regions’ tide-lands were reportedly characterized by “hundreds of miles”of old channels that were choked with wood, filled with sed-iment, and abandoned (Nesbit 1885).
These channel-plugging jams were likely important in theevolution of estuarine sloughs and marshes. Such jams arealso documented in the Stillaguamish, Snohomish, and Nook-sack deltas; in some cases, logging activities promoted theirformation (U.S. War Department 1889–1904).
Non-channel-spanning jams and snagsAlthough historical maps show non-channel-spanning jams
and snags, these features were not mapped systematically.However, the Army Corps of Engineers, from 1881 to thepresent, systematically documented their efforts to remove
channel wood, or snags, to improve navigation in a federalprogram, concentrating on mid-channel snags. According tothe Army’s annual reports, snags were less abundant in theSnohomish compared with the adjacent Skagit River (U.S.War Department 1875). Settlers and surveyors indicate thatsnags and jams were also abundant in the Stillaguamish(General Land Office 1875; U.S. War Department 1881;Eide 1996). On an examination made in August 1879, theArmy’s Robert A. Habersham reported
….From the head of tide-water to the forks, 17 miles, thecurrent is rapid, and the channel, which is from 125 to200 feet wide, much obstructed by snags and trees em-bedded in the bottom, and at six points completely closedby rafts, which have diverted the current so as to cut outminor channels, forming small islands.…The snags arenumerous and large, and so deeply imbedded in the bot-tom that a steam snag-boat would be required for five orsix months to open a channel 100 feet wide… [U.S. WarDepartment 1881]
Quantity of wood inferred from historical recordsThe Army’s de-snagging records can provide an indica-
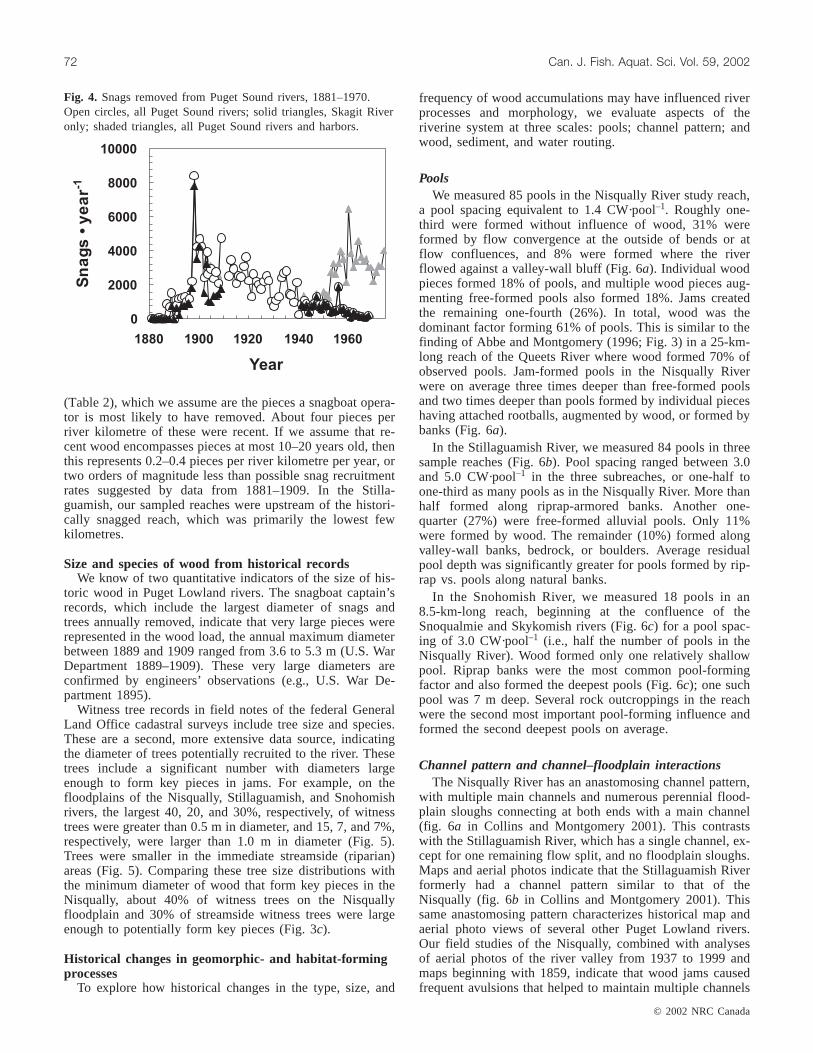
tion of historical wood abundance (e.g., Sedell and Frogatt1984). In the Puget Sound area, nearly all snagging occurredafter raft jams and much of the riparian forest had alreadybeen cleared, so the number of snags recorded would be sig-nificantly less than that which would have been present un-der pristine conditions. Nonetheless, from 1880 to 1980,150 000 snags were removed from five rivers, including theStillaguamish and Snohomish, more than half from theSkagit (Fig. 4). The diminishing rate of snag removal indi-cates in part the decline in recruitment of large wood thatwould be large enough to lodge in the riverbed and remainstable. This in turn presumably reflects effects of riparianlogging, especially of the largest trees, levees, and bank pro-tection.
Earliest snagging records provide a rough, minimum esti-mate of historical wood recruitment. If it is assumed thatsnagging removed all large wood, then the amount removedin subsequent years would reflect the amount recruited to theriver in the intervening winter. The inferred recruitment islikely a minimum estimate of pre-European-settlement re-cruitment because streamside logging had already dimin-ished riparian recruitment. In the Snohomish River (whichhad fewer snags than the adjoining Stillaguamish andSkagit), initial removal (1881–1909) averaged annually 15snags and leaning trees per river kilometre. This rate isroughly equal to the number of pieces (21 pieces per riverkilometre) found in the Snohomish River in 1998 in the low-flow middle channel within 1.2 m of the low-flow surface
© 2002 NRC Canada
Collins et al. 71
Age-class of wood piece
Unknown Old Int. Recent Total
Location U C D U C D U C D U C D U C D
SN km 32–34 21 0 5 44 55 15 10 2 40 0 5 27 75 62 87SN km 27–29 10 4 4 9 17 3 8 4 21 3 1 11 30 26 39SN km 17 0 0 0 91 27 1 0 0 5 0 0 2 91 27 8Nisqually 2 0 0 25 10 6 2 12 32 2 57 25 31 79 63
Note: Int., intermediate; U, unknown; C, conifer; D, deciduous.
Table 1. Age-class and type of wood in sampled reaches of the Snohomish (SN) and Nisqually rivers.
Fig. 3. Wood length, diameter, and age-class in (a) Nisqually Riverand (b) Snohomish River. Solid symbols, “older” pieces; shadedsymbol, “intermediate” pieces; open symbols, “recent” pieces. Woodlength, diameter, and presence or absence of rootballs in(c) Nisqually River and (d) Snohomish River. Open symbols,“racked” pieces without rootball; shaded symbols, “racked” pieceswith rootball; solid symbols, “key” pieces with rootball.
J:\cjfas\cjfas59\cjfas-01\F01-199.vpThursday, January 10, 2002 9:26:18 AM
Color profile: DisabledComposite Default screen
© 2002 NRC Canada
72 Can. J. Fish. Aquat. Sci. Vol. 59, 2002
(Table 2), which we assume are the pieces a snagboat opera-tor is most likely to have removed. About four pieces perriver kilometre of these were recent. If we assume that re-cent wood encompasses pieces at most 10–20 years old, thenthis represents 0.2–0.4 pieces per river kilometre per year, ortwo orders of magnitude less than possible snag recruitmentrates suggested by data from 1881–1909. In the Stilla-guamish, our sampled reaches were upstream of the histori-cally snagged reach, which was primarily the lowest fewkilometres.
Size and species of wood from historical recordsWe know of two quantitative indicators of the size of his-
toric wood in Puget Lowland rivers. The snagboat captain’srecords, which include the largest diameter of snags andtrees annually removed, indicate that very large pieces wererepresented in the wood load, the annual maximum diameterbetween 1889 and 1909 ranged from 3.6 to 5.3 m (U.S. WarDepartment 1889–1909). These very large diameters areconfirmed by engineers’ observations (e.g., U.S. War De-partment 1895).
Witness tree records in field notes of the federal GeneralLand Office cadastral surveys include tree size and species.These are a second, more extensive data source, indicatingthe diameter of trees potentially recruited to the river. Thesetrees include a significant number with diameters largeenough to form key pieces in jams. For example, on thefloodplains of the Nisqually, Stillaguamish, and Snohomishrivers, the largest 40, 20, and 30%, respectively, of witnesstrees were greater than 0.5 m in diameter, and 15, 7, and 7%,respectively, were larger than 1.0 m in diameter (Fig. 5).Trees were smaller in the immediate streamside (riparian)areas (Fig. 5). Comparing these tree size distributions withthe minimum diameter of wood that form key pieces in theNisqually, about 40% of witness trees on the Nisquallyfloodplain and 30% of streamside witness trees were largeenough to potentially form key pieces (Fig. 3c).
Historical changes in geomorphic- and habitat-formingprocesses
To explore how historical changes in the type, size, and
frequency of wood accumulations may have influenced riverprocesses and morphology, we evaluate aspects of theriverine system at three scales: pools; channel pattern; andwood, sediment, and water routing.
PoolsWe measured 85 pools in the Nisqually River study reach,
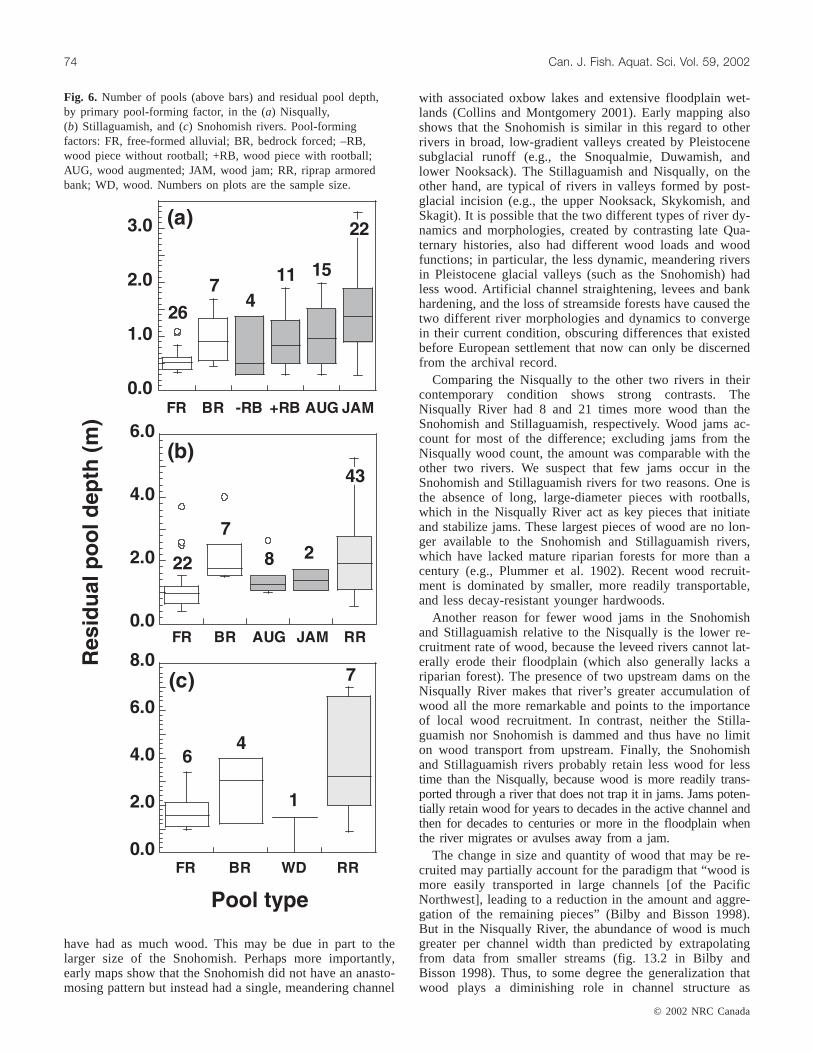
a pool spacing equivalent to 1.4 CW·pool–1. Roughly one-third were formed without influence of wood, 31% wereformed by flow convergence at the outside of bends or atflow confluences, and 8% were formed where the riverflowed against a valley-wall bluff (Fig. 6a). Individual woodpieces formed 18% of pools, and multiple wood pieces aug-menting free-formed pools also formed 18%. Jams createdthe remaining one-fourth (26%). In total, wood was thedominant factor forming 61% of pools. This is similar to thefinding of Abbe and Montgomery (1996; Fig. 3) in a 25-km-long reach of the Queets River where wood formed 70% ofobserved pools. Jam-formed pools in the Nisqually Riverwere on average three times deeper than free-formed poolsand two times deeper than pools formed by individual pieceshaving attached rootballs, augmented by wood, or formed bybanks (Fig. 6a).
In the Stillaguamish River, we measured 84 pools in threesample reaches (Fig. 6b). Pool spacing ranged between 3.0and 5.0 CW·pool–1 in the three subreaches, or one-half toone-third as many pools as in the Nisqually River. More thanhalf formed along riprap-armored banks. Another one-quarter (27%) were free-formed alluvial pools. Only 11%were formed by wood. The remainder (10%) formed alongvalley-wall banks, bedrock, or boulders. Average residualpool depth was significantly greater for pools formed by rip-rap vs. pools along natural banks.
In the Snohomish River, we measured 18 pools in an8.5-km-long reach, beginning at the confluence of theSnoqualmie and Skykomish rivers (Fig. 6c) for a pool spac-ing of 3.0 CW·pool–1 (i.e., half the number of pools in theNisqually River). Wood formed only one relatively shallowpool. Riprap banks were the most common pool-formingfactor and also formed the deepest pools (Fig. 6c); one suchpool was 7 m deep. Several rock outcroppings in the reachwere the second most important pool-forming influence andformed the second deepest pools on average.
Channel pattern and channel–floodplain interactionsThe Nisqually River has an anastomosing channel pattern,
with multiple main channels and numerous perennial flood-plain sloughs connecting at both ends with a main channel(fig. 6a in Collins and Montgomery 2001). This contrastswith the Stillaguamish River, which has a single channel, ex-cept for one remaining flow split, and no floodplain sloughs.Maps and aerial photos indicate that the Stillaguamish Riverformerly had a channel pattern similar to that of theNisqually (fig. 6b in Collins and Montgomery 2001). Thissame anastomosing pattern characterizes historical map andaerial photo views of several other Puget Lowland rivers.Our field studies of the Nisqually, combined with analysesof aerial photos of the river valley from 1937 to 1999 andmaps beginning with 1859, indicate that wood jams causedfrequent avulsions that helped to maintain multiple channels
Fig. 4. Snags removed from Puget Sound rivers, 1881–1970.Open circles, all Puget Sound rivers; solid triangles, Skagit Riveronly; shaded triangles, all Puget Sound rivers and harbors.
J:\cjfas\cjfas59\cjfas-01\F01-199.vpThursday, January 10, 2002 9:26:19 AM
Color profile: DisabledComposite Default screen

and perennial floodplain sloughs (Collins and Montgomery2002).
Water, sediment, and wood routing at the valley-bottom scaleEarly descriptions indicate that raft jams diverted high
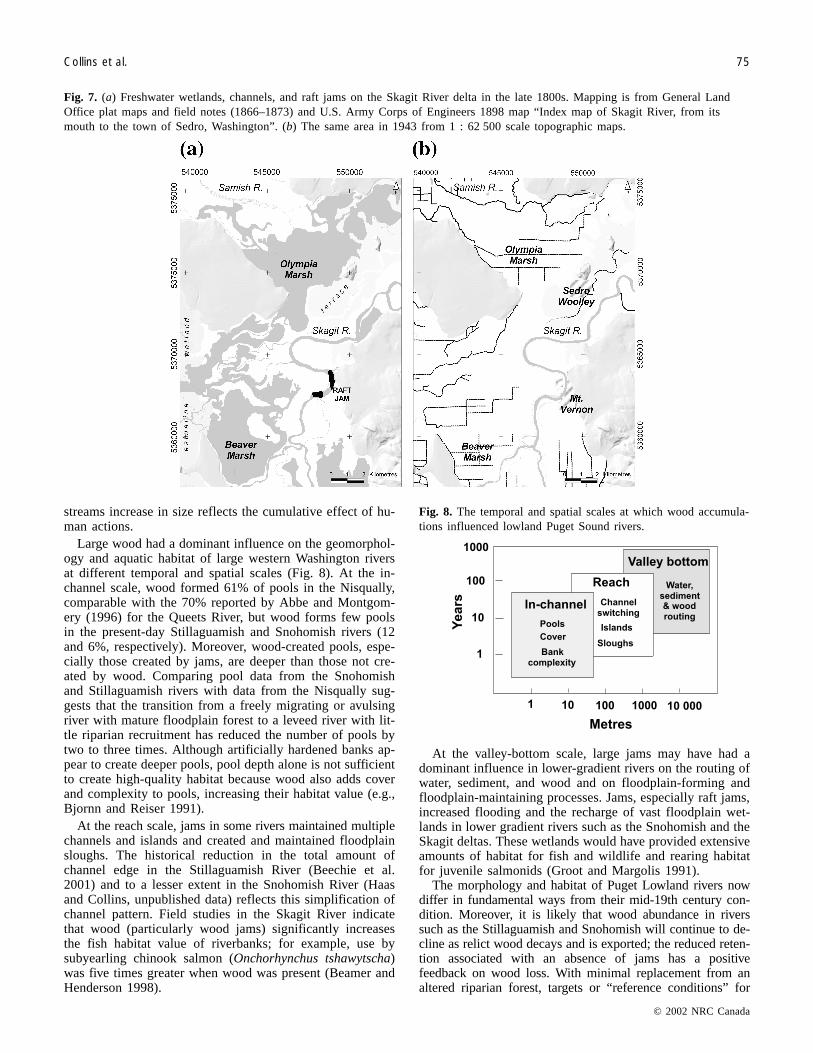
flows onto floodplains. Field reports by the Army Engineersindicate that such a jam on the Skagit River at MountVernon (Fig. 7a) caused floodwaters to frequently rechargeextensive (~150 m2, U.S. War Department 1898) wetlands.
The obstruction caused by this jam to the free flow of theflood waters prevented the low lands farther down theriver being flooded, but it caused the flooding of the en-tire country known as the Olympia and Beaver Marsh
country, to the west of the Skagit River, between thepresent location of the town of Avon and Padilla Bay.[U.S. War Department 1898]
Removal of the jam shifted flooding downstream and al-lowed settlers to drain wetlands and establish farmland (U.S.War Department 1881 (Fig. 7b). Enhanced routing of highflows onto the floodplain would have also routed largeramounts of fine sediment to floodplains rather than to estuarineenvironments. It is possible that raft jams in the region induceddeposition of sediment wedges, as documented for historicalRed River rafts (Triska 1984; Harvey et al. 1988).
Jams also shaped the geomorphic evolution of deltas. Re-moval by settlers in 1892–1893 of a jam at the head of HatSlough, formerly a minor distributary slough on the Stilla-guamish River, shifted the river’s main flow into it, whichhas subsequently shifted the location of delta and pro-gradation and marsh creation. Changes to a jam on theNooksack River (Fig. 1) caused a similar course change inthe mid-1800s (U.S. War Department 1893).
Discussion
Archival materials suggest that the study reach of theNisqually River is in many respects relatively unchangedfrom its mid-19th century condition. The present-day distri-bution of tree sizes on the Nisqually floodplain closely re-sembles the size distribution in 1873 (Collins andMontgomery 2002), and the present-day channel pattern issimilar to earlier aerial photos dating to 1937 and maps dat-ing to 1859. It also appears reasonable to compare theNisqually River with the historical Stillaguamish River. Themid-19th century valley-bottom forests of the Stillaguamishhad tree sizes comparable to those of the Nisqually. Archivalaccounts indicate wood jams were abundant in theStillaguamish River; the Stillaguamish, with a similar widthas the Nisqually, formerly had an anastomosing pattern simi-lar to that of the Nisqually.
The Nisqually is less comparable to the Snohomish. Al-though the Snohomish River had a riparian forest compara-ble with those of the other two rivers, it does not appear to
© 2002 NRC Canada
Collins et al. 73
Depth categorySnohomish River,mean ± SD (pieces·km–1)
Stillaguamish River,mean ± SD (pieces·km–1)
Low-flow margin 48.5 ± 52.6 (n = 12) 22.67 ± 19.3 (n = 6)>1.2 m 4.1 ± 8.1 0.00.6–1.2 m 12.1 ± 20.2 0.00–0.6 m 13.6 ± 13.3 3.5 ± 5.5Snag 18.7 ± 15.6 19.2 ± 17.3
Low-flow middle 24.1 ± 50.0 (n = 21) 9.3 ± 9.8 (n = 6)>1.2 m 3.4 ± 4.9 0.00.6–1.2 m 2.6 ± 4.2 0.3 ± 0.80–0.6 m 4.7 ± 12.1 0.5 ± 0.8Snag 13.4 ± 35.6 8.5 ± 9.5
Total 72.6 32.0 ± 28.7
Note: Depths were visually estimated or measured. Sample size is the number of reaches. Reaches are all 1km in the Stillaguamish; reaches of varying length in the Snohomish are normalized by reach length. SD,standard deviation.
Table 2. Average number of wood pieces per river kilometre at different depths in the low-flowchannel of the sampled reaches of the Snohomish and Stillaguamish rivers for use in comparisonto de-snagging records (see text).
Fig. 5. Cumulative frequency distribution of witness tree diametersfrom field notes of the General Land Office for the Nisqually(squares and solid lines), Stillaguamish (triangles and long-dashedlines), and Snohomish rivers (circles and short-dashed lines) in thestudy reaches. Solid symbols represent “streamside” trees andopen symbols represent “valley bottom” trees.
J:\cjfas\cjfas59\cjfas-01\F01-199.vpThursday, January 10, 2002 9:26:20 AM
Color profile: DisabledComposite Default screen
have had as much wood. This may be due in part to thelarger size of the Snohomish. Perhaps more importantly,early maps show that the Snohomish did not have an anasto-mosing pattern but instead had a single, meandering channel
with associated oxbow lakes and extensive floodplain wet-lands (Collins and Montgomery 2001). Early mapping alsoshows that the Snohomish is similar in this regard to otherrivers in broad, low-gradient valleys created by Pleistocenesubglacial runoff (e.g., the Snoqualmie, Duwamish, andlower Nooksack). The Stillaguamish and Nisqually, on theother hand, are typical of rivers in valleys formed by post-glacial incision (e.g., the upper Nooksack, Skykomish, andSkagit). It is possible that the two different types of river dy-namics and morphologies, created by contrasting late Qua-ternary histories, also had different wood loads and woodfunctions; in particular, the less dynamic, meandering riversin Pleistocene glacial valleys (such as the Snohomish) hadless wood. Artificial channel straightening, levees and bankhardening, and the loss of streamside forests have caused thetwo different river morphologies and dynamics to convergein their current condition, obscuring differences that existedbefore European settlement that now can only be discernedfrom the archival record.
Comparing the Nisqually to the other two rivers in theircontemporary condition shows strong contrasts. TheNisqually River had 8 and 21 times more wood than theSnohomish and Stillaguamish, respectively. Wood jams ac-count for most of the difference; excluding jams from theNisqually wood count, the amount was comparable with theother two rivers. We suspect that few jams occur in theSnohomish and Stillaguamish rivers for two reasons. One isthe absence of long, large-diameter pieces with rootballs,which in the Nisqually River act as key pieces that initiateand stabilize jams. These largest pieces of wood are no lon-ger available to the Snohomish and Stillaguamish rivers,which have lacked mature riparian forests for more than acentury (e.g., Plummer et al. 1902). Recent wood recruit-ment is dominated by smaller, more readily transportable,and less decay-resistant younger hardwoods.
Another reason for fewer wood jams in the Snohomishand Stillaguamish relative to the Nisqually is the lower re-cruitment rate of wood, because the leveed rivers cannot lat-erally erode their floodplain (which also generally lacks ariparian forest). The presence of two upstream dams on theNisqually River makes that river’s greater accumulation ofwood all the more remarkable and points to the importanceof local wood recruitment. In contrast, neither the Stilla-guamish nor Snohomish is dammed and thus have no limiton wood transport from upstream. Finally, the Snohomishand Stillaguamish rivers probably retain less wood for lesstime than the Nisqually, because wood is more readily trans-ported through a river that does not trap it in jams. Jams poten-tially retain wood for years to decades in the active channel andthen for decades to centuries or more in the floodplain whenthe river migrates or avulses away from a jam.
The change in size and quantity of wood that may be re-cruited may partially account for the paradigm that “wood ismore easily transported in large channels [of the PacificNorthwest], leading to a reduction in the amount and aggre-gation of the remaining pieces” (Bilby and Bisson 1998).But in the Nisqually River, the abundance of wood is muchgreater per channel width than predicted by extrapolatingfrom data from smaller streams (fig. 13.2 in Bilby andBisson 1998). Thus, to some degree the generalization thatwood plays a diminishing role in channel structure as
© 2002 NRC Canada
74 Can. J. Fish. Aquat. Sci. Vol. 59, 2002
Fig. 6. Number of pools (above bars) and residual pool depth,by primary pool-forming factor, in the (a) Nisqually,(b) Stillaguamish, and (c) Snohomish rivers. Pool-formingfactors: FR, free-formed alluvial; BR, bedrock forced; –RB,wood piece without rootball; +RB, wood piece with rootball;AUG, wood augmented; JAM, wood jam; RR, riprap armoredbank; WD, wood. Numbers on plots are the sample size.
J:\cjfas\cjfas59\cjfas-01\F01-199.vpThursday, January 10, 2002 9:26:21 AM
Color profile: DisabledComposite Default screen
© 2002 NRC Canada
Collins et al. 75
streams increase in size reflects the cumulative effect of hu-man actions.
Large wood had a dominant influence on the geomorphol-ogy and aquatic habitat of large western Washington riversat different temporal and spatial scales (Fig. 8). At the in-channel scale, wood formed 61% of pools in the Nisqually,comparable with the 70% reported by Abbe and Montgom-ery (1996) for the Queets River, but wood forms few poolsin the present-day Stillaguamish and Snohomish rivers (12and 6%, respectively). Moreover, wood-created pools, espe-cially those created by jams, are deeper than those not cre-ated by wood. Comparing pool data from the Snohomishand Stillaguamish rivers with data from the Nisqually sug-gests that the transition from a freely migrating or avulsingriver with mature floodplain forest to a leveed river with lit-tle riparian recruitment has reduced the number of pools bytwo to three times. Although artificially hardened banks ap-pear to create deeper pools, pool depth alone is not sufficientto create high-quality habitat because wood also adds coverand complexity to pools, increasing their habitat value (e.g.,Bjornn and Reiser 1991).
At the reach scale, jams in some rivers maintained multiplechannels and islands and created and maintained floodplainsloughs. The historical reduction in the total amount ofchannel edge in the Stillaguamish River (Beechie et al.2001) and to a lesser extent in the Snohomish River (Haasand Collins, unpublished data) reflects this simplification ofchannel pattern. Field studies in the Skagit River indicatethat wood (particularly wood jams) significantly increasesthe fish habitat value of riverbanks; for example, use bysubyearling chinook salmon (Onchorhynchus tshawytscha)was five times greater when wood was present (Beamer andHenderson 1998).
At the valley-bottom scale, large jams may have had adominant influence in lower-gradient rivers on the routing ofwater, sediment, and wood and on floodplain-forming andfloodplain-maintaining processes. Jams, especially raft jams,increased flooding and the recharge of vast floodplain wet-lands in lower gradient rivers such as the Snohomish and theSkagit deltas. These wetlands would have provided extensiveamounts of habitat for fish and wildlife and rearing habitatfor juvenile salmonids (Groot and Margolis 1991).
The morphology and habitat of Puget Lowland rivers nowdiffer in fundamental ways from their mid-19th century con-dition. Moreover, it is likely that wood abundance in riverssuch as the Stillaguamish and Snohomish will continue to de-cline as relict wood decays and is exported; the reduced reten-tion associated with an absence of jams has a positivefeedback on wood loss. With minimal replacement from analtered riparian forest, targets or “reference conditions” for
Fig. 7. (a) Freshwater wetlands, channels, and raft jams on the Skagit River delta in the late 1800s. Mapping is from General LandOffice plat maps and field notes (1866–1873) and U.S. Army Corps of Engineers 1898 map “Index map of Skagit River, from itsmouth to the town of Sedro, Washington”. (b) The same area in 1943 from 1 : 62 500 scale topographic maps.
Fig. 8. The temporal and spatial scales at which wood accumula-tions influenced lowland Puget Sound rivers.
J:\cjfas\cjfas59\cjfas-01\F01-199.vpThursday, January 10, 2002 9:26:53 AM
Color profile: DisabledComposite Default screen

© 2002 NRC Canada
76 Can. J. Fish. Aquat. Sci. Vol. 59, 2002
river and habitat restoration must take these historicalchanges, and likely continued change under current condi-tions, into account. Other temperate forest regions of theworld that have experienced historical deforestation and clear-ing of wood from channels may have experienced changessimilar in scope and magnitude to those documented here.
Acknowledgments
This study was funded by the Quaternary Research Cen-ter, The Puget Sound Regional Synthesis Model (PRISM),and the Center for Streamside Studies at the University ofWashington, the U.S. Department of Agriculture Natural Re-sources Conservation Service, the Bullitt Foundation, the Se-attle District of the U. S. Army Corps of Engineers, andthrough a grant from the Bureau of Indian Affairs to theTulalip Tribes. We thank Amir Sheikh and HarveyGreenberg for GIS assistance and Jordan Rosenfeld for hiscareful review, which significantly improved the manuscript.
References
Abbe, T.B., and Montgomery, D.R. 1996. Large woody debris jams,channel hydraulics and habitat formation in large rivers. Regul.Rivers Res. Manag.12: 201–221.
Ames, J.J., and Bucknell, P. 1981. Puget Sound river mile index. Sup-plement to a catalog of Washington streams and salmon utilization.Washington State Department of Fisheries, Olympia, Wash.
Beamer, E.M., and Henderson, R.A. 1998. Juvenile salmonid use ofnatural and hydromodified stream bank habitat in the mainstemSkagit River, northwest Washington. Report by Skagit SystemCooperative, LaConner, Wash., to U.S. Army Corps of Engineers,Seattle, Wash.
Beechie, T.J., Collins, B.D., and Pess, G.R. 2001. Holocene and re-cent geomorphic processes, land use, and salmonid habitat intwo north Puget Sound river basins.In Geomorphic processesand riverine habitat.Edited byJ.M. Dorava, D.R. Montgomery,B. Palcsak, and F. Fitzpatrick. American Geophysical Union,Washington, D.C. pp. 37–54.
Bilby, R.E., and Bisson, P.A. 1998. Function and distribution oflarge woody debris.In River ecology and management: lessonsfrom the Pacific coastal ecoregion.Edited byR.J. Naiman andR.E. Bilby. Springer, New York. pp. 324–346.
Bjornn, T.C., and Reiser, D.W. 1991. Habitat requirements ofsalmonids in streams.In Influences of forest and rangeland man-agement on salmonid fishes and their habitats.Edited byW.R.Meehan. Am. Fish. Soc. Spec. Publ. No. 19. pp. 83–138.
Chittenden, H.M. 1907. Report of an investigation by a board ofengineers, of the means of controlling floods in the Duwamish–Puyallup valleys and their tributaries in the state of Washington.Lowman & Hanford S. & P. Co., Seattle, Wash.
Collins, B.D., and Montgomery, D.R. 2001. Importance of archivaland process studies to characterizing pre-settlement riverine geo-morphic processes and habitat in the Puget Lowland.In Geo-morphic processes and riverine habitat.Edited byJ.M. Dorava,D.R. Montgomery, B. Palcsak, and F. Fitzpatrick. American Geo-physical Union, Washington, D.C. pp. 227–243.
Collins, B.D., and Montgomery, D.R. 2002. Forest development,wood jams and restoration of floodplain rivers in the PugetLowland. Restor. Ecol. In press.
Eide, O. 1996. Log jams on the lower Stillaguamish River. Stanwood
Area Echoes, Newsletter of the Stanwood Area Historical Society,Stanwood, Wash.
General Land Office. 1875. Township 31 North, Range 5 East,Willamette Meridian, Washington Territory.On file at U.S. De-partment of Agriculture Bureau of Land Management, Portland,Oregon.
Groot, C., and Margolis, L. (Editors). 1991. Pacific salmon life his-tories. University of British Columbia Press, Vancouver, B.C.
Harvey, M.D., Biedenharn, D.S., and Combs, P. 1988. Adjustmentsof Red River following removal of the Great Raft in 1873. EOSTrans. Am. Geophys. Union,69(18): 567.
Interstate Publishing Company. 1906. An illustrated history of Skagitand Snohomish Counties.Interstate Publishing Co., Chicago, Ill.
Judson, P.G. 1984. A pioneer’s search for an ideal home. Univer-sity of Nebraska Press, Lincoln.
Mangum, A.W., et al. 1911. Reconnaissance soil survey of the east-ern part of Puget Sound Basin, Washington. U.S. GovernmentPrinting Office, Washington, D.C.
Nesbit, D.M. 1885. Tide marshes of the United States. USDAMisc. Spec. Rep. 7.
Plummer, G.H., Plummer, F.G., and Rankine, J.H. 1902. Map ofWashington showing classification of lands. Plate 1.In The for-ests of Washington, a revision of estimates.Edited byH. Gan-net. U.S. Geol. Surv. Prof. Pap. 5, Series H, Forestry, 2.
Sedell, J.R., and Froggatt, J.L. 1984. Importance of streamside for-ests to large rivers: the isolation of the Willamette River, Ore-gon, U.S.A., from its floodplain by snagging and streamsideforest removal. Verh. Internat. Verein. Limnol.22: 1828–1834.
Sedell, J.R., and Luchessa, K.J. 1981. Using the historical record asan aid to salmonid habitat enhancement.In Acquisition and utili-zation of aquatic habitat inventory information, Proceedings ofSymposium held 28–30 Oct. 1981, Portland, Oregon.Edited byN.B. Arementrout. American Fisheries Society, Bethesda, Md.pp. 210–223.
Sedell, J.R., Yuska, J.E., and Speaker, R.W. 1984. Habitats andsalmonid distribution in pristine, sediment-rich river valley sys-tems: S. Fork Hoh and Queets River, Olympic National Park.InFish and wildlife relationships in old-growth forests, Proceed-ings of Symposium held 12–15 April 1982, Juneau, Alaska.Edited byW.R. Meehan, T.R. Merrell, Jr., and T.A. Hanley. Am.Inst. Fish. Res. Biol., Morehead City, N.C. pp. 33–46.
Triska, F.J. 1984. Role of wood debris in modifying channel geo-morphology and riparian areas of a large lowland river under pris-tine conditions: a historical case study. Verh. Internat. Verein.Limnol. 22: 1876–1892.
U.S. Army Corps of Engineers. 1929. Stilaguamish River, Wash.:letter from the Secretary of War transmitting report from thechief of engineers on Stilaguamish River, Wash., covering navi-gation, flood control, power development, and irrigation. U.S.Government Printing Office, Washington, D.C.
U.S. Geological Survey (USGS). 1997. Water resources data forWashington. U.S. Government Printing Office, Washington, D.C.
U.S. War Department. 1875–1980. 1875–1906: Annual reports ofthe Chief of Engineers, U.S. Army, to the Secretary of War.1907–1944: Report of the Chief of Engineers, U.S. Army. 1945–1953: Annual Report of the Chief of Engineers, U.S. Army.1954 – current year: Annual Report of the Chief of Engineers,U. S. Army, on Civil Works Activities. U.S. Government Print-ing Office, Washington, D.C.
White, C.A. 1991. A History of the Rectangular Survey System.U.S. Government Printing Office, Washington, D.C.
J:\cjfas\cjfas59\cjfas-01\F01-199.vpThursday, January 10, 2002 9:26:53 AM
Color profile: DisabledComposite Default screen