hillslope processes in a semiarid area -...
TRANSCRIPT

Channel and Hillslope Processes in a Semiarid Area New Mexico
4 w c.3 4 G E O L O G I C A L S U R V E Y P R O F E S S I O N A L P A P E R 3 5 2 - G
Channel and Hillslope Processes in a Semiarid Area New Mexico By LUNA B. LEOPOLD, WILLIAM W. EMMETT, and ROBERT M. MYRICK
EROSION AND SEDIMENTATION I N A SEMIARID ENVIRONMENT
G E O L O G I C A L S U R V E Y P R O F E S S I O N A L P A P E R 3 5 2 - G
UNITED STATES GOVERNMENT P R I N T I N G O F F I C E , WASHINGTON : 1966

UNITED STATES DEPARTMENT OF THE INTERIOR
STEWART L. UDALL, Secretary
GEOLOGICAL SURVEY
William T. Pecora, Director
First printing 1966
Second printing 1967
For sale by the Superintendent of Documents, U.S. Government Printing Office Washington, D.C. 20402 - Price 50 cents (paper cover)

C O N T E N T S
Page 193 193 193 195 195 198
199 201 201
202 2 03 207 2 09 215 220 220 222
227 227 227 228 228 228 229
Page 229 229 230 232 23 2 232 234 23 5 236 240 243
247
247 248
249 250 250
25 1
25 1 251
252
ILLUSTRATIONS Page
195 196 197 198 200 202 204 205 207
208 2 09 210 211 212 214
215 216 217 219
IV CONTENTS
FIGURE 157. Photograph of scour cha in________- - - - - - - - - - - - - - - - - - - - - - - - - - - - - - - - - - - - - - - - - - - - - -_ - - - - - -_ - - - - - - -
158. Downstream pattern of scour and fill for different time periods- _ _ - _ _ _ _ _ _ _ _ _ _ _ _ _ _ _ _ - _ _ _ _ _ _ 159. Depth of scour as function of discharge ________________________________________- - - - - - - - - 160. Scour and fill, Main Project Reach _ _ _ _ _ _ _ _ _ _ _ _ _ _ _ _ _ _ _ _ _ _ _ _ _ _ _ _ _ _ _ _ _ _ _ _ _ _ _ _ - - - - - - - - - - - _ - 161. Accumulative net changes in bed elevation, Arroyo de 10s Frijoles _ _ _ _ _ _ _ _ _ _ _ _ _ _ _ _ - _ _ _ _ _ _ _ _ _
162. Photographs of erosion p i n s _ _ _ _ _ _ _ - - - - _ - - - - ~ - ~ - - - - - - - - - - - - - _ - ~ - - ~ - ~ ~ ~ ~ ~ ~ ~ - - - - - - ~ - - - - - - - - - ~ - - - - - 163. Sketch map showing slope-retreat pins, Slopewash Tributary- - - - - - - - - - - - - - - - - - - - - - - - - - - - - - - - - - - - - - - 164. Graph showing 6-year net erosion, Slopewash Tributary-_ _ _ _ _ _ - _ _ _ _ _ _ _ _ - _ _ - _ _ - _ - _ - - - - - _ _ _ _ _ - - _ _ _ _ _ 165. Photograph of Fence Line Headcut- _ _ _ _ _ - _ _ _ _ _ _ _ _ _ _ _ _ _ _ _ _ _ _ _ _ _ _ _ _ _ _ _ - _ _ _ _ _ _ _ _ _ _ _ - _ - - _ _ _ - _ _ _ _ L - -
166. Photographs of headcuts and valley alluvium _ _ _ _ _ _ _ _ _ _ _ _ _ _ _ _ _ _ _ _ _ _ _ _ _ _ _ _ _ _ _ _ _ _ _ _ _ _ _ _ _ _ _ _ _ _ _ _ L _ _ _
167. Topographic map and profile, Coyote C. Arroyo headcut _ _ _ _ _ _ _ _ _ _ _ _ _ _ _ _ _ _ _ _ _ _ _ _ _ _ _ _ _ _ _ _ _ _ _ _ _ _ _ _ _ _ 168. Photograph of Green Rock Gulch _ _ _ _ _ _ _ _ _ _ _ _ _ _ _ _ _ _ _ _ _ _ _ _ _ _ _ _ _ _ _ _ _ _ _ _ _ _ _ _ - - - - - - - - - - - - - - - - - - - - - - 169. Profile of Gunshot Arroyo showing movement of coarse particles _ _ _ _ _ _ _ _ _ _ _ _ _ _ _ - - - - - - - - - - - - - - - - - - - - - 170. Topographic map of dam and reservoir, Coyote C. Arroyo _ _ _ _ _ _ _ _ _ _ _ _ _ _ _ _ _ _ _ - - - - - - - - - - - - - - - - - - - - - -
171. Precipitation parameters, 1853-1962, for station a t Santa Fe, N. Mex _ - _ _ - _ - - - - - - - - - - - - _ - - - 172. Individual summer rains- _ _ _ - - - - - - - - - - - _ _ _ - - _ _ - - - - _ _ - - - - - - - - - - - - - - - - - - - - - 173. Individual nonsummer rains _ _ _ _ _ _ _ _ _ _ _ _ - _ _ _ _ _ _ _ _ _ _ _ _ _ _ _ _ _ _ _ _ _ _ _ _ _ _ - - - - - - - - - - - - - _ - - - - - - 174. Average annual intensity of rainfall _ _ _ _ _ _ _ _ _ _ _ _ _ _ _ _ _ _ _ _ _ _ _ _ _ _ _ _ _ _ _ _ _ _ _ _ _ _ _ _ - - - - - - - - - - - -
158-161. Graphs showing:
. .
171-174. Graphs of:
. .
TABLES
Page 220
221 222 223 224 225 226 227 229 230 231 232 233 235
241 241 242 243
Page 201 2 03 218 220 234 232 236 237 238
EROSION AND SEDIMENTATION I N A SEMIARID ENVIRONMENT
CHANNEL AND HILLSLOPE PROCESSES IN A SEMIARID AREA, NEW MEXICO
By LUNA B. LEOPOLD, WILLIAM W. EMMETT, and ROBERT M. MYRICH
ABSTRACT
Ephemeral washes having drainage areas from a few acres to 5 square miles a re shown by actual measurement to be ac- cumulating sediment on the streambed. This aggradation is not apparent to the eye but is clearly shown in 7 years of annual remeasuremen t.
A similar aggradation was in progress in the same area some 3000 years ago as evidenced by an alluvial terrace later dis- sected by the present channel system. At that time as well as at present, aggradation occurred even in tributary areas drain- ing a few acres. Colluvial accumulations merge with channel deposits and blanket the valleys and tributary basins even up to a few hundred feet of the drainage divides.
The present study concerned the amounts of sediment pro- duced by different erosion processes in various physiographic positions in the drainage basins. Measurements show that by f a r the largest sediment source is sheet erosion operating on the small percentage of basin area near the basin divides.
Mass movement, gully head extension, and channel enlarge- ment are presently small contributors of sediment compared with sheet erosion on nnrilled s lops . A s in previous studies, not all of the erosion products could be accounted for by ac- cumulations on colluvial slopes and on beds of channels. The discrepancies a re attributed primarily to sediment carried com- pletely out of the basins studied and presumably deposited somewhere downstream.
Aggradation of alluvial valleys of 5 square miles area and smaller both in the present epicycle, and in prehistorical but post-glacial times in this locality, cannot be attributed to gully- ing or rill extension in the headwater tributaries but to sheet erosion of the most upstream margins of the basins.
Studies of rainfall characteristics of the 7 years of measure- ment compared with previous years in the 100-year record do not provide a clear-out difference which would account for the presently observed aggradation of channels. Longer period of measurement of erosion and sedimentation will be necessary to identify what precipitation parameters govern whether the channels aggrade or degrade.
ACKNOWLEDGMENTS
This study was conceived and initiated by Dr. John P. Miller and the senior author in the summer of 1958, and fieldwork was continued during each succesive sum- mer for periods of 1-3 weeks. Immediately following the field season of 1961 Dr. Miller died from bubonic plague contracted during that fieldwork. We resolved to prosecute the work thereafter with especial diligence.
An important part of the observations made during the first 5 years consisted of the data on the movement of the hundreds of individual cobbles which had been painted for identification. Emphasis was gradually shifted to the observations on rates of erosion and sedi- ment movement which had been begun as only an aux- iliary part of the original investigation. It is with these observations that the present paper is primarily concerned.
For permission to work on the property known as Las Dos and for many other courtesies we are grateful to the late Mrs. Adelina Otero-Warren. Dr. Bergere Kenney has kindly encouraged the work to continue on that property.
The slope-area measurements of discharge and many other observations when we were not in the area were made under the direction of Wilbur L. Heckler, district engineer for the U.S. Geological Survey in Santa Fe. Louis J . Reiland, Leo G. Stearns, Charlie R. Sieber, Leon A. Wiard, and others of the Santa F e office con- tributed materially to these observations.
Field assistants and technical associates during vari- 011s seasons included Brandis Marsh, Peter Sparks, Macklin Smith, Olav Slaymaker, Thomas Detwyler, Gamett Williams, and Lehn Franke.
The C'" analysis of the charcoal sample was run by Dr. Meyer Rubin in the laboratory of the Geological Survey in Washington, D.C.
For their review, comments, and suggestions, we are indebted to Stafford C. Happ, Asher P. Schick, George H. Dury, S. A. Schumm, R. F. Hadley, M. R. Collings, W. L. Heckler, and L. J. Reiland.
ALLUVIAL FILLS IN WESTERN VALLEYS
To cross any valley in the foothills of a large part, of the western conterminous United States is to traverse a flat floor of stream-deposited alluvium. Mnny such floors, once mmoth and undissected, are nou trenched by arroyos or troughlike gullies. Abandoned flood plains or alluvial terraces can be seen in many such val- leys, representing the surfaces of previous valley fills.
193
194 EROSION AND SEDIMENTATION
A large literature describes the local sequences of al- luviation and erosion in such valleys, and there appeals to be considerable contemporaneity in the timing of these alterations in post-Pleistocene time over an area that stretches from Wyoming to Texas. When grazing by cattle reached peak intensity about 1880, the most recent epicycle of valley trenching beg.nn in what is now believed to be a coincidence of climatic conditions conducive to erosion and degradation of tlie vegetative cover by overuse.
The alluvium which now fills these valleys and which is being trenched is usually similar in texture to that representing the fills of previous epicycles, though in some places tlie recent fill material is somewhat coarser. This alluvium is predominantly silt, often fine sandy silt, sometimes silty fine sand. The amount of clny is generally not great. The fills may be only a few feet deep in ephemeral tributaries draining several acres, and can be at least 50-feet thick through long distances. The latter figure applies to tlie alluvial valley, 150 miles in length, of the Ria Puerco, a tributary to the Rio Grande.
Three periods of late Pleistocene and recent alluvia- tion are recognized in many places in Western States. The most recent fills now being eroded are less deep than those of previous periods of aggradation repre- sented by tlie terraces which stand above the present valley floors, so even larger amounts of alluvium were stored in valleys in the past than are now observed.
Thus an immense amount of silty and fine-sandy al- luvium has been produced by ephemeral drainage basins in the five states-Arizona, New Mexico, Titah, Colo- rado, and Wyoming-and has been deposited in \-alleys. When a period of valley trenching occurred, much was eroded out, carried downstream, and the process re- peated.
It is logical to suppose that the source of sediment which would contribute to such aggradation during the periods of alluviation would be rill and gully erosion in the headwater tributaries. _Deposits. in the--valley must have been derived from the basin upstream.
, when it occurred in the main valleys or eams, also affected m
The ground surface seems io sweep up to the adjacent hills and up tributary valleys in coli-
cave-to-the-sky profiles. The topography of the ad- jacent hills seems to have been drowned in a sea of al- liivium, softening and smoothing the snrface configurn. tion of the whole landscape. This phenomenon occurs widely and is the general rule in Nebraska, I<:insas, Mis- souri, and the driftless area as well as in New Mexico, Wyoming and other parts of the Rocky Mouiitaiii area.
N A SEMIARID ENVIRONMENT
So widespread has been the phenomenon of valley aggradation with silty alluvium and so large are the volumes of sediment involved that tlie geomorphologist may wish to see examples of present-day streams cur- rently undergoing such alluviation, ~ n d to discern the areal sources of the material being deposited. But, in- terestingly, it is difficult to desigiinte channels under- going such a process-at least any that are identifiable by visual or qualitative criteria. The processes which were so important even in the historic past cannot easily be observed at present.
Furthermore, if Leopold and Miller (1954) mere cor- rect in their assertion that the source of the valley alluvim was not in clianiiel and gully erosion of the headwaters, then the processes of such sediment produc- tion must liave been mass wasting and sheet erosion. The first of these is B process little studied and the sec- ond is a process studied far m o r p on agricultural than on grazing or uncultivated areas. Little is known about rates of such processes on iionagricultural land, nor have the effects of relief, land slope, vegetation dens- ity, or other relevant factors been observed.
The present investigation w:ts initiated to study both process and rate of npgrndation il11d degraclation in the cliiinnels, rills, and on the hillslopes of a drainage basin typical of many pi\rts of the semiaritl West. This paper i s :L progress report on that study.
Investigations of the kind described here involve the operation of field s t & m and specific experiments over a period of several years. Results can he obtainetl only at infrequent intervals becxuse of tlie sporadic char- acter of the precipitation. The general method, then, \cis to establish observation st:ttions n-liich could be visited for resurvey during a period of n few weeks in summer each year, and to maintain a inore restricted number of observations after each important storm. The area chosen, ,2rroyo (le 10s Frijoles near Santa Fe, N. Mex., w-ns one in which previous work h:td been done by LeopoId and Miller (1056), and for this reason it provided a familiar geogrnphir and geologic back- ground on which to base further investigations.
Our abjwtive \YXS to integrate several aspects of fluvial processes operating- in the area : specifically, to study slier( erosion on tlie divide :nid interstream areas, slope retrcai nt1j:iccAiit to steep\v:illed gullies that pre- vail in the iiplnncls, :ind in p;uticuIar, tIie movement of co:irse and fine sediment doii-n the arroyos of various diimusions. To tliis end, \ nriox1.i kinds of measuring deirices were graclunlly de\ eloped and installed. The results reported here represent in formation collected during 7 years of observation, but some measurements have been made for only a part of the 7-year period.

CHANNEL AND HILLSLOPE PROCESSES, SEMIARID AREA, N E W MEXICO 195
GEOGRAPHIC SETTING
Arroyo cle 10s Frijoles and the other ephemeral chan- nels discussed here are a few miles west-northwest of Santa Fe, N. Mex. (figs. 138 and 139). They are typi- cal of many small arroyos or dry channels in the low- lands of the Rio Grande Depression at the base of the Sangre de Cristo Range. one a1)proaches Snnta. Fe from the west, the Sangre de Cristo Mountains appear to be abutted by a broad sloping surface underlain by poorly consolidated said and gravel. There are actu- ally several surfaces differing but slightly in elevation. However, the local relief is considerable, with rolliiig hills dissected by gullies, rills, and broad sandy-floored washes. As is typical of arid regions everywhere, these channels present almost endless variety. They range from tiny rills near the drainage diride to deep, wide arroyos incised in flat alluvial valleys. Vegetation is sparse, both adjacent to the channels and on the inter- fluves between them. In general the area is a wood- land association, including juniper, piiion, sage, and a lowdensity understory of grasses.
Because of its geological character and climate, the area studied is characterized by huge amounts of both fine and coarse sediment readily available for transpor- tation. During runoff sediment may be derived from the unconsolidated country rock or from recent alliir ~iuni '
adjacent to the channels. An arroyo discharges water only when a moderately
heavy rain falls on the drainage basin. This is a sum- mer phenomenon because heavy rains fall only from thunderstorms. No flow occurs during the winter. Ordinarily during a summer there are about three rain- storms of sufficient magnitude to produce runoff. How- ever, only exceptional rains affect an entire drainage
36
106"
6 "
FIoUBHl 138.-Area in New Mexico where detailed studies were made.
basin the size of the Arroyo de 10s Frijoles a t Sand Plug Reach (drainage area= 3.75 sq mi).
VALLEY ALLUVIUM
Many widely separated areas in southwestern United States have undergone three periods of alluviation fol- lowed by erosion, and there is evidence of approximate simultaneity of the respective events from one area to another. That some or all of these events should have occurred in the study area would be a logical supposi- tion.
Arroyo de 10s Frijoles through most of its length is incised into an alluvial fill of silty sand which a t present has a surface configuration characterized by two ter- races, and paired remnants of each are common along the principal drainage ways. The higher terrace stands about 5 feet above the channel bed in upper tributaries and tends to remain about the same height downstream along the 7-mile reach which we have studied in detail. The terrace tread is uniform and flat, and vegetated, as are the hills, with piiion and juniper and an understory of grass. Along much of the stream length the terrace is bounded by a vertical wall, at least on one side of the channel, but elsewhere i t slopes down to the lower ter- race in a subdued S-shaped profile which inay have a maximum slope of 1 : 5. Such a rounded scrap is gener- ally vegetated with bunch grasses of low density. The terrace tread grades in a smooth curve to the adjacent hills, and its whole width seldom is more than 300 feet.
The low terrace averages about 1-2 feet above the present, streambed and is seldom bounded by vertical banks. I t s surface tends also to be sonie~vlint irregular and can usually be recognized by the occurrence of rab- bit brush, locally called chamiso [ Chrysofhtrmnlc-v nnu- Seosw (Pall.) Britt.], which occurs neither on the high- er terrace nor on the pre'sently active point bars.
Typical aspects of the valleys and the terraces are shown in figure 140.
The stratigraphic relation of the alluvium of the high terrace to the bedrock underlying the adjacent hills is commonly seen in the vertical banks. The valley fill was laid in a shallow U-shaped trough cut into the friable and poorly consolidated bedrock, and the bed of the present channel lies very near the bottom of this trough in the smaller valleys and probably close to it even in the main stream. That is to say, the present stream has cut nearly through the valley alluvium and most of the depth of alluvium can be seen in the cut banks or vertical walls.
The relation of the alluvium underlying the tread of the lower terrace to that of the upper terrace is difficult to decipher. So nearly the same is the alluvium under the two terrace treads that even when a vertical bank

196 EROSION AND SEDIMENTATION IN A SEMIARID ENVIRONMENT
cuts through both, no stratigraphic contact is obvious, though an inset relation is suggested by the contacts seen. The same difficulty is often observed in alluvial fills of western valleys. We have concluded after in- spection of many sections, that the lower terrace repre- sents the top of an inset fill and that Arroyo de 10s Fri- joles is an example of a two-fill, two-terrace alluvial valley (see Leopold and Miller, 1954, p. 5, for a discus-
35'45'
T 18N T 17N
35"42'30"
sion of the classification of terraces and fills). A dia- grammatic cross section is presented of this valley in figure 141. We here apply the name Coyote terrace de- posits to the alluvial deposit under the higher terrace so prominent along streams in the vicinity which will be referred to as the Coyote terrace.
The type locality for the Coyote terrace deposits will be along the Arroyo de 10s Frijoles a t what we will
1 5 0 1 MILE I 1 I I
2000 0 2000 4000 6000 8000 FEET 1 1 1 1 I I I
FrGllnE 139.-Drainage basins of Arroyo de Los Frijoles, Coyote C. Arroyo, and Morning Walk Wash. Named reaches are locations where detailed studies were made. Also included are principal stream channels and roadways within the area.

CHANNEL AND HTLLSLOPE PROCESSES, SEMIARID AREA, NEW MEXICO 197
describe here as our main-project reach, in the NW 1 ^ SEy 4 sec. 17, T. 17N., R. 9E., 4.2 miles from Santa Fe. The name is derived from Coyote C. Arroyo at Las Dos (see p. 205), where a sample of charcoal buried in this deposit gave a date of 2800±250 years B.P. (USGS sample W1328).
Coyote terrace deposit is alluvium consisting of red-brown, slightly indurated silty sand or fine sand, sometimes fine sandy silt, with occasional discontinuous lenses
B
FIQUBE 140.—Typical aspects of the valleys and the terraces. A, Drainage basin of Coyote C. Arroyo; the man is standing on a fiat surface of alluvium or colluvium. B, Two terrace levels along Arroyo de los Frijoles; the lower terrace, about 18 inches above the channel bed, Is In the foreground; at the tree near the channel edge, the upper terrace stands 5 feet above the present bed and grades smoothly to adjacent hills. C, Arroyo de los Frijoles; the channel is cutting into the upper terrace material that here stands 8 feet above the present bed elevation; the view is on the left bank just downstream from Fence Line Headcut; bedrock crops out In the channel bed at this place, dipping downstream.
of fine gravel. When dry, the cut banks stand vertically and are hard to dig with a shovel. The alluvium is 5-10 feet thick and rests on bedrock, which here is unconsolidated sand and gravel. The top several inches may contain more fine sand or silt than at greater depths. No soil zonation is apparent though the upper 6 inches are slightly darker from the admixture of humus and incipient soil development.
The Coyote terrace forms a curving surface as it rises away from the valley floor and joins the hillslopes underlain by the Santa Fe Group. The alluvium inter-fingers with colluvium at the valley sides and extends upstream in minor tributary valleys, where the distinction between valley alluvium and colluvium at the base of the slope often cannot be made.
In the Tesuque Valley just 4 miles to the north, similar alluvial terraces have been studied by Miller and Wendorf (1958) at a location shown on figure 139. There, two terraces occur at 18-20 feet and 8-10 feet above the present channel; the alluvium underlying the higher one contains dateable artifacts and charcoal. A C14 date of charcoal lying 130 inches below the surface of the upper terrace was 2230 ± 250 years. Between the

1 98 EROSION AND SEDIMENTATION IN A SEMIARID ENVIRONMENT
FEET 10 I
Tesuque area and Arroyo de 10s Frijoles, the agreement of dates, the similarity in form, the comparable char- acter of the alluvial materials, and the geographic prox- imity of the areas suggest that the respective periods of deposition and erosion in the valleys of the whole area are correlative and may be considered Coyote ter- raxe deposits.
Though the terrace heights and the depth of alluvium of the Coyote terrace deposits differ somewhat from valley to valley as indicated by the comparison between h r O y 0 de 10s Frijoles and Tesuque Creek, such a valley fill is ubiquitous in all the ephemeral valleys in the arm. It typifies all the drainages rising in the foothills which lie west of the Sangre de Cristo Range and east of the escarpment of La Bajada, a distance of 11 miles or more in most places, and extending north-south a t least from Cuyamungue, 12 miles north of Santa Fe, to San Cris- tobal, 25 miles south of the city. This area of more than 100 square miles has been seen, a t least in recon- naissance, during this study, and our impression is that similar relations would be observed over a much larger area in central New Mexico. The Coyote terrace de- posits correspond to Deposition 2 in the regional allu- vial chronology of Kirk Bryan. (See Leopold and Mil- ler, 1954, p. 58.)
THE LOCAL BEDROCK
The hills being drained by the network of ephemeral channels are composed of the upper beds of Santa Fe Group. The whole group is at least several thousands of feet thick, but that part with which we are concerned includes tlie upper zones only, principally the Tesuque and Ancha Formations (Miller, and others, 1063, espe- cially p. 50-51 and pl. 1). The geologic ]nap by these authors includes similar landscape :3 miles north of our study area which they mapped as Tesuque Formation described :is follows (p. 50) :
The Tcsnque Yuxiiiation o f the Snlit;i E’e Group, a s defined here, consists of l~oorly consolidatcd, uatcr-laid silt, sand, and gravel, mostly tan in color. . . . Abrulrt changes in texture, both
FEET
1 l 5
0 25 50 FEE1 I , , , I I
FIGURB 141.-Diagrarnmatic CI‘OIS sect ion, Coyote t e r r ace deposi ts .
vertically and horizontally, a re the rule. Bedding is locally dis- tinct, but few beds can be traced iiiore than a iiiile o r two. Some ?f the sandstone beds are fairly well sorted and locally cross- dedded. Their coherence is due to cementation by calcium car- Joiiate. At most places, even in unconsolidated materials, the sediments are highly calcareous.
The Tesuqne Forination w a s derived froin Paleozoic and I’re- m n b r h n rocks of the niouiitains. The presence of a consider- ihle quantity of quartzite pebbles, fo r esaiiiple near Tesuque, iiidicates drainage southward froin Rio Santa Crnz or Rio de l’ruchas, which require\ a radical difference from the present lraiiiage pattern.
Miller, Jfontgoiiiery, and Sutherland ( 1963) consider the Tesuque Formation to be Tertiary. They identify a Pleistocene or upper Plioceiie hiiclia Formation consist- ing of reninants of a once-continuous sheet of unconsoli- dated gravel wliich extended originally from the west- ern part of the Sangre de Cristo range to the Rio Grande. The gravels were coiisidered to be laid down as fan deposits derived froin glacial :kction and carried out to cover the older Tesuque beds as glacinl ou twa~h deposits.
Those workers did not map as Ancha Formation any of the deposits in the area just to tlie north; the bedrock materials with which we deal are probably entirely Tesuque Formation. Because, as Miller, Montgomery, and Sutherland stated (1963, p. 5 1 ) , 100-300 feet of dis- section has occurred since deposition of the fan gravel comprising the Ancha Formation, the concentration of gravel on many hilltops which we observe in our study area may represent x lag concentrate of gravel derived from Ancha beds which now have been renioved.
Other than the gravel concentrate on hilltops, the de- cription given by Miller and his associates fits the bed- rock materials. Those autliors, as well as we, observed niariy places where the upper surface of the Snnta F e beds is weatliered. A zone of caliche, 2-3 feet thick lo- cally, permeates tlie sandy, or elsewhere tlie gravelly, bedrock materials. This caliche where it crops out does not affect, the alluvium or colluvium aiid indicates proc- esses of soil formation and weathering related to events prior to the deposition of the Coyote alluvium.

CHANNEL AND HILLSLOPE PROCESSES, SEMIARID AREA, NEW MEXICO 199 RELATION OF VALLEY ALLUVIUM AND COLLUVIUM TO
HEADWATER AREAS
The surface of the Coyote terrace can be followed as remnants along the main valley of Arroyo de 10s Frijoles and other washes upstream to where the present channel is only a few feet wide. Similarly, the surface can be followed up lateral tributaries where i t grades to tlie adjacent hills. Colluvium deposited by rills and uncoii- centrated wash merges and interfingers with alluvial deposits of the main valleys and tributaries. Excava- tion by shovel in the bed of any small, even any steep, tributary reveals alluvial-colluvial material within a few hundred feet of the watershed divide. The same rela- tion of alluvium to headwater slopes was found in east- ern Wyoming by Leopold and Miller (1954) who sum- marized their findings in these words (p. 83) :
The terraces of master streams can be traced directly into many tributaries of moderate size, indicating that erosion of alluvium in the master streams was accompanied by gully ero- sion in tributaries, even the ephemeral ones.
* * * likewise, aggradation in the main stream valleys was accompanied by deposition in tributary valleys and draws. Probably these deposits were derived by mass movement and sheet erosion on upland slopes.
It seems logical that the shift in relations between runoff and vegetation which caused erosion of all major streams would also affect the smallest tributary valleys in a'similar way a t the same time. . . . As the deposit in the main valley grad- ually increased . . ., the wash slopes that were graded to the main river accumulated material which blanketed all except the most prominent hills and uplands. The area of upland from which alluvial materials were being derived by erosion shrank, while the area of deposition increased.
The percentage of area of a small basin blanketed with alluvium-colluvium is exemplified in Coyote C. Arroyo. (See fig. 139 fo r location.) This typical drainage basin has an area of 0.064 sq mi (40.8 acres) of which 0.022 sq mi *( 14.4 acres) is covered by alluvi- um-colluvium, the remainder being hillslope and hill- top area of Tesuque Formation. I n this example, then, 34 percent of tlie surface area was alluviated, and the average distance from the head of deposition in small swales to the watershed divide was 190 feet. The al- luviation extends headwarcl astonishingly close to the drainage divides. The proximity of the colluvinl- allnvial deposits to drainage divide can be seen in fig- ure 140A.
The relation of the small tributary draws to the heacl- water slopes may be typified by the two examples in figure 142. Profiles of the surface of the alluvium- colluvium merge smoothly into the unrilled hillslope underlaiii by bedrock. Cross profiles drawn nearly p:trallel to the contours of the side hills demonstrate, in conjunction with tlie stratigraphic evidence seen in the chaiinel walls and in pits dug in the plane of the
profile, that alluvial and colluvial material fill a former channel system cut into the bedrock and that subse- quently the present channels have reevacuated parts of the earlier system. The present channel network in- cised into the alluvium makes :L present topography similar to that existing before the Coyote terrace deposit ion.
This conclusion is supported by observations of the extent of gravel which more or less covers many of the rounded hilltops of the area. I n the Slopewish Tribu- tary example in figure 142, section B-B' crosses from west to east a gravel-covered hilltop, a gravel-free area, and agzzin a gravel-covered hilltop. At tlie base of the channel on the right bank the bedrock is permeated with a white cement, presumably CaCO,.
Exposures elsewhere also indicate that hilltops cov- ered with lag gravel are usually underlain by bedrock. Thus the deep layers of silt exposed in present channel ~\-alls were deposited in ch:uinels which dissected the bedrock. The alluvium lapped up against the gmi7el- covered slopes and in places covered the gravel.
Investigations of the relation of the alluvium to the bedrock topography showed that the underlying Tesuque Formation generally appears no more weath- ered at, the contact than elsewhere. I n some places, however, alluviuni was deposited over a surface heavily cemented with caliche. The caliche appears as :L hard cement where ihe Tesuque i m s gravel, and where the Tesuque was silty, ;LS a whitish calcification of a zone extending 3-4 feet below the contact, and especially con- centrated on fracture planes. Hard nodules of caliche in the silt, are seldom seem, but amorphous soft masses \yithout sharp boundaries are common.
These facts support tlie conclusion reached by Miller, ibfoiitgomery, and Sutherland ( 1968) , that n long period of weathering under subhumid conditions IV:LS followed by a semiarid climate during which caliche permeated :in undulating topographic surface. Our observations add the additional postulation that, subsequently, this topography was first alluviated and later erosion de- veloped a drainage network similar to and about the Same depth as the present one; the erosion removed part but, not all of the materials which had undergone cal ichefica tion.
To summarize, alluviation during Coyote terrace time aggraded not only the main valleys but small tributary draws as well. Post-Coyote terrnce erosion reexcavated niucli of the earlier topography. The problenl posed by this sequence of events is the following:
If allnvintion took place in all the headwater drams nt the time the maill valleys were being nggmded, where did all the debris come from, and by what processes?

200 EROSION A N D SEDIMENTATION IN A SEMIARID ENVIRONMENT
Tributary channel bed
DISTANCE, IN FEET
S
A 13Or
A' 1
Alluviu W
0 Bedrock 5 110 ii L- looo 25 50 75 100 125 150
DISTANCE, IN FEET
A.-UNNAMED TRIBUTARY TO NORTH FRIJOLES ARROYO AT STAGGER REACH
Bed, Little Green
N Rock Gulch / /&Id;icj
W
90 ' I I I 1 I I I 1 I I I I I I I I I 1
100 200 300 400 500 600 700 800 900 DISTANCE, IN FEET
B B'
0 > 5 120
L - L _ _ L _ _ _ I _ _ _ L I . - L . . _ J 50 100 150 200 2 50 300 350
DISTANCE, I N FEET
E.-SLOPEWASH TRIBUTARY TO NORTH FRIJOLES ARROYO
F I G U R ~ 142.-Two examples of small tributaries showing stratigraphic and topographic relation of alluvium t o bedrock.

CHANNEL AND HILLSLOPE PROCESSES, SEMIARID AREA, NEW MEXICO 201
Arroyo de 10s Frijoles: Slopewash Tributary ................ North Frijoles Arroyo:
At gaging station .................. At Stagger Reach ................. At mouth.- .......................
At Locust Tree Reach ............... At Railroad Reach ..................
Clearly, the sediment n as derived from the hills above the areas of alluviation but not from rills or gullies on these hills, as evidenced by the absence of gullies or rills of any depth or importance outside of those which were being alluviated. Thus the sediment must have been derived from processes other th:m rill and gully erosion, specifically, sheet erosion or inass movement. This liypotliesis attributes to the latter processes greater ef- ficacy than we at least would have supposed. We were led, then, to devise methods of measurement which would allow the construction of a sediment budget, how- ever approximate, to ascertain whether relative impor- tance of present processes would shed light on these events of the past.
Another problem is highlighted by tlie postulates stated. It is usual to suppose that alluviation of a master stream would provide a Tising base level for the tributaries which enter into it. Then the aggradation in the tributary would similarly provide a rising base level for its own subtributaries. Though this scheme is a simple one and would lead to field relations liere ob- served, it also implies that the alluviation of the head- water tributaries would lag in time that of the main stem. But these inferences do not agree with field ob- servations in the Arroyo Frijoles area.
I t seems much more likely tliitt in our study area. the relation of runoff to vegetation which would lead a iiiniii streani to aggrade would similarly have the same result on the tributaries. We believe that control by base level is a relatively minor factor in alluviation of the valleys studied.
The remainder of this paper is organized around the measurement progr:im instituted to investignte these questions. The sample areas studied will be described, the measurement methods outlined, arid the results sum- marized. These measurenieiits will then be discussed in terms of the problems outlined (see p. 236). We begin with a discussion of the study areas.
STUDY AREAS
The areas of special study shown in figure 139 in- clude Arroyo de 10s Frijoles through its uppermost 7 miles and some smaller basins of several acres in an area 4 miles distant, near Las nos. The principal basin, Arroyo de 10s Frijoles, Iias a channel width which ranges from the smallest recognizable rills a few inches wide to an arroyo 100-200 feet wide. All channels more than a foot wide have a flat predominantly sandy sur- face dotted in places with scattered gravel.
Larger scde niaps, figures 14345, show detxils of tlie areas of intensive study and will be referred to in later discussions.
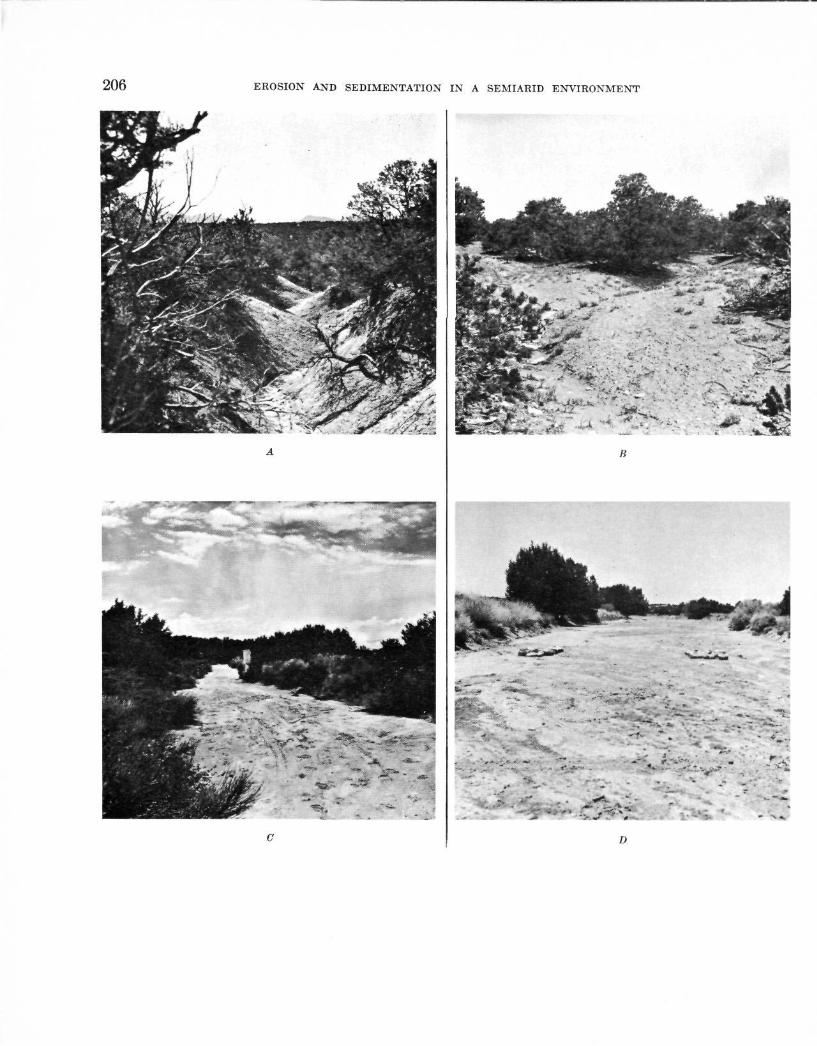
Figure 146 illustrates the character of the country and the aspect presented by main and tributary chan-
0.05 7,280 7,388
,513 ....... .70 ......
1.36 ........ 1.49 ....... 1.61 .......
nels. Figure 146, A and B, shows a small tributary within a few hundred feet of the headwater divide, a subbasin we called Slopewash Tributary.
A t a point 1.1 miles from the furthest divide the North Frijoles Reach is typical, figure 146. One mile farther downstream the channel is larger, as shown at Locust Tree Reach (fig. 1460). Main Project, Reach, 4.9 miles from the headwater divide and a t a place where the drainage area is 2.87 sq mi; is illustrated in figures 146E and F.
Some characteristics of each of the study areas are indicated in table 1.
TABLE 1.-Characteristics of locations st rrdicd
1 1 Ut Elevation above msl) Drain- __ (sqnii) At
Location
head- water
At Main Project Reach.. ........... 2.87 .......
At S tump section.. ............... 3.18 ....... At Rocky Nose section ............ 3.75 .......
Sand Plug Reach:
Gunshot Tributary. a t mouth 6.798 Arroyo Falta .......................... Coyote C. Arroyo, at dam ............. Morning P’alk Wash:
South gully. 6,633 North gully..--.- 6,615
__ i t down- stream point ___
7,200
7,159 7,111 7,048
6,987 6,790
6,696 6,672 6, 723
7,037
6, (izn ti, 550
6,540 6,540
METHODS OF STUDY
no
340
229 277
351 401 598
692 716 75
180 185
93 75
1,200
5,800 8,200
11,750 12.400 15.400 28, on0
33,601) 34. no0
5, noo 3, 6no
1,150
700 870
Observations of nearly all the types described here began in the period 1958-61 and are continuing as this paper is written. Water stages of flow are measured by recorders at gaging stations installed on North Frijoles Arroyo and a t Main Project. The duration of individ- ual flows is generally two hours or less and current-meter measurements for the construction of stage-discharge rating curves are impracticable without a full-time resi- dent hydrographer. Stage-time hydrographs are ob- tained from the stage recorders, but maximum discharge for each flow is computed using a survey profile of high-water marks. This, combined with cross-sectional areas of flow determined by scour chains (described be- low), permits the computation of discharge using an estimated value of flow resistance.
A network of 12 nonrecording rain gages is observed after each significant summer rain.
Depths of scour and fill in channels are me,asured by chains set vertically in a dug hole in the streambed. A t maximum depth of scour the chain is bent over by the flow and is usually covered by fill on the receding stage (Emmett and Leopold, 1964).

202 EROSION AND SEDIMENTATION IN A SEMIARID ENVIRONMENT
FIGWEB 143.-Arroyo de loa Frijoles.
Erosion pins, consisting of a 10-inch nail put through a washer, driven flush with the ground surface, are used to record increments of surface erosion. Some of these pins are arranged in a Urid over certain plots, but, gen- erally the nails are in a line as a transect from hilltop to base or across a channel as a cross-section.
Mass-movement pins are set on a line between immov- able bench marks, and are surveyed for alignment by transit.
Many rocks have been painted for identification and observed for movement after each flow.
The individual plants on some 3 x 3-ft qn:drats have been mapped and are to be remapped periodically to observe changes with time.
Although the methods are simple, the labor after each storm (about 3 per summer) and during the annual resurvey of a11 observation points is rather great.
9
MAGNITUDE AND FREQUENCY OF RAINFALL AND STREAMFLOW, 1958-64
Rainfall has been measured since 1959 at 12 locations within the drainage basin, as shown in figure 143. Sum-
mary of data A (p. 247) contains a partial summary of the data collected from these sites.
The gages were not read after each shower, but efforts were made to read them at least after every flow-produc- ing storm. The sporadic nature of storms is indicated by the unequal distribution of rainfall among stations.
At the Main Project Reach a recording rain gage has been installed at the location of the water-stage re- corder. Precipitation data (summary of data B) col- lected here allow a better indication of the rainfall char- acteristics. The record is too incomplete to show the mean annual precipitation which at, that location must be about 12 inches per year.
The 1,300 cfs (cubic feet per second) flow of July 25, 1962, the second highest flow recorded at the Main Project Reach, was caused by a storm which registered 1.5 inches in 25 minutes at the Main Project gage.
Channel discharge is measured or estimated at three places in Arroyo de 10s Frijoles: Main Project, Locust, Tree, and North Frijoles. Gaging stations are installed at the Main Project and at North Frijoles reaches. Dur- ing the period 1958-63, runoff occurred at the three

CHANNEL AND HILLSLOPE PROCESSES, SEMIARID AREA, N E W MEXICO 203
1960 July 14 ....................................... August 4- - . .......................................................... September 15(a). .............................
(b) ...................................................... October Q .................................... October 16(a)--- ..............................
(b) ................................ October 17 ............................................................
1961 June 26 ........................................ July 8 ........................................ August 12 .................................... August 23 September 18 (a) ..............................
(b).. ............................ September 18 .................................
196d June 30 ....................................... July 5.. ...................................... July 6. ....................................... July 18. . .................................... July 22.. ..................................... July 25. ...................................... July 30. ...................................... September E..- .............................
....................................
measuring stations on the dates indicated in table 2, in which are presented values of peak discharge. Spaces in the table usually refer to no flow ; however, in a few instances some flow may have occurred but was of neg- ligible magnitude. Flow data discussed in this report are all peak values.
T'AABLE O.--Bummcury or peak disoharges, in cubic fee t p e r second, at three locations along Arroyo de 10s Frijoles, 1958-63
[(a) and (b) refer to separate flows or different Desk flows occurrlna on the same day 1
67 360 35 152
1 ............ 10-20 10-15
3-5 ........................ 5-7 ........................
9-10 ............ 10-15 10-15
1 88
80-Qo
40 60 250
. 3
........ 40 10 3
1300 300
.........
. . -. . - -
Date North Locust Main 1 Frijoles 1 Tree 1 Project ___--
1968 Auguqt 18 ............................................................ 20
September 13 ................................. 3,060 September 6 .................................. 1 15;E 1 ...... i:lg.l 10-15
1969 May 23 ....................................... I 140 I 50-75 I 3-5 June 15 ............................................................... 2 4 July 23 ............................................................... 10-15 August 17 .................................................
October 28 . 5 ............ 1 August 24 ..................................... 1 50 1 1 ..... E?--
....................................
ea3 . 3 1 1:: I - - - - ...........
.-..
.-..
....................... . 5 ............
E 1 2: 1 1 ............
1963 July 20. September 21 .................................
...................................... I I 39: I 3;:
Most storms are intense and so local that only a part of the drainage basin is affected by each. Only twice (September 13, 1958, and July 25, 1962) was there in- creasing discharge in the downstream direction due to heavy rainfall over the entire basin, and these two storms caused the greatest flows during the period of record.
For each of the three measurement locations, the peak flows experienced were arranged according to rank and recurrence intervals were computed. These are plotted against their corresponding discharge and are shown as dashed lines in figure 147. Recurrence intervals are determined by the U.S. Geological Survey method,
T=- , where T=recurrence interval in years, n=
number of years of record, and n?,=magnitude or rank of flood, the highest being number one.
Excepting the two storms just mentioned, the spotty distribution of precipitation implies that data collected a t each of the three reaches nay be considered as inde-
n+l m
pendent flows. If this were in fact true, a type of station-year analysis might be attempted by combining 5-years of record for each of three locations into a syn- thetic 15-year record. The solid line on figure 147 gives this average frequency of the three reaches. The solid circles on this graph represent all flows a t the three sta- tions, arranged in order of magnitude.
For small flows all moderate-size drainage areas are capable of receiving sufficient rainfall to produce a sim- ilarity in flow frequency. For drainage areas larger than some given size, further increases in area would not increase the size of flood of a given frequency. This feature is indicated by the fact that a flow of 2- year recurrence interval is about the same a t Locust Tree and Main Project Reaches despite the fact that the drainage area of the latter is about twice that of the former.
The present data exceed by fivefold the values pre- sented by Leopold and Miller (1956, fig. 21, p. 24). The latter values should not be considered applicable to the foothill area of ephemeral streams though they were so considered in that report. It is now obvious that flow frequencies of the gaged streams emanating from the high mountains are not comparable with and are smaller than values for ephemeral washes in the foot- hills, despite the lower mean annual precipitation of the latter areas.
The problem of flow frequency is of paramount im- portance to evaluation of erosion and sediment trans- port processes. Though the method of determining frequency is still open to further study in ephemeral basins, figure 147 expresses the occurrence of events in the studied basin during the period of observation.
CHANNEL FORM 4 N D BED MATERIALS
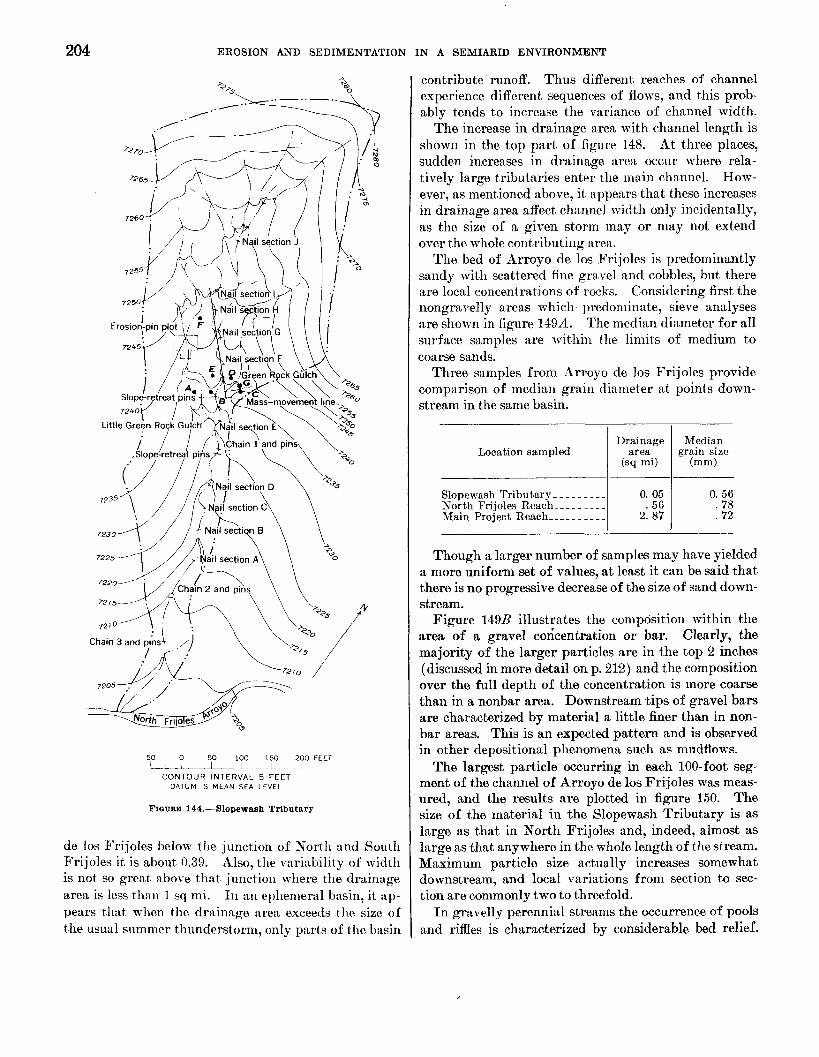
A salient aspect of the change in channel character- istics downstream is the increase in width, shown in figure 148. As defined here, channel width refers only to the active channel which is swept free of vegetation except for annual plants. I n some places the actual width between the steep banks is greater than indicated on figure 148. Such reaches usually include remnants of the lower terrace, which not only supports some vege- tation but also stands 1-2 feet above the presently active bed.
The variability of channel width quite evident in fig- ure 148 seems large, but one does not realize how large the variance is in the usual channel until he begins to make quantitative measurements. On a perennial east- ern stream not much larger in drainage area than Ar- royo de 10s Frijoles, the ratio of the standard deviation to mean channel width averages about 0.25 (data from TVolman, 1955, fig. 3 7 ) , whereas for a reach of Arroyo
204
Location sampled
EROSION AND SEDIMENTATION IN A SEMIARID ENVIRONMENT
Drainage Median area grain size
(sq mi) (mm)
50 0 50 100 150 200 FEE3 L.-I_-_J
CONTOUR INTERVAL 5 FEET DATUM IS MEAN SEA LEVEL
FIQIJBIU 144.-Slopewash Tributary
de 10s Frijoles below the junction of North and South Frijoles it is about 0.39. Also, the variability of width is not so great above that junction where the drainage area is less than 1 sq mi. I n an elhemera1 basin, it ap- pears that when the drainage area. exceeds the size of the usual summer thunderstorm, only parts of the basin
contribute runoff. Thus different reaches of channel experience different sequences of flows, and this prob- ably tends to increase the variance of channel width.
The increase in drainage area with channel length is shown in the top part of figure 148. At three places, sudden increases in drainage area occur where rela- tively large tributaries enter the main channel. How- ever, as mentioned above, it appears that these increases in drainage area affect channel width only incidentally, as the size of a given storm may or may not extend over the whole contributing area.
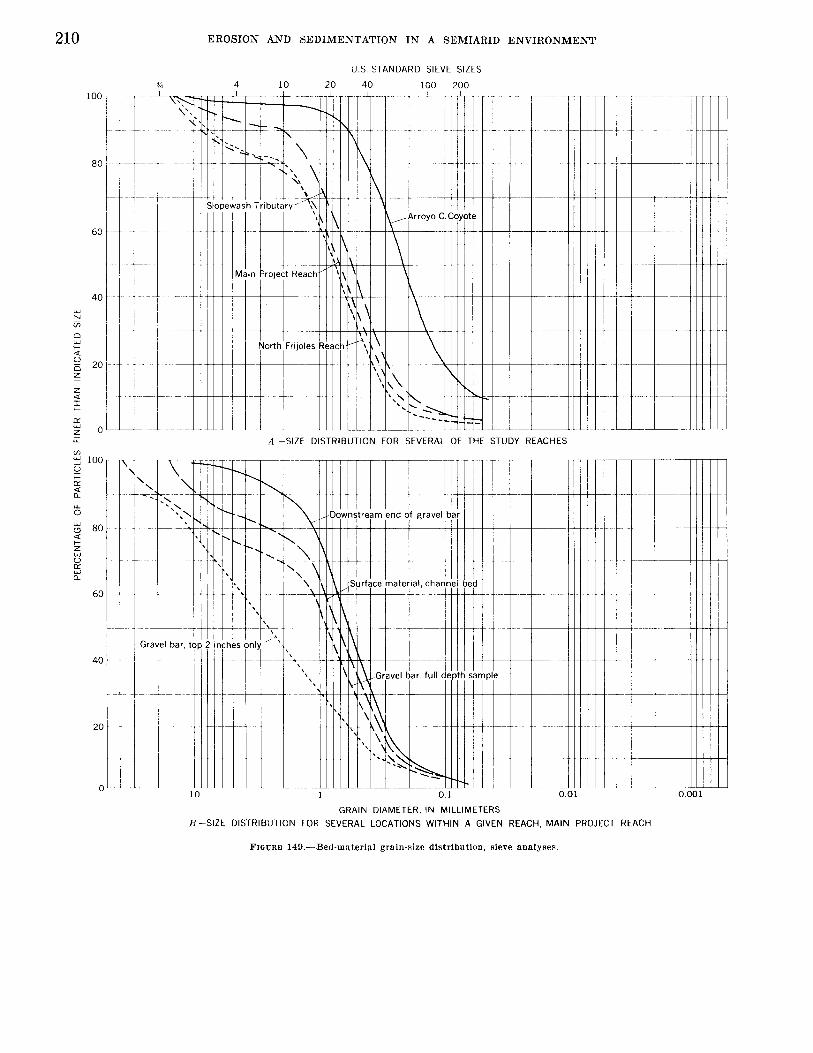
The bed of Arroyo de 10s Frijoles is predominantly sandy with scattered fine gravel and cobbles, but there are local concentrations of rocks. Considering first the nongravelly areas which predoniinate, sieve analyses are shown in figure 149A. The median diameter for all surface samples are within the limits of medium to coarse sands.
Three samples from Arroyo de 10s Frijoles provide comparison of median grain diameter a t points down- stream in the same basin.
Slopewash Tributary - - - - - - - - -
Main Project Reach _ _ _ _ _ _ _ _ _ _ 1 2: 58; 1 0. 05 0. 56 . 7 8 . 72
North Frijoles Reach ____. _ _ _ _
Though a larger number of samples may have yielded a more uniform set of values, a t least it can be said that there is no progressive decrease of the size of sand down- stream.
Figure 149B illustrates the composition within the area of a gravel codcentration or bar. Clearly, the majority of the larger particles are in the top 2 inches (discussed in more detail on p. 212) and the composition over the full depth of the concentration is more coarse than in a nonbar area. Downstream tips of gravel bars are characterized by material a little finer than in non- bar areas. This is an expected pattern and is observed in other depositional phenomena such as mudflows.
The largest particle occurring in each 100-foot seg- ment of the channel of Arroyo de 10s Frijoles was meas- ured, and the results are plotted in figure 150. The size of the material in the Slopewash Tributary is as large as that in North Frijoles and, indeed, almost as large as that anywhere in the whole length of the stream. Maximum particle size actually increases somewhat downstream, and local variations from section to sec- tion are commonly two to threefold.
I n gravelly perennial streams the occurrence of pools and riffles is characterized by considerable bed relief.
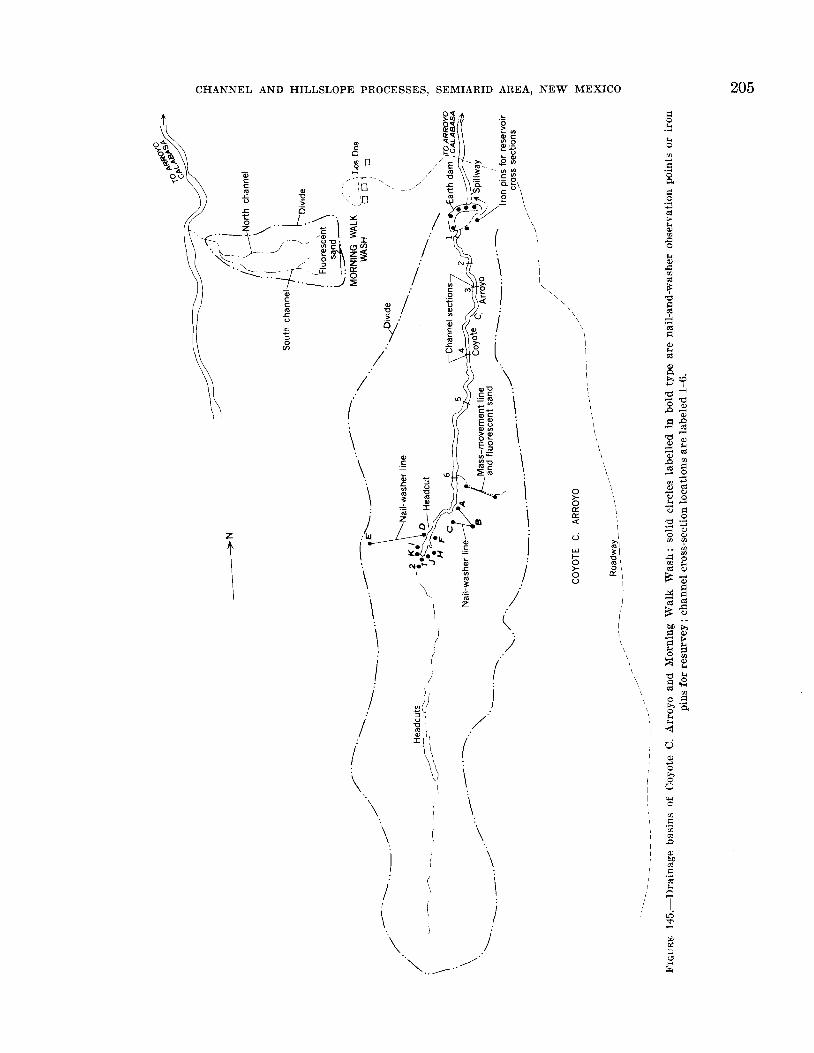
CHANNEL AND HILLSLOPE PROCESSES, SEMIARID AREA, NEW MEXICO 205
\ I
\
i
206 EROSION AND SEDIMENTATION IN A SEMIARID ENVIRONMENT
•
. - t :
»• V -
II

CHANNEL AND HILLSLOPE PROCESSES, SEMIARID AREA, NEW MEXICO 2 0 7
B
FIODEB 146 (Above and left).—Photographs illustrating several of the individual study areas. A, Slopewash Tributary ; the area shown is along the mass-movement line (see fig. 144 for location). If, Slope-wash Tributary ; the area shown is within the erosion plot. C, North Frijoles Reach, Arroyo de los Frijoles ; the view is downstream from above the gaging station. D, Locust Tree Reach, Arroyo de los
The riffle is a gravel bar or accumulation which is a topographic high, a feature which rises well above the mean bed elevation. The pool is a trough below mean bed elevation.
In the larger ephemeral streams of the area here studied, (here is no such relief on the dry streainbed. In fact the bed is remarkably flat across its width and closely resembles a gently inclined plane, for the longitudinal profile is quite straight.
Only in detailed mapping did we become aware of the fact that local concentrations of gravel on the sand bed correspond in principle to the riffle of the perennial river. These' bars, as we call them, are so slightly elevated above mean channel bed elevation that they would not be recognizable as a topographic high. Rather, we have mapped them merely by inspection of surface texture. Because some gravel particles occur everywhere, designation of a bar is rather subjective, but generally it implies individual cobbles spaced within several diameters : whereas in areas not called bars the spacing of cobbles would be 20-50 diameters or more. Typical gravel concentrations are illustrated in figure 152Z>.
SPACING OF GRAVEL BARS
The position of gravel bars in the vicinity of the Main Project Reach as mapped eacli summer during the
F
Frijoles; view upstream ; visible in the foreground are rock groups from the painted rock experiments. E, Main Project Reach, Arroyo do los Frijoles; the view is downstream from above the gaging station. F, Main Project Reach, Arroyo de los Frijoles, looking upstream.
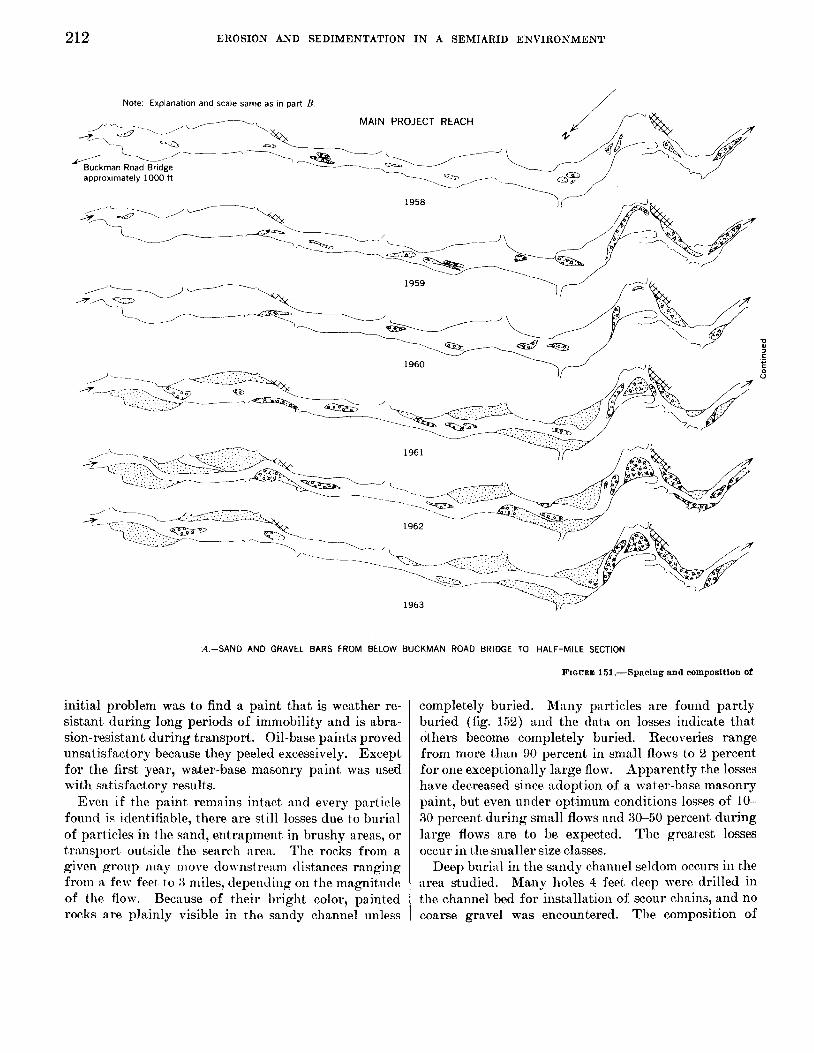
period 1958-63 is shown in figure 151. It seems apparent that the position of a gravel bar remains remarkably stable. This is true despite the fact that two or three flows of sufficient magnitude to move the material on the bare occurred between the successive mappings. For example, the largest flow measured during the entire period of study occurred between mappings in 1958 and 1959, and at that time scour to depths of 0.4-1.4 feet occurred. Thus all the material of the surface of the channel bed moved downstream, yet the bare were rebuilt in approximately the same places as before. However, with each annual mapping, a few bars are missing in the new map that were present in the old map, and also a few new bars appear.
Beginning in 1961, a more intensive ell'ort was made to map gravel accumulations. I t is this effort, rather than an actual increase, which, in figure 151, shows more extensive areas of gravel beginning in 1961.
In accordance with observations elsewhere the gravel bars are spaced on the average at a distance equal to five to seven times the channel width, and this ratio persists through all the years of record.
Measurements of gravel size and density on the surface of gravel bare were made at two different times separated by major flows. I t was found that both the size distribution and density of particles greater than 1 inch in diameter remained almost the same.

208 5000
2000
1000
0 500 z 0 Y rn
E W
I- W W U
a
0 2 200 0
c W- W LT a I M E 100
50
20
10 (
EROSION AND SEDIMENTATION IN A SEMIARID ENVIRONMENT
I p-7- - 7 - r T 7 --7--- -- T 0 Synthetic 15-year record o Main Project. drainage area = 2 87 sq mi A Locust Tree, drainage area = 1 49 sq mi
North -
joles, drainage area = C 6 sq mi
A
I /
/ / ,
I I
/ /
/ ,’- A / A /
I‘ I,.’ a
/
/
< ’
_ _ - e - .- c*
-7 -T---l--T-
/ /
0 i’
0.2 0.5 1 2 5
RECURRENCE INTERVAL, I N YEARS
F I G U E ~ 147.-Magnitude and frequency of flows, Arroyo de 10s Fri joles, 1958-62.
I 20

CHANNEL AND HILLSLOPE PROCESSES, SEMIARID AREA, NEW MEXICO 209
-i- . _r T---r--T-
- ~ ___._ -
5 W
% 3
5: ---
3 -Note Main stem of North Frijoles extends
2800 feet farther upstream be-
I--'
JTributary - -
Tributary
L
z- I'
W L L
I- : _I w Z z I 0
a
z - 2 4 a w 1 a I a
[L
u
120
100 [... 1
J I -
-
I _
yond junction with Slopewash--- - - Tributary
____. _ _ _ _ --
o----
0 2 4 6 8 10 12 14 16 18 20 22 24 26 28 30 32
DISTANCE DOWNSTREAM FROM DIVIDE ON SLOPEWASH TRIBUTARY, IN THOUSANDS OF FEET
F I G W R ~ 148.-Relatfon of channel width and drainage area to channel length, Arroyo de 10s Fr l joles
210
100
80
60
40 W 1 v,
cl W
+ Q 8 20
Z
I c [L W
a
LL f 0
W
u LL w a 4
EROSION AND SEDIMENTATION IN A SEMIARID ENVIRONMENT
U.S. STANDARD SIEVE SIZES
4 10 20 40 100 21
A.-SIZE DISTRIBUTION FOR SEVERAL OF THE STUDY REACHES
t
H.-SIZE DISTRIBUTION FOR SEVERAL LOCATIONS WITHIN A GIVEN REACH, MAIN PROJECT REACH
FIGURE 149.-Bed-moterial groin-size distribution, sieve analyses.

CHANNEL AND HILLSLOPE PROCESSES, SEMIARID AREA, NEW MEXICO
g t l X
P m 300 . _ 1 W z z I 0 250
0 m k
a
U
5 s t;
I 200
U J
W Y
~ 150 W IY
z 3 I
n
100 z
I--- " 0 2 4 6 8 12 14 16 18 20 22 24
DISTANCE DOWNSTREAM FROM DIVIDE ON SLOPEWASH TRIBUTARY, IN THOUSANDS OF FEET
F I G U R E 150.-Downstream distribution of coarsest particle in each 100-foot segmrnt of channel.
,Ilso, for sei-era1 flows, the experiment included some rock groups composed of only one weight class. I n this arrangement, rocks were spnced on 1, 2, or 3 diameters rather than by the absolute distaiices of 0.5, 1.0, or 2.0 feet.
At, the Main Project where the channel is straight, there were initially eight ranges of rock groups about 110 feet, apart. The groups having 1-foot spacing lay along tlie centerline of the channel and the groups hav- ing +"-foot aiicl 2-feet spicing on either side, alternating from 0110 range to another. Arrangement of the four upstrenni ranges was the obverse of that for the four downstream ranges so as to eliminate bias in across-the- channel variation. The position of each particle was individnally recorded together with its weight and di- mensions of the long, intermediate, and short axes. I n addition there were two lines of boulders (as much as 97,500 g) spaced O feet apart across the channel in this reach. A t various times additional temporary ranges of particle groups have been installed at the Main Proj- ect Reach, but, the eight ranges :ind two lines of large particles described above were maintained during the
entire investigation. After each flow we nieasurecl tlie distance that iiidividual particles moi-ed, and in prep- aration for the next flow, reconstructed each particle group in accordance with the specific:itions described.
Procedure at other readies was basically the same as for the Main Project Reach. A t the Locust Tree Reach there were originally tn-o rai~ges, three since 1960, each including groups having two different spacings, and also a line of large rocks spaced 6 feet apart. The channel is so narrow a t the North Frijoles Reach that the groups having different spacings were located along the length of the channel rather than along a line per- pendicular to it.
At the Railroad Reach there was n single line of mi- fii11:tr basalt boulders ireighi~ig :is much as 11 1,000 gr:ims and spaced 4 feet apart. The Stagger Reach Iind two lines of basalt boulders weighing as much as 47,500 grams, and spaced 8 feet, apwt. Basalt is :I lithology foreign to the drainage basin and was derived from highway and railroad fills.
Tracing the downstream movement of painted gravel particles during a flox involved certain difficulties. Lh
212 EROSION AND SEDIMENTATION IN A SEMIARID ENVIRONMENT
Note Explanation and scale same as in part B //
1958
approximately 1000 ft
A,-SAND AND GRAVEL BARS FROM BELOW BUCKMAN ROAD BRIDGE TO HALF-MILE SECTION
initial problem was to find a paint t.hat is weather re- sistant during long periods of immobility and is abra- sion-resistant during transport. Oil-base paints proved unsatisfactory because they peeled excessively. Except for the first year, water-base masonry paint was used with satisfactory results.
Even if the paint remains intact and every particle found i s identifiable, there are still losses due to burial of particles in the sand, entrapment in brushy areas, or transport outside the search area. The rocks from a given group may move downst rwni distances ranging from a few feet to ;% miles, depending on the magnitude of the flow. Because of their bright color, painted rocks are plainly visible in the sandy channel unless
FIQURIO 151.-Spacing and composftion of
completely buried. hfany particles are found partly buried (fig. 152) and the datR on losses indicate that others become completely buried. Recoveries range from more than 90 percent in small flows to 2 percent for one exceptionally large flow. Apparently the losses have decreased since adoption of a water-base masonry paint, but even uiicler optimum conditions losses of 10- 80 percent during small flows and 30-50 percent during large flows are to be expected. The greatest losses occur in t lie smaller size classes.
Deep burin1 in the sandy channel seldom occurs in the area studied. Many holes 4 feet deep were drilled in the channel bed for instdlatioii of scour chains, and no coarse gravel was encountered. The composition of

C H A N N E L AND HILLSLOPE PROCESSES, SEMIARID AREA, N E W MEXICO 213
/” - /
100 o io0 200 300 400 FEET , , < / I I LU
EX P L A N AT1 0 N a Sand Gravel Sand and Gravel Outcrop,
B.-SAND AND GRAVEL BARS FROM HALF-MILE SECTION TO SAND PLUG REACH
Santa Fe Formation
gravel bars, Arroyo de 10s Frijoles, 1958-63.
gravel bars lends support to the conclusion that c a m e particles occur only at or near the channel surface. A typical bar (fig. 1520) is strewn with coarse gravel, and in n typical cross section it is appren t that this is only a surface veneer extending at most :I few grain- diameters deep.
Even when the bed scoured iiiore thnn a foot in a high flow iuicl subsequently filled to the original elevation, large gravel particles did not becwme deeply buried and, for the most part, projected slightly above the refilled surface.
The esp1an:ition of this plienoiiienon nppe:trs to be the n:ignolcl-disl~~rsive-stress ( 1%6) caused by grxin- to-grain impact during motion. The stress increases
as the diameter squared and the large particles, sub- jected to highest stress, are forced to tlie bed surfnce where the dispersive stress is zero.
Subsequent to these observations, some streambeds in Maryland (annual precipitation 44 inches) were sampled to determine whether similar phenomena OG-
cur. It vas found that gravel-bed streams in a sub- humid region also tend to have a concentration of the largest particles a t tlie surface of the cliaiiiiel bed (Leo- pold and others, 1964, p. 211).
For the purpose of segregating the influence of size and spacing on particle movement, it is not necessary to consider the distance a given rock moved during a flow; that is, whether it was actually found downstream or

2 1 4 EROSION AND SEDIMENTATION IN A SEMIARID ENVIRONMENT
A It
R M
. . l.K.~ ~
&."
• . • ~ » -
n
FIGURE 152.—The painted rock experiments and a natural ly occurring accumulation of large part icles. A, Main Project Reach, showing Lat in Square position of pa in ted rock groups in the sandy channel. B, Rocks moved from Main Project Reacli dur ing flood of August 4, 1960 ; note scour p i t s around each boulder. C, Detail of rock weighing 7.100 grams a t Main Project Reach, part ial ly buried by sand and organic debris dur ing flow of August 4, 1060. D, Gravel bar a t Sand Plug Reach, Arroyo de los Frijoles, looking upstream.
CHANNEL AND HILLSLOPE PROCESSES, SEMIARID AREA, NEW MEXICO 21 5
g 90 6 I- Z W
8 0 . W a
70
60
50
_ _ - -__ -__ _ _ A -1 Spacing= 1 o f t A
Spacing=O 5 f t A s- A
-~ - A
-
.-___- ~
- - .- --- __ . - __ - - v v C
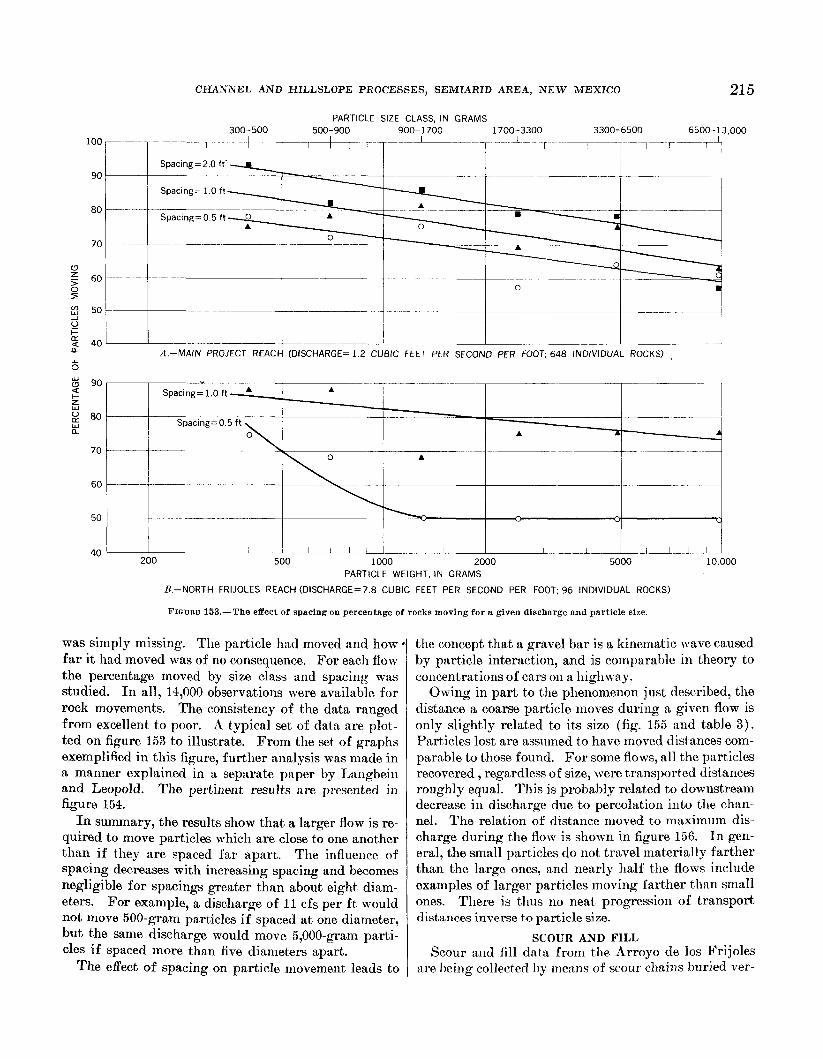
was simply missing. The particle had moved and how f a r i t had moved was of no consequence. For each flow the percentage moved by size class and spacing WM studied. I n all, 14,000 observations were available for rock movements. The consistency of the data ranged from excellent, to poor. A typical set of datn are plot- ted on figure 153 to illustrate. From the set of graphs exemplified in this figure, further analysis was made in a manner explained in a separate paper by Langbein and Leopold. The pertinent results are presented in figure 154.
I n summary, the results show that a, larger flow is re- quired to move particles which are close to one another than if they are spaced far apart. The influence of spacing decreases with increasing spacing and becomes negligible for spacings greater than about eight diam- eters. For example, a discharge of 11 cfs per ft would not move 500-gram particles if spaced a t one diameter, but the same discharge would move 5,000-gram parti- cles if spaced more than five diameters apart.
The effect of spacing on particle movement leads to
the concept that a gravel bar is a kinematic wave caused by particle interaction, and is comparable in theory to concentrations of cars on a highway.
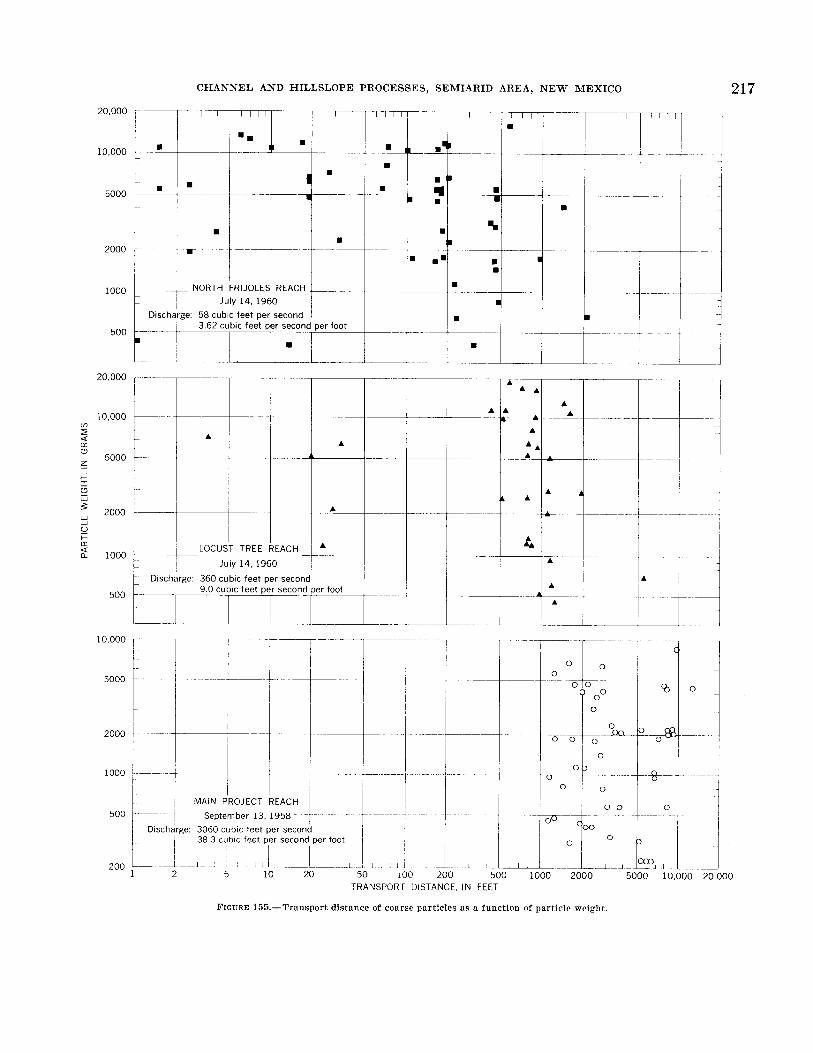
Owing in part to the phenomenon just described, the distance a coarse particle moves during a given flow is only slightly related to its size (fig. 155 and table 3) . Particles lost are assumed to have moved distances com- parable to those found. For some flows, all the particles recovered , regardless of size, were transported distances roughly equal. This is probably related to downstream decrease in discharge due to percolation into the chan- nel. The relation of distance moved to maximum dis- charge during the flow is shown in figure 156. I n gen- eral, the small particles do not travel materially farther than the large ones, and nearly half the flows include examples of larger particles moving farther than small ones. There is thus no neat progression of transport distances inverse to particle size.
SCOUR AND FILL Scour and fill data from the Arroyo de 10s Frijoles
:we being collected hy nie;ms of scour chains buried ver-

216
6 30 9 LL w a n z 20 0 Y v)
2 15
t,
0 m 3 10 O 9
8 z uj
1 7 0 k-
a
W U
W
% 6
8 5 t- Z ; 4 W a 0 2 3 W > 0 H
2 2 9 n 3
E 1 W CI LY 4: L M
O300
~. . .
75
I 500
EROSION AND SEDIMENTATION IN A SEMIARID ENVIRONMENT
PARTICLE SIZE, B-AXIS. I N MILLIMETERS 145 181
v)
1000 2000 3000 PARTICLE WEIGHT IN GRAMS
2.37
c 0
1.91 2 W a: Q 3
1.64
a w a v) 0
1.32 5 B
1.17
A,-RELATION BETWEEN DISCHARGE, SIZE, AND SPACING FOR 100 PERCENT OF PARTICLES MOVING
FIGUREl 154.-Summary of data relating discharge, size, and spucing for painted rock experiments.
CHANNEL AND HILLSLOPE PROCESSES, SEMIARID AREA, N E W MEXICO 217
10,000 20'ooo L 5000
'II" 7 - 1 -
i = I--- I
I . 2000 1 I
1000 c NORTH FRIJOLES REACH i___. July 14, 1960
!e: 58 cubic feet per second Disch; 1 3.62 cubic feet per second per foot I I I
500 I--- I I . I 20,000 I - -
3-+1_- LOCUST TREE REACH
July 14, 1960 1 - ~ Discharge 360 cubic feet per second
9 0 cubic feet per second per foot I 1 I -T- 500
10,000
5000
2000
1000
500
200
-oL.;;w- 0 I .
Discharge 3060 cubic teet per second 38 3 cubic feet per second per foot
I ~ 1 I- L L 1 1,
1 2 5 10 20 50 100 ;
0 ! O b ! I D 2000 5000 10,000 20,000
TRANSPOR r DISTANCE. IN FEET
FIGURE 155.-Tmnsport distance of coarse particles as a function of particle weight

218 EROSION AND SEDIMENTATION IN A SEMIARID ENVIRONMENT
:Isper It
38.3
1::;5
TABLE 3.-Relation of transport distance to flow discharge
classes averaged together] [Leaders indicate t hat data are insufficient for an average or that category is inapplicable. Distance measurements cantered in two columns represent data from adjacent size
2 W m 300-500 500-900
- _ _ _ _ _ _ ~ 5,880 2,336 3,862
} ......... 1,771 I
Location 26,000- 52,000
___- ....................
1,087
....................
....................
0 0 0
....................
....................
....................
....................
....................
...................
....................
....................
....................
....................
.................... 2,140
304 191 188 61 35 14 43
260
Main Project .........
52,000- 104,000
363
...................
...................
................... 0 0 0
...................
...................
...................
...................
...................
...................
..........
..........
..........
..........
..........
..........
..........
..........
148
Locust Tree ..........
~- 900-1,700
-- 3,500
North Frijoles- .......
1,700- 3,300
4,537
Stagger Reach. .......
Railroad Reach ......
- ~ _ _ 4,815 ....................
1,783 I
99
83 141
24
13:r 194 463
3 8 7 ) 0 ;
T
.........
1,568
1,120 1,592 I 496
806 7m3!7
107 .................... 34 ................... 8 ................... 547
142 119
124 I 78
269 78 217 159 79 48
............................
...................
...................
...................
...................
...................
...................
............................
...................
...................
Date
9-13-58 7-25-62 7-30-62 9-18-61 9-19-61 8-04-60 7-08-61 8-12-61 7-05-62 7-14-60 847-59 7-23-59 9-19-61 7-08-61 7-25-62 7-30-62 7-14-60 8-12-81 7-05-62 5-23-59 8-17-59 9-0&58 9-19-61 b23-59 8-12-61 7-25-62 7-14-60 7-08-61 8-24-59 9-06-58 9-19-61 7-14-60 7-30-62 8-12-61 7-05-62 7-25-62 7-08-61 7-06-61 7-14-60
1,811
260 ..........
18 2 .........
0 0 0
..........
..........
..........
757 ......... .........
972
170
......... 118 71
1,313 458 647 49 39 45
1,665 381
.........
.........
Discharge I Average transport distance, In feet, by size class of particle, in grams
336 330 218 57
...................
...................
....................
...................
....................
...................
....................
...................
...................
CIS
242 325 110
..........
3,060 1,300
300 60
250 152 98
80-90 40 35
20-25 10-15
650 498 450 450 360
300-400 150
50-75 20-25
10 230 140 85 85 67 58 50
1520 ........ ........ ........ -. - - -. -. ........ - - - - - - -. ........ .~ ..__.. ........
......................................
......................................
......................................
......................................
......................................
......................................
......................................
......................................
......................................
5.32 .......... 550 5.32 ..........
3.12 .......... 117 229 1.09 268 93
but the net change in bed elevation since the time of the initial survey may still be obtained.
By 1959 the majority of the chains had been installed along the arroyo. Scour-and-fill data for a sample flow, for the year 1962, and for the period 1958-62 are shown in figure 158. The upper part of the figure shows the drainage area of Arroyo de 10s Frijoles and the general location of the chains by chain number. For the two individual flows, the lower dashed line represents the depth of scour. The upper dashed line represents the depth of fill. The heavy solid line represents the net change in bed elevation after scour and fill.
The nature of the flash flow is such that the entire length of the arroyo may not be flooded with each storm. The flow-proclucing rain m:Ly be so located that only lower reaches received runoff, or, for a smaller storm near tlie headwaters, :I part or possibly the entire flow may be absorbed into the ground by percolation before is reaches :I downstr~nm section. A third possibility re- mains that a. particular chain section may be left dry or has very little scour because i t was not in the lowwater path of flow. For :L single storin, then there is a coii- sidernble vari:ition in the recorded depth of scour fro111
section to section. This variatioll is further exeinpli- fied in the Main Project Reach where the chains are
3,300- 13, OOO- 6,500 1 ?3% I 26,000
Average for all sizes
4,028 1.775
784 4.56 446 186 145 93 7
11 1,818 1,123 1,198 1,051 663 234 223 151 M
670 254 332 273 216 284 125 155
1,727 400 373 109 53 38 14
879 340
placed at 100-foot intervals. I n spite of individual variations a general consistency prevails among the data, that is, at most sections along the channel there is a scour and subsequent fill. All flows produce this sitme pattern ; the magnitude of scour is primarily cle- pendent upon hydraulic factors of individual flows, and these factors are related to the intensity and total amount of rainfall.
North Frijoles, Locust Tree, and Main Project reaches of the channel nre the objects of special study and are also the reaches where flow rates are measured. It is within these reaches that the chain sections are located to determine cross-channel patterns of scour. The mean depth of scour at a section may be determined by av- eraging tlie values from the several chains a t each of the sections. Mean values of scour for each recorded flow are tabulated in table 4. The data are plotted in figure 150. Despite considerable scatter among the data, the mean scour depth appears to be proportional to the square root, of discharge per unit width of channel. *In increasing depth of scour downstream is not, ob-
served in :my single profile (fig. 158). Proha hly for similar rwsoiis, the depth of scour is
:~ppirentIy indepentleiit of cliannel width. Channel widths h n i . ~ been illiist rated on figure 148. No sys-

CHANNEL AND HILLSLOPE PROCESSES, SEMIARID AREA, N E W MEXICO 219
q Y 20
cn
0 1 L-
I 1 Main Project Reach
L Locust Tree Reach
I North Frijoles Reach L-
I- O
U i L L I L I
---TT-'--
. .
~ I .
. _ 1 2 5 10 20 50 100 200 500 1000 2000 5000 10,000
TRANSPORT DISTANCE. IN FEET
FICURPi 156.-Average transport distance of coarse particles as a function of discharge (sizes approximately 200-13,000 9 ) .
tematic relation of local depth of scoiir to the corre- sponding channel x ~ i d t l i could be established.
The seven cliain sections provided d:itn to study lateral variations in scour across the n-icltli of the channel. One of these sections, chosen :ts representative of :I typical reach, is illustrated on figure 160. This figure, illustrat- ing a Main Project section near station 25,000 feet, in- dicates a net aggradation for tlie 6-yexr period. The whole width of tlie cliaiiiiel scours duriiig nearly every flow, but tlie amount of wour aiitl fill varies cross the wid t 11.
The progressive effect of scour and fill o \ w tlie length of the cliannel is illustrated iii figure 161. Kxcept for several isolated reaclies, aggrnclat ioii is occurring over tlie entire leiigtli of tlie c+h:unnel. For tlie period of record, t Iris :iggr:ichtion :imouiits to :in :i\-ei-:ige of 0.04 f t per y r invlii(1iiig tliose i.riic*lies \I IiicIi show :I net
Net woiir in iiitli] itluitl rc:iclit.; vaii be partially ex- For
ScOlIr.
plained eit lior by lint i i ra l 01' iiiaii-cniised events.
examples, a t a stationing of 52,000 feet (fig. 161) the large flow of 1958 cut through a fan-type deposit (lit- ernlly a sandplug and hence the nniiie for this reach) at, the chain location aiid indicated a large net scour. This fan liad earlier been deposited at tlie iiiouth of an entering tributary. this sand fan most of the chan- nel width was accuinu1:tting a net fill aiid now, 196.1, an islandlike deposit over a foot liigli occupies :i large part of the channel width. Channel-wide, a iiet ;Lggradat ion does exist at that location, but because of the plnceiiieiit of the cliain a iiet scour shows 0 1 1 theprapli of figure 161.
Also, in some of the upstream re:whes of tlie channel, excavation of s n n d by local contrnctors is responsilde, at least in part, for the alqmrent net degradation a t these sections.
The downstream profiles of the channel bed showing progressive accretions of sediment diiring aggradztion probably represent as detailed an liistorical record of this process as has been compiled.

220 EROSION AND SEDIMENTATION IN A SEMIARID ENVIRONMENT
TABLE 4.—Mean depth of scour as a function of discharge
FIGURE 157.—Horizontal part of chain lying at depth of maximum scour, here about half a foot. Vertical part of chain disappears below man's hand.
The record demonstrates some nonuniformity along a channel 6 miles long, some short reaches not following the general trend. The reaches not participating in the aggradation do so consistently, but as in the Sand Plug Reach at the lower end of the studied length, the reason for its deviation relates to special and understandable local circumstances. Interestingly, the random pattern of storm occurrence does not lead to a random location of reaches of sediment accretion, for the increment of deposition is rather uniform from year to year.
The exaggeration of scale in figure 161 must be kept in mind, and the variations in yearly increments are really very small considering the channel length involved. If one short reach aggraded a tenth of a foot more than another a thousand feet away, the channel slope in the reach would be changed by only 0.0001 foot per foot. The variability along the channel due to the irregularities of depositional increment are of this order. Thus, despite random character of storms and the local loss of flow to channel percolation the mean slope of the bed is maintained over long reaches.
A more complete discussion of the records of scour is given by Emmett and Leopold (1964). For the present purpose, suffice it to say that scour is associated with dilation of the grain bed through the scour depth, but that individual particles may move intermittently and at a speed much less than that of the water. The volume of material scoured and moved is large. Because of its low mean speed downstream, that whole volume does not move entirely out of a long reach but, in effect, is shifted downstream only a limited distance.
N o r t h Frijolea Reach
D a t e of flow Discharge
(efs)
Uppe r section Lower section Discharge
(efs) Discharge (efs per ft)
Scour (ft)
Discharge (efs per ft)
Scour (ft)
9-6-58 17.5 194 140 50 67 9
58 230
7 90 10 5
0.87 9 .7 7 .0 2.50 3.50
.40 2.90
11.50
0.018 .215 .103 .083 .068 .023 .130 .188
1.46 16.2 11.7 4 .17 5.59 .67
4.84 19.20
.58 7.50 .83 .42
0.050 9-13-58 5-23-59 8-24-59 7-14-60 11-16-60 7-08-61 9-19-61 7_05_62 .
17.5 194 140 50 67 9
58 230
7 90 10 5
0.87 9 .7 7 .0 2.50 3.50
.40 2.90
11.50
0.018 .215 .103 .083 .068 .023 .130 .188
1.46 16.2 11.7 4 .17 5.59 .67
4.84 19.20
.58 7.50 .83 .42
.977
.460
.000 .135 .315 .268 .598 .040
7-30-62 7-20-63 9-21-63
17.5 194 140 50 67 9
58 230
7 90 10 5
4.50 .50 .25
.153
.180
.293
1.46 16.2 11.7 4 .17 5.59 .67
4.84 19.20
.58 7.50 .83 .42
.175
.128
.448
Locus t T r e e Reach
Discharge Scour (ft)
(efs) (efs per ft) Uppe r section
Midd le section
Lower section
9-13-58 5-23-59 8-07-59 7-14-60 7-08-61
1320 62.5 22.5
360 498 350 650 150 450
15 316
3 4 0 1.69 .56
9.0 12.47 8.75
1 6 2 5 3.75
11.2 .38
7.9
0.820 .132 .196 .260 .464 .194 .280 .274 .272 .134 .314
9-13-58 5-23-59 8-07-59 7-14-60 7-08-61
1320 62.5 22.5
360 498 350 650 150 450
15 316
3 4 0 1.69 .56
9.0 12.47 8.75
1 6 2 5 3.75
11.2 .38
7.9
0.820 .132 .196 .260 .464 .194 .280 .274 .272 .134 .314
0.076 .060 .212 .406 .368 .138
0.255 .078 .205
8-12-61 -9-19-61.—
1320 62.5 22.5
360 498 350 650 150 450
15 316
3 4 0 1.69 .56
9.0 12.47 8.75
1 6 2 5 3.75
11.2 .38
7.9
0.820 .132 .196 .260 .464 .194 .280 .274 .272 .134 .314
0.076 .060 .212 .406 .368 .138
.393
7-05-62 7-30-62 7-20-63 9-21-63
8-18-58 9-13-58 5-23-59 7-23-59 8-07-59 7-14-60 8-04-60 7-08-61 9-19-61 7-25-62 7-20-63 9-21-63
1320 62.5 22.5
360 498 350 650 150 450
15 316
3 4 0 1.69 .56
9.0 12.47 8.75
1 6 2 5 3.75
11.2 .38
7.9
0.820 .132 .196 .260 .464 .194 .280 .274 .272 .134 .314
0.076 .060 .212 .406 .368 .138
7-05-62 7-30-62 7-20-63 9-21-63
8-18-58 9-13-58 5-23-59 7-23-59 8-07-59 7-14-60 8-04-60 7-08-61 9-19-61 7-25-62 7-20-63 9-21-63
1320 62.5 22.5
360 498 350 650 150 450
15 316
3 4 0 1.69 .56
9.0 12.47 8.75
1 6 2 5 3.75
11.2 .38
7.9
0.820 .132 .196 .260 .464 .194 .280 .274 .272 .134 .314
.334
.076
.320
.300
.133
.305
7-05-62 7-30-62 7-20-63 9-21-63
8-18-58 9-13-58 5-23-59 7-23-59 8-07-59 7-14-60 8-04-60 7-08-61 9-19-61 7-25-62 7-20-63 9-21-63
M a i n Project Reach
7-05-62 7-30-62 7-20-63 9-21-63
8-18-58 9-13-58 5-23-59 7-23-59 8-07-59 7-14-60 8-04-60 7-08-61 9-19-61 7-25-62 7-20-63 9-21-63
Discharge (efs)
Uppe r Reach Lower R e a c h Low-water chains
7-05-62 7-30-62 7-20-63 9-21-63
8-18-58 9-13-58 5-23-59 7-23-59 8-07-59 7-14-60 8-04-60 7-08-61 9-19-61 7-25-62 7-20-63 9-21-63
Discharge (efs)
Discharge (efs per ft)
Scour (ft)
Discharge (efs per ft)
Srour (ft)
Discharge (efs per ft)
Scour (ft)
7-05-62 7-30-62 7-20-63 9-21-63
8-18-58 9-13-58 5-23-59 7-23-59 8-07-59 7-14-60 8-04-60 7-08-61 9-19-61 7-25-62 7-20-63 9-21-63
20 3060
4 12.5 22.5 35
152 98
250 1300
5 391
0.235 36.0
.047
.147
.265
.412 1.79 1.15 9 Qd
0.053 .830 .050 .000 .033 .036 .088 .124 .125 .511 .024 .236
0.286 43.6
.057
.178
.321
.500 2.17 1.40
0. 023 .557 .008 .240 .022 .033 .425 .118
0.050 .156 .282 .439
1.90 1.23 3.13
6.025 .043 .057 .048 .128 .145 .316
7-05-62 7-30-62 7-20-63 9-21-63
8-18-58 9-13-58 5-23-59 7-23-59 8-07-59 7-14-60 8-04-60 7-08-61 9-19-61 7-25-62 7-20-63 9-21-63
20 3060
4 12.5 22.5 35
152 98
250 1300
5 391
15.3 .059
4.6
0.053 .830 .050 .000 .033 .036 .088 .124 .125 .511 .024 .236
18.6 .072
5.59
.810
.010 .175
16.3 .062
4.9
.273
.000 .234
HILLSLOPE EROSION
EROSION PLOT ON SLOPEWASH T R I B U T A R Y
To measure the rate of hillslope erosion a grid system of erosion pins was installed in 1959 on one of the slopes in the drainage area of Slopewash Tributary. The general location of this grid system, or erosion plot, is shown in figure 144, and the locality is illustrated in figure 143. The erosion plot consists of 61 nails with washers spaced on 5-foot centers on an area 50 X 50 feet having a relief of 5 feet and furrowed by two shallow and narrow rills. These rills join midway through the grid system into a single larger rill.
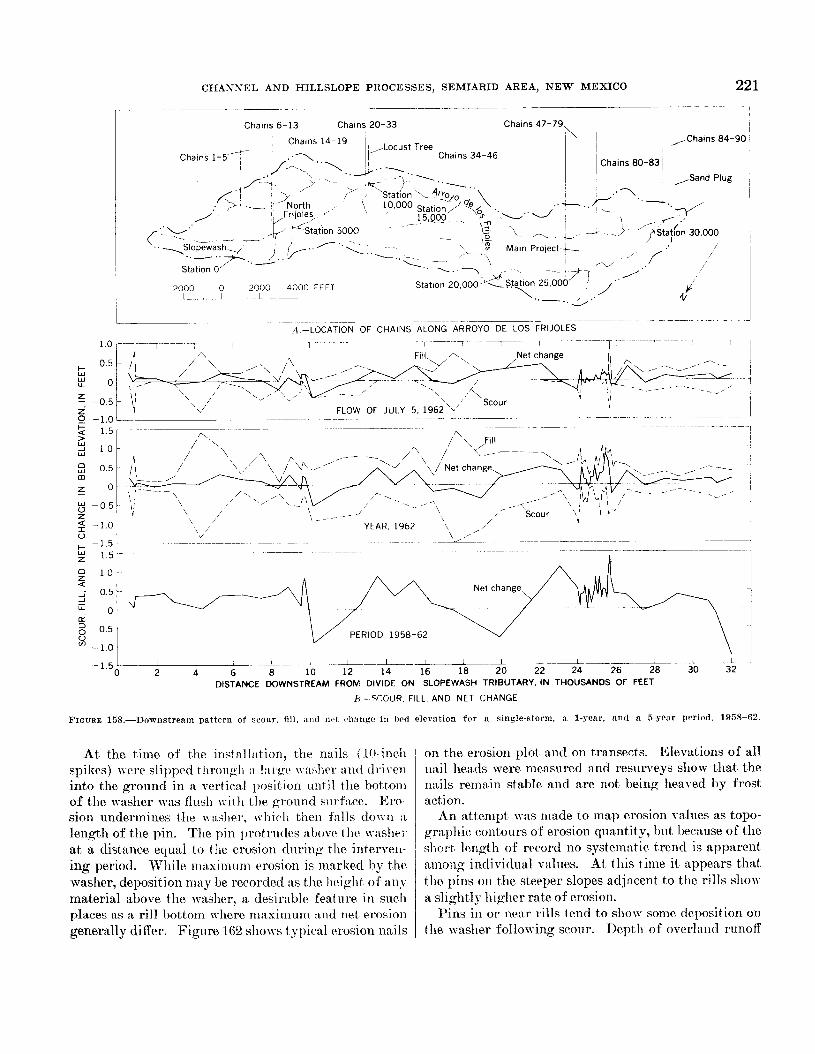
CHANNEL AND HILLSLOPE PROCESSES, SEMIARID AREA, N E W MEXICO 221
Chains 6-13 Chains 20-33 Chains 47-79
Chains 34-46
4 - 2000 0 2000 4000 FEET L 1 - 2
- - - A -LOCATION OF CHAINS ALONG ARROYO DE LOS FRIJOLES
+Chains 84-90
C S a n d Plug
:v tfon 30,000
_ _ _ _ ~ - - - - - 1
I
- . ___ - ~~- ~- ~- -~
YEAR 1962 \ I ~ _ _ . -~ -~ -- - ~
- ~~
PERIOD 1958-62
DISTANCE DOWNSTREAM FROM DIVIDE ON SLOPEWASH TRIBUTARY. IN THOUSANDS Of FEET
h-SCOUR FILL AND NET CHANGE
FIGURE 158.-Downstream pattern of scour. f i l l , and net 011:11ige i n Iwd elevation for a single-storm, a 1->ear, and a 5-gear Derlod, 1958-62
A t the time of the iiistxll:ition, tl ir nails (16 inch spikes) I\ ere s1il)prd tlii.oiigli ;I ! :II re v--n4i t~ i . : i i i ( ( di.1 \-en into the ground in n vertical position until the bottom of tlie washer \\-as flusli w i t l i the p*ound siir.i:we. Em- sion undermines the w:isIier, wliic*li then falls down A
length of the pin. Tlir l)in 1,rotriitlr.s abcii P tlie n-xshpr at a distance equal to the erosion dnring the intenell- ing period. While iii:ixiiiiiiin erosion is marked by tlie washer, deposition liiay be recorded as tlie height of any material above tlie washer, :L desirable feature in sucli places as a rill bottom where ni:mii i i i ir i i :tiid net erosion generally differ. Fignre 162 shows typical erosion nails
on the erosion plot and on transects. Elevations of all nail lieo ds were measured and resurveys show that the nails remain stable and are not being heaved by frost action.
An at1 eiiipt was made to map erosion d u e s as topo- grapliic contours of erosion quantity, but because of the s1ior.t lerigtli of record no systeirintic trend is apparent nmong individual values. At this time it appears that the pins on the steeper slopes adjacent to tlie rills show a slightly liiglier rate of erosion.
Pins in or near rills tend to sliow soiiie deposition 0x1 the washer following scour. Depth of overlnnd runoff

222 EROSION AND SEDIMENTATION IN A SEMIARID ENVIRONMENT
2'or '"'r t; 0.5 LL
6
0.02 I 0.01 i-
--- I ' 1-
0 Main Project Reach A Locust Tree Reach 8 North Frijoles Reach ~-
8
8 8
0
I
1
0.01 0.02 0.05 0.1 0.2 0.5 1 .o 2.0 5.0 10 20 50 100
DISCHARGE PER FOOT WIDTH OF CHANNEL, IN CUBIC FEET PER SECOND PER FOOT
FIGUIW 159.-Depth of scour a s a function of discharge a t chain sections; each point represents an average scour across the channel bed, based on 4-10 chains per cross-section.
is greater in such locations and it might, be that erosion occurs during maximum overland flow depth and that deposition follows as the flow subsides. n u t deposition is the exception and not the general rule. The majority of the pins show very little or no filling on top of the masher.
Erosion data have been collected in the years 1961-64. Data in 1961 included only values of erosion and later: both erosion and deposition. The average erosion dur- ing tlie 5-year period, 19.50-64, was 0.0117 f t per yr, and deposition on some of the pins averaged 0.0041 R per yr-a net average rate of erosion of 0.0076 f t per Yr.
Sunimary of data C contains data from the erosion- pin plot in Slopewash Tributary.
SLOPE-RETREAT PINS ON SLOPEWASH TRIBUTARY
Fifty-seven erosion pins are arranged on four lines transverse to the steep sides of Slopewash Tributary. Tliese pills are the i i a i l -~~i t l i -~~~as l ie r just described, and are designated as "slope-retreat pins" on the location map of figure 144. An enlarged sketch elaborating de- tails of these pins is shown in figure 168.
The pins are arranged in t h e e groups, each group consisting of two lines spaced 2 feet apart. Exch line, with pins spaced at 2-foot intervals, extends down the
steep slopes to the channel bed and, for one pair of lines, cuts across the channel and up the steep slopes on the opposite side of the tributary. The slopes range in steepness from 21 to 38 degrees, and these generalized slope angles are marked on figure 163 for identification.
The pins were installed in 1950 and erosion measure- ments were made once a year in the period 1961-64. Net values of erosion for the period are shown below the pin numbers on figure 163.
For the 57 pins, the average rate of net erosion is 0.0142 f t per yr. This figure consists of an average rate of maximum erosion of 0.0281 f t per yr and an average deposition of 0.0139 f t per yr. Individual measure- ments varied from a net deposition to an erosion of more than 0.08 f t per yr. A summary of all data from the slope-retreat lines is included in summary of data D.
Perhaps more meaningful rates of erosion could be obtained by dividing the 57 pins into 3 categories. Category 1 includes pins 1-29 of the upper line, cate- gory 2 includes pins 3 0 4 5 of the upper line, and cate- gory 3 includes the 12 pins, 46-57, in the lower line. Categories I and 3 are similar in their physiographic locations, but the pins in category 2 differ in that here apparent erosion is being disguised by channel deposits on some of the pinr ne:^ the channel edge and by an accumulation of sloughed material on some of the lower

CHANNEL AND HILLSLOPE PROCESSES, SEMIARID AREA, NEW MEXICO 223
-1 -1 - J
I 1961
1 , ,
p-=qp ____ 1958-63 , , 1 I , I - L - - L _.L I I ---LA.-
0 20 40 60 80 100 120 140 160 1 ao - 1
DISTANCE FROM LtFT BANK PIN, IN FEET
B-BED SCOUR AND NET CHANGE FOR SUCCESSIVE YEARS
FIGURD 160 -Scour and net clmngr in hecl e lwnt lon, upper chain section, Main Project Rench
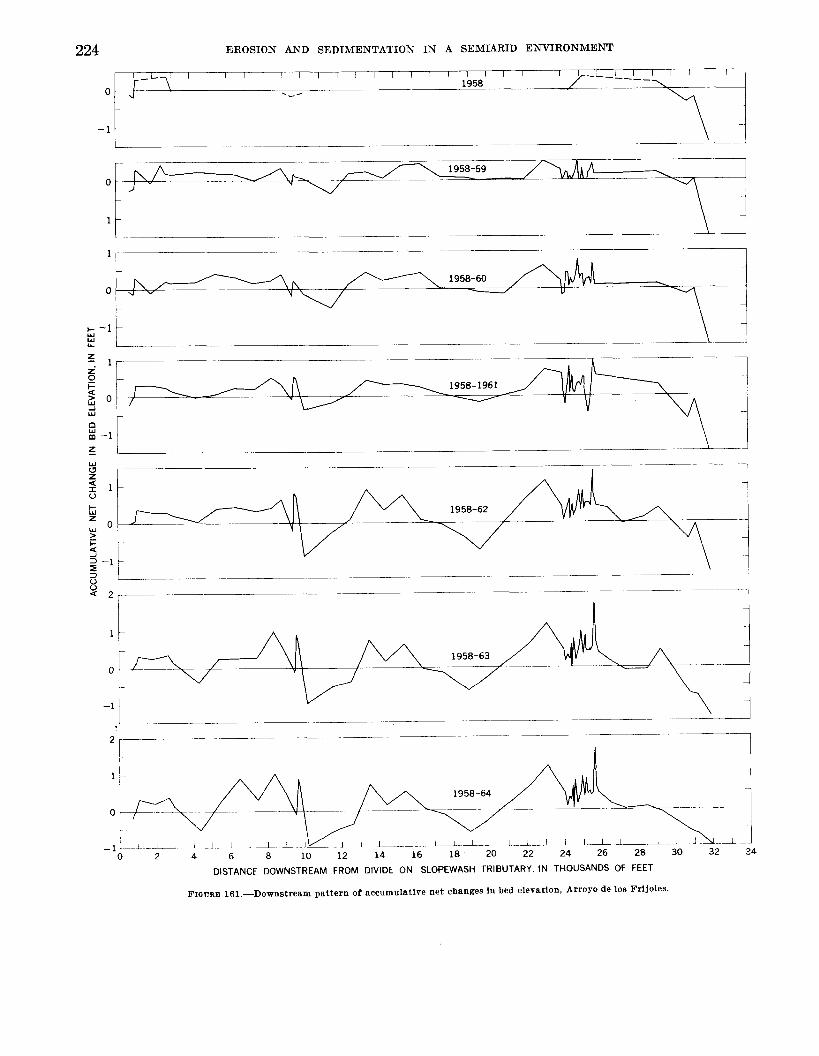
224 EROSION AND SEDIMENTATION I N A SEMIARID ENVIRONMENT
- l \ -j
0 2 4 6 8 10 12 14 16 18 20 22 24 26 28 30 32 34 DISTANCE DOWNSTREAM FROM DIVIDE ON SLOPEWASH TRIBUTARY, I N THOUSANDS OF FEET
FIGURH~ lSl.-Downstream pattern of accumulative net changes In bed elevation, Arroyo de lo8 Frijoles.
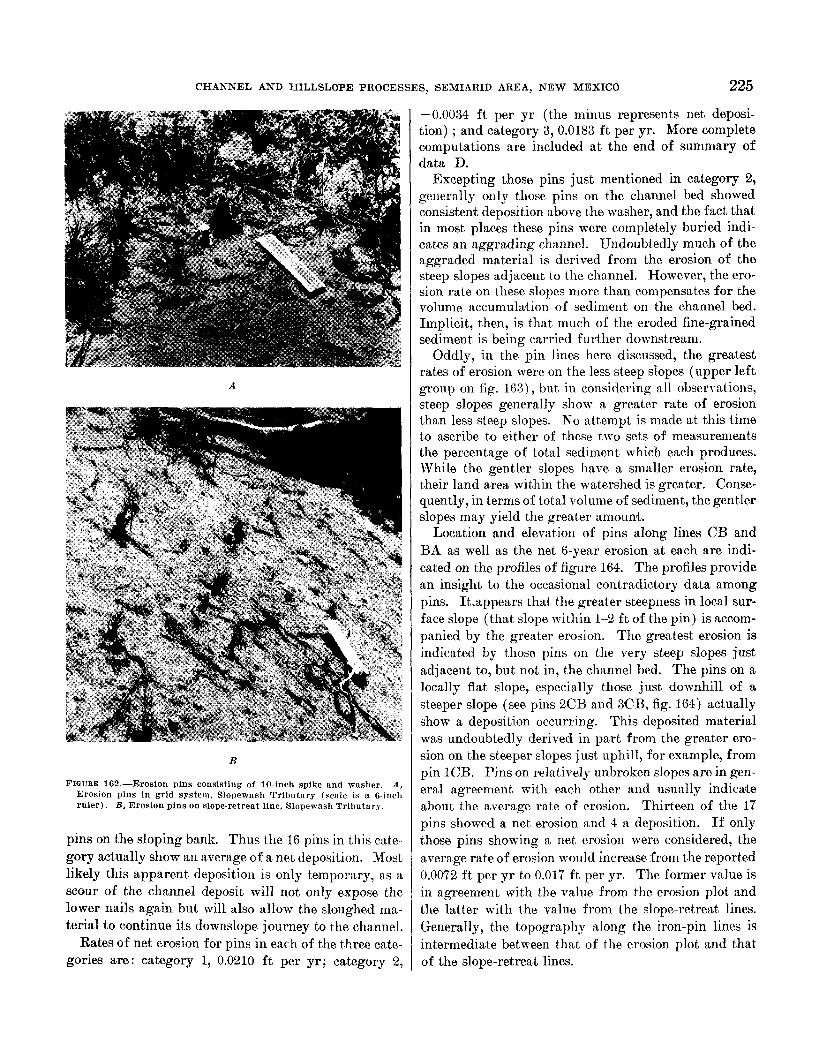
CHANNEL AND HILLSLOPE PROCES
A
B
FIGURE 162.-Erosion pins consisting of 10-inch spike and washer. A , Erosion pins in grid system, Slopewash Tributary (scale is a 6-inch ruler). B, Erosion pins on slope-retreat line, Slopewash Tributary.
pins on the sloping bank. Thus the 16 pins in this cate- gory actually show an average of a net deposition. Most likely this apparent deposition is only temporary, as a scour of the channel deposit will not only expose the lower nails again but will also allow the sloughed ma- terial to continue its downslope journey to the channel.
Rates of net erosion for pins in each of the t>hree cate- gories are: category 1, 0.0210 f t per y r ; category 2,
S, SEMIARID AREA, N E W MEXICO 225
-0.0034 f t per yr (the minus represents net deposi- tion) ; and category 3, 0.0183 f t per yr. More complete computations are included a t the end of summary of data D.
Excepting those pins just mentioned in category 2, generally only those pins on the channel bed showed consistent deposition above the washer, and the fact that in most places these pins were completely buried indi- cates an aggrading channel. Undoubtedly much of the aggraded material is derived from the erosion of the steep slopes adjacent to the channel. However, the ero- sion rate on these slopes more than compensates for the volume accumulation of sediment on the channel bed. Implicit, then, is that much of the eroded fine-grained sediment is being carried further downstream.
Oddly, in the pin lines here discussed, the greatest rates of erosion were on the less steep slopes (upper left group on fig. 163), but in considering all observations, steep slopes generally show a greater rate of erosion than less steep slopes. No attempt is made a t this time to ascribe to either of these two sets of measurements the percentage of total sediment which each produces. While the gentler slopes have a. smaller erosion rate, their land area within the watershed is greater. Conse- quently, in terms of total volume of sediment, the gentler slopes may yield the greater amount
Location and elevation of pins along lines CB and BA as well as the net 6-year erosion at each are indi- cated on the profiles of figure 164. The profiles provide an insight to the occasional contradictory data among pins. 1t.appears that the greater steepness in local sur- face slope (that slope within 1-2 f t of the pin) is accom- panied by the greater erosion. The greatest erosion is indicated by those pins on the very steep slopes just adjacent to, but not in, the channel bed. The pins on a locally flat slope, especially those just downhill of a steeper slope (see pins 2CB and 3CB, fig. 164) actually show a deposition occurring. This deposited material was undoubtedly derived in part from the greater ero- sion on the steeper slopes just uphill, for example, from pin 1CB. Pins on relatively unbroken slopes are in gen- eral agreement with each other and usually indicate about the average rate of erosion. Thirteen of the 17 pins showed a net erosion and 4 a deposition. I f only those pins showing a net erosion were considered, the average rate of erosion would increase from the reported 0.0072 f t per yr to 0.017 f t per yr. The former value is in agreement with the value from the erosion plot and the latter with the value from the slope-retreat lines. Generally, the topography along the iron-pin lines is intermediate between that of the erosion plot and that of the slope-retreat lines.

226
Pin number
EROSION AND SEDIMENTATION IN A SEMIARID ENVIRONMENT
52 53 54 55
I I
Pin number
Slope angle 26"
Note: Values of erosion are net change during 5- year period 1959-64
0 ft
L
FIOWRE 163.-Sketch map showing details of thct slope-retreat pins, Slopewash Tributary

CHANNEL AND HILLSLOPE PROCESSES, SEMIARID AREA, N E W MEXICO 227 I I I I I I I I I I I I I I
764C
I- W W U
g 7636 1- W > W 1
5 v)
$ 7632 2 W > P a Z E! 2 7628
2 1 W
7624
Pin C -0.02 f t
3 g P 5 c
1 CB 0.07 f t
- $ 2 CB -0.21 f t v)
5 CB 0.10 f t
3 CB -0.15 ft
1 U
a c s m u
u u 2 5 Pin A W 0.06 f t
Pin B 0.00 f t -
1
1 BA 3 B A
Key: 5 CB, designation of pin 0.10 ft. net erosion
I /--L I I I I ' 1 L-I--- I _ _ I I 10 20 30 40 50 60 70 I
DISTANCE FROM PIN C. IN FEET
FIGUBEI 164.-Six-year (1958-64) net erosion on iron-pin line CBA, Slopewash Tributary drainage area
OTHER MEASUREXENTS O F SLOPE EROSION ON SLOPEWASH TRIBUTARY
The second additional set of measurements for rates of erosion consists of eight iron pins located at the chain-sections below the junction on Slopewash Trib- utary (see fig. 144 for chain-section locations). These are 4-foot lengths of iron reinforcing rod, installed and observed as previously described. For each chain- section, a pin was located on each sloping bank and, for two of the sections, a pin was situated in the channel bed.
Installation was made in 1958 and data were collected in 1958-64, excepting 1961. The average rate of ero- sion for the bank pins is 0.0108 f t per yr and the bed pins indicate an average deposition of 0.0033 f t per yr. These rates are in agreement with the other observed rates for slope erosion and channel aggradation.
EROSION NAILS ON COYOTE C. ARROYO
On slopes leading into the headcut of Coyote C. Ar- royo, a total of 65 erosion pins with washers are located on 3 lines, as shown in figure 145. The pins were in- stalled in 1961 and have been remeasured yearly to 1964. Profiles were run on the pins to determine the slope, and also a resurvey of the pin elevations indicates no heaving due to either freeze-1 11aw or wet-dry actions. The nvernpe of the 65 pins indicates a yearly net erosion of O . W Y 7 foot. All the data for tlie pins are tabulated in summary of data B.
Rates of erosion for each of the three lines were con- sistent, ranging from 0.021 to 0.027 f t per yr. These values approximate the higher values for the slope- retreat pins in Slopewllsh Tributary, and i t is believed that they exceed somewhat the average rate of erosion for the entire drainage of Coyote C. Arroyo, as is evi- denced by a lower value for the grid system than for the slope-retreat lines in Slope~vash Tributary.
Attempts to correlate individual rates of erosion with individual local ground slopes did not result in a neat regression of erosion rates with lessening slopes. TO the observer on the ground, i t appears rather instinc- tive that greater erosion is occurring on the steeper slopes; however, the disparity in the data is sufficient to mask attempts to illustrate graphically the relation of slope to rate of erosion.
TRACING O F FLUORESCENT SAND
A fluorescent sand (ASTM mesh size 40) was placed along three lines in two of the study areas to trace the movement of individual fine-grained sediment. One line was along the hillcrest of Morning Walk Wash (see fig. 139). The other two lines were in Coyote C. Ar- royo, one along the nail line ED and the other along the mass-movement line (see fig. 145).
The sand was placed in 1961 and the initial position mas marked. I n 1962 the movement of this sand was determined by searching for grains a t night with a black light. Despite a relatively large amount of ero- sion indicated by the erosion nails, the individual sand
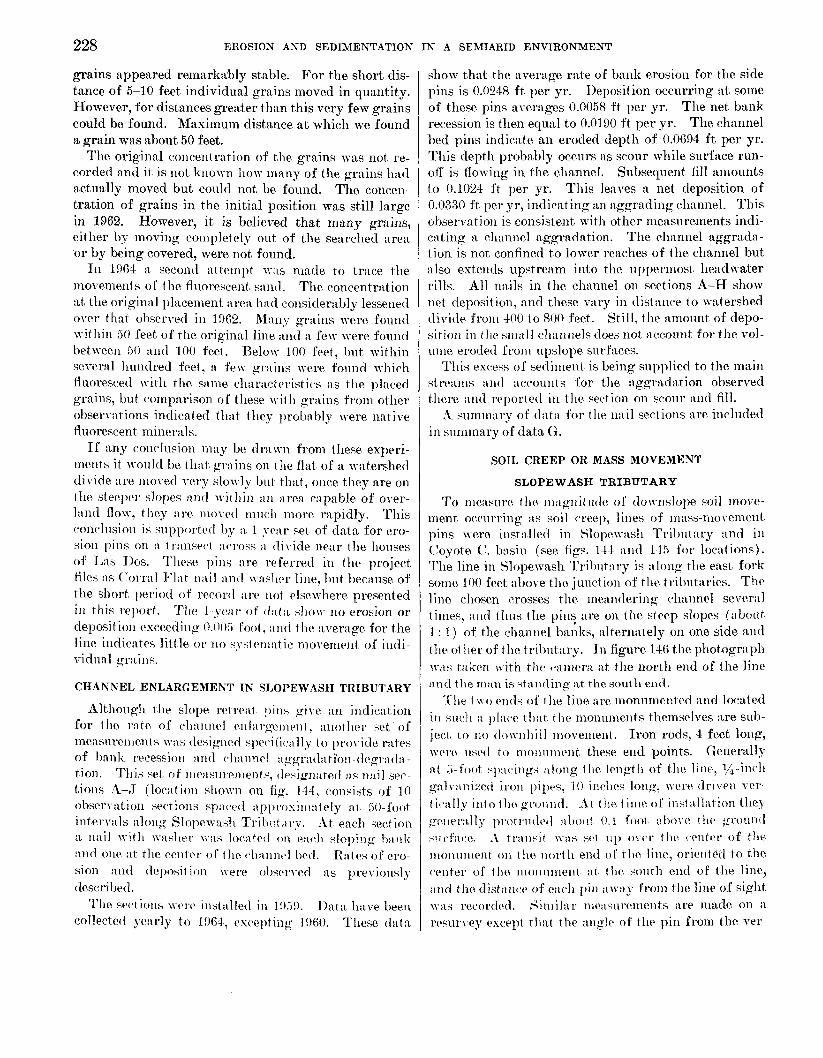
228 EROSION AND SEDIMENTATION IN A SEMIARID ENVIRONMENT
grains appeared remarlrably stable. Fo r the short dis- tance of 5-10 feet individual grains moved in quantity. However, for distances greater than this very few grains could be found. Maximum distance a t which we found B grain was about 50 feet.
The origiiial concentration of tlie grains was not re- corded and it is iiot known I i o ~ nixiiy of the grains had actually moved but could not be found. The concen- tration of grains in the initial position was still large in 1962. However, i t is believed that many grains, either by nioving completely out of the searched area or by being covered, were not found.
In 1964 :I second :ittempt n ~ s mnde to trace the movements of the fluorewent smtl. The concentration at the original p1:icement t ~ r e i ~ h:id coiisidernbly lessened over that observed in 1962. hf:iiiy grniiis were fouiid n itliiii 50 feet of the originnl line :ind :I few \I ere found between 50 niit l 100 feet. Belo\\ 100 feet, but within serer:tl liuiidrecl feet , :I few grains were fonncl which fluoresced wit11 tlie siiiiie characteristic~s as the p1:iced grains, but comparison of tliese 11 i t l i grains froni other observat ions intlicatetl tliat tliey l)rob:ihly were native fluorescent minerals.
If any conclusioii may be dr:iwi froin these experi- iiwits it uoiiI(1 be that grains on the flat of a \\-atershed divide are iiiovecl very sIo\\ ly but that, once they are on ilie sierpri- slope5 ant1 JI i t l i i i i :in :ires capable of over- 1:iiitl flow, they ai^ i i i o i et1 nii~c~li more rapidly. This t~onclusioii IS supported by :i I -year set of data for ero- sion pins on n t r : u i v ( b t :irro\s a tl i \ icle near the Iiouses of L n s Ths. 'I'liese pini :we referred in the project files :IS Corral Fl:it nail ant1 \\ :ishc.r line, Init because of the short period of rccortl :ti.(' iiot clwwhere presented i n this re1)ort. 7'1iri 1 yt1:ir o f t l : i t i L ilion- no erosion or deposition cxceediiip 0.005 I'oot, and the average for the 1 i ne indica t e5 1 it t le or iio \yht ('11 I :it ic movement of indi - vidual gr:Lins.
CHANNEL ENLARGEMENT IN SLOPEWASH TRIBUTARY
Altliougli tlie slope ret reat ! ) i i i i gt \ c :til iiiclir-:ition for the rate of chnniit.l ciilnrgctiic~tit, anotlier i c t of rnensureiiienti W:I\ tlesigiietl spevifit~:IIi.y to pro\ ide rates of bank recession aiid c.li:iiiiicl a~~ratlriti'oli-dc,rrr:rtl:i- tion. This set o f iii~':i~iti,t~l~leiiti, tlpiipriintetl :I\ n:~jl 5 e ~ tioiis A\-,J (locatioii \liowii on fig. 1-14, consists of 10 ohsen :ition \ec*tioiis \p:~(wl apl)i*o~iii~:itely :it 50-f'oot intervals along Slope\vaih Trilnit ~ r y . each wcf ion :I nail 1) i t l r n:i4itLr 1% : is 1t)c~ntct l on w v l i slpiping l \ , i t ik :ind oil(' :it the ceiitci. of tlic cliniincl I)pcl. R:ltcs of pro- sioii :tiid tlqm5it ion \\ ere ol)srr\ ed :is previonsly tlescrild.
1)atn have beeii col!ectrtl yrnrly to 1!)64, excepting 1 !%O. These datn
The w(.t ions \\ eiv iiist:illetl i n I!)::).
show that the average rate of bnnk erosion for the side pins is 0.0248 ft per yr. Deposition occurring at some of these pins averages 0.0058 ft 1)er yr. The net bank recession is then equal to 0.01%) ft per yr. The channel bed pins indicate an eroded depth of 0.0694 f t per yr. This depth probably occurs :LS scour while surface run- off is flowing in the channel. Subsequent fil l amounts to 0.1024 It per yr. This leaves a net deposition of 0.0330 ft per yr, indicating :in :Lggradiiig clianiiel. This observation is consistent with other mensiireinents indi- cntiiig a clianiiel aggradation. The channel aggradn- tion is not confined to lower reaches of tlie channel but also extends upstrenm into the uppermost headwater rills. All nails in the channel on sections A-H show net deposition, and these vary in distance to watershed clivitlr from 400 to 800 feet. Still, the :miount of depo- sitioii in t he snitill chniiiiels does not account for the vol- iiiiie eroded from upslope surfaces.
This excess of setlinieiit is being supplied to the main streaiirs :inti accounts for the :ggrndwtion observed there x i i d rcportetl in tlie sertion 011 scoiir :uid fill. ,\ sumiiiary of (lata for tlie iinil sections are iiicluded
in summary of data G.
SOIL CREEP OR MASS MOVEMENT
SLOPEWASH TRIBUTARY
To measure t l i e iii:igiiit i i t l c of don nilope soil iiiove- ment occurring :is soil creep, lilies of iiiass-movement pins \\-ere iiistnlletl in Slope\vasll Tribiit :iry :ind in Coyote C. hnsin (see figs. 1-1-4 ;ind 145 for locations). The line in Slopewash Tributary is along the east fork sonie 100 feet above the junction of t l i c tril)ntaries. Thr liiio chosen crosses the iiwnntleriiig c1i:iiinel several titiiec, :ind thus the pins are on the steep slopes (abotlt 1 : I ) of the c>haniieI banks, alternately on one side :~nd tho otl)er of the tributnry. In figure 146 the photogrnpli w i s laken with tlie (miier;L at the north end of the line L ~ r ~ c t tlie r i i i t i i is i tati t l ing at the south end.
Tlie t \ io c r i t l s o f t l i c line are iiionunieiitecl ant1 located i n surIi :L plaw tli : i t tIic tnoiiuiiielits themselves :we sub- ject to no t l o w i i l i i l l tiiovenient. Iron rods, 4-feet long, w ~ r o i i w l t o nioiiiiiiimt these end points. Generally :it s-ff>ot ~ I x i t ~ i i i p :iIong the IengtIi of thc l i i iv , ~~z - ine l i gal\ :iiiize(l iroii l)il)w, 10 iiicalies long, \\-err d r i ~ ~ her-
timlly into 1110 grt)iiiicl. *It tiit. t i i i i t h o i ilistallntion t h y
- i ~ i . P ~ w . .I traiicit n : i h wt 111' o\,vr the c-eiitl>r of :lit.
n1oi iui i ie i i t 011 tlie north end of t lie line, orietitcil to the (,enter of the tiioiiunient :it t lie soiith end of tlie line, : i i i d the distiinw of ewIi p in awty froni the line of sight was recorclrtl. Siiiiilnr iiie:iiiirCiiieiits :ire made 011 :I
resur\-py except tlint tlir :ing!e of tlic pin froin the ~ e r -
K P l l r K i l l y I)l.ot t.i1(1tl(1 :Il)ol1i 0.i f00i : L k ) o i c t lie xt.ot1litl
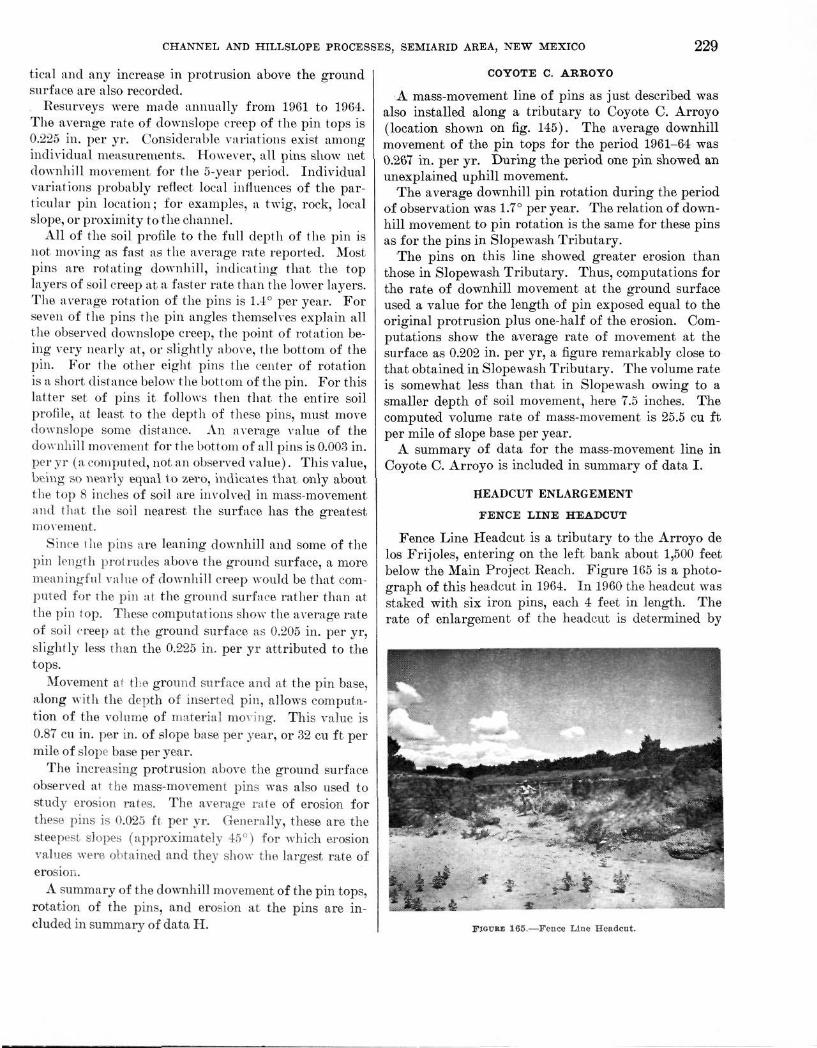
CHANNEL AND HILLSLOPE PROCESSES, SEMIARID AREA, NEW MEXICO 229
ticul and any increase in protrusion above the ground surface are also recorded.
Resurveys were made annually from 1961 to 1904. The average rate of downslope creep of the pin tops is 0.225 in. per yr. Considerable variations exist among individual measurements. However, all pins show net downhill movement for the 5-year period. Individual variations probably reflect local influences of the particular pin location; for examples, a twig, rock, local slope, or proximity to the channel.
All of the soil profile to the full depth of the pin is not moving as fast as the average rate reported. Most pins are rotating downhill, indicating that the top layers of soil creep at a faster rate than the lower layers. The average rotation of the pins is 1.4° per year. For seven of the pins the pin angles themselves explain all the observed downslope creep, the point of rotation being very nearly at, or slightly above, the bottom of the pin. For the other eight pins the center of rotation is a short distance below the bottom of the pin. For this latter set of pins it follows then that the entire soil profile, at least to the depth of these pins, must move downslope some distance. An average value of the downhill movement for the bottom of all pins is 0.003 in. per yr (a computed, not an observed value). This value, being so nearly equal to zero, indicates that only about the top 8 inches of soil are involved in mass-movement and that the soil nearest the surface has the greatest movement.
Since the pins are leaning downhill and some of the pin length protrudes above the ground surface, a more meaningful value of downhill creep would be that computed for ihe pin at the ground surface rather than at the pin top. These computations show the average rate of soil creep at the ground surface as 0.205 in. per yr, slightly less than the 0.225 in. per yr attributed to the tops.
Movement al the ground surface and at the pin base, along with the depth of inserted pin, allows computation of the volume of material moving. This value is 0.87 cu in. per in. of slope base per year, or 32 cu ft per mile of slope base per year.
The increasing protrusion above the ground surface observed at the mass-movement pins was also used to study erosion rates. The average rate of erosion for these pins is 0.025 ft per yr. Generally, these are the steepest, slopes (approximately 45°) for which erosion values were, obtained and they show the largest rate of erosion.
A summary of the downhill movement of the pin tops, rotation of the pins, and erosion at the pins are included in summary of data H.
COYOTE C. ARROYO
A mass-movement line of pins as just described was also installed along a tributary to Coyote C. Arroyo (location shown on fig. 145). The average downhill movement of the pin tops for the period 1961-64 was 0.267 in. per yr. During the period one pin showed an unexplained uphill movement.
The average downhill pin rotation during the period of observation was 1.7° per year. The relation of downhill movement to pin rotation is the same for these pins as for the pins in Slopewash Tributary.
The pins on this line showed greater erosion than those in Slopewash Tributary. Thus, computations for the rate of downhill movement at the ground surface used a value for the length of pin exposed equal to the original protrusion plus one-half of the erosion. Computations show the average rate of movement at the surface as 0.202 in. per yr, a figure remarkably close to that obtained in Slopewash Tributary. The volume rate is somewhat less than that in Slopewash owing to a smaller depth of soil movement, here 7.5 inches. The computed volume rate of mass-movement is 25.5 cu ft per mile of slope base per year.
A summary of data for the mass-movement line in Coyote C. Arroyo is included in summary of data I .
HEADCUT ENLARGEMENT
F E N C E L I N E H E A D C U T
Fence Line Headcut is a tributary to the Arroyo de los Frijoles, entering on the left bank about 1,500 feet below the Main Project Reach. Figure 165 is a photograph of this headcut in 1964. In 1960 the headcut was staked with six iron pins, each 4 feet in length. The rate of enlargement of the headcut is determined by
FlouBE 165.—Fence Line Headcut .
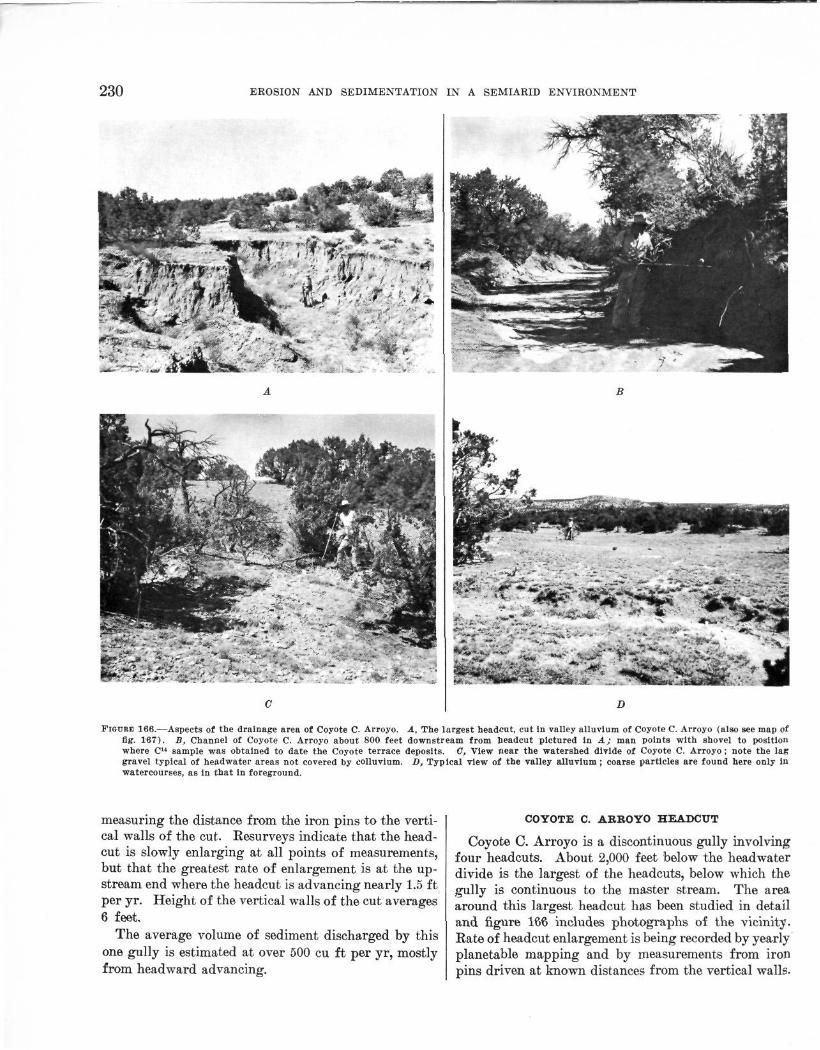
230 EROSION AND SEDIMENTATION IN A SEMIARID ENVIRONMENT
. - •
-- :.V e%»- *£>
0
• - ; rf—
B
****** _ « A I , - * * * » • *
*
D
FIGURE 166.—Aspects of the drainage area of Coyote C. Arroyo. A, The largest headcut, cut in valley alluvium of Coyote C. Arroyo (also see map of fig. 167). B, Channel of Coyote C. Arroyo about 800 feet downstream from headcut pictured in A; man points with shovel to position where Cu sample was obtained to date the Coyote terrace deposits. 0, View near the watershed divide of Coyote C. Arroyo; note the lag gravel typical of headwater areas not covered by eolluvium. D, Typical view of the valley alluvium; coarse particles are found here only in watercourses, as in that in foreground.
measuring the distance from the iron pins to the vertical walls of the cut. Resurveys indicate that the head-cut is slowly enlarging at all points of measurements, but that the greatest rate of enlargement is at the upstream end where the headcut is advancing nearly 1.5 ft per yr. Height of the vertical walls of the cut averages 6 feet.
The average volume of sediment discharged by this one gully is estimated at over 500 cu ft per yr, mostly from headward advancing.
COYOTE C. ARROYO HEADCUT
Coyote C. Arroyo is a discontinuous gully involving four headcuts. About 2,000 feet below the headwater divide is the largest of the headcuts, below which the gully is continuous to the master stream. The area around this largest headcut has been studied in detail and figure 166 includes photographs of the vicinity. Rate of headcut enlargement is being recorded by yearly planetable mapping and by measurements from iron pins driven at known distances from the vertical walls.

CHAKNEL AND HILLSLOPE PROCESSES, SEMIARID AREA, N E W MEXICO 231
25 0 2 5 50 7 5 100 FELT
CHANNEL STATIONING UPSTREAM, IN FEET
FIGURE 167.-Topographic map and profile of Coyote C. Arroyo headcut.
The planetable map of 1962 is shown in figure 16'7 and, as a dashed line, the outline of the headcut as it appeared the previous year. Most of the headcut has retreated some and the greatest amount of retreat is recorded in extremities which extend either up the primary direc- tion of the channel or in the direction of tributary swales. Measurements from the pins to the cut, bank indicate a lateral retreat of 0.4 f t per yr and a retreat at the most headward extreme of 2.6 f t per yr. Thus, while the map of figure 167 provides some insights about
headcut retreat, mapping is not sufficiently accurate to delineate the relatively minute retreats which are oc- curring.
The initial 400 feet of channel profile is shown below the headcut map to provide an indication of channel slope and the sloughed material associated with the headcut. The average slope of the channel here is 0.03 f t per f t compared to 0.02 f t per f t in the channel 1,000 feet downstream. The volume of material contributed to the stream by the enlargement of this headcut has

232 EROSION AND SEDIMENTATION IN A SEMIARID ENVIRONMENT
been computed to be 1,650 cu ft per yr for the period 1961-64.
MOVEMENT OF LARGE PARTICLES IN HEADWATER RILLS
SLOPEWASH TRIBUTARY Two of the channels that have been studied in detail
with respect to movement of individual rocks, Green Rock Gulch and Little Green Rock Gulch, are shown in figure 144. The former is also illustrated in figure 168. Starting at or near the mouth of these two channels individual rocks, each 3-6 inches in diameter, were completely painted. They were then replaced in the rills at measured distances from the mouth. This distance, in feet, was painted on each rock for identification and the total number of rocks at each distance was recorded. A total of 250 rocks was painted in Green Rock Gulch and placed at distances of 1-47 feet upstream of the mouth. Forty rocks were painted in Little Green Rock Gulch and placed from 21 to 36 feet upstream of the mouth.
The initial placement was in 1959 and resurveys were made annually. At the time of the resurveys the movements of the individual rocks were easily discernible because identification numbers on the painted rocks were no longer in consecutive order nor at the distance corresponding to their number.
Although the number of rocks moving has not been large, the recovery percentage is high. In 1964, 5 years after placement, 88 and 78 percent respectively of the rocks in the two gulches are still accounted for. Missing rocks are usually those that moved but later were obscured by either vegetation or a sand covering, that is, they were not buried in place. This is suggested by some of the rocks in the main study which were re-
FIGDRE 168.—Green Rock Gulch, a tributary to Slopewash Tributary. Rocks wash Into this minor rill from the lag gravel covering some of the hillslopes seen in the background.
ported as missing in a given flow but were found after a subsequent flow.
The data have not been sufficient to describe a trend in movement. Both the upper and the lower halves of the reach on Green Rock Gulch show about 25 percent of their rocks moving or missing. Because of the large number of rocks not moving and the large variability in distance of those moving, the data are perhaps not yet meaningful. However, the longest distances recorded to date are of rocks originally placed in the lower 10 feet of channel and these have moved as much as 540 feet.
GUNSHOT ARROYO
Gunshot Arroyo is the first tributary entering Arroyo de los Frijoles below the sweeping S-curve half-mile downstream of the Main Project Reach. Measurements in Gunshot Arro}'o include the tracing of large particle movements in the channel bed and on a steep sloping bank of the channel, the retreat of a knickpoint formed in the channel by an outcropping of semiresistant Santa Fe formation, channel enlargement, and degradation-aggradation studies.
In 1960 the initial survey and installations included the selection, painting, and replacing of rocks in the channel. The rocks, ranging in diameter from about 3 to 10 inches, were completely painted and numbered with the distance in feet corresponding to the initial position upstream of the junction with Arroyo de los Frijoles. The largest number is 880 and the watershed divide is located at station 1,150 feet. The rocks were placed at 10-foot intervals.
In 1962 a complete resurvey was made of the existing measurements and a longitudinal-profile survey was run from 150 feet below the mouth of the arroyo to and over the watershed divide. This profile is shown on figure 1G!). No vert ical or cut banks were observed above. station 620 feet and the channel disappeared above station 1,050 feet.
Superposed on the profile of figure 169 is a schematic illustration of the rock movements as recorded in 1962. Each rock position is identified as to moving, missing, or stationary. For those rocks which were found, the distance moved in feet is indicated by the number above the original position of the rock.
Most rocks below station 750 feet moved. Downstream from station 750 feet to station 450 feet, most of the moving rocks were found. Below station 450 feet a large percentage of the rocks were reported missing. The upper of the two mentioned subreaches has a gravel bed and the lower a sand bed. In the lower reaches of the channel most rocks that had moved were found partly buried in sand and, with few exceptions, those which had traversed the length of the tributary

C H A N N E L AND HILLSLOPE PROCESSES, SEMIARID AREA, NEW M E X I C O
1
r) P 3
3
233
8
0 2 y r. W
N r. W 0 m r. W
0 d r. W
0 ul r. W
0 W I-. W
? 0 0
r. r. W W
r. W
m m 0 0 W m
1333 NI '13A31 V3S NV3W 3AOEV NOl lVA313

234 EROSION AND SEDIMENTATION IN A SEMIARID ENVIRONMENT
South gully South
Particles rill L U Totalor
average __ Total originally placed _ _ _ _ _ _ _ _ _ _ _ _ _ _ _ _ _ _ _ _ _ _ _ 44 43 87 12 Percent moving, on basis of:
Total found __________.________.________ 41 40 40 25 Total found plus total missing- ___._______ 93 63 78 25
Percent not moving or not found _ _ _ - _ _ _ _ _ _ _ _ _ _ 48 77 62 100
A v e r a g e _ _ _ _ _ _ _ _ _ _ _ . _ _ _ _ _ _ _ _ _ _ _ _ _ _ _ _ _ _ _ _ 177 339 258 211 Distance moved, in feet, on basis of total found:
Maximum ______..____._________________ 473 723 _ _ _ _ _ _ _ _ 613
and into the channel of Arroyo de 10s Frijoles mere not found. The rocks above station 750 feet were consistent in that none had moved despite the fact that these were on the steepest slopes.
A t the time of the 1962 survey the rocks moving and found averaged a transport distance of 39 feet; the maximum distance recorded was 120 feet. I f considera- tion were given to the niissing rocks, which probably were transported eiitirely out of the tributary, these distances would be considerably increased. Of the rocks originally placed, 37 percent were missing and 22 per- cent, had not moved.
,\fter tlie 1962 survey tlie rocks found were returned to their original position, but the missing positions were not, filled. Resurveys in 1063 ;uid 1964 of these remain- ing rocks recovered oiily one rock reported missing in 1962. This ;tdds credence to the probability that miss- ing rocks were transported entirely out of the tributary.
I n 1963 the number of total missing rocks increased to 82 per cent, aiid all but 2 of the 55 rocks remaining after the 1962 survey liatl moved. Of the;e 11 were found and averaged a transport distance of 218 feet and R maximum distance of 930 feet. The large increase in percentage of missing rocks is prol):ibly attributable to the storm which caused :L 1,300 cfs flow :it Main Project and which occurred between the surveys of 1962 and 1963. Most, rocks renittining for the latter survey were from upsti*enm positions :ind 11ntl longer distances to travel before being exposed to the greater chance of loss in the main channel. By 1964 the number of niiss- ing rocks had increased to 85 per cent.
Paintetl rocks on a typical steep slope (approximately 45") at station 190 feet were resurveyed in 1962, 1963, and 1964. The rocks painted were native to the slops and generally ranged in interinedinte-axis diameter from 1 to 3 inches. On an uncounted number of rocks painted in 1960, 175 remained in 1962 and 164 remained in 1964. Thus, in the last 2 years only 6 per cent have
North gully
L U Totalor average
--- 34 33 67
77 12 45 91 30 61
_ _ _ _ _ _ _ _ _ - _ _ - - - - - - - -
_ _ _ _ _ _ _ _ _ _ _ _ _ - - - - - - - - - - - - - - - - - - - - - - - - - - -
moved off the slope aiid lmve become lost in the channel. I3etween ;tnnunl silrveys :tn average of only 3 per cent of the rocks (excluding those missing) moved over one foot, but a grnclual slumping wts noticeable. I n 1964, 118 rocks (72 per cent) had slumped downhill a meas- urable amount, aiid this slumping averaged 0.6 foot for the 4-year period. It appears that the effects of gravity, aided by such processes :is freeze-thaw and wet-dry, have an appreciable influence on coarse particles on steep slopes.
Tho monumeiited knickpoint in t lie Santa F e forma- tion :tt station 417 feet averages about 1.3 feet in height, and between 1060 and 1064 no measurable amount of upstream retreat was recorded.
Scour chains placed in the arroyo bed a t station 25 feet, 230 feet, aiid 468 feet indicate the channel is ag- grading a t R rate of 0.06 f t per y r for the %year period 1962-64. Although this is a short-term record, the value is in agreement with that of the main arroyo, 0.04 f t per Yr*
MORNING WALK WASH
I n 1961, painted rorks were placed a t 10-foot intervals in the channel of Morning Walk Wash near Las nos (fig. 139). The painted rocks mnged in diameter from 3 to 5 inches, the average rock size native to the gullies. A total of 166 such rocks were placed along the thalwegs of the two main channels and a smaller rill draining the hillslope.
A resurvey in 1962 indicated a very large percentage of therocks had moved. Table 5 is a condensed presen- tation of the rock movements between 1961 and 1962. For example, in the nortli g d l y three times as many rocks had moved in the lower reaches than in the upper reaches and the rocks in tlie lower reaches tended to move greater distances. Many of the rocks were found in a fan deposit at tlie mouth of the channel.
As in Gunshot Arroyo the rocks found during the
Lower reach.

CHANNEL AND HILLSLOPE PROCESSES, SEMIARID AREA, NEW MEXICO 235
survey were returned to their original position to n i w i t movement during subseqnent flows, but the missing posi- tions were not filled with new rocks. Thus data after 1962 became less meaningful except to determine the depletion rate of the originally placed rocks. I>nta for oiie of the painted rock experinleiits in 1ie:tdw:iter c-lian- nels are included in suniiii:1ry of (lata ,J for 1961-64.
The condition of the pailit on the rocks found intli- cates that the rocks are transported wi th only little abrasive nction, that is, they are not broken up in place and removed as smaller particles, this despite the rolling and tum1)ling over other roclis in their trip downstream.
Two monumented cross sections of the channels were installed in 1961 and resurveyed yearly to 1964. Dur- ing this period the upper section, 170 feet above channel mouth, showed no significant changes, while the lower section at the mouth showed about 0.2 foot of deposi- tion in each channel bed. This value is consistent with other observations for channel aggradation.
SEDIMENTATION IN CHANNELS AND RESERVOIRS
About 1937, a t the lower end of Coyote C. Arroyo some 1,900 feet downstream of the present position of
tlie largest l~eadcut, an earth dam was constructed across the arroyo. I n 1961 the reservoir behind the dam was topographically mapped by planetable, and i t was plniiiied that resurveys would :~llow the deterniination of the amount of fill accumulating within the reservoir. Contours of equal deposition occurring during 1961-62, as well as original topography, are shown in figure 170.
Computations determining the volume amount of sed- iment collected in the reservoir during the period 1961- 64 are shown in table 6. This amount totals 6,245 cu f t or 2,082 cu f t per yr. If the average rate of erosion shown by the erosion nails is assumed as a basin-wide average, the reservoir is shown to collect only about 5 percent of the total eroded sediment. However, the computation of this percentage may be of only academic interest because, as was remarked previously, values of the erosion rate computed from the pins installed in this basin are believed to be too large for the basin as a whole. Most of the sedimentation was in the year
The field-sketch map of figure 145 shows six channel cross sections at. Yarious distances up the arroyo. These cross sections were first surveyed in 1961; they have
1961-62.
/ I
,/’
25 0 25 50 75 100 FEET <--.-- .&L-.~-._i~~- . .----~ - ~ J
CONTOUR INTERVAL TOPOGRAPHY. 1 FOOT
DEPOSITION: 0.25 FOOT
P’IQuRe 170.-Topography of dam and reservoir on Coyote C. Arroyo and contours of depoaltion. 1901-02.

236 EROSION AND SEDLMENTATION IN A SEMIARID ENVIRONMENT
Effectlve area o l
reservoir (SQ ft)
TABLE 6.-Observed sedimentation in reservoir behind dam on Coyote C. Arroyo, 1961-64
Amount of sedimentation 1 (cu It)
1961-62 I 1861-63 I 196144
Average depth of deposition (It)
I I I I
Decrease in area of cross section due to deposition (sq ft)
Cross section 1 End pins I I I
1961-63 .____
10.0 26.2 38.0 50.5 68.0 8.5
44.5
1 .................... Z... ................. 3 .................... 4 .................... 5 .................... 6 .................... 7 ....................
Effective width of section
(ft)
30 43 53 55 60 35 40
BM 2 4 BM 2-5 B M 2 4
1-5 1 4 1-3 1-2
1961-62 1 1961-63 1 19614%
Change in channel shape (+, deposition; -, scour;
(59 f t ) Length
of reach
1961-62
10.0 28.3 29.0 30.5 34.0 15.5 51.5
1961-64
+28.25 +11.00 +14. 75
. 00 + l . 10 f . 50
(ft)
120 165 225 290 395 240
1961434
10.4 24.3 39.0 55.5 73.0 14.5 39.5
0.35 .56 .74
1.01 1.22 .42 .w
1, coo 330 825 1 445 900 500 Q13 505
330 505 650 840
1,620 445
1,485
350 460 665 820
1,750 775
1.325
0.33 .61 .72 .92
1. 13 .24
1.11
0.33 .54 .55 .55 .57 .44
1.29
~~~
1,436 820 1,850 --- 1 815 1,336 1,725
1 Amount of sediment contributed from basin (40.8 acres):
2082 ____- 40.8X43,560 o'0012 ft per yr
and flats which may be considered as natural reser- voirs; at least, sedimentation rather than erosion is oc- curring in these areas.
ANALYSIS OF SEDIMENT BUDGET
To account for sediment volumes contributed by ero- sion and to compile a balance sheet is not easy, because of the variance within the measurement data. With re- gard to what appears to be the main process contribut- ing debris (sheet or surface erosion), the problem is how to average the rates observed by the nail and washer data a t various localities and derive a figure applicable to the whole contributing area, To use the data on vol- umes contributed by headcuts presents little problem because there are only a few headcuts per square mile in the study area. Bank cutting and consequent channel enlargement is not an important source of sediment, as indicated by measured cross sections of channels. The data on mass-movement pins present LZ special problem because, lacking knowledge of certain details of the
been resurveyed yearly to 1964 and allow computation of deposition in the channel. Stationing and channel changes are summarized in table 7. The volume ac- cumulations of sediment in the 1,435-foot reach in- cluded by the sections are also shown in the table. These data indicate that 3,102 CII f t per y r of sediment is deposited in this reach, which corresponds to channel aggradation of about 0.10 f t per yr. This value repre- sents about 8 percent of the total eroded sediment incli- cated by the erosion pins.
The percentages of total eroded sediment accounted for by the surveys in the reservoir and in the lower rrach of r.lianne1 are not total reservoir and channel storage of sediment for the entire basin. Our studies have indicated that even headwater rills are aggrading, thus there is much more c*hannel length in the basin avni1,zble for sedimentation processes. Although the surveyed reservoir is the only m:m-built, barrier, other natural reservoirs :ire :~lso :ivxilable. The discontin- uous nature of the channels provides niany alluvial fans
TABLE 7.-Observed rates of channel changes in Coyote C. Arroyo
Volume of sediment 1 (cu f t ) Channel stationing
(ft)
30 210 365 65 0 955
1,435
Section
1961-63 1961-64 1961-62 1961-62
+30. 75 +8. 75
+16. 75 -2 .70 +. 70 -1 .30
1961-63
+29. 00 +lo . 00 $14. 10
-. 50 +. 80 -. 25
3,690 1,445 3,770 - 785
265 -310
3 ,480 2 ,100 3 ,180 - 145
315 - 60
3,390 2 ,310 3,320
0 435 120
8,075 8,075
8 ,870 4,435
9,575 3, 192
1 Amount of sediment contributed from basin (40.8 acres):
3192 8x43,560-0. 0018 ft per yr

C H A N N E L A N D H I L L S L O P E P R O C E S S E S , S E M I A R I D A R E A , NEW M E X I C O 237
process, the total area subject to effective sediment con- tribution from this source is difficult to estimate.
No great problem is presented by channel aggrada- tion, for these measurements are fa r more complete than for other processes. Two important sources of pos- sible error remain-the unnieasured volume of debris passing out of the basin as beclload or suspended loacl, and the trap efficiency of the reservoirs.
These difficulties face m y investigator who is con- structing a sediment budget. No perfect solution is available, but a t least the assumptions made in the com- putations can be stated ancl the implications of the as- sumptions can be annlysed. Although the quantities are only roughly approximate, a summary of debris inflow, outflow, ancl storage is attempted. Table 8 summarizes the average values of the mensurement quantities. These values are arithmetic averages of individual read- ings taken over the period of measurement at the re- spective measurement points. Because comparison of mean and median values shoms no great disparity, we used mean values exclusively in this report.
Tht~ innin ai;snmptioilc; enter the computatioi~s i n pro- gressing from averafe-measnreinent clata, tnblo 8, to computations of average rates of erosion and deposition summarized in table 9.
The main source of data on sheet erosion is the pin- and-washer installations. More variance is noted be- tween successive years than among the respective pins in the same year. Within a given group of nails the mean rate of erosion for the 3-year period was plotted by individual pins against the local ground surface slope at the pin, but no correlation was found. This lack of correlation is attributed to the fact that each group of nails applied to only a small range of slope values. Sorne infliience of slope prol)nbly can be seen in the comparison of values of surface erosion in table 8. For example, the average land slope on the erosion plot of Slopewash Tributary is less than on the nail lines of Coyote C., and the corresponding net erosion rates are 0.008 and 0.024 ft per y r respectively.
But i t appeared unjustifiable to correlate these net erosion values for different localities merely with slope because many other factors probably :ire also operative. The significance could not be tested statistically with only seven localities.
The average value of surface erosion for the whole basin (0.015 f t per y r ; see table 9) represents our best judgment of the order of magnitude. This value is in agreement with the result obtained by equal weighting of number of pins and number of years of data, 0.0145.
Two values of volume eroded by headcut retreat are available. Approximately the average of these two wa!:
TABLE %-Data on measured ra tes of c,rosioiz and deposi t ion
[SWT, Slopewash Tributary]
Erosion Surface erosion :
Erosion plot, SWT : 61 5
0. 008
57 5
0.014
65 3
0.024
20 5
0.019
15 5
0.025
19 6
0. 007
8 6
0.011
3
0.4 2. 6
1,650
4
0.15 1. 5 500
15 5
0.206
32
12 3
0. 202
25
99 3 75 190

238 EROSION AND SEDIMENTATION
TABLE &-Data on meastired rates o f erosion and deposition- Continued
Erosion-Continued
- -
Movement of individual rocks-Continued Morning Walk Tributary--<:ontinued
North Gully : Rocks_---__---_--.----__----------_--- Tears Rocks moved-percent _ _ _ _ _ _ - - - _ _ _ _ _ _ _ - Average distance moved-ft p w yr----
Gunsliot Arroyo :
Rocks moved-percent . . . . . . . . . . . . . . . . . . . . . Average distance moved-ft per y r _ _ _ - - - - _ _ _
Rocks-_-_---_-___-___-.----___---__----_----_ Years--____--__---__-------__---_--_------_ Rocks moved-percent - _ _ _ _ _ _ - _ _ _ _ - - _ _ _ _ _ _ _ Average distance moved-ft per y r - - _ - _ _ _ _ - -
Rocks__---_____--___--.------------~------ Years----------_-----_-----------_-------_ Rocks tnoved-~rcent-_--_-_____------------- Arerage distance moved-ft 1)er y r __---___--
Green Rock Gulch :
Little Green Rock Gulch :
Deposition
Aggradation of channels : Slopewash Tributary :
Nail section : Number of chains, 1)ins or sections---_--_ Years__-__--__--_-_----___--------_------ Average net aggradation-ft per yr---_-
Nuniber of chains, pins, or sections------
Average net nggraclatioti-ft per yr-----.. Arroyo Frijoles, mainstein : inchiding North
iVumber of chains, pins, or scctions _ - - _ _ _ _ _ _
Average net aggradation-ft per y r _ _ _ _ - - _ _ _
Number of chains, pins, or sections - _ - _ _ _ - - _ _
Average net aggradation--ft, per yr_-___-_-_
Sumber of chains, pins, or sections - - - -____-_ Pears_-__-_-----_--_----__--_--------___-- Average net aggradation--ft per yr__--___-
Drainage area-sq mile - _ _ _ _ _ - - _ _ _ _ _ _ _ _ _ _ _ _ Years___---__---- ._-_---_____--------_----_-_~ Volume deposition-vu f t - _ - _ - _ _ _ _ _ _ _ _ _ - _ _ _ _ Sediment collected-ton per sq mile per yr---
Drainage area-sq mile - _ _ _ _ _ - - - - - _ _ _ _ - - - _ - Pears--_-_-------__---_---__---------------- Volume deposition-cii f t - - _ _ _ _ _ _ _ - _ - _ _ _ _ _ - Sediment collected-ton per sq mile per yr--_
Pins a t chain section :
Branch :
Coyote C. Arroyo:
Gunshot Arroyo :
Filling of small reservoirs : Coyote C . Arroyo Dam :
Big Sweat Dam :
I--
67 3
67 96
88 4
100 93
230 5
23 ;in 40 5
32 1
10 5
0.033
> I
6 0. 003
90 G
0.040
6 3
0. 100
3 2
0. 060
0. 064 3
6,245 1, 633
0. 0060 1. 2 95.3 660
applied to tlie number of heaclcuts per squ:Lre iiiilr esti- mated from detailed knowledge of the areit.
Mass-movement, pins are installed on sloping gully walls which are steeper than the hillslopes in general. Though when tlie measurements were begun we liad not expected downhill creep to be of significance in a senii- arid climate, our observations and those of others ( for
N A SEMIARID ENVIRONMENT
0.015 65
13,600
1,000 4
200
0. 20 35. 6
1. wfi 98
13, !NO
~
summary see Leopold and others, 1964, p. 349-353) in- dicate that it is a process whicli cannot he disregarded. ;\lass wasting should deliver debris to tlie rills and chan- nels in proportion to the rate of do\~nhi l l creep and to the total length of cliannel in a given area. A drainage densit,y was computed by using a Horton analysis of the number and lengths of channels. I n n square mile the order of tlw Inrgwt c~haimel including rills is sewn. The number and lengths of various orders are as follows :
Length Number (miles) Order I 1 Adjustment to channel segments
Length (mile)
0. 50 . 4 8 .11 .06 .027 ,013 . 01
Number
1 4 .5
14.5 56
185 540
1,600
Number X length
(miles)
0. 5 2. 2 1. 6 3.3 5.0 7.0
16.0
36. 6
By this estimate there are about 35 miles of chan- nel a i id r i l l in a square mile area, and because there are two baiiks of a channel, the length of channel boundary possibly subject, to debris production by creep is some 70 miles. Using an average of 28 cu f t per mile of slope- base per year,
28 X '70=1,960 cu f t per yr per sq mi, which at 100 lbs per cu f t is 98 tons per sq mi per yr.
separate item of contribution to sediment production. Movement of individual rocks was not included as a

CHANNEL AND HILLSLOPE PROCESSES, SEMIARID AREA, NEW MEXICO 239
Order
7.. ........................... 6 ............................. 5 ............................. 4 ............................. 3 ............................ 2 ............................. 1 .............................
Total..
Deposit,ional data consisted of channel aggradation which was computed into tons per square mile as fol- lows :
Seament Width Channel length (ft) area (sq It) (miles)
_ _ _ _ ~ 0. 5 28 75,000 2.2 16 186,000 1. 6 R 67,000 3. 3 3. 5 61,000 5.0 2. 5 66.000 7.0 1.3 48,000
16.0 .9 76,000
........................................... 579,000
Tlien 579 x 10" q ft of clinnnel area aggrading at 0.05 f t per yr is 28,900 cu ft.; at 100 pounds it equals 1,440 toiis per sq mi per yr.
The collection of sediment behind the dam in Coyote C. Arroyo gave a figure of 1,633 t,oiis per sq mi per yr. Tlie production and trapping of sediment may be sum- marized as follows :
Tolal sediment Sediment ( tons per sq product ion 7ni per yr) (percent )
Surface erosion- ................... 13,600 97.8 Gully erosion _ _ _ _ _ -. -. . -. -. -. 200 1 . 4 Mass movement- .................. 98 . 7
Total _ _ _ _ _ _ _ _ _ _ ~ .._._..__ ~ ._._ 13,900 1 0 0 3 ~ _ _ _ _ ~
_ _ _ _ _ _ _ _ _ _ _ _ _ Deposition in channels- ............. 1,440 10 Trapped in reservoir ................ 1,633 12
~ _ _ _ _ Total ______.__._._..__ ~ _._.. ~- 3,073 22k
By far tlie largest contribution of sediiiient is hy sheet, erosion. ('liaiinel deposition is only itbont half of the total seclinient trapped, tlie latter being only al)ont one- ' quarter. of that produced. I t is wcopizecl tliat if the budget were correct and tlie r:hser.\wir. trap efficiency were 100 percent, the total OS deposition in clxiniiels and trapped in the reservoir woulcl equal sediment produc- tion. It is our opinion that the setliinrnt nioiwl as sheet erosion does not a l l get into the cli:inncl, hit is tempornrily stored in t I i i n cleposits niclrly dispersed over the colluvial area, :ind t1i:it f l i r t lieriiiore, tlicre i i a very low trap efficielicy to the revrvoir .
Otlier measurements of sediment ncciiniulnt ioii i n western United States give v:ilue.; of 1.200 t o 9,100 tons per sq mi per y r (Brown, 1!)&5) .
To our knowleclge, of the piiblislietl re1)orts on sedi- ment yield from seiiiinrid drainngr bnsins, by f a r the most excellent is tliat of I-Iatlley :ind Schuinm (19G1), who measured, a in ong other t 11 i ngs, setli in en t ccumu - latioii in a large niiinl)er of stovlc ponds :ind small res- ervoirs. These ([at :\ were studictl in relation to geo-
logic formation, runoff, and rnrious geoinorphic char- acteristics of basins. Tlieir data are far more conipre- hensive than ours insofar :is sediment accuinulation in reservoirs is concerned. The only unique feature of the present data is that me attempt to assess the relative importance of different processes of sediment produc- tion.
Despite tlieir deficiencies, our data bear coinparison with tlir more extensive valnes lmblislietl by Hadley and Scliiiinm, as in the following :
Acre f l per T o n s per
Yr y r 1
Sediment accumulation: Coyote C . Arroyo (0.064 sq mi) ac-
cumulation in reservoir and chnri- ne1 _____.____________.________ 1.41 3, 073
Average curve for a11 lithologies, for 0.06 sq mi area (Hadley and Schumm) .._..______________._ 1 . 8 3,930
w jiii per 3'1 n 1 1 p r
I Based on 100 Ibs per cu It.
For small basins the sediment accumulation observed by us in New Mexico is of the same order of magnitude as in basins of siniilar size in Wyoming underlain by slide or otlier litliologies high in silt content. I-Iatlley and Scliumm (fig. 30, p. 173) showed that for the Che- yenne Basin sediment accumulation was related to re- lief ratio (basin relief divided by basin length). The average relief ratio for our Coyote C. and Slopewash tributaries is 0.59. Entering this value in the Hadley- Schumni curve for all lithologies, the estimated value of sediment accumulation is 2.4 acre f t per sq mi per yr, and in the cuNe of those authors applicable to Fort Union formation only, the value is about 2.5. These values are slightly higher than the 1.41 observed in Coyote C. Arroyo but still of the riglit order of mag- nitude.
The finding of Hadley and Schumm (fig. 26, p. 163) t l i a t sedinient accuninlation per nnit area of basin de- creases rapidly with increasing drainage area is in keep- ing with our result that sheet erosion basin-wide esti- mated froin erosion pins gives a. value of sediment pro- duction about 4.5 times larger than can be accounted fo r in channel aggradation and reservoir accumulation. This feature is probably related in part to the same cause postulated by those authors : absorption of water in the dry channel beds below areas affected by local storms. But the fact remains tliat even in our detailed study of deposition, sediment spread thinly over collu- vial areas does not show up in measurement, data.
Another interesting comparison is with data on sedi- ment production by d r y sliding of debris on tlie steep

240 EROSION AND SEDIMENTATIOlr;
slopes of southern California. Krammes (1960) meas- ured debris in metal troughs laid on contour in burned and unburned areas in San Dimas Experimental Forest near Glendora. H e found a sediment yield of 24.7 tons per acre per year (15,800 tons per sq mi per yr ) after a brush fire, which compared with 2.69 (1,720 tons per sq mi per yr ) before the fire had denuded the slopes. Of the total annual yield 89 percent of the debris was contributed during nonrain periods by dry sliding. The figure for prefire condition is about half the sediment yield observed by us in New Mexico, but the postfire figure is five times larger than our value.
Returning to the question posed earlier in this report, it appears that in semiarid areas of the type studied sheet erosion not only predominates as a sediment source but also seems quite capable of providing the sediment making up the bulk of alluvial fills during periods of aggradation. Indeed, the present channels are aggrad- ing, and at, 0.05 f t pe ry r the observed rate would eventu- ate in a fill as deep as the Coyote alluvium under the high terrace in 100-200 years. No doubt such a rate would not be sustained as an average for so long a period because in a century there would be some years, no doubt, during which net degradation would occur.
Nonetheless, the- present processes and their rates ap- pear quite capable of resulting in deposition of alluvial fills comparable to those of past periods which filled major valleys. The present is, then, a reasonable pic- ture of conditions during which valley aggradation occurred in post-Pleistocene time.
The importance of sheet erosion makes it quite pos- sible that aggradation can occur in tributaries, even in small channels only a few hundred feet from the'water- shed divide. Gully or rill erosion was probably insig- nificant or absent during the deposition of the principal alluvial fills in these valleys. Gully erosion assumes its important role during periods of valley trenching or arroyo cutting as was observed in the post-1880 period.
CLIMATOLOGICAL OBSERVATIONS DURING AGGRADATION
From the archeologic materials and a C14 date, it is computed that the upper part of the Tesuque formation accumulated in the Tesuque Valley, a few miles from our study area, a t an average rate of 104-156 yr per f t (Miller and Wendorf, 1958, p. 190). During the period 1958-64 we observed an average rate of channel bed change that would result in aggradation a t the rate of about 25 y r per ft. The present landscape is similar to that under conditions which probably prevailed in the same area, let us say, in the first centuries of the Chris- tian era. But the land at, present has hardly begun to recover from widespread devastation of the overgrazing
N A SEMIARID ENVIRONMENT
in the late 19th century. The combination of a grazed range and the present climatic swing provides compara- ble rainfall-runoff conditions to those caused by a some- what more unfavorable climate but uncomplicated by the effects of grazing animals.
What are the salient aspects of climate in relation to vegetation which create the difference between a period of aggradation and one of degradation in valleys? This question has merited the attention of many geomorphol- ogists and has been answered tentatively in a variety of ways. Considerable evidence points to a coincidence of increasing aridity with degradation and increasing humidity with aggradation, hut there are opposite views. Reaching a firm conclusion will have to await continuation of just the kinds of observations being here reported. Because we cannot hope to obtain a definitive answer to the question with 7 years of measurement, we are publishing our results principally to encourage others to join us in similar programs of simple measure- ment over a period of time in order that there will grad- ually become available concurrent data on rate of chan- nel change, precipitation, and runoff.
The precipitation record for Santa Fe, N. Mex., is the longest in the United States. This record has been analysed in detail for its relation to the erosion problem (Leopold, 1951) and even then, 14 years ago, the diffi- culty of analysis lay not in the length of the precipita- tion record but in the lack OP quantitative data on land erosion and channel changes. Our measurement data are not yet enough, but the nature of the problem can be more clearly seen than was possible without them, as will now be explained.
Leopold (1951) showed that the mean annual pre- cipitation at Santa F e did not significantly change be- tween the first and second half of the century of record, but the frequency of daily rainfall amounts did change. I n the present discussion we will review briefly that argument and bring the analysis up to date of the pres- ent writing, 1964.
Three graphs are presented in figure 171. Graph A , the annual march of yearly precipitation totals, is plotted without, any averaging. Graphs R and C show that part of the annual amounts contributed in summer (July-Sept. incl.) months. The mean summer total of 6.06 inches consists mostly of thunderstorm rainfall which each season begins about July 15 after a reln- tively dry late spring and early summer. Thunder- storms are nearly daily occurrences in the nearby moun- tains from midJu ly to early September. Graph c shows that part of the summer rainfall made up by rains totalling one inch or more in n day.
In the tliree parts of figure 171, tretitls in the 114 years :LPA not easily discernible withoiit the use of m017-

C H A N N E L AND HILLSLOPE PROCESSES, SEMIARID AREA, N E W MEXICO 241
ing averages. hispec~t 1011 of tlie graplis reveds the dry perioc] of tlie 1940's ; i i i t l eiirly lO5O's and the heavy siiinnier r:iiiifalls of t lie e;ii.ly Iti>O's.
Figures 172 a i r t l 17:; I ) ~ ~ t l i tlir precipitation record into its suninier and noiisumnier components, and then
25
20
VI
0 2 15
z E g 10 c a k a a 5 a 0 w
0
again into the 1iuni1)er of rains of different categories of size of daily rainfalls. The seculnr change in number of nonsuninier rains of less t1i:in 0.5 inch in a day so prominent, in Leopold's annlysis is obvious here, figure 173U. A more subdued but parallel trend is seen also
A INDIVIDUAL YEARLY RAINFALL
Mean annual rainfall Long-term average= 13 72 I
0 PI 0 W m
0 Lo 0 0 m 0 8 0 2 (v 0 0 0
I\ 03 0 W 0 Ln
2 2 E? 2 2 2 2 2 2 5 2 2 r(
T- I I I 1- - I I I I I 7
A. TOTAL NUMBER OF RAINY DAYS
B. RAINS, INTENSITY 0.01-0.49 INCH PER DAY
D. RAINS, INTENSITY EQUAL TO OR GREATER THAN 1.00 INCH PER DAY
0 b 0 8 0
x 2 E 2 8 2 r(
0 2 N m .+
m M
w 2 !! 2 !2 2 .+
0 01 0 0 0 0 LD PI
YEAR
FIGURE 172.-Number of individual summer rains (July-Sept. incl.), Santa Fe, N. Mex.

40
30 >. 0
l-
0 Z w
a
a s a
2
z z a a P 2 z 0 10
m
20 v)
oc _I
3
0
U
oc W
5
-7 -
-
--
-
-
-
A
in the number of summer rains less than 0.5 inch per day. These secuhr changes leave the general impression that the last 25 years were more similar to the first 25 years of record than to the middle of the record period ; that is, 1942-57 seems to resemble 1853-72.
This impression is strengthened by examination of figure 174 which shows the annual march of the average intensity of rain expressed as inches per day per rainy day, that is, the number of inches of rain in a year di- vided by the number of rainy days that year. The rains of the early and final part of the record were more in- tense than during the middle of the record.
Similar analysis led Leopolcl (1951) to argue that the period coincident with the advent of heaviest grazing, 1850-80, was characterized by a deficiency of the low- intensity rains which succor vegetation and by more than the average number of heavy rains which could act upon a weakened vegetal cover and promote erosion. This argument is a reasonable one, but to demonstrate
EROSION AND SEDIMENTATION IN A SEMIARID ENVIRONMENT
its validity one needs concurrent and detailed data on erosion rates. Such concurrent data are now available for the 7-year period 1958-64, but this period includes years of both high and low intensity rainfall. The pre- cipitation data are not clearly of the character that one could say unequivocally that erosion should be large or should be small. In short, the 7-year record is not long enough.
But the nature of the question ought to be clear from the data presented. Geomorphologists must make quantitative observations of erosion rates and channel changes over a long enough period to be clearly related to the concurrent precipitation record.
It, is our hope that the presentation even of the short record now available will spur our colleagues to estab- lish similar :weas and continue simple measurements over a period of time so that those who follow us will have more to work with in analysis of this hydrologic and geomorphic problem.
r ---T -7- ---7-- --i-----T---I-.~~T----
A. TOTAL NUMBER OF RAINY DAYS I
'D. RAINS, INTENSITY EQUAL TO OR GREATER THAN 1.00 INCH PER DAY
E! 2
YEAR
FIGUB~D 1 7 3 . 4 u m b e r of individual nonsummer rains, Santa Fe, N. Mex.

CHANNEL AND HILLSLOPE PROCESSES, SEMIARID AREA, NEW MEXICO 243
2. 4
> a
z a [L
CL W Q
>- 6 a a 2 3 z_ z z a
I 0
a
& >-
m z W I-
t
z W c3
W > d a
0.40
0.30
0.20
0.10
0 1- 2 2
YEAR
FIGUBEI 174.-Average annual intensity of rainfall, Santa Fe, N. Mex.
REFERENCES Bagnold, R. A., 1956, The flow of cohesionless grains in fluids :
Royal SOC. [London] Philos. Trans., ser., A no. 964, v. 249, p. 235-297.
Brown, C. B., 1945, Rates of sediment production in South- western United States: U.S. Soil Conserv. Service, SCS-
Emmett, W. W., and Leopold, L. B., 1964, Downstream Pattern of River-Bed Scour and Fill : Proc., Federal Inter-Agency Conf. on Sedimentation, Jackson, Miss.
Hadley, R. F., and Schumm, S. A., 1961, Hydrology of the upper Cheyenne River Basin : U.S. Geol. Survey Waster-Supply Paper 1531-B, 198 p.
Krammes, J. S., 1960, Erosion from mountain side slopes after fire in southern California: U.S. Forest Service, Pacific S. W. Forest and Range Expt. Sta., Research Note 171.
Leopold, L. B., 1951, Rainfall frequency, a n aspect of climatic variation: Am. Geophys. Union Trans., v. 32, no. 3, p. 347- 357.
TP-65,40 p.
Leopold, L. B., and Miller, J. P., 1954, A post-glacial chronology for some alluvial valleys in Wyoming: U.S. Geol. Survey Water-Supply Paper 1261 89 p.
1956 Ephemeral streams-hydraulic factors and their relation to the drainage net : U.S. Geol. Survey Prof. Paper 282-A, 37 p.
Leopold, L. B., Wolman, M. G., and Miller, J. P. 1964, Fluvial processes in geomorphology : San Francisco, W. H. Freeman Co., 522 p.
Miller, J. P., and Wendorf, F., 1958, Alluvial chronology of the Tesuque Valley, New Mexico: Jour. Geol., v. 66, no. 2, p.
Miller, J. P., Montgomery A., and Sutherland, P. K., 1963, Geol- ogy of part of the Southern Sangre de Cristo Mountains, New Mexico: iVew Mex. Inst. of Mining and Tech. Mem. 11, 106 p.
Wolman, M. G., 195.5, The natural channel of Brandywine Creek, Pennsylvania : U.S. Geol. Survey Prof. Paper 271, 56 p.
177-194.

SUMMARY OF DATA
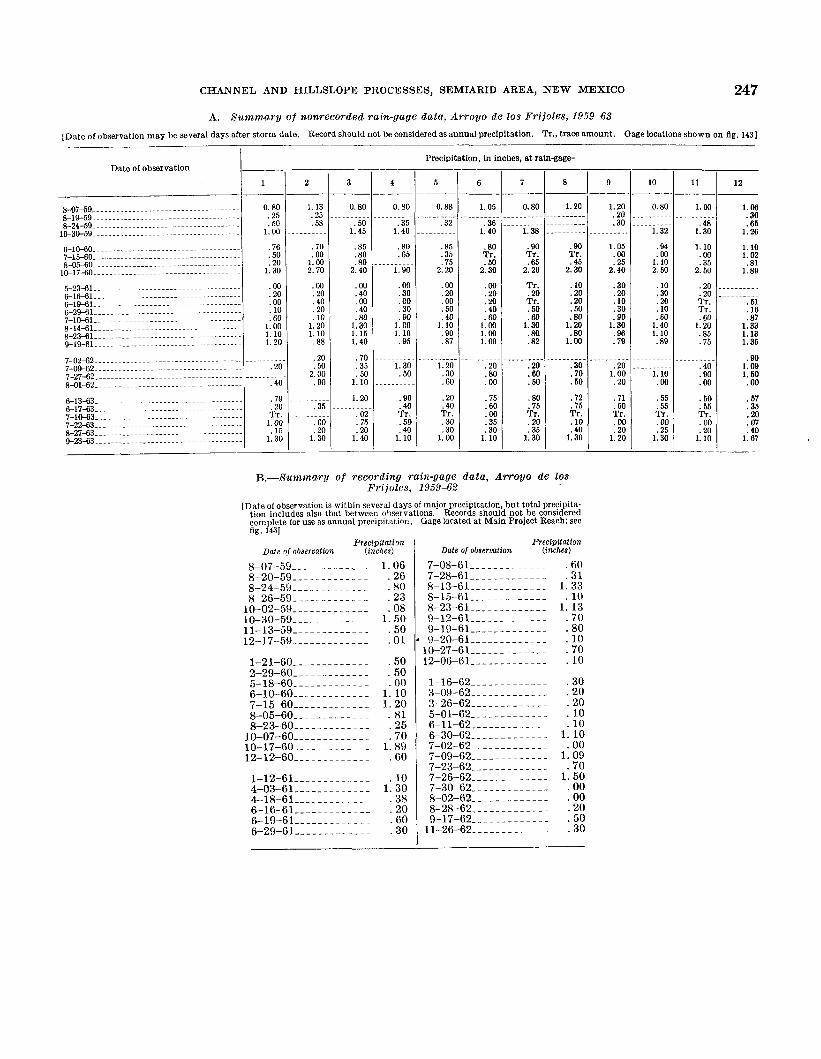
CHANNEL AND HILLSLOPE PROCESSES, SEMIARID AREA, NEW MEXICO 247
__ 8-07-59 __...___......_._...-...-........._.. 8-18-59 ..................................... 8-24-59 ... . . . ._____. . .. ... ..........._....
l(t30-59 .....................................
6-1(t60 ..................................... 7-15-60 ..-.........-.-------------------.... 8 - 0 ~ 0 .........~....-..........~-...-......
l(t17-60 --.........-..........-.....~.....~..
5-23-61 -.-.........-...-.....-....~-.....-.. 616-61 ..................................... 6-18-61 ..................................... 6-28-61 ..__..___. .- .. . .....__...._..._._..__ 7-10.61 ..................................... 8-14-61 ..................................... 8-23-61 ..................................... 8-19-61 .....................................
7-02-62 ..................................... 7-09-62. .....- .. . . --. .~. ...- ~. . .. . . . . ..- .. .. 7-27-62 ___.. -.. . . . ~. . . __. . . .-- .. . .. ... . .___. 8-01-62. .... ... .. . . . . . . . . ... .. . . ... ~ -. . .~ . .-.
6-13-63. .. .. .-. . . . .. . . ~ ....- .- .- ......--..-. 6-17-63 ..................................... 7-10-63 ____.._._........_...--..... ~ ....--.. 7-22-63 -..............-------------------... 8-27-63 ........-....-............-....~~.--. 9-23-63. .__..___. . .- -.. .. ... __... .. -. . . .~ -. .
A.-Summary of nonrecorded rain-gage data, Arroyo de 10s Frijnles, 1959-63
[Date observation may be several days alter s torm date. Record should not be considered as annual precipitation. Tr., trace amount. Oage locations shown on 5g. 1431
I
0.80 .25 .50
1.00
.76
.50
.20 1.30
.OO
.20 . O O . 10 .60
1.00 1.10 1.20
..-...... .20
... .. -. . - .40
.79
.20 Tr.
1.00 .15
1.30
.10
. 3 0
.20
. l o
.60 1.40 1.10 .89
.20
.20 Tr. Tr. .60
1.20 .85 .75
.55
.55 Tr. . 00 .25
1.30
.50
.55 Tr. . 00 .20
1.10
Precipitation, in inches, a t rain-gage-
IT Date of observatlon __
4 2 3 5 6 7 9 10 I 11 8 12
1. OB .30 .65
1.26
1.10 1.02 .81
1.89
. . . . . . . . .
. . . . . -. -. .51 .16 f87
1.33 1.13 1.35
. 90 1.09 1.60 . 00 .57 .35 .20 .07 .40
1.67
1.13 . 25 .58 ~...
.70 . 00 1.00 2.70
. 00
.20
.40
.20
.10 1.20 1.10 .88
.20
.50 2.00
.BO
.35 ....... ~
0.80
.50 1.45
.85
.80
.80 2.40
. 00
.40 .oo
.40
.80 1.30 1.15 1.40
.70
.35
.50 1.10
1.2c
. -. . -. 0.80
.35 1.40
. 80
.65
1.90
. 00
.30 . 00
.30
.90 1.00 1.10 .95
. . . . . . -
. . . . . . .
. . . . . . -. 1.30 .50
. . . . . . . .
.9a
.40
.50
.4a
Tr.
1. 10
0.88
.32 . -. - - - - .
. . . . . . .
.85
. 35
.75 2.20
. 00
.20
. 00
.50
.40 1.10
. 90
.87
1.20 .30 .60
.20
.40 Tr. .30 .30
1.00
. - -. . . . .
1.05 0.80 1.20 1.20 .20 .30
. . . . . . - -. 1.05 . 00 .25
2.40
.30
.20
.10
.30
. 90 1.30 .96 .79
.20 1.00 .20
.71
.60 Tr. . 00 .20
1.20
. . . -. - - -.
.36 1.40
.80 Tr. .50
2.30
.oo
.20
.20
.40
.60 1.00 1.00 1.00
.20
.80
. 00
.75
.60 .oo .35 .30
1.10
. -. -. . .
-. . . . -. . . 1.38
.90 Tr. .65
2.20
Tr. .20 Tr. .50 .60
1.30 .80 .82
.20
.60
.50
.80
.75 Tr. . 20 .35
1.30
- - - -. - - -
. . . . . . . -.
. 90 Tr. .45
2.30
.10
.20
.20
.50
.80 1.20 .80
1.00
.30
. 70
.60
.72
.75 Tr. .10 .40
1.30
- - - - -. . - .
.oo
. . . . -. . . . . 4 0
1.101 . 00 .PO . 00
B.--SummarU of recording rain-gage data, Arroyo de 10s Frijoles, 1959-62
[Date ol observation is within several days of major precipitation, bu t total precipita- tion includes also that between observations. Records should not be considered complete for use as annual precipitation. Gage lorated a t Main Project Reach; see fig. 1431
Precipitation Date of observation (inches)
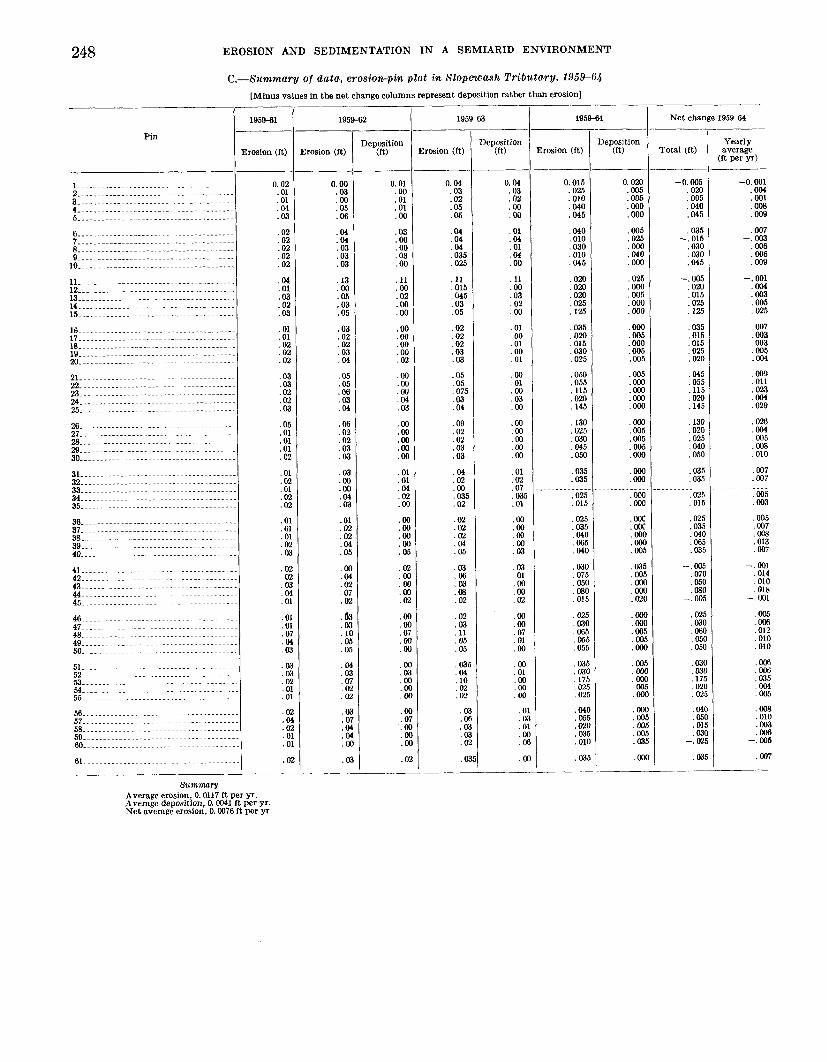
248
. m
. ooo
. 005
. 005 . Ooo
EROSION AND SEDIMENTATION IN A SEMIARID ENVIRONMENT
. 005 . m .om
. 00.5
. ooo
C.-Summary of data. erosion-pin plot in Slopewash Tributary. 1959-64 [Minus values in the net change columns represent deposition rather than erosion]
.OM) . 005 . 005 . 005 . 035
1959-61
Pin
Erosion (It)
. 0 . 02 . 01 . 01 . 04 . 03 . 02 . 02 . 02 . 02 . 02
. 04 . 01 . 03 . 02
. 03
. 01 . 01 . 02
. 02
. 02
. 03
. 03
. 02 . 02
. 03
. 05 . 01 . 01
. 01 . 02
. 01 . 02 . 01 . 02 . 02
. 01 . 01 . 01
. oi
.E
. 0: . 0:
. w
. 04
. 01
. 01 . 01 . 07
. 04
. 03
. 03
. 03
. 02
. 01
. 01
. 02 . 04
. 02 . 01 . 01
. 02
1 ....................................... 2... .................................... 3. ...................................... 4. ...................................... 5... ....................................
0.01 . 00 . 01 . 01 . 00 . 03 . 00 . 00 . 03 . 00
. 11 . 00
. 02
. 00
. 00
. 00
. 00
. 00 . 00 . 02
. 00
. 00
. 00 . 04 . 03
. 00 . oo
. 00 . 00 . w
. 01 . 01 . 04 . 02 . o( . o( . o( . o( . M . O!
. 0:
. M
. M . 02
. 00
. 00 . 07 . oo
. 00
. w
. 03
. w
. oc . oc
. M
. oc . oi
. oc . M . M
. 0:
0.015 . 025 . 010 . 040 . 045 . 040 . 010 . 030 . 010 . 045 . 020 . 020 . om . 025 . 125 . 035 . 020 . 015 . 030 . 025
. 050 . 055
. 115 . 020
. 145
. 130
. 025
. 030
. 045 . 050
. 035 . 035
. 025 . 015
. 025
. 035 . 04c
. 065
. 04c
. 03c
. 07t
. 05(
. 08(
. 015
. 025
. 030
. 065
. 055
. 055
. 035 . 030 175
. 025
. 025
. 040 . 055 . 020 . 035
. 035
.. - - ...
. oio
__ Summary
Average erosion 0.0117 It per yr . Average deposition 0.0041 It per yr . Net average erosiod. 0.0076 It pet yr .
0.00 . 03 . 00 . 05 . 06 . 04 . 04 . 03 . 03 . 03 . 13 . 00 . 05 . 03 . 05
. oa . 02 . 02 . 03
. 04
. 05 . 05 . 06 . 03
. 04
. 06 . 02 . 02
. 03 . 03
. 03
. 00 . 00 . 04
. 03
. 01 . 02
. 02
. 04
. 05
. 00
. 04 . 02
. 07 . 02
. 03
. 03 . 10 . 05 . 05
. 03
. 07
. 02
. 02
. 03 . 07 . 04 . 04
. 00
. 03
. 04
195w63 I 195S-62
6 ....................................... 7... .................................... 8 ....................................... 9 ....................................... 10 .......................................
11 ....................................... 12 ....................................... 13 ....................................... 14. ...................................... 15 .......................................
16 ....................................... 17 ....................................... 18 ....................................... 19 ....................................... 20 .......................................
21 ....................................... 22 ....................................... 23 ....................................... 24 ....................................... 25 .......................................
26 ....................................... 27 ....................................... 28 ....................................... 29 ....................................... 30 .......................................
31 ....................................... 32 ....................................... 33 ....................................... 34 ....................................... 35 .......................................
36 ....................................... 37 ....................................... 38 ...................................... 39 .................................... 40 .......................................
41 ....................................... 42 ..................................... 43 ...................................... 44 ....................................... 45 ......................................
46 ....................................... 47 ....................................... 48 ....................................... 49 ...................................... 50 .....................................
51 ................................... 52 ...................................... 53 .................................. 54 .................................. 55 .......................................
56 ....................................... 57 ....................................... 58 ....................................... 59 ....................................... 64 .......................................
61 .......................................
_- Deposition
(It) Crosion (It) Deposition
(It)
0 . 04 . 03 . 02 . 05 . 05 . 04 . 04 . 04 . 035 . 025 . 11 . 015 . 045 . 03 . 05 . 02 . 02 . 02 . 03 . 03 . 05 . 05 . 076 . 03 . 04 . 09 . 02 . 02 . 03 . 03 I 04 . 02 . oo . 03. . 02 . 02 . 02 . 02 . 04 . 05 . 03 . 06 . 03 . 08 . 02 . 02 . 03 . 11 . 0.5 . 05
. 03:
. 04 . 10
. 02
. 0%
. 0: . M . 0: . 0: . 0:
. 0; .
0.04 . 03 . 02 . 00 . 00
. 01 . 04 . 01
. 04
. 00
. 11
. 00
. 03
. 02
. 00
. 01
. 00
. 01 . 00 . 01
. 00 . 01 . w
. 03
. 00
. 00 . 00 . oo . oo . 00
. 01 . 02 . 07 . 03
. 01
. 00 . oo
. 00
. oc
. 03
. 03
. 01
. M
. o(
. 02
. 00
. 00 07
. 01
. 00
. 00
. 01
. 00
. 00
. 00
. 0 . 0 . o
. a
. o
. c
195s-64
Prosion (It)
....
.
Deposition (It)
0.020 . 005 . 005 . 000 . 000 . 005 . 025 . 000 . 040 . OM)
. 025 . 000 . 005
. ooo
. OOO
. 000
. 005
. 000 . 005 . 005
. 005 . ooo . ooo . Ooo . 000
. ooo
. 0435 . 005 . 005
. OOO
. Ooo . ooo ............
. 000 .
. ooc . ooc . ooo . ooo . 005
. 035 . 005
. ooc
. ooc
. MC
Net change 195W34
Total (It)
_ .
...
-0.005 . om . 005 . 040 . 045
. 035 - . 015 . 030
. 030 . 045
- . 005 . 020 . 015 . 025 . 125
. 035
. 015
. 015 . 025 . 020
. 045 . 055 . 115
. 020 . 145
. 130
. 020
. 025
. 040 . 050
. 035 . 035
. 025 . 015
. 025 . 035
. wc . 065
. 03.
- . 0o.K . 07( . 05c . 08(
- . 00: . 025 . 030 . 060 . 050 . 050
. 030
. 030
. 175 020
. 025
. 040
. 015 - . 025
. 035
........
. o5a
. o3o
Yearly average
(It per yr) ___-
-0.001 .004 .001 .008 .009
.007 - .003 .006 .006 . 009
- .001 .004 .003 .005 .025
.007
.003
.003
.005
. M)4
.009
. 011
.023
.004
.029
.026
.004
.005
.008
.010
. 007
.007
.005
.003
.005
.007
. oc8
.013
.w7
-.ool .014 .010 .018
- .001
......
.005
.006
.012 010 .010
.006
.006
.035
.004
.005
.008
.010
.003 . M)6 - . 006 .007

CHANNEL AND HILLSLOPE PROCESSES, SEMIARID AREA, NEW MEXICO
l).-fJrimmary of data, slope-retreat p i n s in SZopeuiash Tributary, 1959-64 [Minus values in the net change coluinns represent deposition rather than erosion]
249
195941 1961-62 1962-63 1959-64 Net change 1959-64 -- Erosion
(It) --
0. 03 .04 .03 .06 .04
.03
.21
.03
.02 . 01
. 01
.08
.02
.02
.02
.02
.03
. l l
.13
.07
.22
.03
.M
.02
.O1
.02
.02
. 01
..........
___ kposi t ion
(It) -__
0. 010 . 010 ,045 ,010 . a n . 020 .330 .m ,010 . nio
. n o
. mn
.Ooo
,020
.040
.ooo
.OM)
,040 ,065
,070
350 ,045 ,120 ,080 ,050
.030 ,055 .040 . 010
...........
.205 . 175 ,255 .155 ,110
.055
.020
,240 ,190
..........
. nio ,080 ,070 ,040
,040 ,040 ,030 ,040 ,040
,030
,000 . 050 . 010
. 190
. OF0
. oin
. oon
Deposition 0.0089 ,0139
-_ Yearly average
(It per yr) __-
0.013 ,028 ,016 ,023 ,027
.046 ,000 ,004 ,030 ,016
,028' ,005 ,015 .019 ,005
.ox2 ,028 ,052
,084 ,030
-. 014 ,019 ,006 .008 ,012
,046 ,016 ,008 ,014
...........
-. 024 -. 013 -. 024 -. 016 -. 014
.003 ,011
-. 020 -. 014
,014 ,004 ,010 ,016 ,020
,020 ,036 ,006 ,000 .004
,002 ,040 .034 ,018 ,018
,024 ,018
.........
Erosion
(It)
Erosion
(It)
Total
(It) __-
0. MI5 ,140 .080 . 115 .135
,230 .000 ,020 .150 .080
,140 ,025 ,075 ,095 . 025
,110 ,140 .260
.420
.150
-_ 070 ,085 ,030 ,040 ,060
,230 ,080 ,040 ,070
Pin Iepositior
(It)
0.01 . 01 .03 . 01 . 01
.02
.06 . 01 . 01
.02
.02
,025
.03
.02
.04
.03
.04
.04
.05
.05
Erosion
(It)
0.025 .03 ,035 ,015 .015
. ma ,070 ,080
,030 .015
,040 .015 ,005 ,005 ,020
, 0 3 5 .035 ,040
,020 ,025
,030 ,050 .03C ,070 . o2a
,035 ,035 . ow . o x
Ieposition
(It)
0.000 ,000 ,015 ,000 . no0
. O M )
. OW ,030 ,000 ,000
,000 . 010 . ow ,000 ,015
.wo
.m ,040
,020 ,025
.040 ,005 ,020 ,000 ,000
. OM) ,005 ,040 ,000
0.075 ,150 .125 ,125 .145
.250 ,330 ,110 ,160 ,095
,140 .145 ,095 ,095 ,065
,110 . 140 ,330
,460 ,215
.280 ,140 ,150 ,120 ,110
,260 ,135 . oxo ,080 .....
,085 ,110 ,135 .075 ,040
,070 .075
,140 .120
.080
. loo ,120 ,120 ,110
,140 .220 ,060
,060
,040 , 2 0 0 ,170 ,140 ,100
.310
.150
....
. 040
~
1 .................. 2 ..................
0.00 . 00 .oo . 00 -00
.OO
.17
. 00
. 00 00
. 00
.07
.00
. 00 . 00
. 00
. 00
. 00
. 00
. 00
.10
. 00
. 0 2
.w
.03
.00
.00
. O l
.....
0.01 .02 . 01 . O 1 .02
.02
.03
.00
. O B
. w
.06
.03
.06
.03 ,025
,015 . 035 .03
.02
.04
.03
.03
.04
.04
.05
,175 .05 .04 .02
..........
. 01
. 01
.02 . 01
.00
.02
.03
.02
.04
. n3
.02 . 01
.01 . 02
.19 .w
.oo . 01
. 00
. 02
. 08
.07
.01
. 01
. 00
..........
. no
0.00 . 00 . 00 . 00 . 00
. 00
.16
. 00 .w . 00
. 00
.03
. 00
. 00
. 00
. 00
. 00
. 00
. 00
. 00
.18
.00
.04 . 03
.oo
.oo 00
.00 on
. oo
. oo
.....
. 00
.w . 00
. 0c . oa
. oa .......
. 00
. 0c
. oc 0( O(
. O(
. . . . ~~~~~
~~
~~ .
.~~~
. . ~ ~ ~
~ ~~
. . ~ ~ ~ ~
0.01 .06 .05 .04 .07
.17 . 01
.01
.02
.03
.03
.02
.O1
.a4
.00
.04
.04
.15
. 29
. 08
.00
.03
.02
. 01
.02
.04
.03
.02
.03 ..~..
.02
. 0 2
.03
.04
. 01
,072 .02
.03
.03
.02
. 01
.00
. 01
. 01
.....
~~
~~~~
~~~. . ~~~
..
~ .. ~~~
4 .................. 5 ..................
6. ................. 7 .................. E . - - . . . ........... 9. ................
lo...--^^^....^....^
11 .................. 12 .................. 13 .................. 14 .................. 15 ..................
16 .................. 17 .................. 18 .................
19 .................. m .................. 21 .................. Y2 .................. 23 .................. 24 .................. 25 ..................
26 .................. 27 .................. 28 .................. 29 ................. 30 .................
31 .................. 32 .................. 33 .................. 34 .................. 35 ..................
36 .................. 37.. ............... 38.. ............... 39 .................
.05 .........
.........
.07
.09
.07
.02 . 0 2
.03
. 0 2
.13 . 11
.w
.03
. 01
.00
. 01
.04
.04
.03
.00
.02
.02
.00
.00
. 00 . 00
.15
.02
.........
... . 135 ,085 ,145 ,045 .080
,005 ,000
,110 ,080
.ooo .ooo
.Ooo .Ooo ,000
,000 ,000 ,000 ,040 ,020
,010 ,000 ,000 ,000
.....
. on0
.ow ,000
-. 120 ,065 -. 120
-. 080 -. 070
,015 ,055
-. loo -. 070
.......
. 070 ,020 ,050 ,080 . 100
. loo ,180 ,030 .m ,020
,010 ,200 ,170 ,090 ,090
,120 090
,055 . 08C .07: .02: .03(
.03(
.01[
. OB( . 05(
. 03(
. 0%
.04( . 03(
.05(
. 11(
.01( . 00(
. 02(
. 00(
.09(
. 071
.031 . 071
, 211 . Mi1
..........
.n5(
.......... .01 .o( . 0(
.o(
.O1 .......... .......... .........
.o(
.a
.o:
.o( . 0:
~ . ~ . . ~ ~ . l ! . 0: .o: . o . 0: .o: .a . 11 .o: . 11 , 0!
.......... .04 .09 . 01
. 02
.00 ..........
. 01
.05
. M i
.04
.00
.......... .00 .00 .00 .00
.w
.00
.00
.05
. 01
.04
.04
42 ................. 43 ................. 44.-~. . ........ 45 ................
46 ................. 47 ................. 48.. ............... 49.. ............. 50.. ............
51 ............ 52- ................ 53.-- .~ . ~~
54 .................. 55 ...................
56 ............... 57 ...................
Summary of erosion rates, in foot per year Net erosion
0. 0183 ,0142
Pins Eros ion Deposilion Net erusiun I Pins Erosion 1-29 ....................... 0.0326 0.0116 0. 0210 I 4657 ....................... 0.0272 30-45 ........................ ,0197 ,0331 ,0034 1-57 ........................ ,0281

250 EROSION AND SEDIMENTATION IN A SEMIARID ENVIRONMENT
1961-64
Erosion Deposi- (It) tion (It)
___ ___
E.-Summary of data, iron-pin lines in Slopewash Tribtitaru, 1958-64
[Minus values in net-change column represent deposition rather than erosion] Rate
Erosion (ft per yr)
F.--Runt,mary of data, crosion-rtail lines in Coyote C. Arroyo, 1,!)61-64--cion tinued
1 _....__. 2 __...._. 3 __..___. 4 .---.... 5 ___..._ ~
6 .._..._. 7 ___..._. 8 ...... ~- 9 ........
IO.-. . ~. . . 11 --...-.. 12 -....... 13.----. . 14 ........
16 ...-.... 17 ...-. ... 18 ...-.. ~~
19...-~.--
15 .-...--.
1 1961-62 1 1961-63
0.085 ,060 ,055 ,065 ,050 ,065 ,060 .110 ,040 ,020 ,040 ,040 ,045 . Dti0
.040 ,060 .045 ,045
,050
1 _..._... 2 -.... ~. . 3.--. . . . ~
4.-. . . .- ~
5-..- .... 6.- .~. .-. ?-.-. ~. - ~
E.- . . . . . ~
9--. . ~ ~. . 10 ... ~. .~. 11 ... .~ ... lZ-. ~. . . . 13 ...-.--- 14-.-. . . ~. 15 ........
17 .-...... 18.. . . . ~ ~. 19..--...-
i6..-..---
Net hange, 95844
0.065 .055 ,070 ,065 .ow ,050 ,080 ,030 .055 ,060 ,050 ,035 . 140 .050 ,060
,060 ,055 ,080
,080
0.040 ,120 ,040 .020 .w0 .030 ,100 ,040
. 0.50 ,100 ,010
,010
__-___- O.m ,010 .m .OM) ,020 ,000 .OM) ,030
.OM)
.020 .ow
,000
0.000 .270 ,000 .OO0 .OO0 .ow
0. no0 ,000 ,030 ,000 ,040 ,000
Protrusion. in feet Pin Pin
~
1962
_- I963
__ 1964
-_ 1960
0.10 .16 .oo .12 .28 . I 3 . I 1 . I 2 .35 . I 2 . I 9
. I 6 -. 05
.15
. I 1
.20
. I 2
......
.~...~
__
0.12 .20 .w .50 . I 5 . I 2 .21 .35 . I 8 .15
.21 -. 10
. I 5
. I 6
.15
.13
on
..~...
. ~ . ~ ~ .
__
0. 10 .21 . 00 .07 .35 . I 6 .12 .32 .38 . I 7 .20
.21 -. 20
. I 5
.20
. 1 5
. I 6
......
~... .
0.10 . I 9 -_ 10 .I1 .53 . I 6 . I 2 .30
. I 8
. 20
.22 -. 17
. I 3
.17
.36
. I3
.50
...~..
......
-0.02 .07
-. 21 -. 15
.23
.IO . 00 I 21 . 29 .07 .06
.07 -. 21
.02
.06
.12
.02
.-..
. -....
20 .-.-... 0.070 0.000 0.075 0.000 0.100 21 -... . 1 ,060 1 . 000 1 ,060 1 .000 1 ,070
0.000 0.033 ,000 1 ,023
0. 09 .10 .04 . I 2 .22 . I 2 . I 3 .15 .27 . I 1 . I 6
.15
.02
.12
.12
. I 0
.I1
~ . ~ ~ .
~ . . .~
0. 12 .12 . I 1 . 26 .30 .06 . I 2 .09 .21 . I 1 . I 4
.15
.04
. I 1
.I1
.24
~.~ .... ..
Average net erosion ..... ~ ...-...... ~ . . .~ ..-.. ~ ....-... .. ~~ ..-. . ~. ..~. . 0.027 __
0.000 . 000 ,000 ,000 1020 , no0 ,055 ,000 ,010 . 010 ,000 ,000 . 000 ,000 ,000 ,000
. 000
. no0 . wn
Line BC 1 0. 100 ,080 ,090 ,075 .060 ,100 ,055 ,090 .055 ,030 ,060 ,070 ,055 ,070 .060 ,055 ,080 ,070 ,070
___
0.040 .om ,038 1030 ,023 .033 -. 011 .a21 ,020 ,010 ,020 ,022 .OB . 027
,020 ,027 ,023 ,025
. n22
0.120 ,085 . 115 ,090 .070 ,100
,070 ,060 ,030 .060 ,065 .070 ,080 .065 .060 .080 .070 .075
-. oin
0. on0 . 000 .ooo ,000 ,000 ,000 ,060 . 000 . 000 ,000 . 000 ,000 ,000 ,000 . IN0 . 000 ,000 ,000 . 000
0.000 ,000 ,000 ,000 ,000 ,000 ,025 .005 ,000 ,000 . 000 ,000 . 000 ,000 . 000 ,000 ,000 . 000 ,000
Average net erosion.. .. . ..-.... . . ~~. . ~. ... . ~ ~ .. - ~ . .. ~. ~ ~ ~. . .. . . . . ~. . . . . . 0.007"
F.--Sunbmary of datu, erosion-nail lines i , z Coyote C. Arroyo,
[Minus values in rate column represent deposition rather than erosion. Values in erosion columns do not include that erosion necessary to remove any deposition reported in previous years. Values in deposition columns represent data only for year of observation]
1961-64
Average net erosion. -. .. . . . . . ~. . . ~. ~. . . . . ~ ~. . ~. ~.. . ... ~ ..~. .. . . ~. ~. ~ 0.023
0.000 ,000 ,000
. 000 ,000
,015 .035 ,000 ,050 . 000 ,020 ,050 ,000 ,000 ,000 ,000 . 000 ,100 ,000
,130 ,020 ,000
. on0
. 000
,030
0.055 ,070 .060 ,040 ,050 ,050 ,060 .08O . I05 ,075 ,075 .135 ,070 ,065 .075 .090 .065 ,035 .085 ,075 ,100 ,065 ,055 .085 ,070
0. 000 ,000 . 000
,000 ,000
,075 ,000 ,000
,000 ,000 ,000 ,000 ,000 ,000 ,000 ,015 ,000 . 050 .000
,000 ,000
. 000
. 000
,000
. nfio
___
0.000 ,000 . 000 ,000 ,000 ,000 ,000 . 000 ,010 ,000 ,030 ,000 . 010 ,000 ,000 ,000 .a40 .000
,060 n00
. no0 ,050 ,110 .015 ,000
0.070 ,080 ,060 ,070
,080 ,070 . 020
. 130 ,060 ,120 ,060 ,075 ,075 ,110 ,075 .050 ,075 ,035 .060 ,070 ,015 .060 ,115
,050
105
0.023 ,027 .020 ,023 ,017 ,027 ,023 -. 018 ,035 . 043
,040 .020 ,025 ,025 ,037 ,025 ,017 . 020 012
,003 .023
-. 015 .020 ,038
,020
-
- 1961-63 1 1961-62 1961-64 I Rate
I- Erosion
Ut) Deposi- Erosion tion (It) I(ft per yr)
Deposi- tion (It)
Deposi- tion (ft)
_____ Line BA
0.000 ,005 . wo . w0 ,000 ,015 . 000 . 000 . MM) ,000 ,000 . 015 .coo . 000 ,010 . 000 . wo ,000 ,025
0. ow ,010 .ooo .ooo .m ,020 ,000 ,030 .Ooo .Ooo .Mw .ooo . 00u . 0ClO ,010 . 000 ,015 ,015 ,000
0. 095 ,070
.095 ,090 , 0 4 5 . 105 ,020 . 090 ,070 ,055 ,090 ,170 ,070 ,100 ,110 .050
,090
,070
,050 ~. ~.. . ~ .... 0. 021 . ~. . ~. . . . ~. ,0237
Average net erosion .. . . . . . . ~. . . . . ~. . ~. . . . ~ ~. . . . . . . . .. . . . . ~. Average net erosion for all 65 pins ... . .~.. . . . ~.. ~ .... ~.~ ~ . ~ . .
G.--Summerl/ of data, nail sectbons A d in Slopcrrush. l'ribiitur?/, l!)S-(i4 [Pin: LB. left bank; CL, renterline; RB, right bank]
1959-61 1963-64 19SS64 Rate 196142 1 1962-63 --- Deposi- tion (It)
_- Dcposi- tion (ft)
Section Pin __- Erosion
(f t ) Erosion (It per
yr) __-
0.013 ,073 ,021 ,024 ,012 .038
.02R
.038 ,012 .034
,071
. o m
Erosion Deposi- Ut) tion (ft)
Erosion ( f t )
Net change It per yr)
Deposi- tion (It per yr)
0. oon
. no0
,151 . 000
,036 .ooo ,043 . 126 .ooo .ow ,038 .w
Erosion (ft)
0. 020 ,060 ,000 ,030 ,020 ,010 ,030 ,000 .030 ,010 .ow .OM)
0.013 -. 078 ,021 ,024
,038 ,028
-. 098 ,038 ,012 -. 004
-. 024
. om
0.050
,035 .070 . 000 . 150 . 085 ,030 ,150 .m ,050
. in5
,060
0.000 ,285 .om . ow ,060 .ooo ,075 ,100 . 000 ,000 ,050 .ow
0.065 ,365 . 105 ,120 ,060 .I90 ,355 .140 ,190 ,060 ,170 .1w
0. 000 .755 .Ooo ,000 ,180 . 000 ,215 ,630 .ow .ooo ,190 .Ow
0. 000 ,190 .OM) .ooo . 100 . 000 ,060
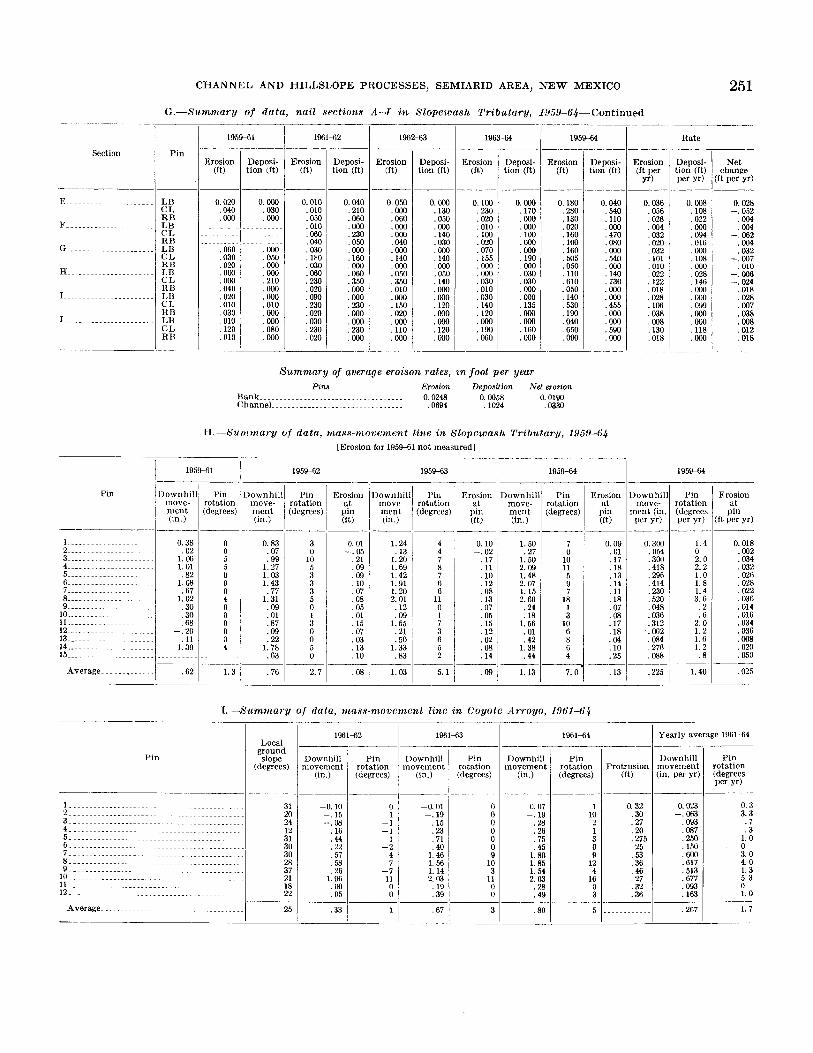
CHANNEL AND HLLLSLOPE PROCESSES, SEMIARID AREA, N E W MEXICO
G.--Summary of data, nail sections A 4 in SlopeuiaslL Tributary, 1!)59-64--Continued
Erosion (ft)
25 1
Deposi- tion (ft)
195%61
Erosion (It per
yr)
196142
Deposi- tion (It) per yr)
1962-63
Erosion (It)
1963-64
Deposi- tion (It)
Rate
,010 ,100 ,020 .070 . 155 .ooo .ooo ,030 ,010 .030 ,140 ,120
1 9 5 9 4
,000 ,100 . O M ) .OOO . 190 .ooo ,030 ,030 .coo ,000 ,135 .OM)
__-
Deposi- tion (ft)
Pin rotation (degrees per yr)
1.4 0 2.0 2.2 1 .0 1. 8 1.4 3.6
. 2
. 6 2.0 1.2
1.2 . 8
1.40
1.6
__- Deposi- tion (It)
______ Erosion
a t pin
(ft per yr) __-___
0.018 ,002 ,034 ,032 . 0% ,028 .022 .036 ,014 ,016 ,034 ,036
,020 ,050
,025
. con
___-
I Pin
Section
3 n
10 5 3 3 3
0 5
- _ _ ~ _ 0. 01 -. 05 .21 .09 .09 .10 .07
.05
. on
Erosion (It)
Erosion (ft)
Net change
f t per yr)
Deposi- tion (It)
L 13 CL RR L R C L RR L R C L R E LB C I, R R LI$ CL RR LB C L R I3
0.020 ,040 ,000
~ . . .~ . .~. .~ .... . ~ ~ ~ ~ . ~ .
,060 ,030 ,020 . 000 ,000 ,040 ,020 ,010 ,030 ,010 ,120 ,010
0. OM) ,030 . 000
~. . .~ .~. ~~ ~....
~. ,000 .050 .ooo .000 .210 . OW ,000 ,010 .ooo ,000
.OM)
. on0
0.050 .wo ,060 . 000 .wo ,040 .ooo . 140 .wo ,050 ,350 ,010 .om ,150 .020 .ooo ,110 ,000
0. 000 ,130 ,050 .wo ,140 ,030 ,000 . 140 . 000 .050 .140 .ooo ,000 ,120 . 000 .OM) ,120 ,000
0. in0 . 2no ,130 ,020 ,160 . 100 .160 ,505
,110 .610 .050 ,140 ,530 ,190 ,040 .650 ,090
,050
0.040 ,540 ,110 ,000 .470 ,080 .wo . s o ,000 . 140 ,730 ,000 ,000 ,455 .ooo .OM) ,590 .ooo
0.028 -. 052 ,004 ,004 -. 062 . on4 ,032
-_ 007 ,010
-. 006 -. 024
,028 ,007 ,038 ,008 ,012
. oin
. oin .OOo .ooo ,190 I ,160 ,060 .WO
Summary of average eroison rates, i n foot per year Pina Erosion Deposition Net erosion
Bank ~~~ 0.0248 0.0058 0. O l e o Channel- ~ ~ ~. . . . . . . . . . ~ .. ~. .. ~ .0330 ~ .. . . . . . . ,0694 . 1024
H.--rV?mlt)lary of data, mass-?novc?ncnt lithe in Slopewash Tributary, 1969-6'4 [Erosion for 1959-61 not measured]
- I 1959-61 1959-62 1959-64 1959-63 - I-
Pin / I )ownhil move- ment
Pin rotation (degrees)
)ownhi: move-
oent (in per yr) __
0.300 ,054 ,300 .418 ,296 ,414 ,230 ,520
.036 ,312
' . W 2 . on4 ,276
,048
. on8
Pin Erosion Downhil rotation move- (degrees) ~ $I ~ ment
Pin rotation (degrees)
0 0 5 5 0 0 0 4 0 0 0 0 0 4
. . ~ ~ ~ ~ . .
h w n h i l move- ment (in.)
~-
0. n3 .07 .99
1.27 1.03 1.43 .77
1.31 .09 . 01
.09
.22 1.78 .63
.n7
)ownhi1 move- ment (in.)
1.24 .13
1.20 1.69 1.42 1.91 1.20 2.01 .12 .09
1.55 .21 .50
1.33 .83
1.50 .27
1.50 2.09 1.48 2. 07 1. 15 2. 60 .24
1. 56 . 01 .42
.44
. i n
1.38
7 0
10 11 5 9 7
18 1 3
10 6 8 6 4
0.09 . 01 .17 .18 ,13 .14 . 11 .18 .07 .on .17
.04
.10
.25
. i n
0. 10 -. 02 .17 . l l .10 .12
. 13
.07
.05
.15
.12
.02
.08
.14
.09
. on
_____ 1.3 .76 2.71 .08 1.03 1.13 7. 0 ,225
I.-Sunznzary of data, mass-movcmcnt line in L'ogote Arrogo, 1 9 6 1 4 4 -
Yearly average 1961-64 Local
ground slope
(degrees)
1961-62 I 196143 196144
Pin rotation (degrees)
Downhill movement
(in.)
Ilownhill movement (in. per yr)
Pin rotation (degrees per yr)
Pin
I - - - ___ 0.023 -. w . w3 ,087 ,250 . 150 ,600 .617 ,513 ,677 .og3 ,163
0. 3 3.3
. 7
. 3 1. 0 0 3. 0 4. 0 1. 3 5. 3 0 1.0
31 20
-0.01 -. 19 .15 .x( .71 .40
1.46 1. 56 1. 14 2. 03 .19 .39
0 0 0 0 0 0 9
10 3
11 0 0
-0.10 -. 15 - . O R . 16
.44
.22
.57
.58
.26 1.96 .00 .05
0 1
-1 -1
1 -2
4 7
-7 11 0 0
0. 07 -. 19
.28
.26
.75
.45 1. 80 1. 85 1.54 2.03
.28
.49
24 12 31 30 30 28 37 21 18 22
25 33 1 I .67 I 3 . no ,267 1. 7
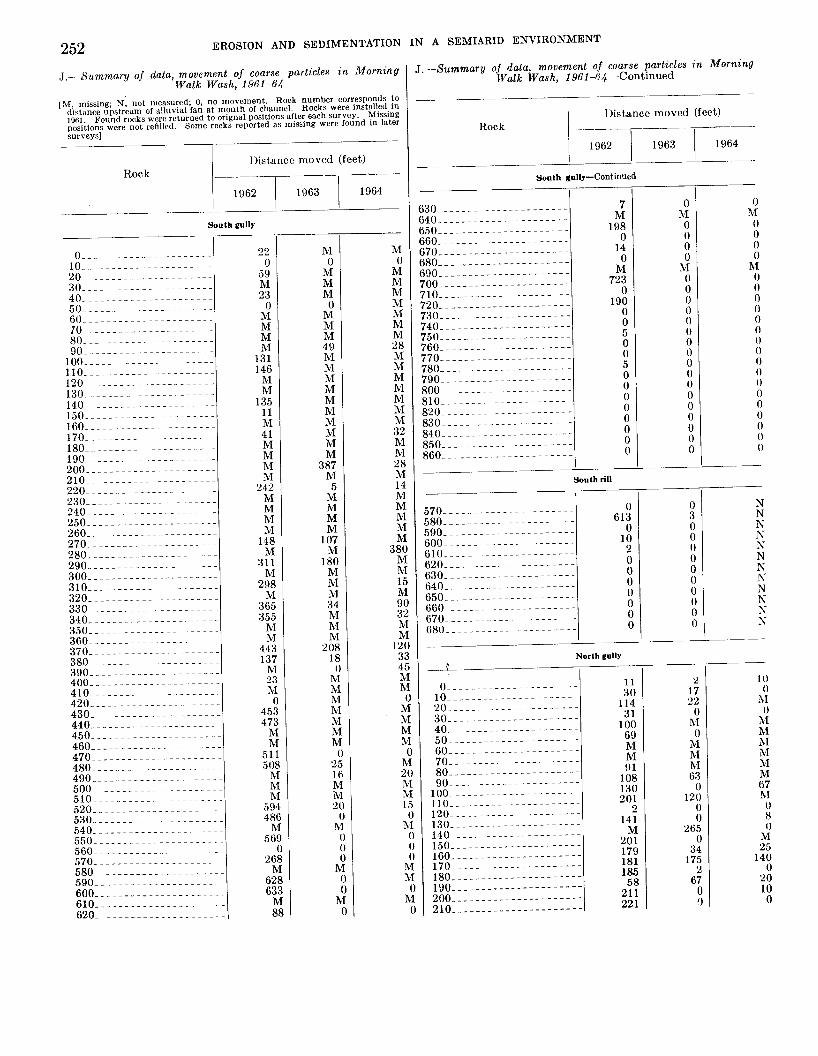
EROSION AND SEDIMENTATION IN A SEMIARID ENVIRONMENT
Rock
J.-Summary of data, movement of coarse particles in Morning Walk Wash, 1961-64
Ilistance moved (feet)
1962 1 1963 I 1964
_- __-_____
M 0
M M M 0
M M M 49 M M M M M M M M M M
387 M 5
M M M M
107 M
18C M M M 3 4
N N N
2 0t l !
R.
h R R n n 2 1 P i- 2
I
I
n
0 0
M 0 0 M
0
South gully
I
2 17 2% 0 ni 0
IM M h l 63 0
120 0 0
265 0
34 175
2 67
0 3
22 0
59 M 23
0 M M M M
131 146
M M
135 11 M 41 M M M M
242 M M M M
148 M
311 M
298 M
365 355
M M
443 137 M 2: N
( 45: 47:
N h
51 5 0 R
n 5 9 48 n 56
26 P
62 62
I I
n
1 0 0
AI 0
M M AI IM h1 M t17 hI 0 8 0 M 25
140 0
20 10 0
M 0 A4 M M M M M M 28 M M M M
M M 3: M N 2f N I f N iv N h 1L
381 n 1 R 9 3 n pl
12 3 4
1
I I 1
ng
n
r
-Summary of data, movement of coarse partirles in Morning Walk Wash, 1961-64-Continued
Distance moved (feet)
T q 1963 I 79iY- Rock
South gully-Continued
7 M
198 0
14 0
M 723
0 190
0 0 5 0 0 5 0 0 0 0 0 0 0 0
0 M 0 0 0 0
M 0 0 0 0 0 0 0 0 0 0 0 0 0 0 0 0 0
0 3 0
0 hl 0 0 0 0
M 0 0 0 0 0 0 0 0 0 0 0 0 0 0 0 0 0
N N N N N N N N N iX hT N
I

C H A N N E L A N D HILLSLOPE PROCESSES, S E M I A R I D AREA, N E W M E X I C O
J.-Summary of data, movement of coarse particles i n Morning Walk Wash, 196'1-64-Continued
c Rock
253
Distance moved (feet)
1962 1 1963 1 1964
__ __
North gully-Contlnued
45 24 1
M M 0 0
291 291 168 321
5 0
M M 0
M M 0
M M 0 0 0
36 0 8
66 0 0 0
20 0 0 0 0 0 0 0 0 0 0 0 0 0 0
M 6
3.55 M 0 1
11 76
5
0 0
M M M M M 0
M 0 0 0 0 0 0 0 0 0 0 0 0 0 0 0 0 0 0 0 0 0 0 0 0 0
ni
ni
200 0
14 M 0 0 3
10 0
hT 8 0
M M M M M 0
M hi 0 0 0 0
hl 0 0 0 0 0 n 0 0 0 0 0 0 0 0 0 0 0 0 0 0
* U S . GOVERNMENT PRINTING OFFICE: 1967 0-275-816