highlights - segal marco advisors · world equity markets rose in the fourth quarter (q4) of 2015....
TRANSCRIPT
Review of Fourth Quarter 2015
Investment Synopsis is a quarterly publication produced by Segal Rogerscasey’s Investment Research Group. If you have questions about the content of Investment Synopsis, contact one of the following experts:
Tim Barron Chief Investment Officer 203.621.3633 [email protected]
John Ross Head of Beta Research 203.621.3660 [email protected]
Alan Kosan Head of Alpha Research 203.621.3650 [email protected]
Highlights Highlights of financial market performance discussed in this issue of Investment Synopsis include the following:
World equity markets rose in the fourth quarter (Q4) of 2015. U.S. equity outperformed non-U.S. equity and emerging market equity on both a quarterly and yearly basis. (See “U.S. Equities” on pages 7 and 8, “Non-U.S. Equities” on page 9 and “Emerging Market Equities” on page 10.)
U.S. fixed income and non-U.S. fixed income fell in Q4. The U.S. finished 2015 in positive territory, while international fixed income declined. (See “U.S. Fixed Income” on pages 11 and 12 and “Non-U.S. Fixed Income” on page 13.)
Commodities ended Q4 and 2015 in negative territory. (See “Commodities” on page 14.)
Hedge funds gained in Q4, but fell for the year. (See “Hedge Funds” on page 15.)
Private equity funds for all regions posted gains in Q2 2015 (the most recent data available). Over a 20-year period, all private equity, venture capital and buyout funds have generated double-digit returns. (See “Private Equity” on page 16.)
Private real estate and public real estate gained. (See “Real Estate” on pages 17 and 18.)
The last section of Investment Synopsis, which begins on page 19, discusses four additional developments that Segal Rogerscasey believes are noteworthy for investors.
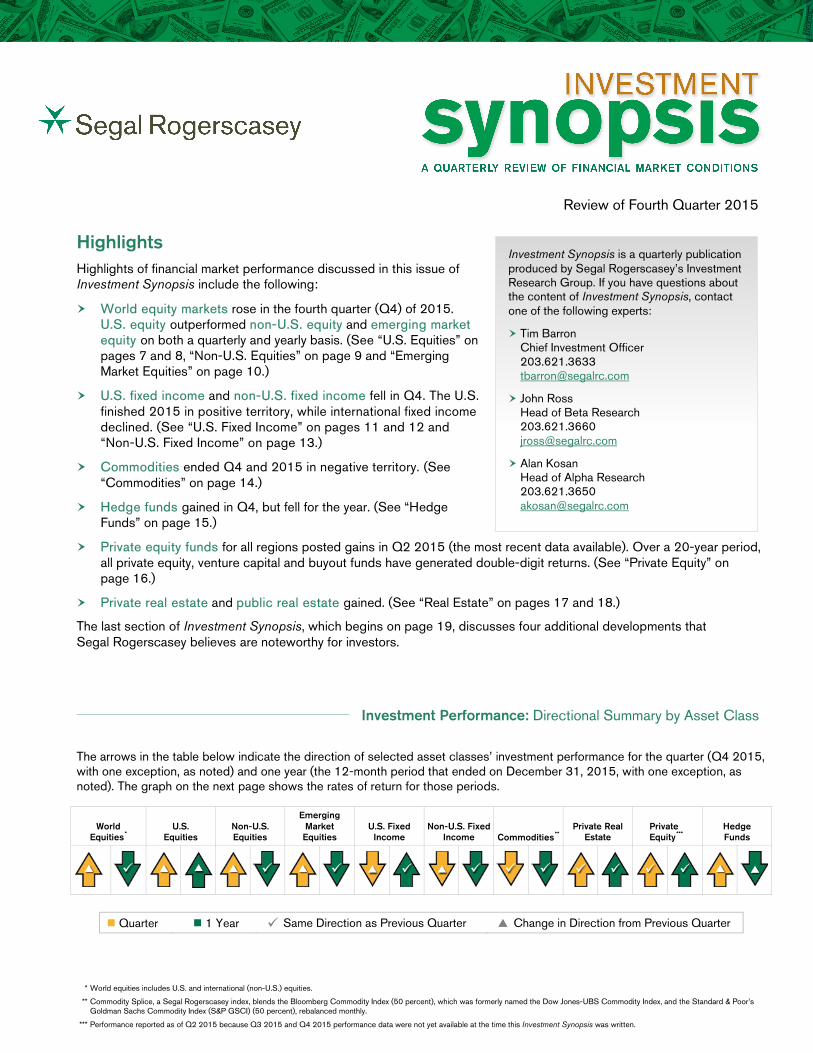
Investment Performance: Directional Summary by Asset Class
The arrows in the table below indicate the direction of selected asset classes’ investment performance for the quarter (Q4 2015, with one exception, as noted) and one year (the 12-month period that ended on December 31, 2015, with one exception, as noted). The graph on the next page shows the rates of return for those periods.
World Equities*
U.S. Equities
Non-U.S. Equities
Emerging Market Equities
U.S. Fixed Income
Non-U.S. Fixed Income Commodities**
Private Real Estate
Private Equity***
Hedge Funds
Quarter 1 Year Same Direction as Previous Quarter Change in Direction from Previous Quarter
* World equities includes U.S. and international (non-U.S.) equities.
** Commodity Splice, a Segal Rogerscasey index, blends the Bloomberg Commodity Index (50 percent), which was formerly named the Dow Jones-UBS Commodity Index, and the Standard & Poor’s Goldman Sachs Commodity Index (S&P GSCI) (50 percent), rebalanced monthly.
*** Performance reported as of Q2 2015 because Q3 2015 and Q4 2015 performance data were not yet available at the time this Investment Synopsis was written.

Investment Synopsis Review of Q4 2015 page 2
Investment Performance: Summary by Asset Class This section provides data on investment performance for select market indices mostly for Q4 2015.
Asset Class Summary: Quarter-to-Date (QTD) and One-Year Returns
* World equities includes U.S. and international (non-U.S.) equities.
** Commodity Splice, a Segal Rogerscasey index, blends the Bloomberg Commodity Index (50 percent) and the S&P GSCI (50 percent), rebalanced monthly.
*** Performance reported as of Q2 2015 because Q3 2015 and Q4 2015 performance data were not yet available at the time this Investment Synopsis was written.
Asset Class Indices QTD 1 Year 3 Year 5 Year 10 Year
Equities MSCI World (Net of dividends)* 5.50 -0.87 9.63 7.59 4.98
Russell 3000 6.27 0.48 14.74 12.18 7.35
MSCI EAFE** (Net of dividends) 4.71 -0.81 5.01 3.60 3.03
MSCI EM (Net of dividends) 0.66 -14.92 -6.76 -4.81 3.61
Fixed Income Barclays Capital Aggregate -0.57 0.55 1.44 3.25 4.51
Citigroup Non-U.S. WGBI (Unhedged) -1.38 -5.54 -4.27 -1.30 3.05
Other Commodity Splice*** -13.58 -28.76 -20.50 -14.33 -8.50
NCREIF NPI 2.91 13.33 12.04 12.18 7.76
Thomson Reuters Private Equity**** 5.07 10.68 16.10 15.35 12.06
HFRI Fund of Funds Composite 0.73 -0.26 3.95 2.10 2.27
* World equities includes U.S. and international (non-U.S.) equities.
** “EAFE” is an abbreviation for Europe, Australasia and Far East.
*** Commodity Splice, a Segal Rogerscasey index, blends the Bloomberg Commodity Index (50 percent) and the S&P GSCI (50 percent), rebalanced monthly.
**** Performance reported as of Q2 2015 because Q3 2015 and Q4 2015 performance data were not yet available at the time this Investment Synopsis was written.
Sources: eVestment Alliance, Hueler Analytics, Thomson One, Hedge Fund Research, Inc. and InvestmentMetrics
-30%
-25%
-20%
-15%
-10%
-5%
0%
5%
10%
15%
WorldEquities*
U.S.Equities
Non-U.S.Equities
EmergingMarketEquities
U.S.Fixed
Income
Non-U.S.Fixed
Income
Commodities** Real Estate PrivateEquity***
Funds ofHedgeFunds
QTD 1 Year
Investment Synopsis Review of Q4 2015 page 3
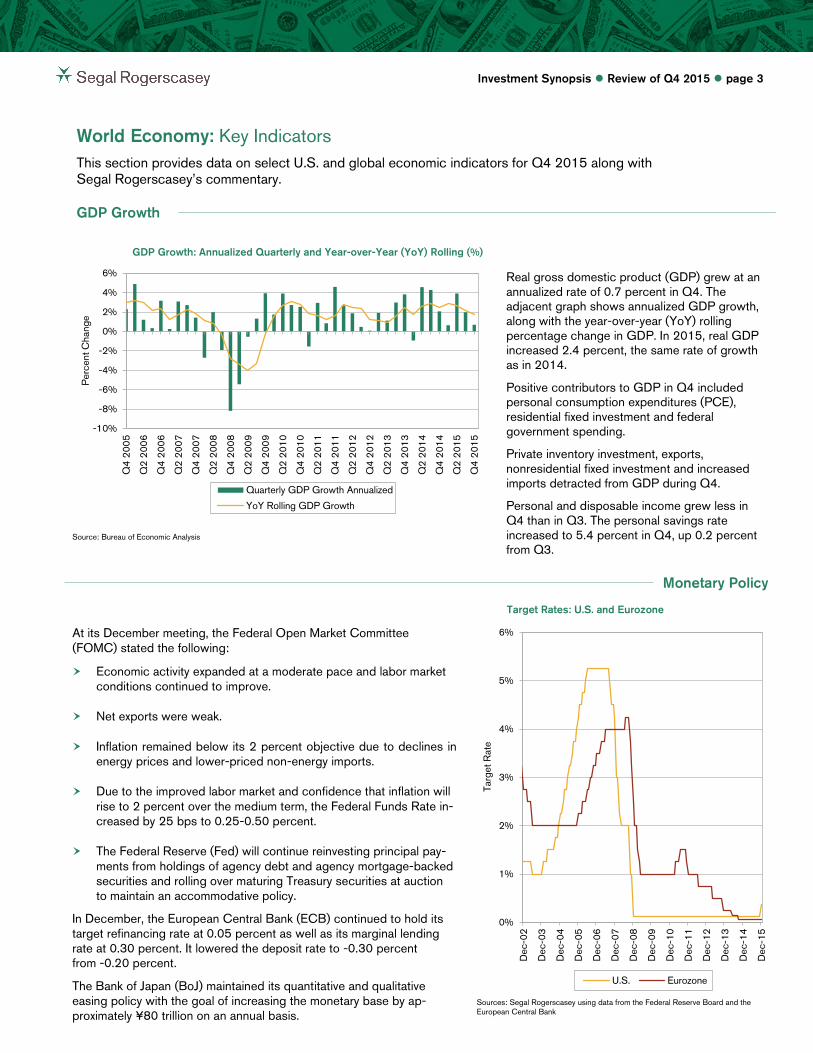
World Economy: Key Indicators This section provides data on select U.S. and global economic indicators for Q4 2015 along with Segal Rogerscasey’s commentary.
GDP Growth
GDP Growth: Annualized Quarterly and Year-over-Year (YoY) Rolling (%)
Source: Bureau of Economic Analysis
Real gross domestic product (GDP) grew at an annualized rate of 0.7 percent in Q4. The adjacent graph shows annualized GDP growth, along with the year-over-year (YoY) rolling percentage change in GDP. In 2015, real GDP increased 2.4 percent, the same rate of growth as in 2014.
Positive contributors to GDP in Q4 included personal consumption expenditures (PCE), residential fixed investment and federal government spending.
Private inventory investment, exports, nonresidential fixed investment and increased imports detracted from GDP during Q4.
Personal and disposable income grew less in Q4 than in Q3. The personal savings rate increased to 5.4 percent in Q4, up 0.2 percent from Q3.
Monetary Policy
At its December meeting, the Federal Open Market Committee (FOMC) stated the following: Economic activity expanded at a moderate pace and labor market
conditions continued to improve.
Net exports were weak.
Inflation remained below its 2 percent objective due to declines in energy prices and lower-priced non-energy imports.
Due to the improved labor market and confidence that inflation will rise to 2 percent over the medium term, the Federal Funds Rate in-creased by 25 bps to 0.25-0.50 percent.
The Federal Reserve (Fed) will continue reinvesting principal pay-ments from holdings of agency debt and agency mortgage-backed securities and rolling over maturing Treasury securities at auction to maintain an accommodative policy.
In December, the European Central Bank (ECB) continued to hold its target refinancing rate at 0.05 percent as well as its marginal lending rate at 0.30 percent. It lowered the deposit rate to -0.30 percent from -0.20 percent.
The Bank of Japan (BoJ) maintained its quantitative and qualitative easing policy with the goal of increasing the monetary base by ap-proximately ¥80 trillion on an annual basis.
Sources: Segal Rogerscasey using data from the Federal Reserve Board and the European Central Bank
-10%
-8%
-6%
-4%
-2%
0%
2%
4%
6%
Q4
2005
Q2
2006
Q4
2006
Q2
2007
Q4
2007
Q2
2008
Q4
2008
Q2
2009
Q4
2009
Q2
2010
Q4
2010
Q2
2011
Q4
2011
Q2
2012
Q4
2012
Q2
2013
Q4
2013
Q2
2014
Q4
2014
Q2
2015
Q4
2015
Per
cent
Cha
nge
Quarterly GDP Growth Annualized
YoY Rolling GDP Growth
0%
1%
2%
3%
4%
5%
6%
Dec
-02
Dec
-03
Dec
-04
Dec
-05
Dec
-06
Dec
-07
Dec
-08
Dec
-09
Dec
-10
Dec
-11
Dec
-12
Dec
-13
Dec
-14
Dec
-15
Targ
et R
ate
U.S. Eurozone
Target Rates: U.S. and Eurozone
Investment Synopsis Review of Q4 2015 page 4
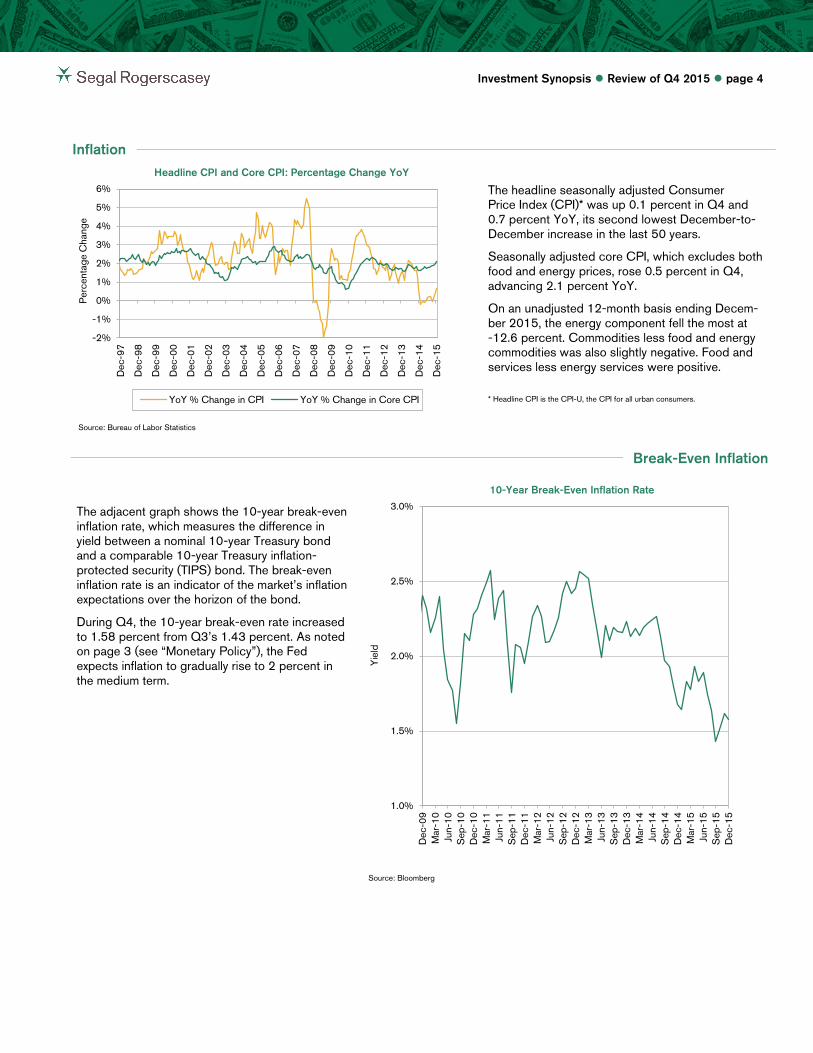
Inflation
Headline CPI and Core CPI: Percentage Change YoY
Source: Bureau of Labor Statistics
The headline seasonally adjusted Consumer Price Index (CPI)* was up 0.1 percent in Q4 and 0.7 percent YoY, its second lowest December-to-December increase in the last 50 years.
Seasonally adjusted core CPI, which excludes both food and energy prices, rose 0.5 percent in Q4, advancing 2.1 percent YoY.
On an unadjusted 12-month basis ending Decem-ber 2015, the energy component fell the most at -12.6 percent. Commodities less food and energy commodities was also slightly negative. Food and services less energy services were positive.
* Headline CPI is the CPI-U, the CPI for all urban consumers.
Break-Even Inflation
10-Year Break-Even Inflation Rate
The adjacent graph shows the 10-year break-even inflation rate, which measures the difference in yield between a nominal 10-year Treasury bond and a comparable 10-year Treasury inflation-protected security (TIPS) bond. The break-even inflation rate is an indicator of the market’s inflation expectations over the horizon of the bond.
During Q4, the 10-year break-even rate increased to 1.58 percent from Q3’s 1.43 percent. As noted on page 3 (see “Monetary Policy”), the Fed expects inflation to gradually rise to 2 percent in the medium term.
Source: Bloomberg
-2%
-1%
0%
1%
2%
3%
4%
5%
6%
Dec
-97
Dec
-98
Dec
-99
Dec
-00
Dec
-01
Dec
-02
Dec
-03
Dec
-04
Dec
-05
Dec
-06
Dec
-07
Dec
-08
Dec
-09
Dec
-10
Dec
-11
Dec
-12
Dec
-13
Dec
-14
Dec
-15
Per
cent
age
Cha
nge
YoY % Change in CPI YoY % Change in Core CPI
1.0%
1.5%
2.0%
2.5%
3.0%
Dec
-09
Mar
-10
Jun-
10S
ep-1
0D
ec-1
0M
ar-1
1Ju
n-11
Sep
-11
Dec
-11
Mar
-12
Jun-
12S
ep-1
2D
ec-1
2M
ar-1
3Ju
n-13
Sep
-13
Dec
-13
Mar
-14
Jun-
14S
ep-1
4D
ec-1
4M
ar-1
5Ju
n-15
Sep
-15
Dec
-15
Yie
ld
Investment Synopsis Review of Q4 2015 page 5
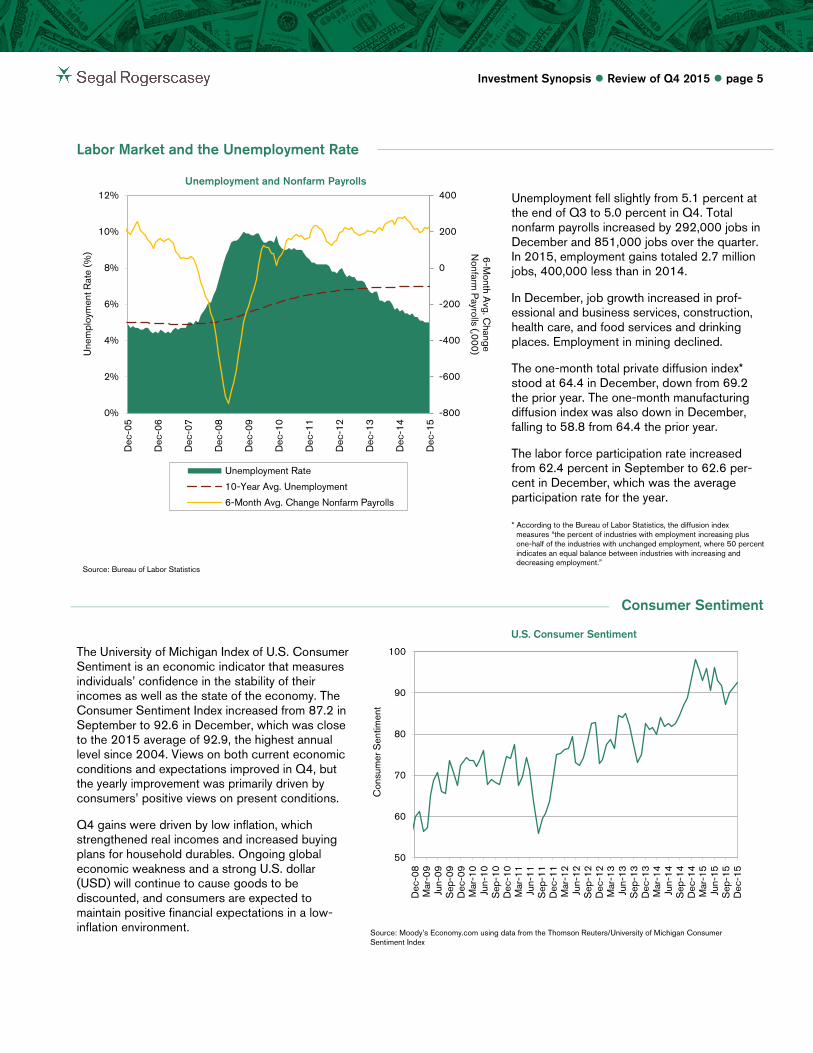
Labor Market and the Unemployment Rate
Source: Bureau of Labor Statistics
Unemployment fell slightly from 5.1 percent at the end of Q3 to 5.0 percent in Q4. Total nonfarm payrolls increased by 292,000 jobs in December and 851,000 jobs over the quarter. In 2015, employment gains totaled 2.7 million jobs, 400,000 less than in 2014.
In December, job growth increased in prof-essional and business services, construction, health care, and food services and drinking places. Employment in mining declined.
The one-month total private diffusion index* stood at 64.4 in December, down from 69.2 the prior year. The one-month manufacturing diffusion index was also down in December, falling to 58.8 from 64.4 the prior year.
The labor force participation rate increased from 62.4 percent in September to 62.6 per-cent in December, which was the average participation rate for the year.
* According to the Bureau of Labor Statistics, the diffusion index measures “the percent of industries with employment increasing plus one-half of the industries with unchanged employment, where 50 percent indicates an equal balance between industries with increasing and decreasing employment.”
Consumer Sentiment
U.S. Consumer Sentiment
The University of Michigan Index of U.S. Consumer Sentiment is an economic indicator that measures individuals’ confidence in the stability of their incomes as well as the state of the economy. The Consumer Sentiment Index increased from 87.2 in September to 92.6 in December, which was close to the 2015 average of 92.9, the highest annual level since 2004. Views on both current economic conditions and expectations improved in Q4, but the yearly improvement was primarily driven by consumers’ positive views on present conditions.
Q4 gains were driven by low inflation, which strengthened real incomes and increased buying plans for household durables. Ongoing global economic weakness and a strong U.S. dollar (USD) will continue to cause goods to be discounted, and consumers are expected to maintain positive financial expectations in a low-inflation environment.
Source: Moody’s Economy.com using data from the Thomson Reuters/University of Michigan Consumer Sentiment Index
-800
-600
-400
-200
0
200
400
0%
2%
4%
6%
8%
10%
12%
Dec
-05
Dec
-06
Dec
-07
Dec
-08
Dec
-09
Dec
-10
Dec
-11
Dec
-12
Dec
-13
Dec
-14
Dec
-15
6-Month A
vg. Change
Nonfarm
Payrolls (,000) U
nem
ploy
men
t Rat
e (%
)
Unemployment Rate
10-Year Avg. Unemployment
6-Month Avg. Change Nonfarm Payrolls
50
60
70
80
90
100
Dec
-08
Mar
-09
Jun-
09S
ep-0
9D
ec-0
9M
ar-1
0Ju
n-10
Sep
-10
Dec
-10
Mar
-11
Jun-
11S
ep-1
1D
ec-1
1M
ar-1
2Ju
n-12
Sep
-12
Dec
-12
Mar
-13
Jun-
13S
ep-1
3D
ec-1
3M
ar-1
4Ju
n-14
Sep
-14
Dec
-14
Mar
-15
Jun-
15S
ep-1
5D
ec-1
5
Con
sum
er S
entim
ent
Unemployment and Nonfarm Payrolls
Investment Synopsis Review of Q4 2015 page 6
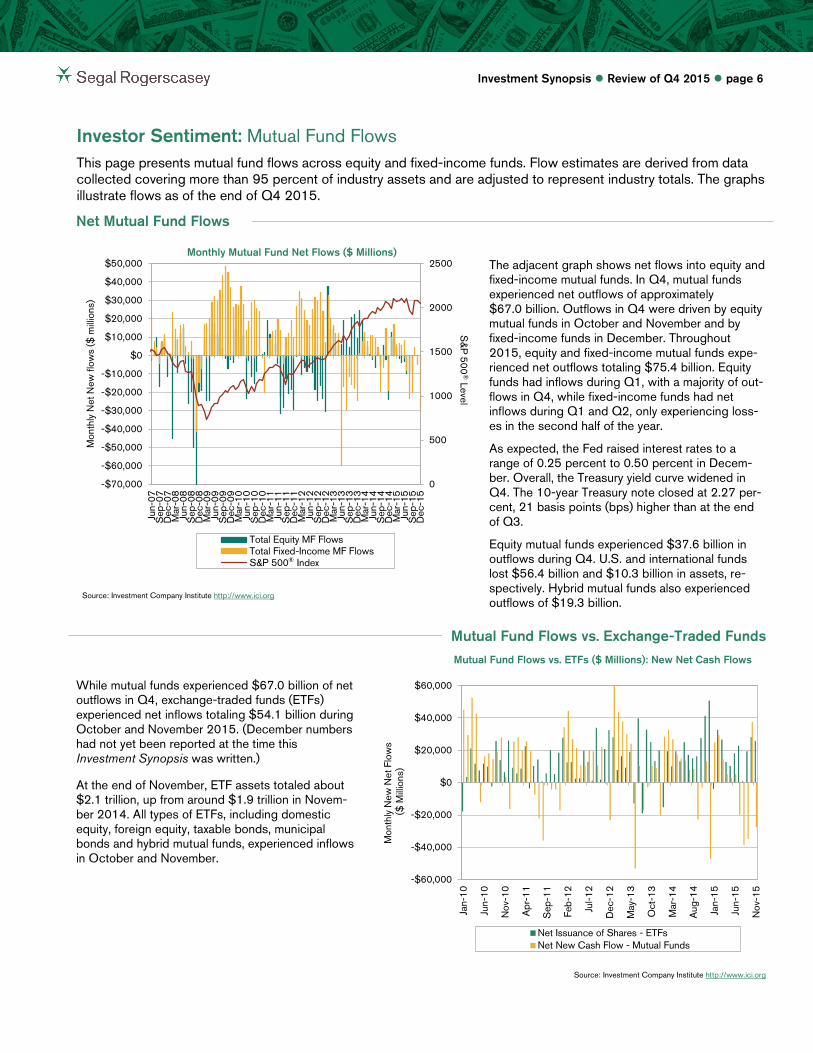
Investor Sentiment: Mutual Fund Flows This page presents mutual fund flows across equity and fixed-income funds. Flow estimates are derived from data collected covering more than 95 percent of industry assets and are adjusted to represent industry totals. The graphs illustrate flows as of the end of Q4 2015.
Net Mutual Fund Flows
Source: Investment Company Institute http://www.ici.org
The adjacent graph shows net flows into equity and fixed-income mutual funds. In Q4, mutual funds experienced net outflows of approximately $67.0 billion. Outflows in Q4 were driven by equity mutual funds in October and November and by fixed-income funds in December. Throughout 2015, equity and fixed-income mutual funds expe-rienced net outflows totaling $75.4 billion. Equity funds had inflows during Q1, with a majority of out-flows in Q4, while fixed-income funds had net inflows during Q1 and Q2, only experiencing loss-es in the second half of the year.
As expected, the Fed raised interest rates to a range of 0.25 percent to 0.50 percent in Decem-ber. Overall, the Treasury yield curve widened in Q4. The 10-year Treasury note closed at 2.27 per-cent, 21 basis points (bps) higher than at the end of Q3.
Equity mutual funds experienced $37.6 billion in outflows during Q4. U.S. and international funds lost $56.4 billion and $10.3 billion in assets, re-spectively. Hybrid mutual funds also experienced outflows of $19.3 billion.
Mutual Fund Flows vs. Exchange-Traded Funds
Mutual Fund Flows vs. ETFs ($ Millions): New Net Cash Flows
While mutual funds experienced $67.0 billion of net outflows in Q4, exchange-traded funds (ETFs) experienced net inflows totaling $54.1 billion during October and November 2015. (December numbers had not yet been reported at the time this Investment Synopsis was written.)
At the end of November, ETF assets totaled about $2.1 trillion, up from around $1.9 trillion in Novem-ber 2014. All types of ETFs, including domestic equity, foreign equity, taxable bonds, municipal bonds and hybrid mutual funds, experienced inflows in October and November.
Source: Investment Company Institute http://www.ici.org
0
500
1000
1500
2000
2500
-$70,000
-$60,000
-$50,000
-$40,000
-$30,000
-$20,000
-$10,000
$0
$10,000
$20,000
$30,000
$40,000
$50,000
Jun-
07S
ep-0
7D
ec-0
7M
ar-0
8Ju
n-08
Sep
-08
Dec
-08
Mar
-09
Jun-
09S
ep-0
9D
ec-0
9M
ar-1
0Ju
n-10
Sep
-10
Dec
-10
Mar
-11
Jun-
11S
ep-1
1D
ec-1
1M
ar-1
2Ju
n-12
Sep
-12
Dec
-12
Mar
-13
Jun-
13S
ep-1
3D
ec-1
3M
ar-1
4Ju
n-14
Sep
-14
Dec
-14
Mar
-15
Jun-
15S
ep-1
5D
ec-1
5
S&
P 500
® Level
Mon
thly
Net
New
flow
s ($
mill
ions
)
Total Equity MF FlowsTotal Fixed-Income MF FlowsS&P 500 Index
-$60,000
-$40,000
-$20,000
$0
$20,000
$40,000
$60,000
Jan-
10
Jun-
10
Nov
-10
Apr
-11
Sep
-11
Feb-
12
Jul-1
2
Dec
-12
May
-13
Oct
-13
Mar
-14
Aug
-14
Jan-
15
Jun-
15
Nov
-15
Mon
thly
New
Net
Flo
ws
($ M
illio
ns)
Net Issuance of Shares - ETFsNet New Cash Flow - Mutual Funds
Monthly Mutual Fund Net Flows ($ Millions)
®
Investment Synopsis Review of Q4 2015 page 7
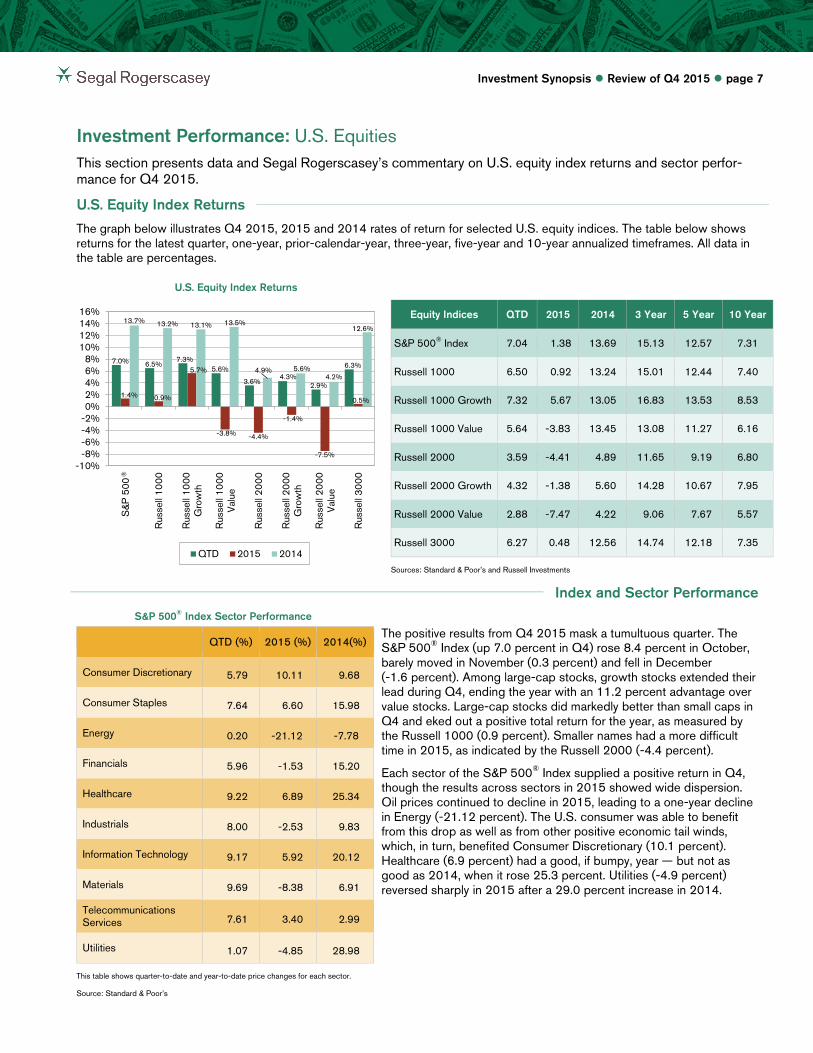
Investment Performance: U.S. Equities This section presents data and Segal Rogerscasey’s commentary on U.S. equity index returns and sector perfor-mance for Q4 2015.
U.S. Equity Index Returns
The graph below illustrates Q4 2015, 2015 and 2014 rates of return for selected U.S. equity indices. The table below shows returns for the latest quarter, one-year, prior-calendar-year, three-year, five-year and 10-year annualized timeframes. All data in the table are percentages.
U.S. Equity Index Returns
Equity Indices QTD 2015 2014 3 Year 5 Year 10 Year
S&P 500® Index 7.04 1.38 13.69 15.13 12.57 7.31 Russell 1000 6.50 0.92 13.24 15.01 12.44 7.40 Russell 1000 Growth 7.32 5.67 13.05 16.83 13.53 8.53 Russell 1000 Value 5.64 -3.83 13.45 13.08 11.27 6.16 Russell 2000 3.59 -4.41 4.89 11.65 9.19 6.80 Russell 2000 Growth 4.32 -1.38 5.60 14.28 10.67 7.95 Russell 2000 Value 2.88 -7.47 4.22 9.06 7.67 5.57 Russell 3000 6.27 0.48 12.56 14.74 12.18 7.35 Sources: Standard & Poor’s and Russell Investments
Index and Sector Performance
S&P 500® Index Sector Performance
The positive results from Q4 2015 mask a tumultuous quarter. The S&P 500® Index (up 7.0 percent in Q4) rose 8.4 percent in October, barely moved in November (0.3 percent) and fell in December (-1.6 percent). Among large-cap stocks, growth stocks extended their lead during Q4, ending the year with an 11.2 percent advantage over value stocks. Large-cap stocks did markedly better than small caps in Q4 and eked out a positive total return for the year, as measured by the Russell 1000 (0.9 percent). Smaller names had a more difficult time in 2015, as indicated by the Russell 2000 (-4.4 percent).
Each sector of the S&P 500® Index supplied a positive return in Q4, though the results across sectors in 2015 showed wide dispersion. Oil prices continued to decline in 2015, leading to a one-year decline in Energy (-21.12 percent). The U.S. consumer was able to benefit from this drop as well as from other positive economic tail winds, which, in turn, benefited Consumer Discretionary (10.1 percent). Healthcare (6.9 percent) had a good, if bumpy, year — but not as good as 2014, when it rose 25.3 percent. Utilities (-4.9 percent) reversed sharply in 2015 after a 29.0 percent increase in 2014.
QTD (%) 2015 (%) 2014(%)
Consumer Discretionary 5.79 10.11 9.68 Consumer Staples 7.64 6.60 15.98 Energy 0.20 -21.12 -7.78 Financials 5.96 -1.53 15.20 Healthcare 9.22 6.89 25.34 Industrials 8.00 -2.53 9.83 Information Technology 9.17 5.92 20.12 Materials 9.69 -8.38 6.91 Telecommunications Services 7.61 3.40 2.99 Utilities 1.07 -4.85 28.98 This table shows quarter-to-date and year-to-date price changes for each sector.
Source: Standard & Poor’s
7.0% 6.5% 7.3%
5.6%
3.6% 4.3%
2.9%
6.3%
1.4% 0.9%
5.7%
-3.8% -4.4%
-1.4%
-7.5%
0.5%
13.7% 13.2% 13.1% 13.5%
4.9% 5.6% 4.2%
12.6%
-10%-8%-6%-4%-2%0%2%4%6%8%
10%12%14%16%
S&P
500
Rus
sell
1000
Rus
sell
1000
Gro
wth
Rus
sell
1000
Val
ue
Rus
sell
2000
Rus
sell
2000
Gro
wth
Rus
sell
2000
Val
ue
Rus
sell
3000
QTD 2015 2014
®

Investment Synopsis Review of Q4 2015 page 8
Equity Market Earnings and Volatility
S&P 500® Index: Earnings Per Share and Growth of $1.00
The adjacent graph compares the earnings per share of companies in the S&P 500® Index and the growth of $1.00 since December 1989. While earnings per share growth does not align perfectly with the growth of stock prices, there does appear to be a directional linkage, which is something upon which many investors count.
Earnings are perhaps the single most studied metric in a company’s financial statements because they show a company’s profitability. A company’s quarterly and annual earnings are typically compared to analysts’ estimates and guidance provided by the company itself. In most situations, when earnings do not meet either of those estimates, a company’s stock price will tend to drop. On the other hand, when actual earnings beat estimates by a significant amount, the share price will likely surge. At the aggregate level, these swings tend to be more muted.
Source: Standard & Poor’s
Growth vs. Value
Growth Stocks vs. Value Stocks (Rolling 3-Year)
Source: Russell Investments
The adjacent graph depicts the growth versus value differential for both large- and small-cap stocks over rolling three-year intervals. The large-cap calculation uses the Russell 1000 Growth (R1000G) versus the Russell 1000 Value (R1000V) and the small-cap differential is composed of the Russell 2000 Growth (R2000G) versus the Russell 2000 Value (R2000V).
An interesting dynamic is that for several years until the latter half of 2015, growth and value had largely been irrelevant in driving large-cap equity returns. This reversed in a large way with the strength of growth in 2015. The gap has been widening toward the growth advantage even more greatly with small-cap stocks, a trend that continued in Q4.
-$1
$1
$3
$5
$7
$9
$11
$13
$15
-$1
$4
$9
$14
$19
$24
$29
Dec
-89
Dec
-90
Dec
-91
Dec
-92
Dec
-93
Dec
-94
Dec
-95
Dec
-96
Dec
-97
Dec
-98
Dec
-99
Dec
-00
Dec
-01
Dec
-02
Dec
-03
Dec
-04
Dec
-05
Dec
-06
Dec
-07
Dec
-08
Dec
-09
Dec
-10
Dec
-11
Dec
-12
Dec
-13
Dec
-14
Dec
-15
S&
P 500
® Grow
th of $1
Ear
ning
s P
er S
hare
S&P Earnings Per Share S&P 500 Growth of $1
-35%
-30%
-25%
-20%
-15%
-10%
-5%
0%
5%
10%
Dec
-02
Dec
-03
Dec
-04
Dec
-05
Dec
-06
Dec
-07
Dec
-08
Dec
-09
Dec
-10
Dec
-11
Dec
-12
Dec
-13
Dec
-14
Dec
-15
Gro
wth
/Val
ue D
iffer
entia
l
Large-Cap Growth/Value Differential
Small-Cap Growth/Value Differential
Growth Outperforms
Value Outperforms
®

Investment Synopsis Review of Q4 2015 page 9
Investment Performance: Non-U.S. Equities This section presents data and Segal Rogerscasey’s commentary on international equity returns and analyzes sector performance for Q4 2015.
International Equity Returns
The graph below illustrates Q4 2015, 2015 and 2014 rates of return for selected international equity indices. The table shows returns for the latest quarter, one-year, prior-calendar-year, three-year, five-year and 10-year annualized timeframes. All data in the table are percentages, and all are shown from the USD perspective.
MSCI Non-U.S. Equity Index Returns
MSCI Indices QTD 2015 2014 3 Year 5 Year 10 Year
World 5.50 -0.87 4.94 9.63 7.59 4.98 EAFE 4.71 -0.81 -4.90 5.01 3.60 3.03 Europe except U.K. 3.27 -0.65 -6.55 5.83 4.02 3.50 Pacific except Japan 8.29 -8.47 -0.47 -1.32 0.87 6.07 United Kingdom 0.73 -7.56 -5.39 1.81 6.46 3.05 Japan -0.34 9.57 -4.02 10.17 4.38 0.91 Source: Morgan Stanley Capital International
Index and Sector Performance
MSCI EAFE Sector Performance
QTD (%) 2015 (%) 2014(%)
Consumer Discretionary 5.3 -0.2 -6.5 Consumer Staples 4.8 6.3 -4.9 Energy -0.4 -22.1 -21.9 Financials 3.1 -5.8 -8.4 Healthcare 5.2 5.7 3.7 Industrials 6.2 -1.6 -9.6 Information Technology 10.2 3.0 -2.3 Materials 1.1 -19.2 -12.9 Telecommunication Services 5.9 0.4 -7.4 Utilities 1.7 -8.2 0.4
This table shows quarter-to-date and year-to-date price changes for each sector.
Source: Morgan Stanley Capital International
Global equity markets delivered positive results overall in Q4, de-spite weakness in the second half of the quarter. Eurozone equities were propped up by hopes that the ECB would announce substan-tial further monetary policy easing, and markets abroad recovered from the sharp selloff that occurred during the summer amid global growth fears and negative investor sentiment about China. In Q4, Pacific ex Japan (8.3 percent) rose the most compared to other broad regions, while EAFE (4.7 percent) and World (5.5 percent) also posted gains. Japan (-0.3 percent) was the only region to fall in Q4, but it posted the only gain for the year (9.6 percent), which was a strong rebound from its 2014 result. Almost every developed na-tion in the equity markets gained in Q4; Canada (-5.1 percent), Spain (-2.6 percent), Italy (-2.3 percent) and Norway (-0.5 percent) were the only laggards in USD terms, while on a local currency basis, only Canada fell (-1.7 percent local).
Like the broader market, all but one of the sectors in the EAFE benchmark rose in Q4. Technology (10.2 percent) was the best-performing sector, as these types of companies were positively affected by the strong performance of a few U.S. technology firms, such as Facebook and Amazon. Energy (-0.4 percent) remained a central concern for investors as oil prices continued to fall. As of year-end, Energy (-22.1 percent) was the worst performer, followed by Materials (-19.2 percent), as slowing commodity demand plagued these sectors.
5.5% 4.7%
3.3%
8.3%
0.7%
-0.3% -0.9% -0.8% -0.7%
-8.5% -7.6%
9.6%
4.9%
-4.9%
-6.6%
-0.5%
-5.4%
-4.0%
-10%
-8%
-6%
-4%
-2%
0%
2%
4%
6%
8%
10%
12%
World EAFE Europe exU..K.
Pacific exJapan
U.K. Japan
QTD 2015 2014
Investment Synopsis Review of Q4 2015 page 10
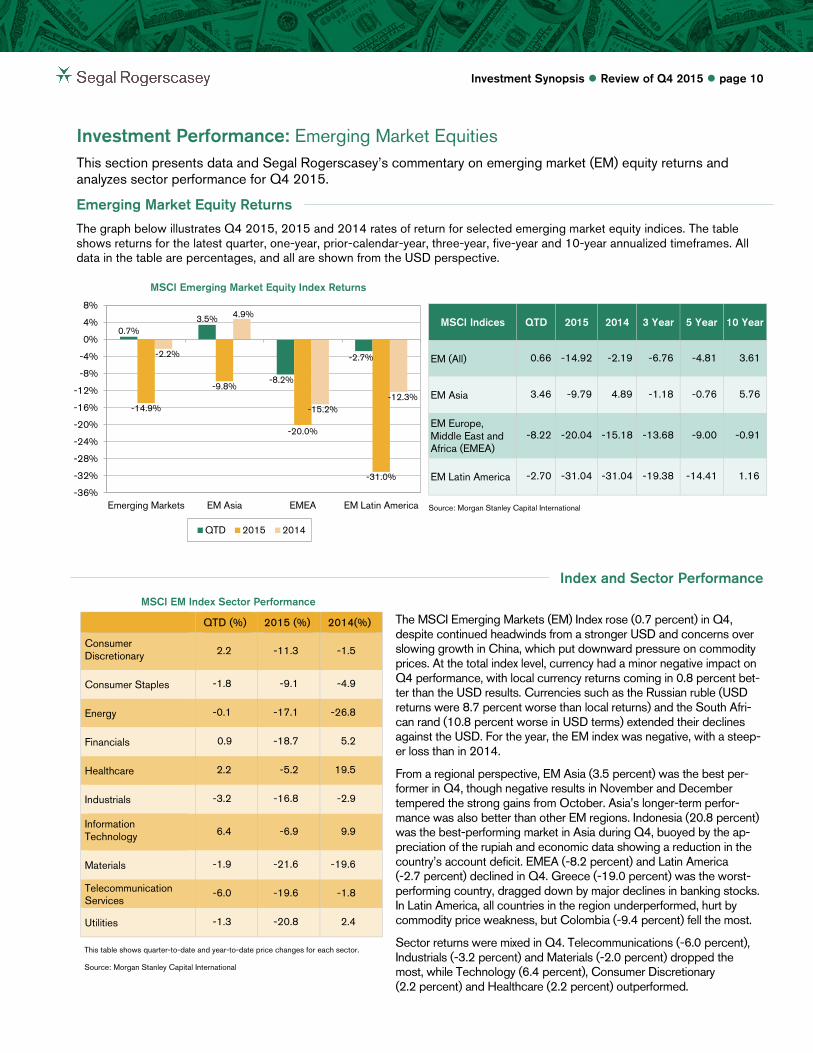
Investment Performance: Emerging Market Equities This section presents data and Segal Rogerscasey’s commentary on emerging market (EM) equity returns and analyzes sector performance for Q4 2015.
Emerging Market Equity Returns
The graph below illustrates Q4 2015, 2015 and 2014 rates of return for selected emerging market equity indices. The table shows returns for the latest quarter, one-year, prior-calendar-year, three-year, five-year and 10-year annualized timeframes. All data in the table are percentages, and all are shown from the USD perspective.
MSCI Emerging Market Equity Index Returns
MSCI Indices QTD 2015 2014 3 Year 5 Year 10 Year
EM (All) 0.66 -14.92 -2.19 -6.76 -4.81 3.61 EM Asia 3.46 -9.79 4.89 -1.18 -0.76 5.76 EM Europe, Middle East and Africa (EMEA)
-8.22 -20.04 -15.18 -13.68 -9.00 -0.91
EM Latin America -2.70 -31.04 -31.04 -19.38 -14.41 1.16 Source: Morgan Stanley Capital International
Index and Sector Performance
MSCI EM Index Sector Performance
QTD (%) 2015 (%) 2014(%)
Consumer Discretionary 2.2 -11.3 -1.5 Consumer Staples -1.8 -9.1 -4.9 Energy -0.1 -17.1 -26.8 Financials 0.9 -18.7 5.2 Healthcare 2.2 -5.2 19.5 Industrials -3.2 -16.8 -2.9 Information Technology 6.4 -6.9 9.9 Materials -1.9 -21.6 -19.6 Telecommunication Services
-6.0 -19.6 -1.8 Utilities -1.3 -20.8 2.4 This table shows quarter-to-date and year-to-date price changes for each sector.
Source: Morgan Stanley Capital International
The MSCI Emerging Markets (EM) Index rose (0.7 percent) in Q4, despite continued headwinds from a stronger USD and concerns over slowing growth in China, which put downward pressure on commodity prices. At the total index level, currency had a minor negative impact on Q4 performance, with local currency returns coming in 0.8 percent bet-ter than the USD results. Currencies such as the Russian ruble (USD returns were 8.7 percent worse than local returns) and the South Afri-can rand (10.8 percent worse in USD terms) extended their declines against the USD. For the year, the EM index was negative, with a steep-er loss than in 2014.
From a regional perspective, EM Asia (3.5 percent) was the best per-former in Q4, though negative results in November and December tempered the strong gains from October. Asia’s longer-term perfor-mance was also better than other EM regions. Indonesia (20.8 percent) was the best-performing market in Asia during Q4, buoyed by the ap-preciation of the rupiah and economic data showing a reduction in the country’s account deficit. EMEA (-8.2 percent) and Latin America (-2.7 percent) declined in Q4. Greece (-19.0 percent) was the worst-performing country, dragged down by major declines in banking stocks. In Latin America, all countries in the region underperformed, hurt by commodity price weakness, but Colombia (-9.4 percent) fell the most.
Sector returns were mixed in Q4. Telecommunications (-6.0 percent), Industrials (-3.2 percent) and Materials (-2.0 percent) dropped the most, while Technology (6.4 percent), Consumer Discretionary (2.2 percent) and Healthcare (2.2 percent) outperformed.
0.7% 3.5%
-8.2%
-2.7%
-14.9%
-9.8%
-20.0%
-31.0%
-2.2%
4.9%
-15.2% -12.3%
-36%
-32%
-28%
-24%
-20%
-16%
-12%
-8%
-4%
0%
4%
8%
Emerging Markets EM Asia EMEA EM Latin America
QTD 2015 2014

Investment Synopsis Review of Q4 2015 page 11
Investment Performance: U.S. Fixed Income This section focuses on selected U.S. fixed-income asset class data along with Segal Rogerscasey’s commentary on option-adjusted spreads (OAS), the yield curve and credit spreads during Q4 2015.
Fixed-Income Index Returns
The graph below illustrates Q4 2015, 2015 and 2014 rates of return for selected fixed-income indices. The table shows re-turns for the latest quarter, one-year, prior-calendar-year, three-year, five-year and 10-year annualized timeframes. All data in the table are percentages.
Fixed-Income Index Returns
* “BarCap” is an abbreviation for Barclays Capital.
** “CMBS” is an abbreviation for commercial mortgage-backed securities.
Sources: Barclays Capital, eVestment Alliance and Hueler Analytics
Fixed-Income Indices QTD 2015 2014 3 Year 5 Year 10 Year
BarCap* Aggregate -0.57 0.55 5.97 1.44 3.25 4.52 BarCap Govt/Credit -0.74 0.15 6.01 1.21 3.39 4.47 BarCap Intermediate Govt/Credit -0.69 1.07 3.13 1.10 2.58 4.04 BarCap L/T Govt/Credit -0.94 -3.30 19.31 1.70 6.98 6.45 BarCap Government -0.91 0.86 4.92 1.01 2.77 4.10 BarCap Credit -0.52 -0.77 7.53 1.49 4.38 5.18 BarCap Inv. Grade CMBS** -1.32 0.94 4.21 1.77 4.31 4.95 BarCap Mortgage -0.10 1.51 6.08 2.01 2.96 4.64 BarCap U.S. Corporate High Yield
-2.07 -4.47 2.45 1.69 5.04 6.96 Citigroup 3-Month T-Bill 0.01 0.03 0.02 0.03 0.05 1.17 Hueler Stable Value 0.44 1.76 1.69 1.76 2.05 3.07 Sources: Barclays Capital, Citigroup and Hueler Analytics
Option-Adjusted Spreads
OAS* in Bps
09/30/15 12/31/15
Change in OAS
10-Year Average
U.S. Aggregate Index 59 56 -3 67 U.S. Agency (Non-mortgage) Sector 47 51 4 43 Mortgage and Asset-Backed Securities Sectors: • U.S. Agency Pass-Throughs 31 24 -7 53 • Asset-Backed Securities 69 72 3 131 • Commercial Mortgage-Backed Securities 108 121 13 226
Credit Sectors: • U.S. Investment Grade 169 165 -4 167
– Industrial 184 183 -1 155 – Utility 152 150 -2 157 – Financial Institutions 145 134 -11 188
• U.S. High Yield 630 660 30 561 * OAS is the yield spread of bonds versus Treasury yields, taking into consideration differing bond options.
Source: Barclays Capital
Most sectors of the bond market experienced a spread contraction during Q4, which was a reversal from Q3. U.S. High Yield maintained its outward expansion as energy has continued to drive volatility. Securitized sectors also expe-rienced spread widening during Q4, with agencies remaining one of the few sectors above its respective 10-year spread average.
Continued economic growth within the U.S., along with accommodative policy decisions in China and Europe, resulted in a 25 bps in-crease from the near-zero levels of the Fed funds rate in December. The anticipation of the hike caused Treasury yields to rise, while changes in spreads remained mixed across the board. U.S. High Yield continued its spread expansion, as a decline in commodity prices resulted in severe underperformance in Energy. Spread widening was more modest within the high quality Securitized sectors, as supply was not an issue and the Fed continued to reinvest principal and interest payments.
-5.0%
0.0%
5.0%
10.0%
15.0%
20.0%
Bar
Cap
Agg
rega
te
Bar
Cap
Gov
t/C
redi
t
Bar
Cap
Int G
ovt/
Cre
dit
Bar
Cap
Lon
g G
ovt/
Cre
dit
Bar
Cap
Gov
ernm
ent
Bar
Cap
Cre
dit
Bar
Cap
Inv
Gra
deC
MB
S
Bar
Cap
Mor
tgag
e
Bar
Cap
U.S
. Cor
pora
te H
igh
Yie
ld
Citi
3-M
onth
T-B
ill
Hue
ler S
tabl
e V
alue
QTD 2015 2014

Investment Synopsis Review of Q4 2015 page 12
Yield Curve
The U.S. Treasury yield curve expanded during Q4, with the yield gap between 2-year and 10-year Treas-uries decreasing from 1.42 percent to 1.22 percent. Yields rose across the curve during Q4, as growth in the U.S. economy continued to head in the right direc-tion, resulting in the Fed raising the central bank interest rate after years at near-zero levels. Shorter-duration Treasuries experienced the largest expansion during the quarter, while intermediate and long yields rose by lesser amounts.
The 10-year U.S. Treasury yield ended Q4 at 2.27 percent, 21 bps above its Q3 level.
Source: U.S. Treasury Department
Credit Spreads
Barclays Capital Corporate Bond Spreads
Source: Barclays Capital
Investment-grade corporate spreads contracted by 4 bps during Q4 2015 and ended the quar-ter with an option-adjusted spread of 165 bps over Treasuries, as shown in the adjacent graph. From a historical perspective, as of Decem- ber 31, 2015, spreads were 2 bps below the 10-year average of 167 bps.
High-yield bond spreads widened by 30 basis points during Q4, ending the quarter with an OAS of 6.60 percent, which is 99 bps above the 10-year average of 561 bps.
0.0%
0.4%
0.8%
1.2%
1.6%
2.0%
2.4%
2.8%
3.2%
3.6%
4.0%
1Y 2Y 3Y 5Y 7Y 10Y 30Y
Yie
ld
Maturity
09/30/2015 12/31/2015
0
200
400
600
800
1,000
1,200
1,400
1,600
1,800
2,000
Jun-
03D
ec-0
3Ju
n-04
Dec
-04
Jun-
05D
ec-0
5Ju
n-06
Dec
-06
Jun-
07D
ec-0
7Ju
n-08
Dec
-08
Jun-
09D
ec-0
9Ju
n-10
Dec
-10
Jun-
11D
ec-1
1Ju
n-12
Dec
-12
Jun-
13D
ec-1
3Ju
n-14
Dec
-14
Jun-
15D
ec-1
5
Bps
Inv-Grade OAS High Yield OAS10-Year Average 10-Year Average
U.S. Treasury Yield Curve
Investment Synopsis Review of Q4 2015 page 13
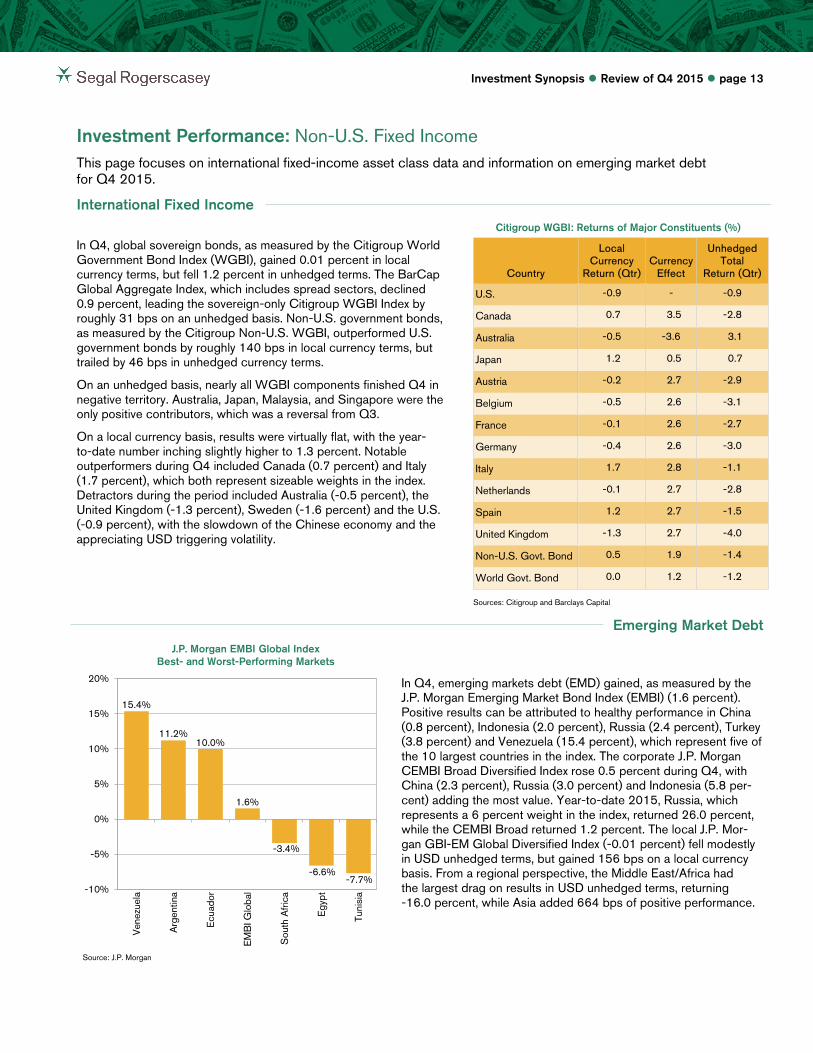
Investment Performance: Non-U.S. Fixed Income This page focuses on international fixed-income asset class data and information on emerging market debt for Q4 2015.
International Fixed Income
Citigroup WGBI: Returns of Major Constituents (%)
In Q4, global sovereign bonds, as measured by the Citigroup World Government Bond Index (WGBI), gained 0.01 percent in local currency terms, but fell 1.2 percent in unhedged terms. The BarCap Global Aggregate Index, which includes spread sectors, declined 0.9 percent, leading the sovereign-only Citigroup WGBI Index by roughly 31 bps on an unhedged basis. Non-U.S. government bonds, as measured by the Citigroup Non-U.S. WGBI, outperformed U.S. government bonds by roughly 140 bps in local currency terms, but trailed by 46 bps in unhedged currency terms.
On an unhedged basis, nearly all WGBI components finished Q4 in negative territory. Australia, Japan, Malaysia, and Singapore were the only positive contributors, which was a reversal from Q3.
On a local currency basis, results were virtually flat, with the year- to-date number inching slightly higher to 1.3 percent. Notable outperformers during Q4 included Canada (0.7 percent) and Italy (1.7 percent), which both represent sizeable weights in the index. Detractors during the period included Australia (-0.5 percent), the United Kingdom (-1.3 percent), Sweden (-1.6 percent) and the U.S. (-0.9 percent), with the slowdown of the Chinese economy and the appreciating USD triggering volatility.
Country
Local Currency
Return (Qtr) Currency
Effect
Unhedged Total
Return (Qtr)
U.S. -0.9 - -0.9 Canada 0.7 3.5 -2.8 Australia -0.5 -3.6 3.1 Japan 1.2 0.5 0.7 Austria -0.2 2.7 -2.9 Belgium -0.5 2.6 -3.1 France -0.1 2.6 -2.7 Germany -0.4 2.6 -3.0 Italy 1.7 2.8 -1.1 Netherlands -0.1 2.7 -2.8 Spain 1.2 2.7 -1.5 United Kingdom -1.3 2.7 -4.0 Non-U.S. Govt. Bond 0.5 1.9 -1.4 World Govt. Bond 0.0 1.2 -1.2
Sources: Citigroup and Barclays Capital
Emerging Market Debt
J.P. Morgan EMBI Global Index
Best- and Worst-Performing Markets
Source: J.P. Morgan
In Q4, emerging markets debt (EMD) gained, as measured by the J.P. Morgan Emerging Market Bond Index (EMBI) (1.6 percent). Positive results can be attributed to healthy performance in China (0.8 percent), Indonesia (2.0 percent), Russia (2.4 percent), Turkey (3.8 percent) and Venezuela (15.4 percent), which represent five of the 10 largest countries in the index. The corporate J.P. Morgan CEMBI Broad Diversified Index rose 0.5 percent during Q4, with China (2.3 percent), Russia (3.0 percent) and Indonesia (5.8 per-cent) adding the most value. Year-to-date 2015, Russia, which represents a 6 percent weight in the index, returned 26.0 percent, while the CEMBI Broad returned 1.2 percent. The local J.P. Mor-gan GBI-EM Global Diversified Index (-0.01 percent) fell modestly in USD unhedged terms, but gained 156 bps on a local currency basis. From a regional perspective, the Middle East/Africa had the largest drag on results in USD unhedged terms, returning -16.0 percent, while Asia added 664 bps of positive performance.
15.4%
11.2% 10.0%
1.6%
-3.4%
-6.6% -7.7%
-10%
-5%
0%
5%
10%
15%
20%
Ven
ezue
la
Arg
entin
a
Ecu
ador
EM
BI G
loba
l
Sou
th A
frica
Egy
pt
Tuni
sia

Investment Synopsis Review of Q4 2015 page 14
Investment Performance: Commodities and Currencies This section presents performance information about commodities and major world currencies as of Q4 2015.
Commodities
Commodities continued to decline in Q4. Both the Bloomberg Commodity Index (BCOM) and the S&P GSCI fell significantly, with returns of -10.5 percent and -16.6 percent, respectively. These results brought 2015 annual returns to a dismal -24.7 per-cent for the BCOM and -32.9 percent for the S&P GSCI. During Q4 and for the year, all sectors in both indices posted negative returns, but the great-est detractor was Energy. In Q4, Energy posted a -22.7 percent return in the BCOM and a -24.9 per-cent return in the GSCI, bringing the total decline for the year to -38.9 percent and -41.5 percent, respectively. Energy, like all other sectors, suffered due to oversupply and a strong USD. Agriculture and Livestock were the best performers in Q4, each dropping less than 5 percent over the period.
Monthly Commodity Returns, Growth of $100: January 2003 – December 2015
The graph above shows the major commodity indices, the S&P GSCI* and the Bloomberg Commodity Index.**
* The S&P GSCI is calculated primarily on a world production-weighted basis and is composed of the principal physical commodities that are the subject of active, liquid futures markets.
** The Bloomberg Commodity Index is composed of futures contracts on physical commodities, with weighting restrictions on individual commodities and commodity groups to promote diversification.
Sources: eVestment Alliance and Deutsche Bank
Currencies
Nominal Broad Dollar Index:
USD vs. Basket of Major Trading Partners
Sources: Federal Reserve and Bloomberg
The adjacent graph shows the USD against a basket of 16 major market currencies, including those listed in the table below: the Canadian dollar (CAD), the euro (EUR), the Japanese yen (JPY), the Swiss franc (CHF) and the British pound-sterling (GBP).
In Q4, the U.S. nominal broad dollar strengthened by 1.67 percent. The USD should continue to benefit from higher relative economic growth and rising interest rates.
USD Major Trading Partners Pairs Q4 Level YTD (%)
5-Year Average
Canada USD/CAD 1.3839 19.09% 1.0838 Eurozone USD/EUR 0.9210 11.42% 0.7819 Japan USD/JPY 120.2200 0.37% 97.0493 Switzerland USD/CHF 1.0021 0.78% 0.9249 U.K. USD/GBP 0.6786 5.72% 0.6305
0
50
100
150
200
250
300
Jan-
03Ju
n-03
Nov
-03
Apr
-04
Sep
-04
Feb-
05Ju
l-05
Dec
-05
May
-06
Oct
-06
Mar
-07
Aug
-07
Jan-
08Ju
n-08
Nov
-08
Apr
-09
Sep
-09
Feb-
10Ju
l-10
Dec
-10
May
-11
Oct
-11
Mar
-12
Aug
-12
Jan-
13Ju
n-13
Nov
-13
Apr
-14
Sep
-14
Feb-
15Ju
l-15
Dec
-15
S&P GSCI Total Return Index Bloomberg Commodity Index
90
100
110
120
130
Dec
-03
Jun-
04D
ec-0
4Ju
n-05
Dec
-05
Jun-
06D
ec-0
6Ju
n-07
Dec
-07
Jun-
08D
ec-0
8Ju
n-09
Dec
-09
Jun-
10D
ec-1
0Ju
n-11
Dec
-11
Jun-
12D
ec-1
2Ju
n-13
Dec
-13
Jun-
14D
ec-1
4Ju
n-15
Dec
-15
Nom
inal
Bro
ad D
olla
r Ind
ex

Investment Synopsis Review of Q4 2015 page 15
Investment Performance: Hedge Funds This section provides an overview of hedge fund results along with an analysis of strategy performance during Q4 2015.
Hedge Fund Overview
Hedge Fund Industry Performance
* Distressed funds focus on companies that are close to or in bankruptcy.
** Relative-value funds focus on arbitrage opportunities between equity and fixed-income securities.
Source: Hedge Fund Research, Inc.
The Hedge Fund Research, Inc. (HFRI) Fund Weighted Composite Index (0.8 percent) rose during Q4, posting positive returns in October and November, but declining in December. Two of the five major hedge fund strategies ended Q4 in positive territory: Equity Hedge (1.9 percent) and Emerging Markets (2.1 percent). Global Macro (0.0 percent) was flat; Event Driven (-0.1 percent) and Rel-ative Value (-0.2 percent) fell. All of the major hedge fund strategies posted negative annual returns for 2015.
Longer-term results were positive. Hedge funds recorded a gain of 3.6 percent over the three-year period ending December 31, 2015, as measured by the HFRI Fund Weighted Composite Index.
Hedge funds of funds also gained in Q4, as represented by the HFRI Fund of Funds (FOF) Composite Index (0.7 per-cent). The HFRI FOF: Conservative Index (0.1 percent) and the HFRI FOF: Diversified Index (0.6 percent) also rose. Hedge fund of funds ended the year in negative territory.
Strategy Analysis
HFRI Index Returns – Q4 2015 (%)
The HFRI Emerging Markets Index (2.1 percent) gained the most of all the major hedge fund strategies. All underlying indices con-tributed positively to performance except Latin America and MENA (Middle East & North Africa). China was the best perform-er, followed by Asia ex-Japan, India, Russia/Eastern Europe and Global. The HFRI Equity Hedge Index (1.9 percent) gained in Q4. The Technology/Healthcare Sector, Equity Market Neutral, Multi Strategy, both Fundamental Growth and Value, and Quantitative Directional all were positive contributors to the Equity Hedge index, while the remaining indices were negative. Energy/Basic Materials lost the most, followed by Short Bias. The HFRI Global Macro Index (0.0 percent) was flat. The strategy received $2.5 billion in new capital, which was the greatest amount of inflows for Q4 of all the major hedge fund strategies. Several underlying strategies reported positive quarterly results. Leading the way was Multi-Strategy, followed by the Active Trading, Cur-rency and Commodity indices. Meanwhile, the Systematic Diversified Index was the worst-performing underlying index, fol-lowed by Discretionary Thematic. The HFRI Event-Driven Index (-0.1 percent) fell slightly, while underlying indices contributed contrasting performances. The Activist index fared the best, fol-lowed by Merger Arbitrage and Special Situations. Those gains were offset by losses in Distressed/Restructuring and Credit Ar-bitrage. The HFRI Relative Value Index (-0.2 percent) declined. The underlying Sovereign Fixed Income index was the strongest performer for the period. Other positive contributors were the Volatility, Fixed-Income Convertible Arbitrage and Fixed-Income Multi-Strategy indices. The Yield Alternatives index fared the worst, followed by Fixed-Income Asset Backed and Fixed-Income Corporate.
Oct Nov Dec QTD YTD
Fund of Funds Composite 0.9 0.3 -0.5 0.7 -0.3 FOF: Conservative 0.3 0.2 -0.4 0.1 0.5 FOF: Diversified 0.7 0.5 -0.6 0.6 0.0
Fund Weighted Composite 1.7 0.2 -1.0 0.8 -0.9 Equity Hedge (Total) 2.9 -0.1 -1.0 1.9 -0.6
Equity Market Neutral 1.0 0.1 0.2 1.3 4.3
Short Bias -2.4 1.0 -0.2 -1.5 -2.0
Event-Driven (Total) 1.4 -0.7 -0.7 -0.1 -3.2
Distressed/ Restructuring 0.1 -1.3 -2.0 -3.2 -8.2
Merger Arbitrage 1.0 -0.0 1.1 2.1 3.3
Relative Value (Total) 1.0 -0.3 -0.9 -0.2 -0.2
FI-Convertible Arbitrage 1.5 -0.3 -1.0 0.2 1.9
Global Macro (Total) -0.2 1.5 -1.3 0.0 -1.1
Emerging Markets (Total) 3.3 -0.6 -0.5 2.1 -2.9
Source: Hedge Fund Research, Inc.
-10%
-8%
-6%
-4%
-2%
0%
2%
4%
6%
Hed
geFu
nd T
otal
Equ
ity H
edge
Em
ergi
ngM
arke
ts
Eve
ntD
riven
Dis
tres
sed*
Glo
bal
Mac
ro
Rel
ativ
eV
alue
**
Ret
urns
(%)
YTD (%) 1-Year (%) 3-Year (%)
Hed
ge F
und
of
Fun
ds
Investment Synopsis Review of Q4 2015 page 16
Investment Performance: Private Equity This section provides data on private equity industry performance, fundraising, buyout funds, initial public offering (IPO) activity and venture capital. The information in this section reflects the most recent private equity data available.
Private Equity Industry Performance
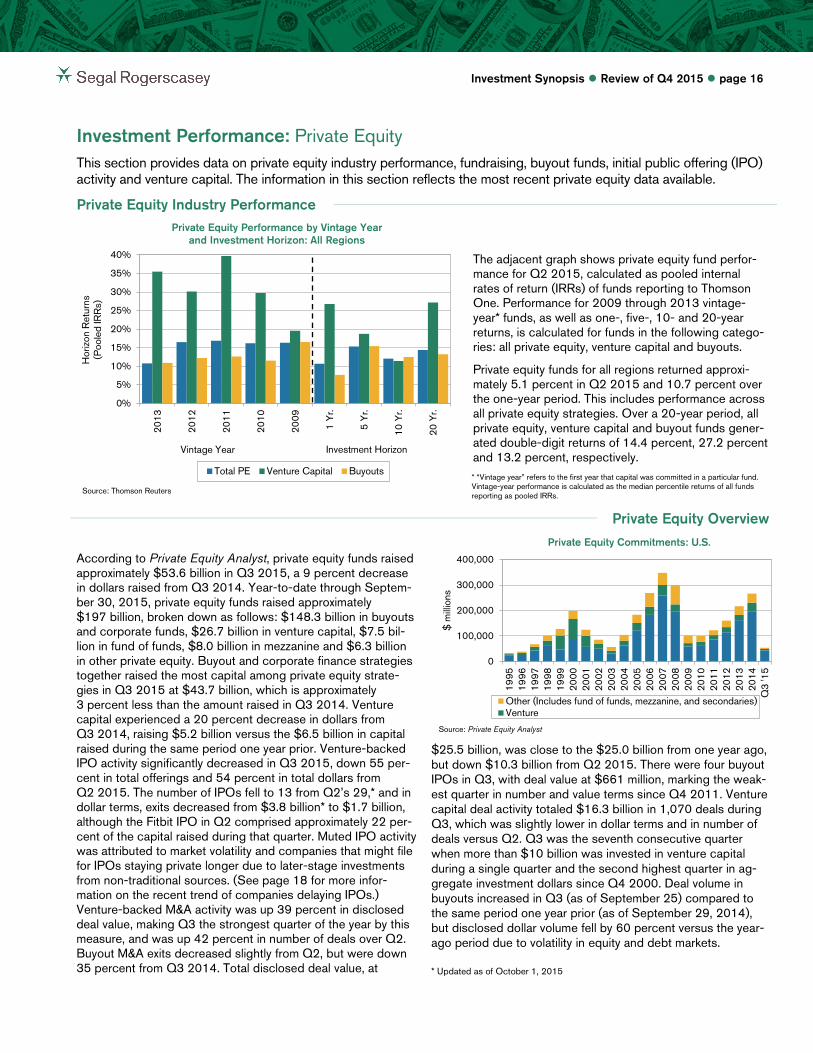
Private Equity Performance by Vintage Year and Investment Horizon: All Regions
Source: Thomson Reuters
The adjacent graph shows private equity fund perfor-mance for Q2 2015, calculated as pooled internal rates of return (IRRs) of funds reporting to Thomson One. Performance for 2009 through 2013 vintage-year* funds, as well as one-, five-, 10- and 20-year returns, is calculated for funds in the following catego-ries: all private equity, venture capital and buyouts.
Private equity funds for all regions returned approxi-mately 5.1 percent in Q2 2015 and 10.7 percent over the one-year period. This includes performance across all private equity strategies. Over a 20-year period, all private equity, venture capital and buyout funds gener-ated double-digit returns of 14.4 percent, 27.2 percent and 13.2 percent, respectively. * “Vintage year” refers to the first year that capital was committed in a particular fund. Vintage-year performance is calculated as the median percentile returns of all funds reporting as pooled IRRs.
Private Equity Overview
Private Equity Commitments: U.S.
According to Private Equity Analyst, private equity funds raised approximately $53.6 billion in Q3 2015, a 9 percent decrease in dollars raised from Q3 2014. Year-to-date through Septem-ber 30, 2015, private equity funds raised approximately $197 billion, broken down as follows: $148.3 billion in buyouts and corporate funds, $26.7 billion in venture capital, $7.5 bil-lion in fund of funds, $8.0 billion in mezzanine and $6.3 billion in other private equity. Buyout and corporate finance strategies together raised the most capital among private equity strate-gies in Q3 2015 at $43.7 billion, which is approximately 3 percent less than the amount raised in Q3 2014. Venture capital experienced a 20 percent decrease in dollars from Q3 2014, raising $5.2 billion versus the $6.5 billion in capital raised during the same period one year prior. Venture-backed IPO activity significantly decreased in Q3 2015, down 55 per-cent in total offerings and 54 percent in total dollars from Q2 2015. The number of IPOs fell to 13 from Q2’s 29,* and in dollar terms, exits decreased from $3.8 billion* to $1.7 billion, although the Fitbit IPO in Q2 comprised approximately 22 per-cent of the capital raised during that quarter. Muted IPO activity was attributed to market volatility and companies that might file for IPOs staying private longer due to later-stage investments from non-traditional sources. (See page 18 for more infor-mation on the recent trend of companies delaying IPOs.) Venture-backed M&A activity was up 39 percent in disclosed deal value, making Q3 the strongest quarter of the year by this measure, and was up 42 percent in number of deals over Q2. Buyout M&A exits decreased slightly from Q2, but were down 35 percent from Q3 2014. Total disclosed deal value, at
Source: Private Equity Analyst
$25.5 billion, was close to the $25.0 billion from one year ago, but down $10.3 billion from Q2 2015. There were four buyout IPOs in Q3, with deal value at $661 million, marking the weak-est quarter in number and value terms since Q4 2011. Venture capital deal activity totaled $16.3 billion in 1,070 deals during Q3, which was slightly lower in dollar terms and in number of deals versus Q2. Q3 was the seventh consecutive quarter when more than $10 billion was invested in venture capital during a single quarter and the second highest quarter in ag-gregate investment dollars since Q4 2000. Deal volume in buyouts increased in Q3 (as of September 25) compared to the same period one year prior (as of September 29, 2014), but disclosed dollar volume fell by 60 percent versus the year-ago period due to volatility in equity and debt markets.
* Updated as of October 1, 2015
0%
5%
10%
15%
20%
25%
30%
35%
40%
2013
2012
2011
2010
2009
1 Y
r.
5 Y
r.
10 Y
r.
20 Y
r.
Hor
izon
Ret
urns
(P
oole
d IR
Rs)
Vintage Year
Total PE Venture Capital Buyouts
0
100,000
200,000
300,000
400,000
1995
1996
1997
1998
1999
2000
2001
2002
2003
2004
2005
2006
2007
2008
2009
2010
2011
2012
2013
2014
Q3
'15
$ m
illio
ns
Other (Includes fund of funds, mezzanine, and secondaries)Venture
Investment Horizon
Investment Synopsis Review of Q4 2015 page 17
Investment Performance: Real Estate This section presents data and Segal Rogerscasey’s commentary on private, public, value-added and opportunistic real estate. The information in this section reflects the most recent data available.
Private Real Estate
The National Council of Real Estate Investment Fiduciaries (NCREIF) National Property Index (NPI), which tracks private real estate in the U.S., gained 2.9 percent during Q4. The total return is composed of 1.2 percent income and 1.7 percent property-level appreciation. Over the trailing one-year period, the Index gained 13.3 percent, composed of 8.0 percent property-level appreciation and 5.0 percent income.*
Among regions of the U.S., the West performed the best during Q4 and over the last 12 months, as shown in the adjacent table.
Property valuations continue to strengthen due to solid operating fundamentals supported by modest economic growth, limited new supply deliveries, availability of credit and demand from investors for prime assets. On average, private core real estate values are 20 percent above the peak levels reached in 2007. Supply is growing in markets with strong tenant demand, albeit more slowly than in previous cycles with the exception of the apartment sector. There is also increasing supply in the office and industrial sectors, while retail is only slowly recovering even though its operating performance has been strong. The growth in hotel supply has been modest with the exception of New York City. * Numbers may not add up to total due to rounding.
National Property Index Sector and Region Performance
Returns as of Q4 2015
Ending
Weight (%) QTD (%) 1 Year (%)
NCREIF NPI Total Return 100.0 2.9 13.3 Sector Apartment 24.0 2.7 12.0 Hotel 1.2 3.0 13.2 Industrial 14.4 3.2 14.9 Office 37.1 2.6 12.5 Retail 23.3 3.5 15.3 NCREIF Region East 33.3 2.3 11.3 Midwest 9.4 2.4 12.1 South 20.4 3.0 14.0 West 36.9 3.6 15.2
Source: National Council of Real Estate Investment Fiduciaries
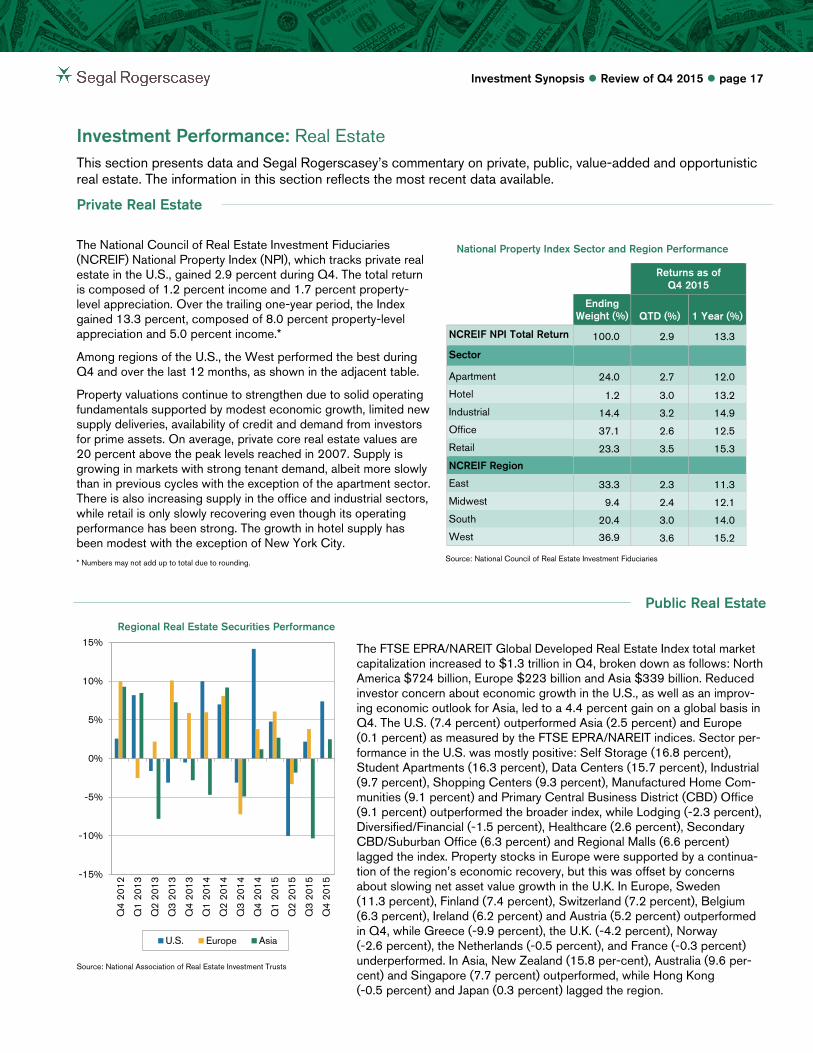
Public Real Estate
Regional Real Estate Securities Performance
Source: National Association of Real Estate Investment Trusts
The FTSE EPRA/NAREIT Global Developed Real Estate Index total market capitalization increased to $1.3 trillion in Q4, broken down as follows: North America $724 billion, Europe $223 billion and Asia $339 billion. Reduced investor concern about economic growth in the U.S., as well as an improv-ing economic outlook for Asia, led to a 4.4 percent gain on a global basis in Q4. The U.S. (7.4 percent) outperformed Asia (2.5 percent) and Europe (0.1 percent) as measured by the FTSE EPRA/NAREIT indices. Sector per-formance in the U.S. was mostly positive: Self Storage (16.8 percent), Student Apartments (16.3 percent), Data Centers (15.7 percent), Industrial (9.7 percent), Shopping Centers (9.3 percent), Manufactured Home Com-munities (9.1 percent) and Primary Central Business District (CBD) Office (9.1 percent) outperformed the broader index, while Lodging (-2.3 percent), Diversified/Financial (-1.5 percent), Healthcare (2.6 percent), Secondary CBD/Suburban Office (6.3 percent) and Regional Malls (6.6 percent) lagged the index. Property stocks in Europe were supported by a continua-tion of the region’s economic recovery, but this was offset by concerns about slowing net asset value growth in the U.K. In Europe, Sweden (11.3 percent), Finland (7.4 percent), Switzerland (7.2 percent), Belgium (6.3 percent), Ireland (6.2 percent) and Austria (5.2 percent) outperformed in Q4, while Greece (-9.9 percent), the U.K. (-4.2 percent), Norway (-2.6 percent), the Netherlands (-0.5 percent), and France (-0.3 percent) underperformed. In Asia, New Zealand (15.8 per-cent), Australia (9.6 per-cent) and Singapore (7.7 percent) outperformed, while Hong Kong (-0.5 percent) and Japan (0.3 percent) lagged the region.
-15%
-10%
-5%
0%
5%
10%
15%
Q4
2012
Q1
2013
Q2
2013
Q3
2013
Q4
2013
Q1
2014
Q2
2014
Q3
2014
Q4
2014
Q1
2015
Q2
2015
Q3
2015
Q4
2015
U.S. Europe Asia
Investment Synopsis Review of Q4 2015 page 18
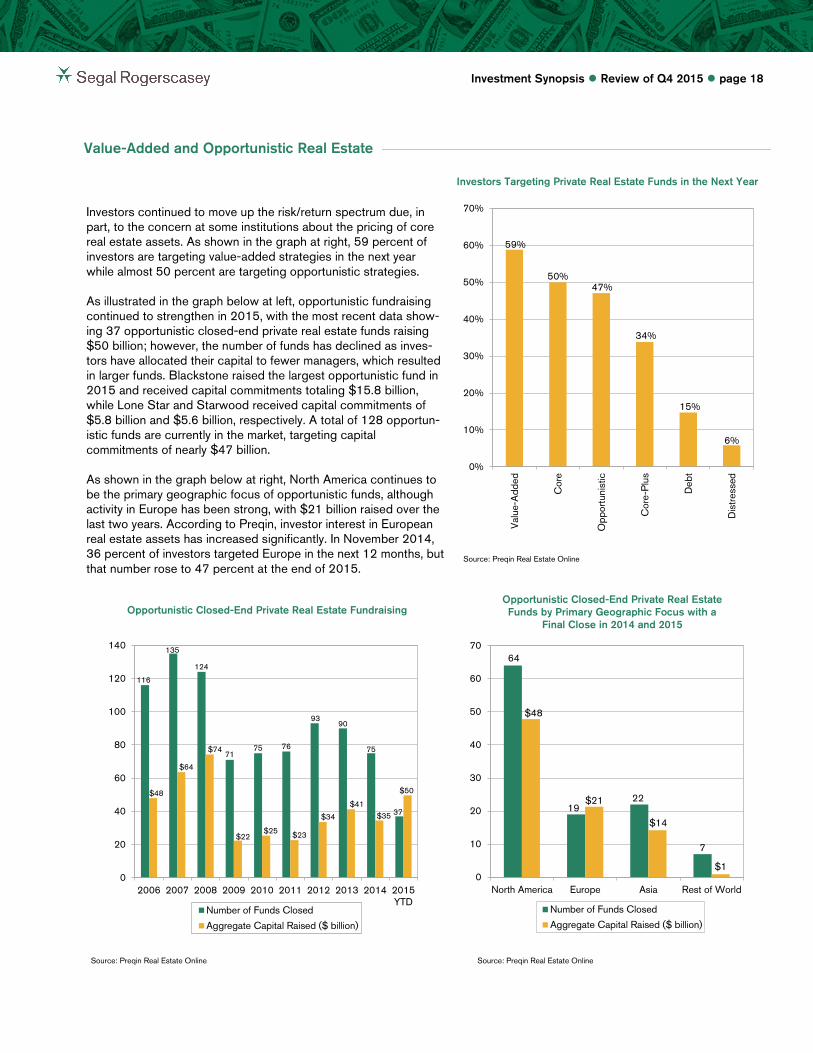
Investors Targeting Private Real Estate Funds in the Next Year
Investors continued to move up the risk/return spectrum due, in part, to the concern at some institutions about the pricing of core real estate assets. As shown in the graph at right, 59 percent of investors are targeting value-added strategies in the next year while almost 50 percent are targeting opportunistic strategies. As illustrated in the graph below at left, opportunistic fundraising continued to strengthen in 2015, with the most recent data show-ing 37 opportunistic closed-end private real estate funds raising $50 billion; however, the number of funds has declined as inves-tors have allocated their capital to fewer managers, which resulted in larger funds. Blackstone raised the largest opportunistic fund in 2015 and received capital commitments totaling $15.8 billion, while Lone Star and Starwood received capital commitments of $5.8 billion and $5.6 billion, respectively. A total of 128 opportun-istic funds are currently in the market, targeting capital commitments of nearly $47 billion. As shown in the graph below at right, North America continues to be the primary geographic focus of opportunistic funds, although activity in Europe has been strong, with $21 billion raised over the last two years. According to Preqin, investor interest in European real estate assets has increased significantly. In November 2014, 36 percent of investors targeted Europe in the next 12 months, but that number rose to 47 percent at the end of 2015.
Source: Preqin Real Estate Online
Opportunistic Closed-End Private Real Estate Fundraising Opportunistic Closed-End Private Real Estate Funds by Primary Geographic Focus with a
Final Close in 2014 and 2015
Source: Preqin Real Estate Online Source: Preqin Real Estate Online
59%
50% 47%
34%
15%
6%
0%
10%
20%
30%
40%
50%
60%
70%
Val
ue-A
dded
Cor
e
Opp
ortu
nist
ic
Cor
e-P
lus
Deb
t
Dis
tres
sed
116
135
124
71 75 76
93 90
75
37
$48
$64
$74
$22 $25 $23
$34
$41
$35
$50
0
20
40
60
80
100
120
140
2006 2007 2008 2009 2010 2011 2012 2013 2014 2015YTD
Number of Funds Closed
Aggregate Capital Raised ($ billion)
64
19 22
7
$48
$21
$14
$1 0
10
20
30
40
50
60
70
North America Europe Asia Rest of World
Number of Funds Closed
Aggregate Capital Raised ($ billion)
Value-Added and Opportunistic Real Estate
Investment Synopsis Review of Q4 2015 page 19
Noteworthy Developments Segal Rogerscasey finds the developments discussed in this section to be noteworthy for institutional investors.
Fed Reaches “Lift-Off,” But For How Long?
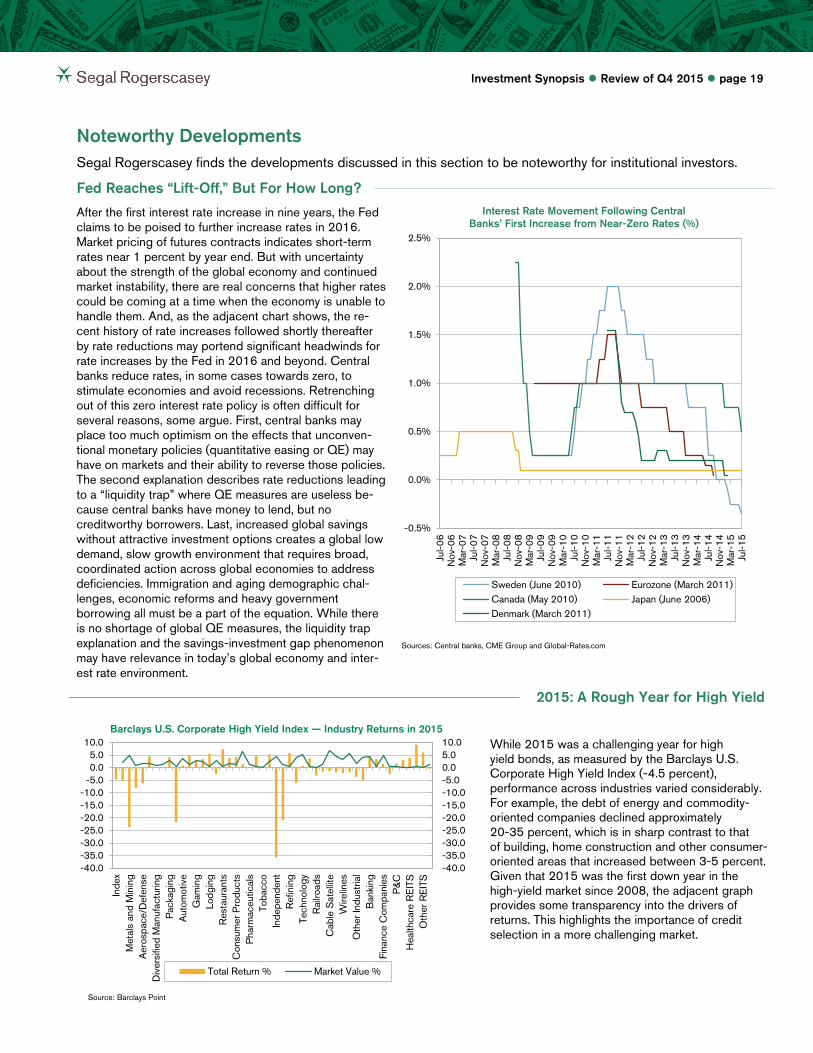
After the first interest rate increase in nine years, the Fed claims to be poised to further increase rates in 2016. Market pricing of futures contracts indicates short-term rates near 1 percent by year end. But with uncertainty about the strength of the global economy and continued market instability, there are real concerns that higher rates could be coming at a time when the economy is unable to handle them. And, as the adjacent chart shows, the re-cent history of rate increases followed shortly thereafter by rate reductions may portend significant headwinds for rate increases by the Fed in 2016 and beyond. Central banks reduce rates, in some cases towards zero, to stimulate economies and avoid recessions. Retrenching out of this zero interest rate policy is often difficult for several reasons, some argue. First, central banks may place too much optimism on the effects that unconven-tional monetary policies (quantitative easing or QE) may have on markets and their ability to reverse those policies. The second explanation describes rate reductions leading to a “liquidity trap” where QE measures are useless be-cause central banks have money to lend, but no creditworthy borrowers. Last, increased global savings without attractive investment options creates a global low demand, slow growth environment that requires broad, coordinated action across global economies to address deficiencies. Immigration and aging demographic chal-lenges, economic reforms and heavy government borrowing all must be a part of the equation. While there is no shortage of global QE measures, the liquidity trap explanation and the savings-investment gap phenomenon may have relevance in today’s global economy and inter-est rate environment.
Interest Rate Movement Following Central Banks’ First Increase from Near-Zero Rates (%)
Sources: Central banks, CME Group and Global-Rates.com
2015: A Rough Year for High Yield
Barclays U.S. Corporate High Yield Index — Industry Returns in 2015
Source: Barclays Point
While 2015 was a challenging year for high yield bonds, as measured by the Barclays U.S. Corporate High Yield Index (-4.5 percent), performance across industries varied considerably. For example, the debt of energy and commodity-oriented companies declined approximately 20-35 percent, which is in sharp contrast to that of building, home construction and other consumer-oriented areas that increased between 3-5 percent. Given that 2015 was the first down year in the high-yield market since 2008, the adjacent graph provides some transparency into the drivers of returns. This highlights the importance of credit selection in a more challenging market.
-0.5%
0.0%
0.5%
1.0%
1.5%
2.0%
2.5%
Jul-0
6N
ov-0
6M
ar-0
7Ju
l-07
Nov
-07
Mar
-08
Jul-0
8N
ov-0
8M
ar-0
9Ju
l-09
Nov
-09
Mar
-10
Jul-1
0N
ov-1
0M
ar-1
1Ju
l-11
Nov
-11
Mar
-12
Jul-1
2N
ov-1
2M
ar-1
3Ju
l-13
Nov
-13
Mar
-14
Jul-1
4N
ov-1
4M
ar-1
5Ju
l-15
Sweden (June 2010) Eurozone (March 2011)Canada (May 2010) Japan (June 2006)Denmark (March 2011)
-40.0-35.0-30.0-25.0-20.0-15.0-10.0-5.00.05.010.0
-40.0-35.0-30.0-25.0-20.0-15.0-10.0
-5.00.05.0
10.0
Inde
xM
etal
s an
d M
inin
gA
eros
pace
/Def
ense
Div
ersi
fied
Man
ufac
turin
gP
acka
ging
Aut
omot
ive
Gam
ing
Lodg
ing
Res
taur
ants
Con
sum
er P
rodu
cts
Pha
rmac
eutic
als
Toba
cco
Inde
pend
ent
Ref
inin
gTe
chno
logy
Rai
lroad
sC
able
Sat
ellit
eW
irelin
esO
ther
Indu
stria
lB
anki
ngFi
nanc
e C
ompa
nies
P&
CH
ealth
care
RE
ITS
Oth
er R
EIT
S
Total Return % Market Value %
Source: Barclays Point
Investment Synopsis Review of Q4 2015 page 20
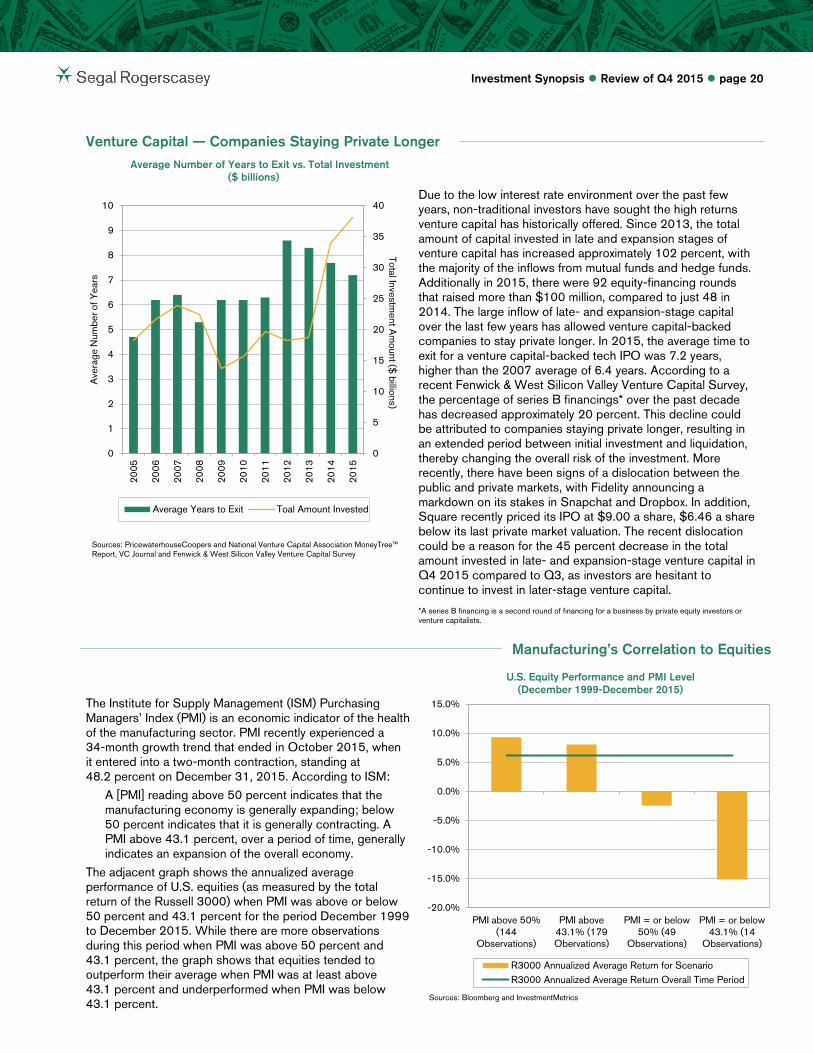
Venture Capital — Companies Staying Private Longer
Average Number of Years to Exit vs. Total Investment ($ billions)
Sources: PricewaterhouseCoopers and National Venture Capital Association MoneyTree™ Report, VC Journal and Fenwick & West Silicon Valley Venture Capital Survey
Due to the low interest rate environment over the past few years, non-traditional investors have sought the high returns venture capital has historically offered. Since 2013, the total amount of capital invested in late and expansion stages of venture capital has increased approximately 102 percent, with the majority of the inflows from mutual funds and hedge funds. Additionally in 2015, there were 92 equity-financing rounds that raised more than $100 million, compared to just 48 in 2014. The large inflow of late- and expansion-stage capital over the last few years has allowed venture capital-backed companies to stay private longer. In 2015, the average time to exit for a venture capital-backed tech IPO was 7.2 years, higher than the 2007 average of 6.4 years. According to a recent Fenwick & West Silicon Valley Venture Capital Survey, the percentage of series B financings* over the past decade has decreased approximately 20 percent. This decline could be attributed to companies staying private longer, resulting in an extended period between initial investment and liquidation, thereby changing the overall risk of the investment. More recently, there have been signs of a dislocation between the public and private markets, with Fidelity announcing a markdown on its stakes in Snapchat and Dropbox. In addition, Square recently priced its IPO at $9.00 a share, $6.46 a share below its last private market valuation. The recent dislocation could be a reason for the 45 percent decrease in the total amount invested in late- and expansion-stage venture capital in Q4 2015 compared to Q3, as investors are hesitant to continue to invest in later-stage venture capital. *A series B financing is a second round of financing for a business by private equity investors or venture capitalists.
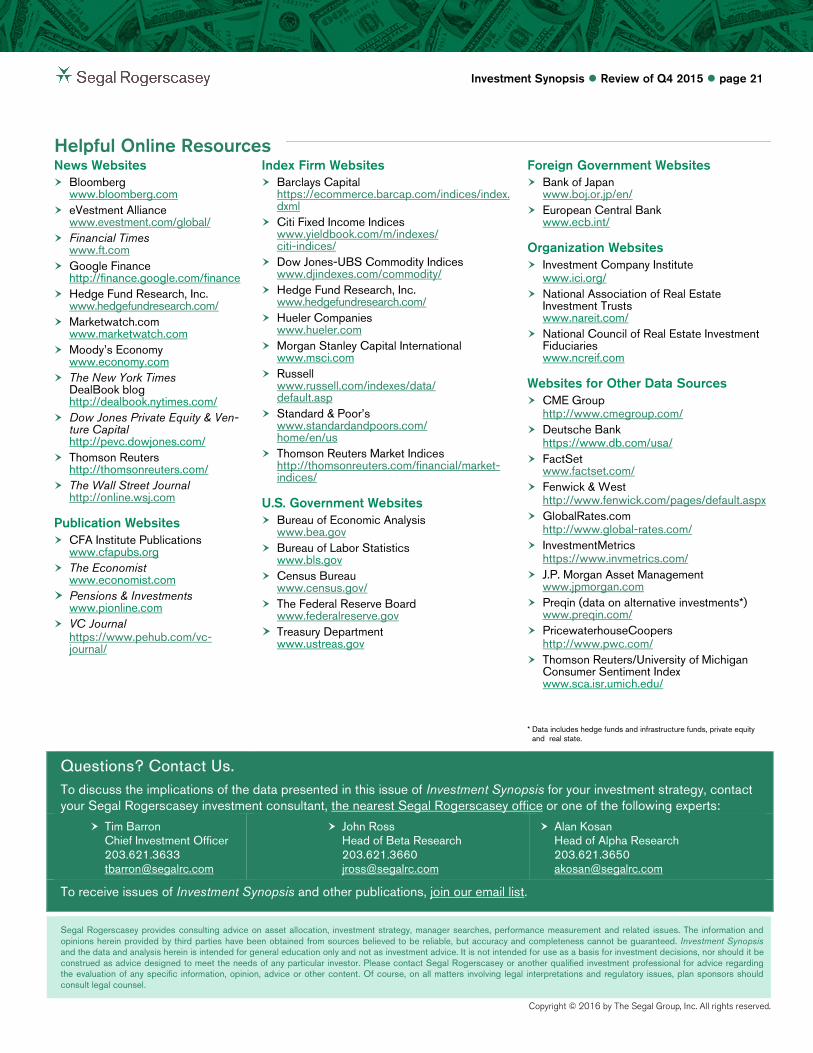
Manufacturing’s Correlation to Equities
U.S. Equity Performance and PMI Level
(December 1999-December 2015) The Institute for Supply Management (ISM) Purchasing Managers’ Index (PMI) is an economic indicator of the health of the manufacturing sector. PMI recently experienced a 34-month growth trend that ended in October 2015, when it entered into a two-month contraction, standing at 48.2 percent on December 31, 2015. According to ISM:
A [PMI] reading above 50 percent indicates that the manufacturing economy is generally expanding; below 50 percent indicates that it is generally contracting. A PMI above 43.1 percent, over a period of time, generally indicates an expansion of the overall economy.
The adjacent graph shows the annualized average performance of U.S. equities (as measured by the total return of the Russell 3000) when PMI was above or below 50 percent and 43.1 percent for the period December 1999 to December 2015. While there are more observations during this period when PMI was above 50 percent and 43.1 percent, the graph shows that equities tended to outperform their average when PMI was at least above 43.1 percent and underperformed when PMI was below 43.1 percent.
0
5
10
15
20
25
30
35
40
0
1
2
3
4
5
6
7
8
9
10
2005
2006
2007
2008
2009
2010
2011
2012
2013
2014
2015
Total Investment A
mount ($
billions)
Ave
rage
Num
ber o
f Yea
rs
Average Years to Exit Toal Amount Invested
-20.0%
-15.0%
-10.0%
-5.0%
0.0%
5.0%
10.0%
15.0%
PMI above 50%(144
Observations)
PMI above43.1% (179Obervations)
PMI = or below50% (49
Observations)
PMI = or below43.1% (14
Observations)
R3000 Annualized Average Return for ScenarioR3000 Annualized Average Return Overall Time Period
Sources: Bloomberg and InvestmentMetrics
Investment Synopsis Review of Q4 2015 page 21
Helpful Online Resources
News Websites Bloomberg
www.bloomberg.com eVestment Alliance
www.evestment.com/global/ Financial Times
www.ft.com Google Finance
http://finance.google.com/finance Hedge Fund Research, Inc.
www.hedgefundresearch.com/ Marketwatch.com
www.marketwatch.com Moody’s Economy
www.economy.com The New York Times
DealBook blog http://dealbook.nytimes.com/
Dow Jones Private Equity & Ven-ture Capital http://pevc.dowjones.com/
Thomson Reuters http://thomsonreuters.com/
The Wall Street Journal http://online.wsj.com
Publication Websites CFA Institute Publications
www.cfapubs.org The Economist
www.economist.com Pensions & Investments
www.pionline.com VC Journal
https://www.pehub.com/vc-journal/
Index Firm Websites Barclays Capital
https://ecommerce.barcap.com/indices/index.dxml
Citi Fixed Income Indices www.yieldbook.com/m/indexes/ citi-indices/
Dow Jones-UBS Commodity Indices www.djindexes.com/commodity/
Hedge Fund Research, Inc. www.hedgefundresearch.com/
Hueler Companies www.hueler.com
Morgan Stanley Capital International www.msci.com
Russell www.russell.com/indexes/data/ default.asp
Standard & Poor’s www.standardandpoors.com/ home/en/us
Thomson Reuters Market Indices http://thomsonreuters.com/financial/market-indices/
U.S. Government Websites Bureau of Economic Analysis
www.bea.gov Bureau of Labor Statistics
www.bls.gov Census Bureau
www.census.gov/ The Federal Reserve Board
www.federalreserve.gov Treasury Department
www.ustreas.gov
Foreign Government Websites Bank of Japan
www.boj.or.jp/en/ European Central Bank
www.ecb.int/
Organization Websites Investment Company Institute
www.ici.org/ National Association of Real Estate
Investment Trusts www.nareit.com/
National Council of Real Estate Investment Fiduciaries www.ncreif.com
Websites for Other Data Sources CME Group
http://www.cmegroup.com/ Deutsche Bank
https://www.db.com/usa/ FactSet
www.factset.com/ Fenwick & West
http://www.fenwick.com/pages/default.aspx GlobalRates.com
http://www.global-rates.com/ InvestmentMetrics
https://www.invmetrics.com/ J.P. Morgan Asset Management
www.jpmorgan.com Preqin (data on alternative investments*)
www.preqin.com/ PricewaterhouseCoopers
http://www.pwc.com/ Thomson Reuters/University of Michigan
Consumer Sentiment Index www.sca.isr.umich.edu/
* Data includes hedge funds and infrastructure funds, private equity and real state.
Questions? Contact Us. To discuss the implications of the data presented in this issue of Investment Synopsis for your investment strategy, contact your Segal Rogerscasey investment consultant, the nearest Segal Rogerscasey office or one of the following experts:
Tim Barron Chief Investment Officer 203.621.3633 [email protected]
John Ross Head of Beta Research 203.621.3660 [email protected]
Alan Kosan Head of Alpha Research 203.621.3650 [email protected]
To receive issues of Investment Synopsis and other publications, join our email list.
Segal Rogerscasey provides consulting advice on asset allocation, investment strategy, manager searches, performance measurement and related issues. The information and opinions herein provided by third parties have been obtained from sources believed to be reliable, but accuracy and completeness cannot be guaranteed. Investment Synopsis and the data and analysis herein is intended for general education only and not as investment advice. It is not intended for use as a basis for investment decisions, nor should it be construed as advice designed to meet the needs of any particular investor. Please contact Segal Rogerscasey or another qualified investment professional for advice regarding the evaluation of any specific information, opinion, advice or other content. Of course, on all matters involving legal interpretations and regulatory issues, plan sponsors should consult legal counsel.
Copyright © 2016 by The Segal Group, Inc. All rights reserved.