highlights in the management of breast cancer roma, 10 maggio 2013 molecular tools for decision...
DESCRIPTION
3 Adjuvant Breast Cancer Treatment Molecular Tools for decision-making Biomarkers ER/PR HER2 Topoisomerase II BRCA1/BRCA2 KI67 Multi-Genes expression profiles (GEPs) Circulating Tumoral Cells (CTCs)TRANSCRIPT

Highlights in the Management of Breast CancerRoma, 10 Maggio 2013
Molecular tools for decision making in adjuvant therapy
Enrico Ricevuto & Valentina Cocciolone Oncologia Medica
Ospedale San Salvatore Università degli Studi di L’Aquila
2
Adjuvant Breast Cancer TreatmentKey issues Patients selection according to biomarkers
Selection of appropriate treatment
3
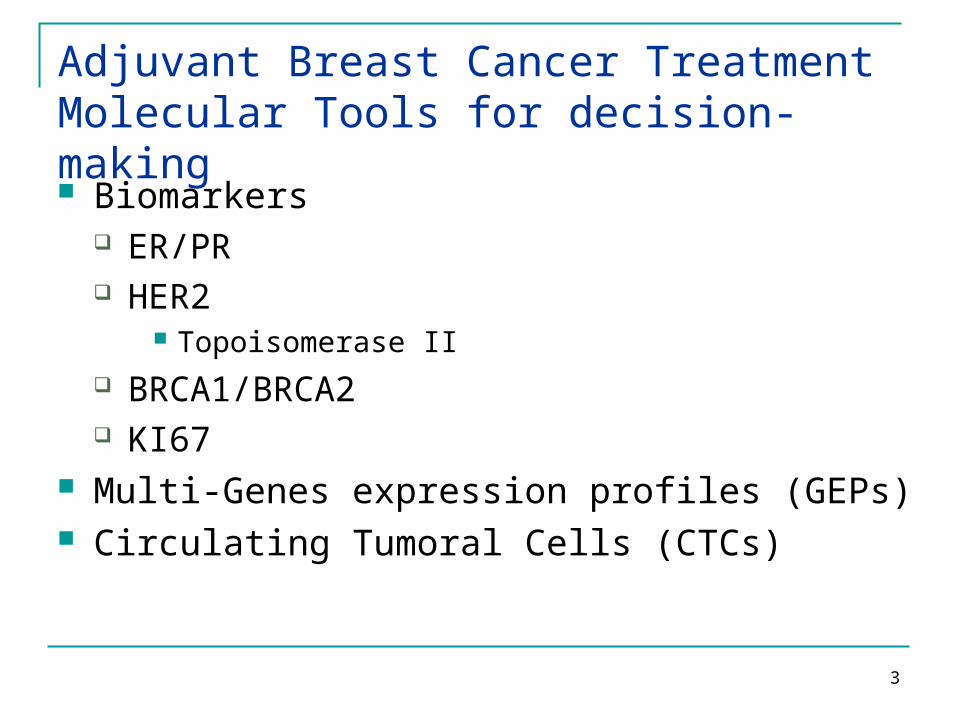
Adjuvant Breast Cancer TreatmentMolecular Tools for decision-making Biomarkers
ER/PR HER2
Topoisomerase II BRCA1/BRCA2 KI67
Multi-Genes expression profiles (GEPs) Circulating Tumoral Cells (CTCs)
4
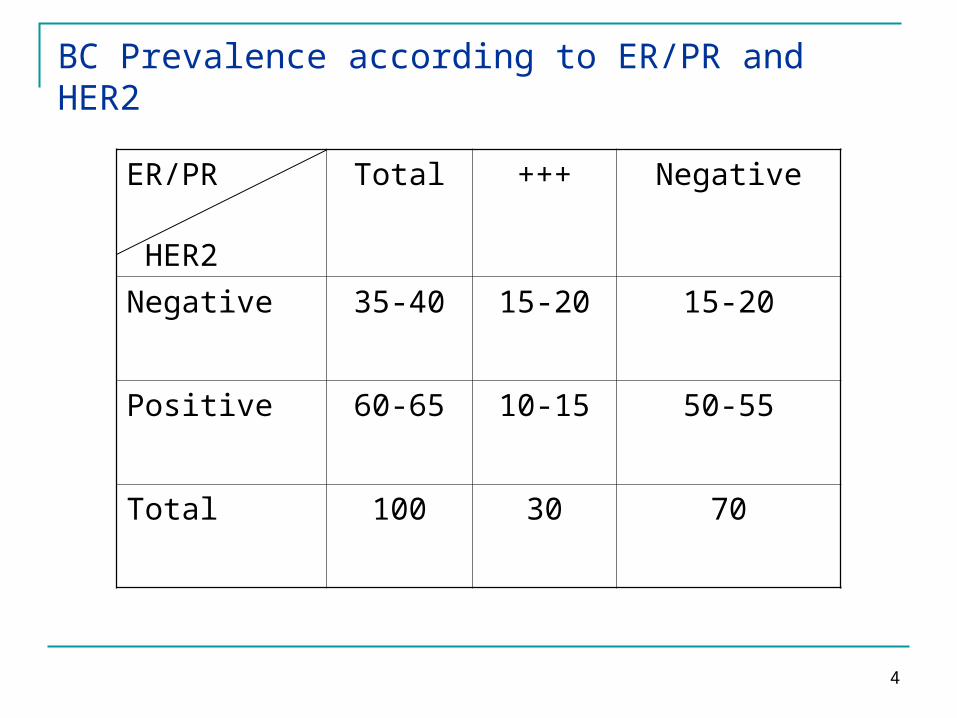
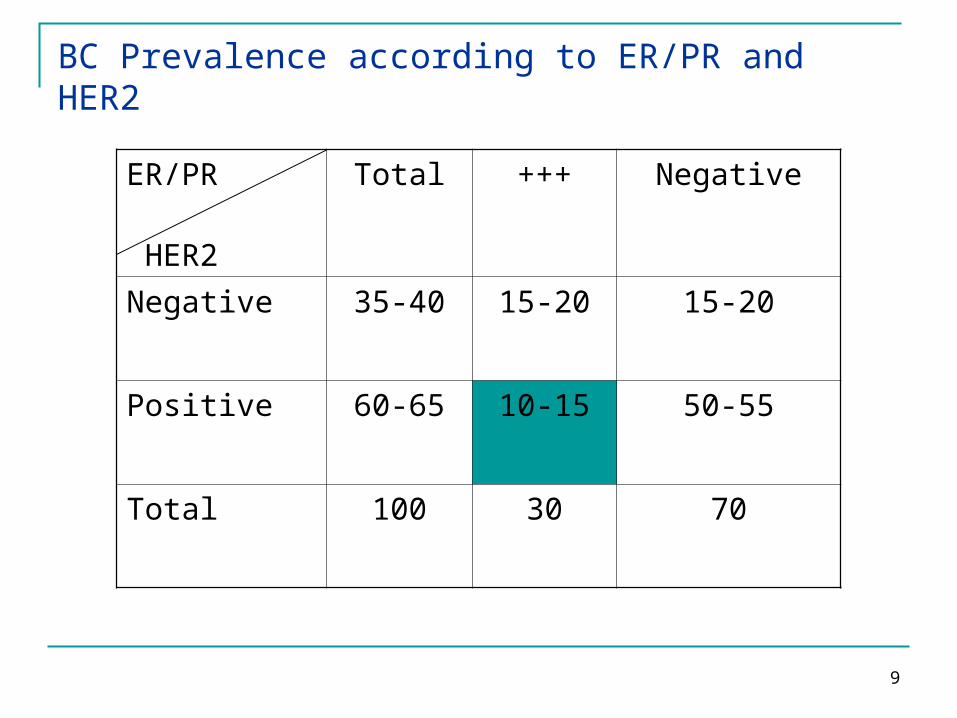
BC Prevalence according to ER/PR and HER2
ER/PR HER2
Total +++ Negative
Negative 35-40 15-20 15-20
Positive 60-65 10-15 50-55
Total 100 30 70

5
Hormone receptor status: prognostic potential
• Patients with ER-positive/PgR-positive and ER-positive/PgR-negative BC had significantly better prognoses than patients with ER-negative/PgR-negative disease.
• Patients with ER-positive/PgR-negative tumors tended to have slightly worse disease-free and overall survival than patients with ER-positive/PgR-positive tumors, but the differences did not achieve statistical significance (P .05)
Bordou et al. J Clin Oncol 2003; 21:1973-1979
6
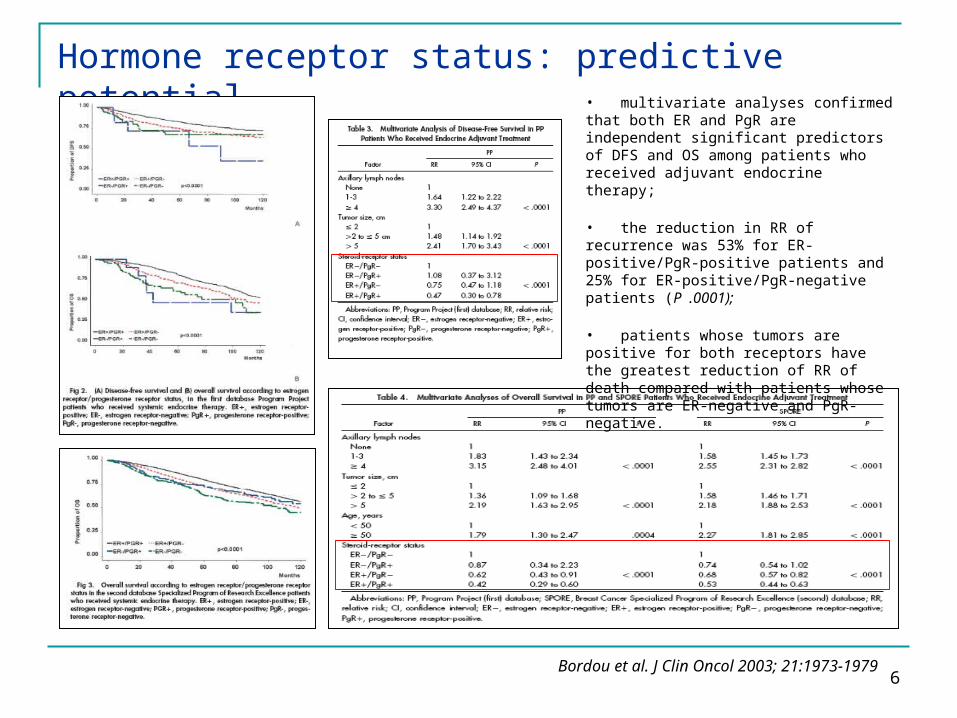
Hormone receptor status: predictive potential• multivariate analyses confirmed that both ER and PgR are independent significant predictors of DFS and OS among patients who received adjuvant endocrine therapy;
• the reduction in RR of recurrence was 53% for ER-positive/PgR-positive patients and 25% for ER-positive/PgR-negative patients (P .0001);
• patients whose tumors are positive for both receptors have the greatest reduction of RR of death compared with patients whose tumors are ER-negative and PgR-negative.
Bordou et al. J Clin Oncol 2003; 21:1973-1979
7
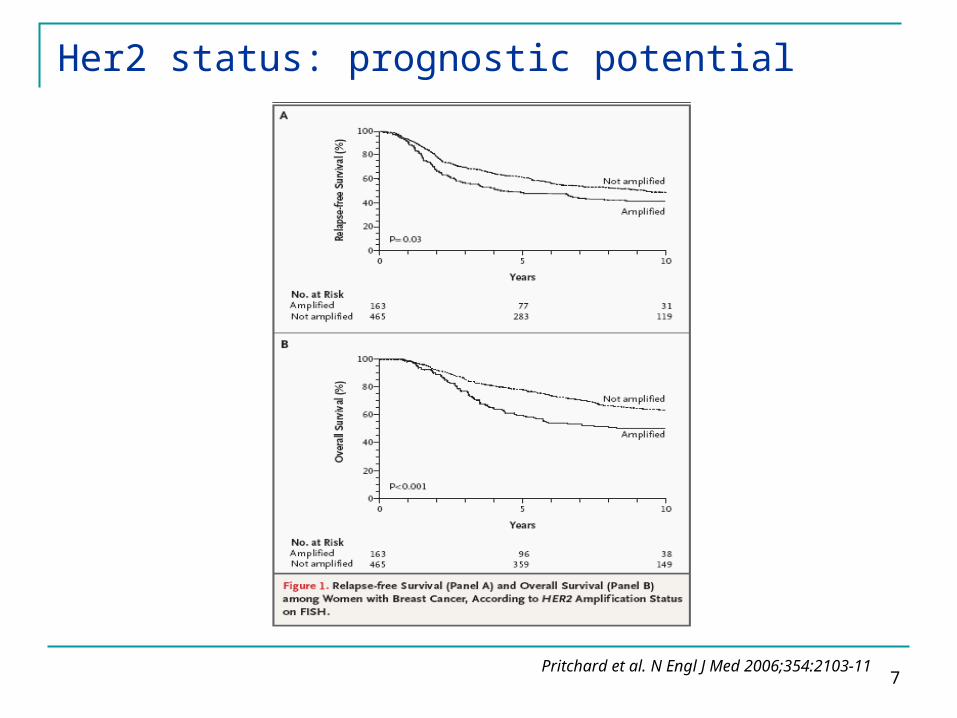
Her2 status: prognostic potential
Pritchard et al. N Engl J Med 2006;354:2103-11
8
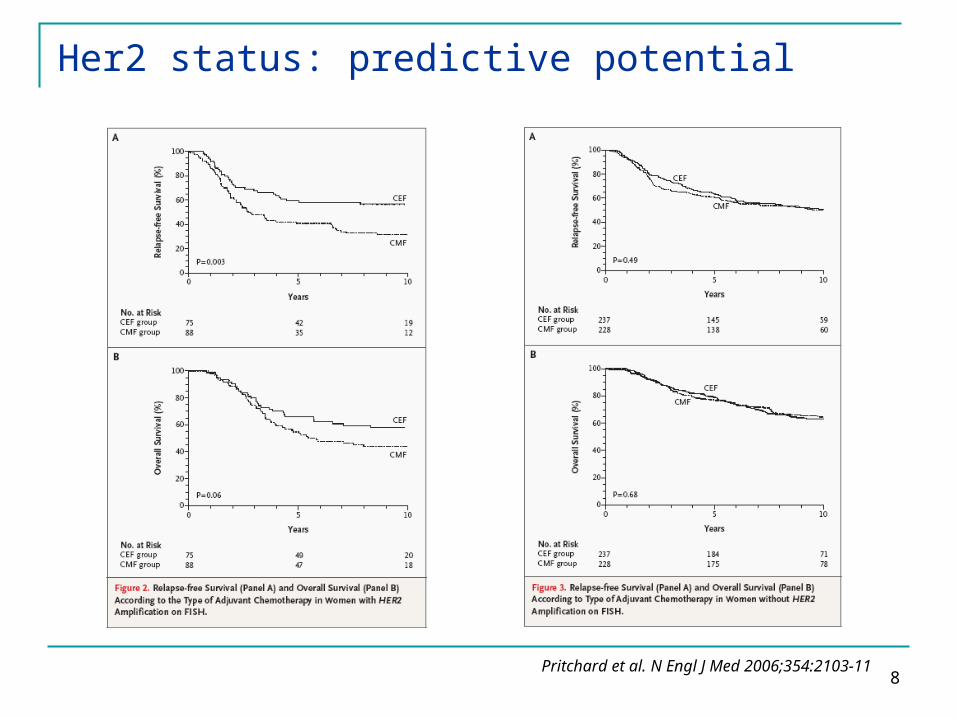
Her2 status: predictive potential
Pritchard et al. N Engl J Med 2006;354:2103-11
9
BC Prevalence according to ER/PR and HER2
ER/PR HER2
Total +++ Negative
Negative 35-40 15-20 15-20
Positive 60-65 10-15 50-55
Total 100 30 70
10
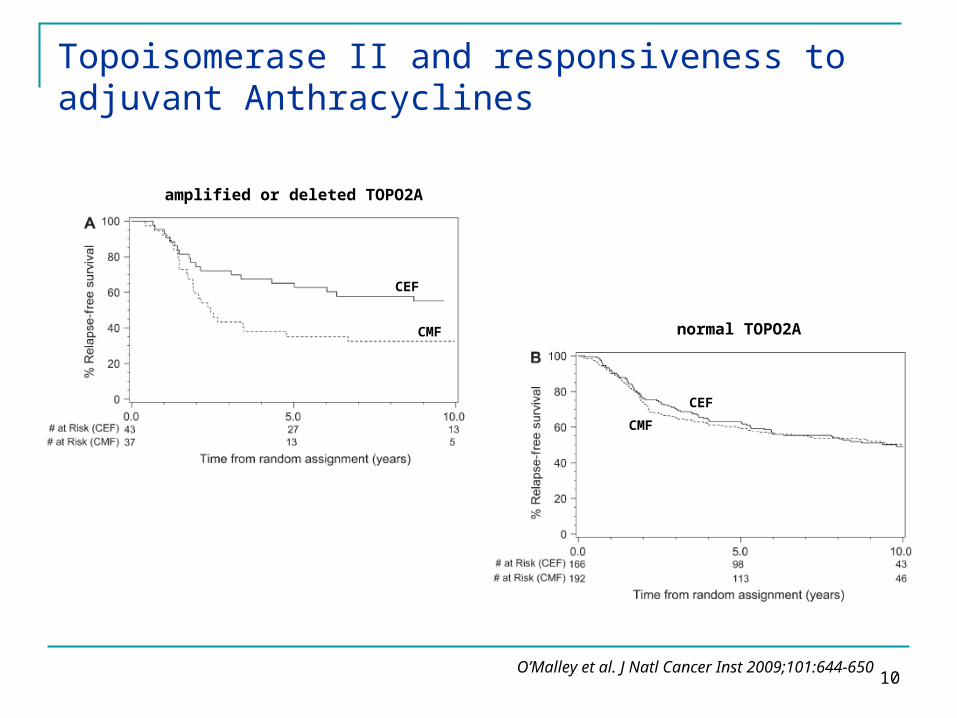
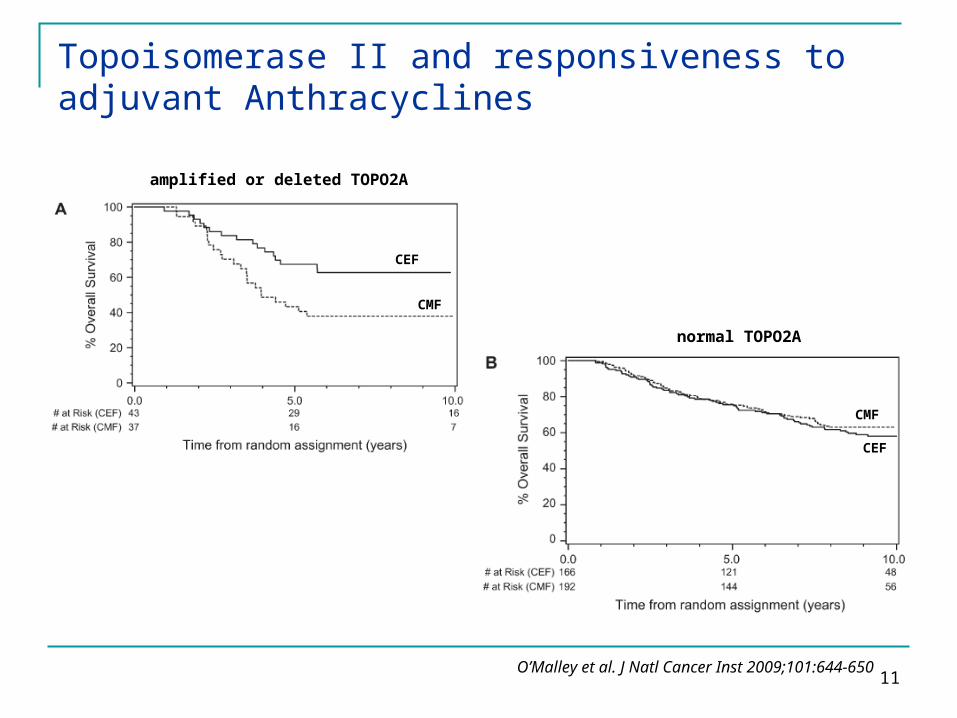
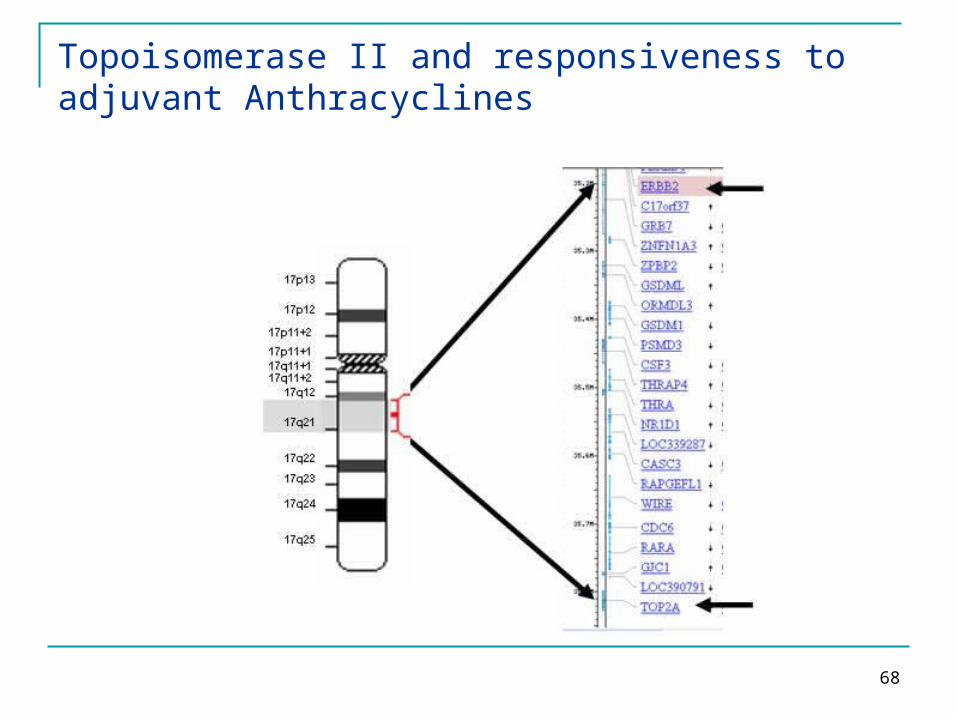
Topoisomerase II and responsiveness to adjuvant Anthracyclines
O’Malley et al. J Natl Cancer Inst 2009;101:644-650
CEF
CMF
CEFCMF
amplified or deleted TOPO2A
normal TOPO2A
11
Topoisomerase II and responsiveness to adjuvant Anthracyclines
amplified or deleted TOPO2A
normal TOPO2A
O’Malley et al. J Natl Cancer Inst 2009;101:644-650
CEF
CEF
CMF
CMF

12
TOPO2A HR 0.53 for RFS (p 0.09) HR 0.38 for OS (p 0.02)
Topoisomerase II and responsiveness to adjuvant Anthracyclines
HER2 HR 0.40 for RFS (p 0.008) HR 0.44 for OS (p 0.02)
Adjusted test for interaction:
O’Malley et al. J Natl Cancer Inst 2009;101:644-650

13
Topoisomerase II and responsiveness to adjuvant Anthracyclines
Slamon et al. N Engl J Med 2011;365-1273-83

14
BRCA1-ness in TNBC
ER/PR HER2
Total +++ Negative
Negative 35-40 15-20 BRCA1+ 11%“BRCA1-ness”>50%
Positive 60-65 10-15 50-55
Total 100 30 70
15
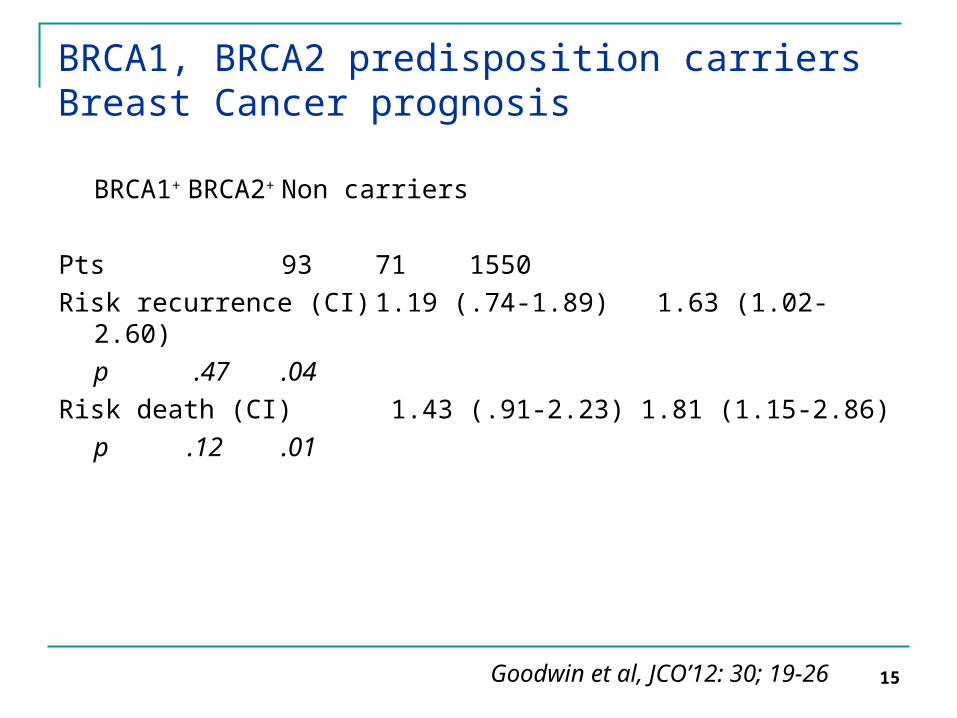
BRCA1, BRCA2 predisposition carriersBreast Cancer prognosis
BRCA1+ BRCA2+ Non carriers
Pts 93 71 1550Risk recurrence (CI) 1.19 (.74-1.89) 1.63 (1.02-2.60)
p .47 .04Risk death (CI) 1.43 (.91-2.23) 1.81 (1.15-2.86)
p .12 .01
Goodwin et al, JCO’12: 30; 19-26

16
Ki67: prognostic role in EBC
de Azambuja et al. Br J Cancer 2007;96:1504-13
Despite some limitations, this meta-analysis supports the
prognostic role of Ki-67 in early BC,
by showing a significant association between its
expression and the risk of
recurrence and death in all populations
considered and for both
outcomes, DFS and OS.

17
Two different gene sets: first, a set of 476 cDNA
clones previously selected to reflect intrinsic
properties of the tumors and, second, a gene set
that highly correlated with patient outcome.
Breast Cancer Genomics and Clinical Classification
Sørlie et al. Proc Natl Acad Sci USA 2001;98:10869-74

18
Gene expression profiling predicts clinical outcome of breast cancer
Van de Vijver et al. N Engl J Med 2002;347:1999-2009
Panel A shows the pattern of expression of the 70 marker genes in a series of 295 consecutive patients with breast carcinomas. Each row
represents the prognostic profile of the 70 marker genes for one tumor, and each column represents the relative level of expression of one gene. The tumors are numbered from 1 to 295 on the y axis,
and the genes are numbered from 1 to 70 on the x axis. Red indicates a high level of expression of messenger RNA (mRNA) in the
tumor, as compared with the reference level of mRNA, and green indicates a low level of expression. The dotted line is the determined threshold between a good-prognosis signature and a poor-prognosis
signature.
Panel B shows the time in years to distant metastases as a first event for those in whom this occurred, and the total duration of
follow-up for all other patients.
Panel C shows the lymph-node status (blue marks indicate lymph-node–positive disease, and white lymph-node–negative disease), the
number of patients with distant metastases as a first event (blue marks), and the number of patients who died (blue marks).
19
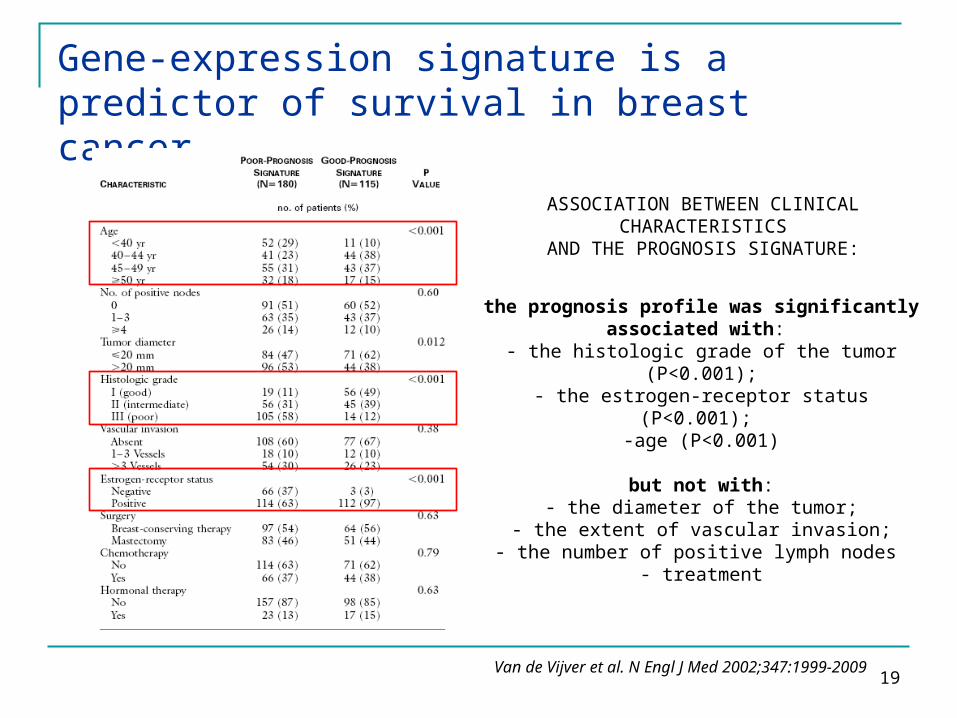
Gene-expression signature is a predictor of survival in breast cancer
ASSOCIATION BETWEEN CLINICAL CHARACTERISTICS
AND THE PROGNOSIS SIGNATURE:
the prognosis profile was significantly associated with:
- the histologic grade of the tumor (P<0.001);- the estrogen-receptor status (P<0.001);
-age (P<0.001)
but not with:- the diameter of the tumor;
- the extent of vascular invasion;- the number of positive lymph nodes
- treatment
Van de Vijver et al. N Engl J Med 2002;347:1999-2009
20
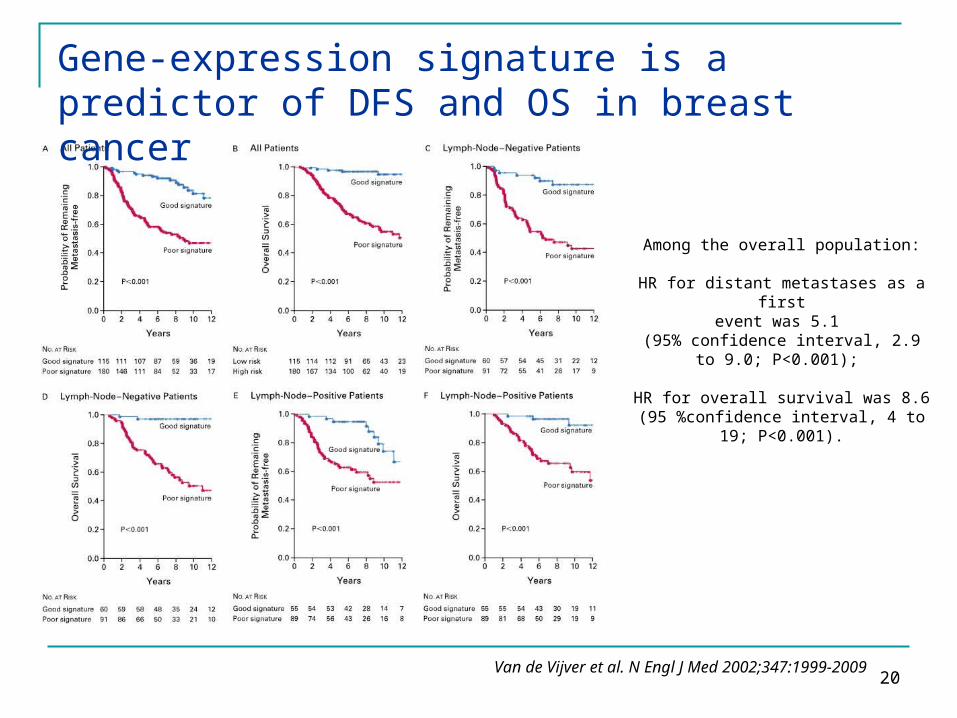
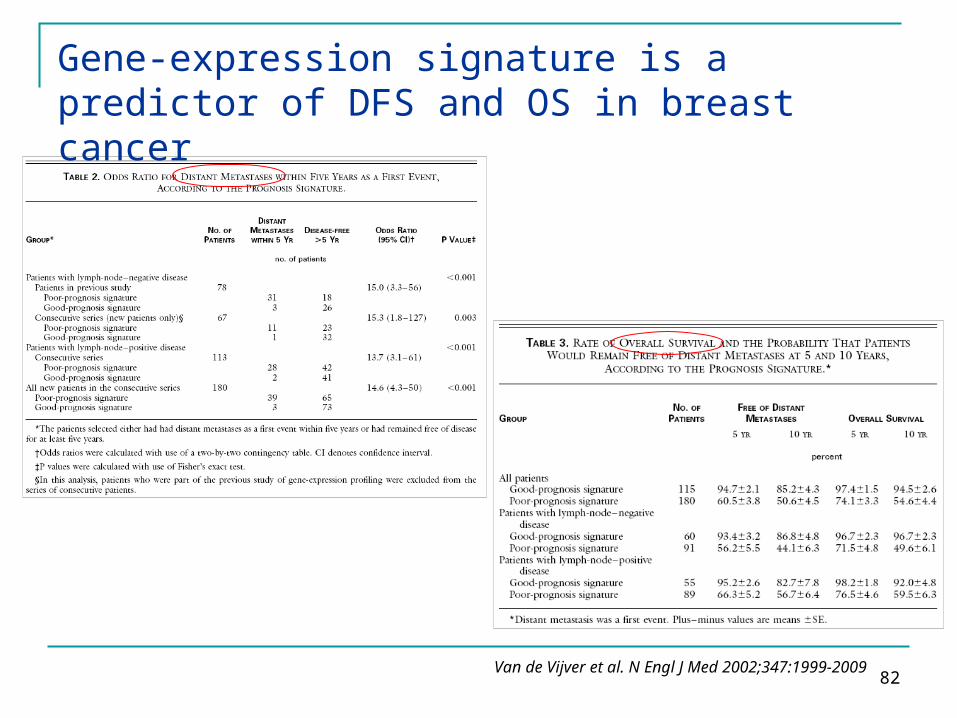
Gene-expression signature is a predictor of DFS and OS in breast cancer
Van de Vijver et al. N Engl J Med 2002;347:1999-2009
Among the overall population:
HR for distant metastases as a firstevent was 5.1
(95% confidence interval, 2.9 to 9.0; P<0.001);
HR for overall survival was 8.6(95 %confidence interval, 4 to 19;
P<0.001).
21
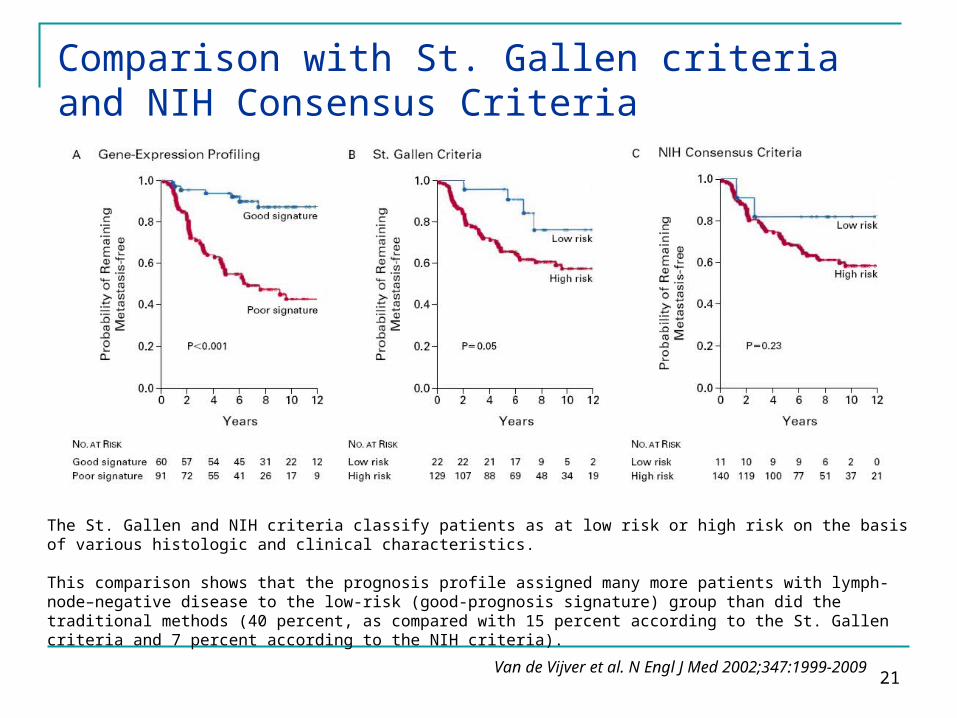
The St. Gallen and NIH criteria classify patients as at low risk or high risk on the basis of various histologic and clinical characteristics.
This comparison shows that the prognosis profile assigned many more patients with lymph-node–negative disease to the low-risk (good-prognosis signature) group than did the traditional methods (40 percent, as compared with 15 percent according to the St. Gallen criteria and 7 percent according to the NIH criteria).
Comparison with St. Gallen criteria and NIH Consensus Criteria
Van de Vijver et al. N Engl J Med 2002;347:1999-2009
22
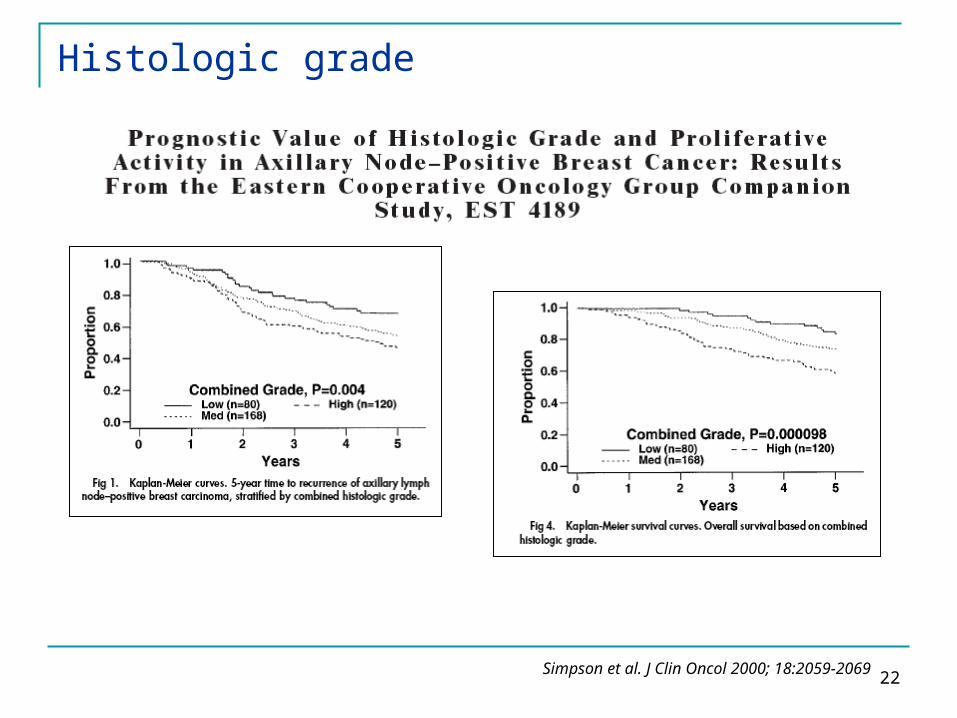
Histologic grade
Simpson et al. J Clin Oncol 2000; 18:2059-2069
23
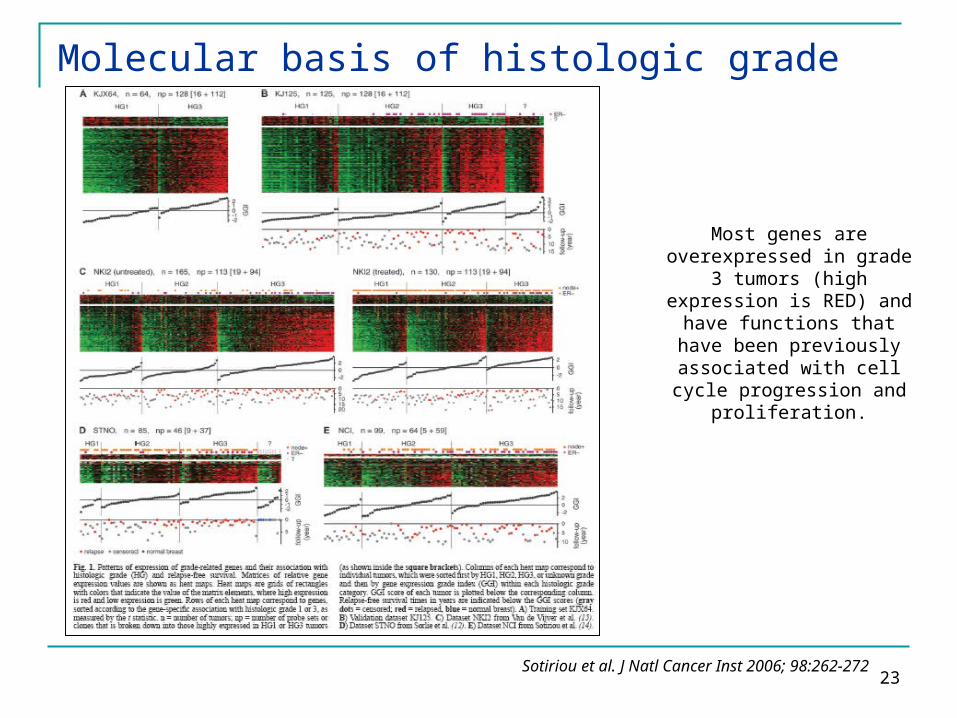
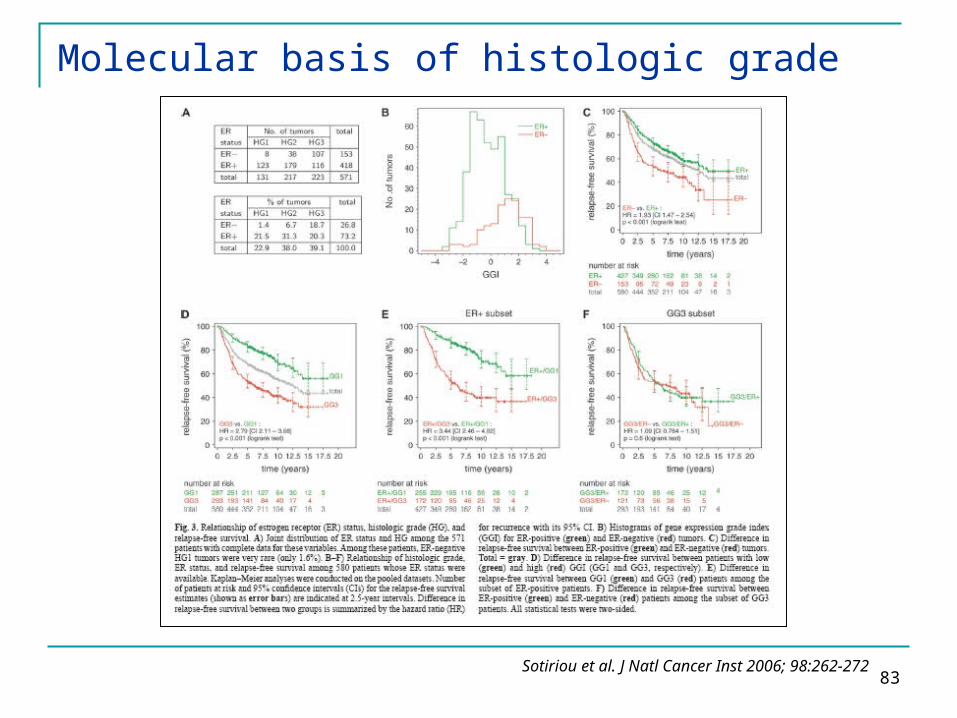
Molecular basis of histologic grade
Sotiriou et al. J Natl Cancer Inst 2006; 98:262-272
Most genes are overexpressed in grade 3 tumors (high expression is RED) and have functions
that have been previously associated with cell cycle
progression and proliferation.
24
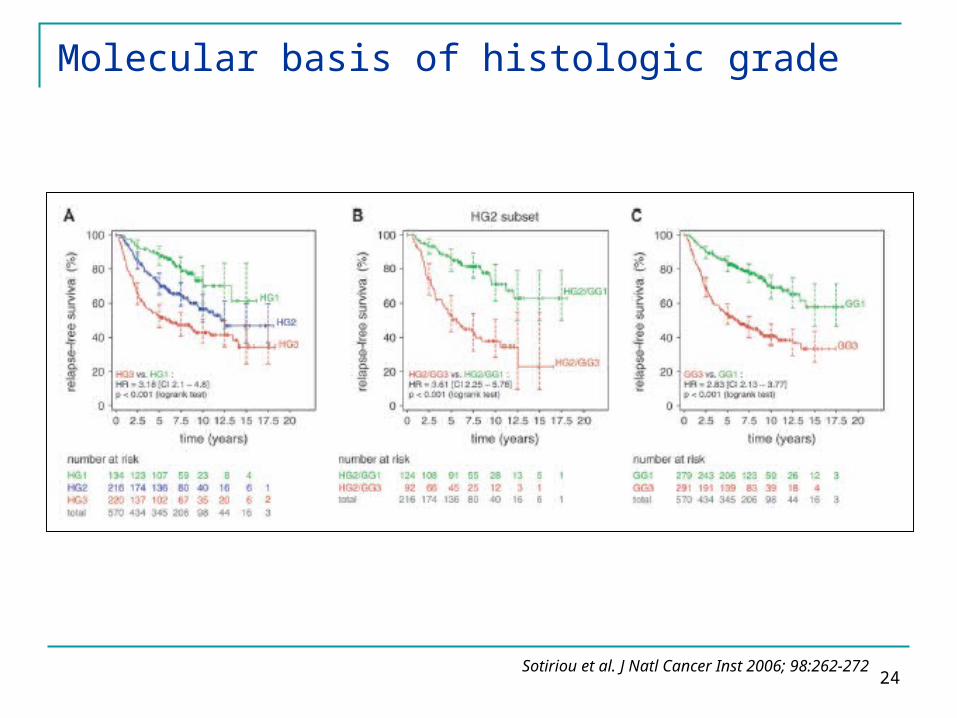
Molecular basis of histologic grade
Sotiriou et al. J Natl Cancer Inst 2006; 98:262-272
25
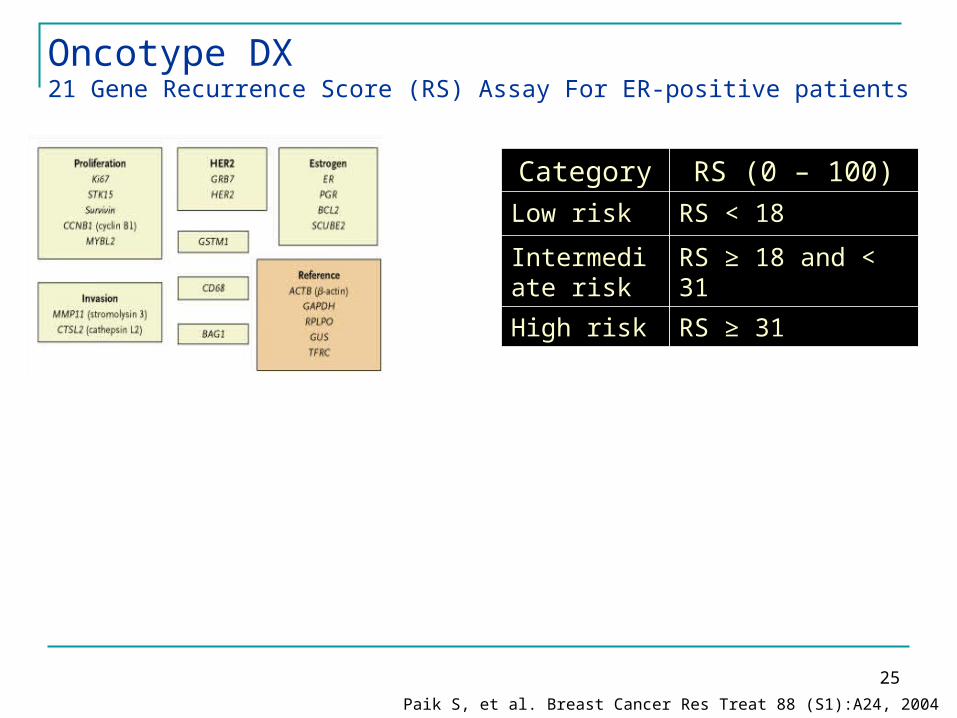
Oncotype DX 21 Gene Recurrence Score (RS) Assay For ER-positive patients
Category RS (0 – 100)Low risk RS < 18
Intermediate risk
RS ≥ 18 and < 31
High risk RS ≥ 31
N Events 117 13 47 18
Paik S, et al. Breast Cancer Res Treat 88 (S1):A24, 2004
26
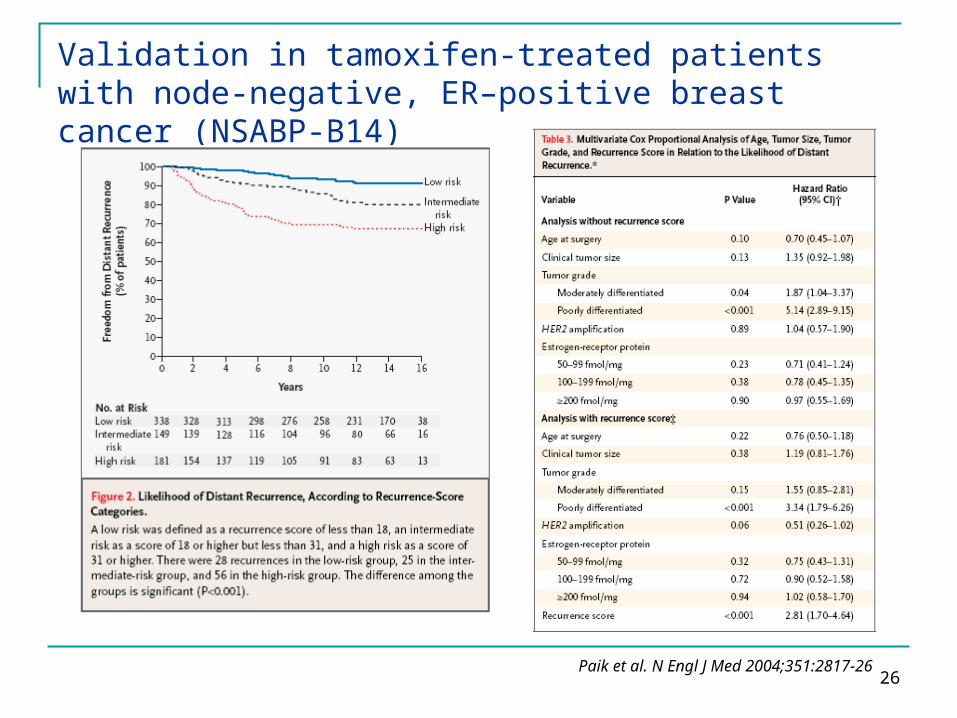
Validation in tamoxifen-treated patients with node-negative, ER–positive breast cancer (NSABP-B14)
Paik et al. N Engl J Med 2004;351:2817-26
27
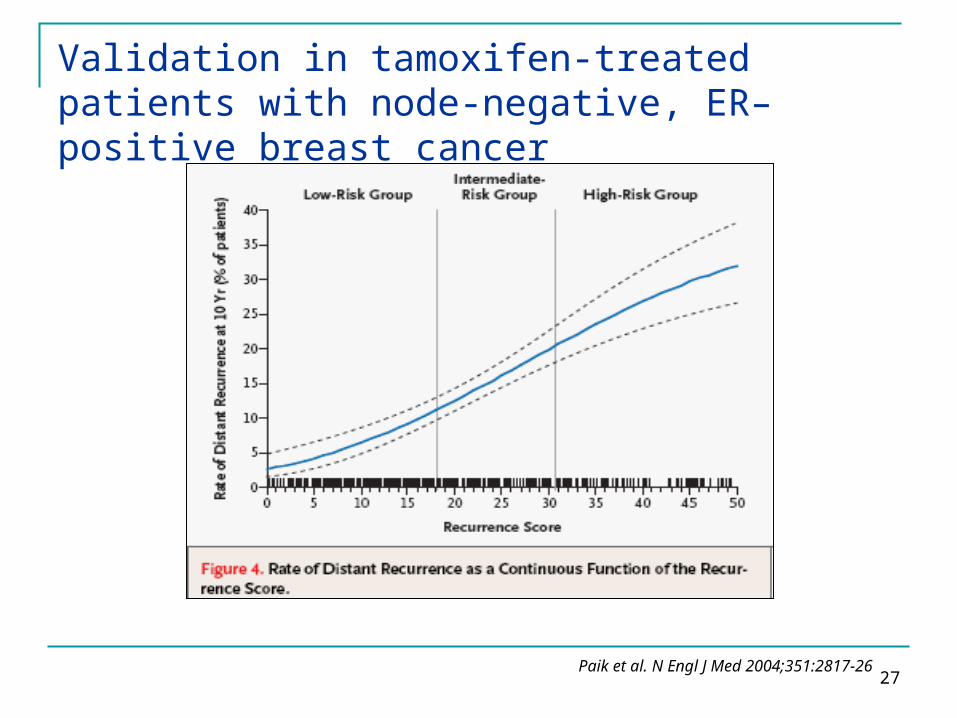
Validation in tamoxifen-treated patients with node-negative, ER–positive breast cancer
Paik et al. N Engl J Med 2004;351:2817-26
28
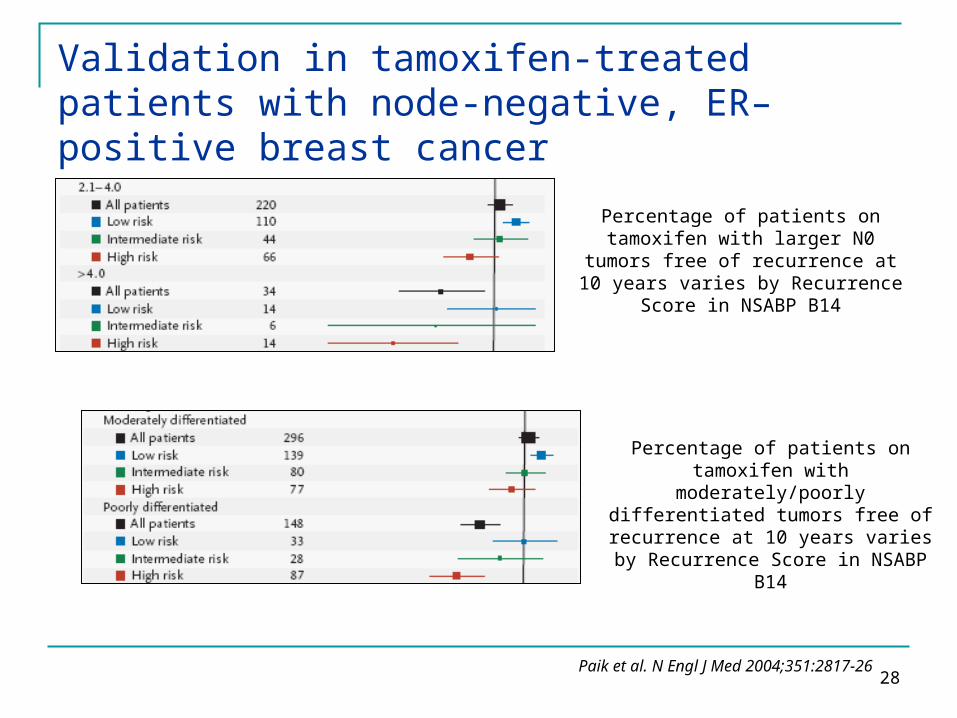
Percentage of patients on tamoxifen with larger N0 tumors
free of recurrence at 10 years varies by Recurrence Score in
NSABP B14
Percentage of patients on tamoxifen with moderately/poorly
differentiated tumors free of recurrence at 10 years varies by Recurrence Score in NSABP B14
Validation in tamoxifen-treated patients with node-negative, ER–positive breast cancer
Paik et al. N Engl J Med 2004;351:2817-26

29
Prognostic disease-free survival and overall survival analyses by Recurrence Score group in patients treated with TAMOXIFEN ALONE
Validation in tamoxifen-treated patients with node-positive, ER–positive breast cancer
Albain et al. Lancet Oncol 2010; 11:55–65
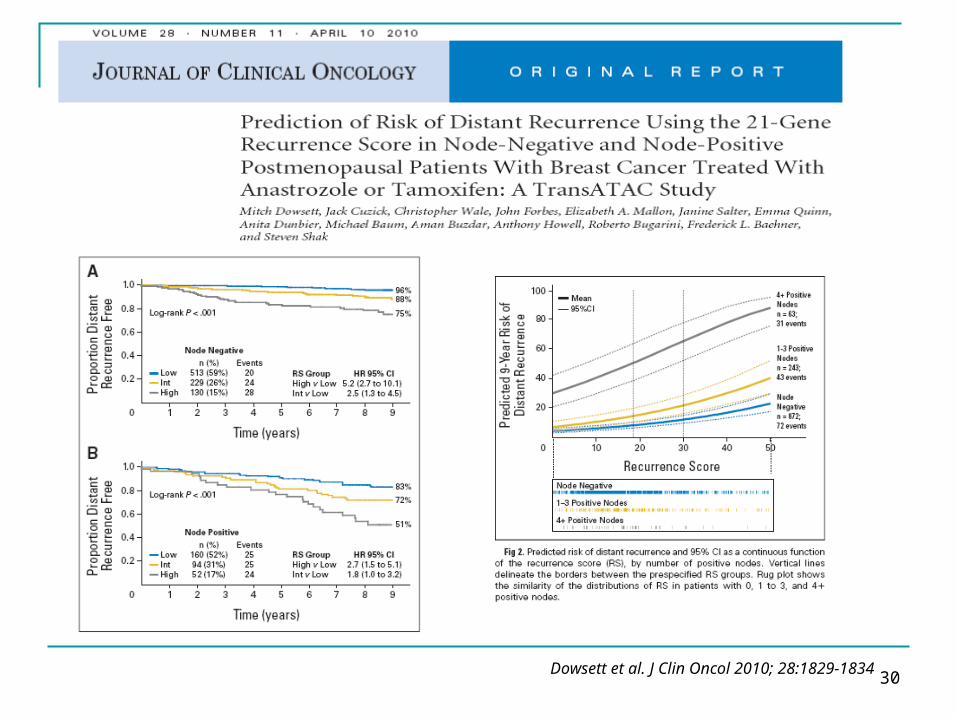
30Dowsett et al. J Clin Oncol 2010; 28:1829-1834

31
Many patients live normal life expectancy free of breast cancer recurrence after surgical treatment alone
1.3% of recurrences occurred after 20 years
(3.7% of the 20-year survivors)
Albain KS. Presented at SABCS 2012

32
10-Year Survival Rate by axillary node status for patients treated with radical mastectomy
Study 1-3+ Nodes 4+ Nodes
Valagussa, 1978 50% 24%
Haagensen, 1986 63% 27%
Fisher B, 1975 38% 13%
Ferguson, 1982 52% 27%
Albain KS. Presented at SABCS 2012
33
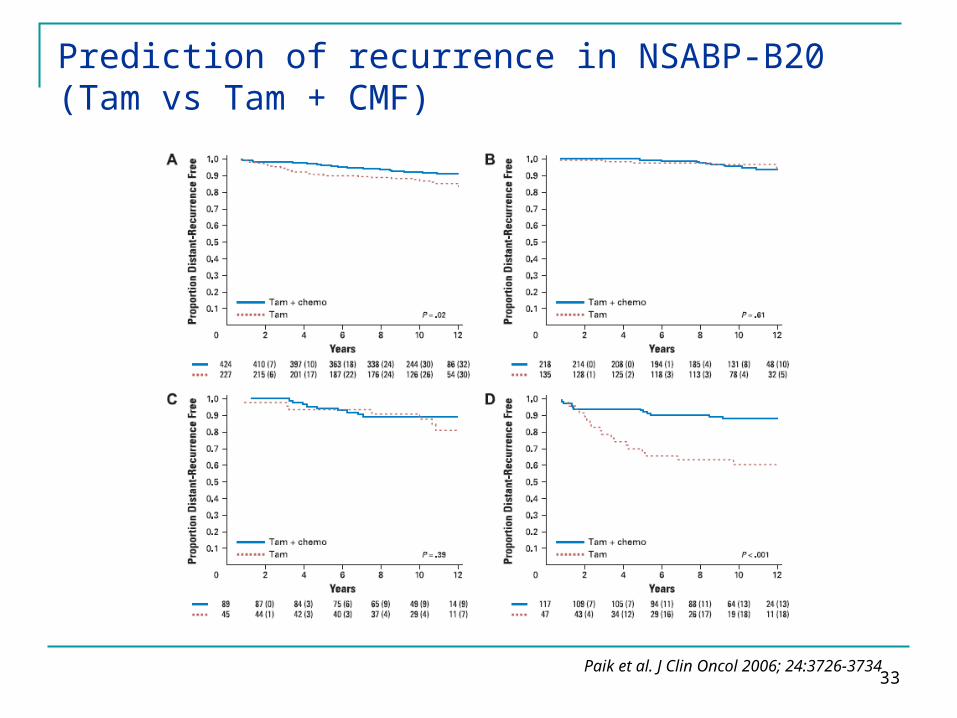
Prediction of recurrence in NSABP-B20 (Tam vs Tam + CMF)
Paik et al. J Clin Oncol 2006; 24:3726-3734

34
NSABP-B20
Paik et al. J Clin Oncol 2006; 24:3726-3734
35
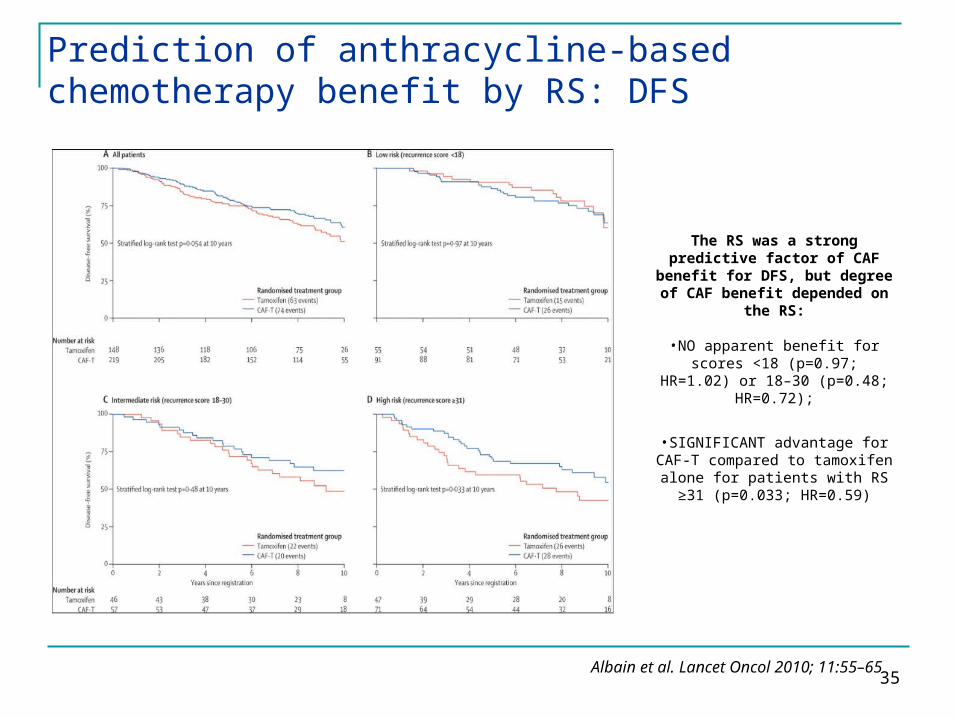
Prediction of anthracycline-based chemotherapy benefit by RS: DFS
Albain et al. Lancet Oncol 2010; 11:55–65
The RS was a strong predictive factor of CAF
benefit for DFS, but degree of CAF benefit depended on
the RS:
•NO apparent benefit for scores <18 (p=0.97; HR=1.02) or 18–
30 (p=0.48; HR=0.72);
•SIGNIFICANT advantage for CAF-T compared to tamoxifen alone for patients with RS ≥31
(p=0.033; HR=0.59)
36
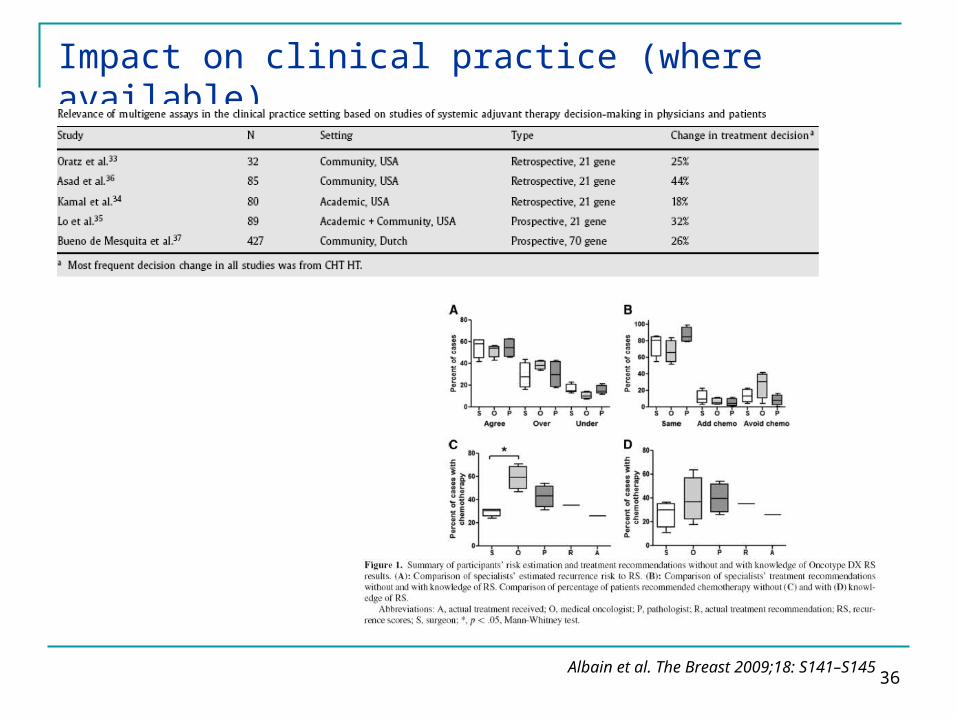
Impact on clinical practice (where available)
Albain et al. The Breast 2009;18: S141–S145
37
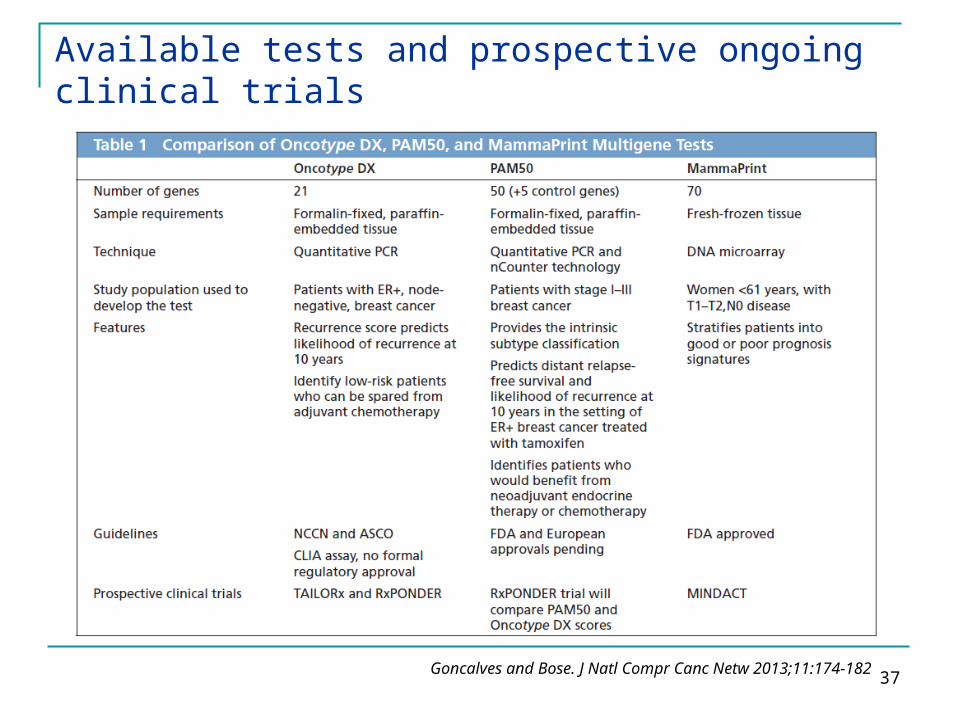
Available tests and prospective ongoing clinical trials
Goncalves and Bose. J Natl Compr Canc Netw 2013;11:174-182
38
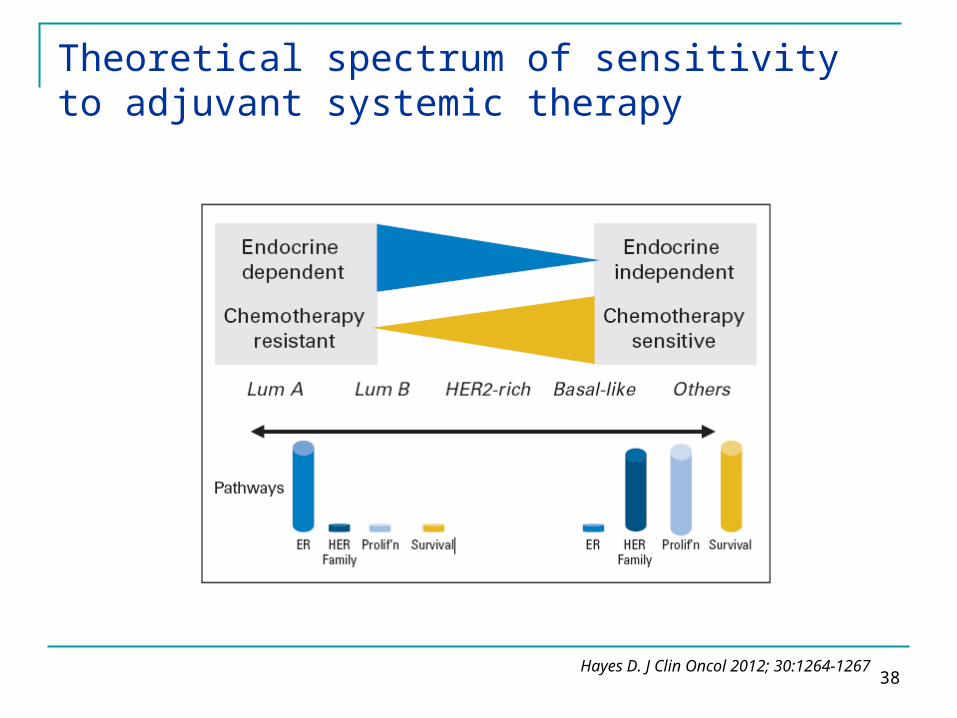
Theoretical spectrum of sensitivity to adjuvant systemic therapy
Hayes D. J Clin Oncol 2012; 30:1264-1267
39
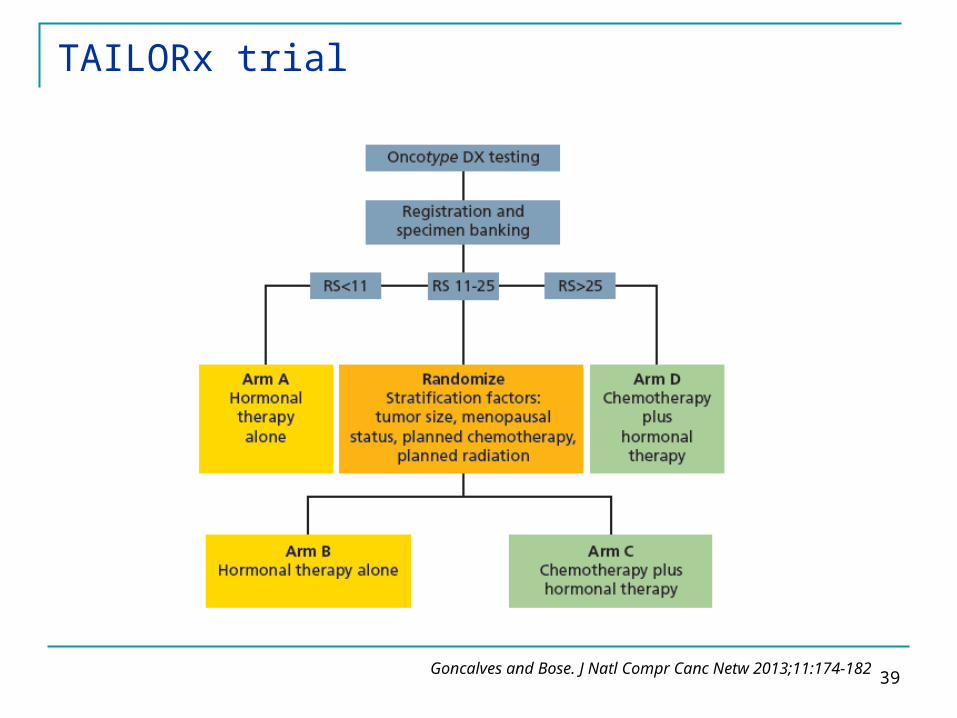
TAILORx trial
Goncalves and Bose. J Natl Compr Canc Netw 2013;11:174-182
40
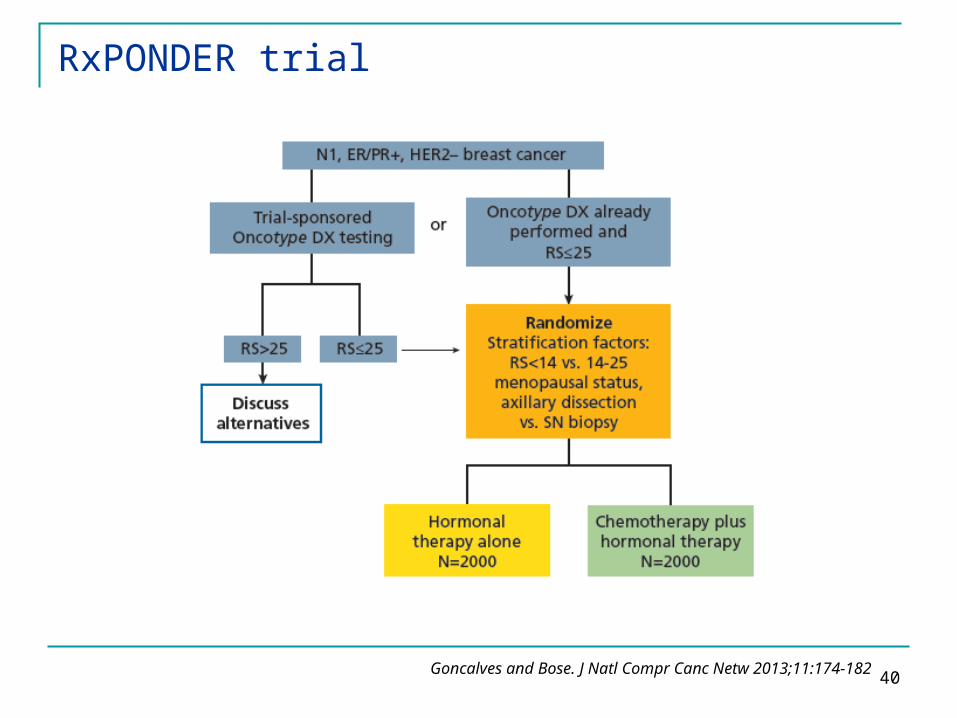
RxPONDER trial
Goncalves and Bose. J Natl Compr Canc Netw 2013;11:174-182
41
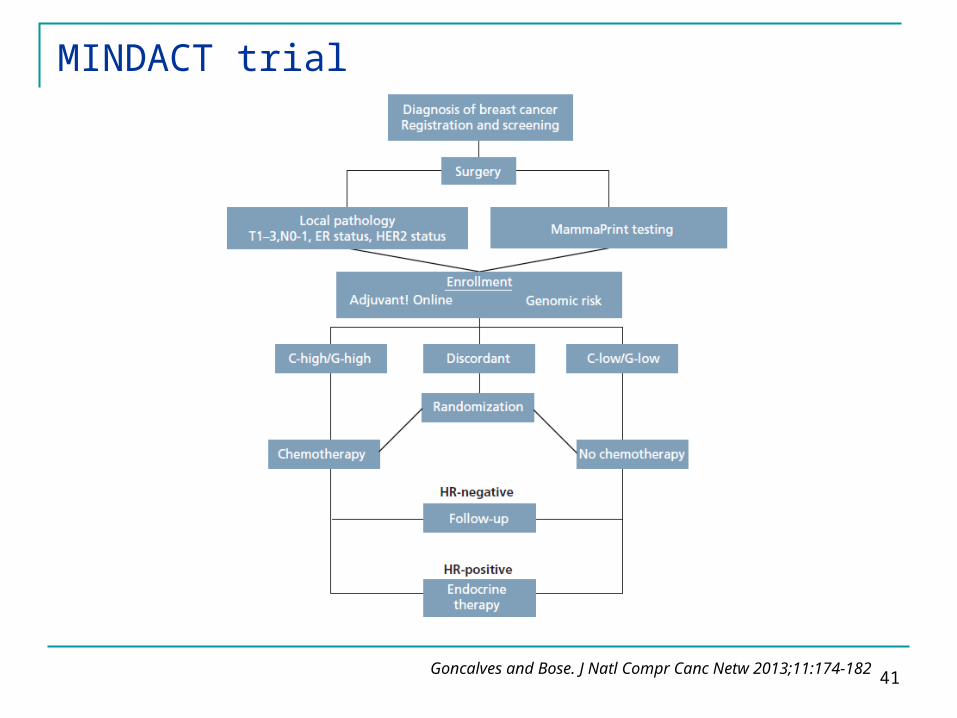
MINDACT trial
Goncalves and Bose. J Natl Compr Canc Netw 2013;11:174-182
42
Adjuvant Breast Cancer TreatmentKey questions Patients selection according to biomarkers
Selection of appropriate treatment no adjuvant treatment Chemotherapy Hormonal therapy
43
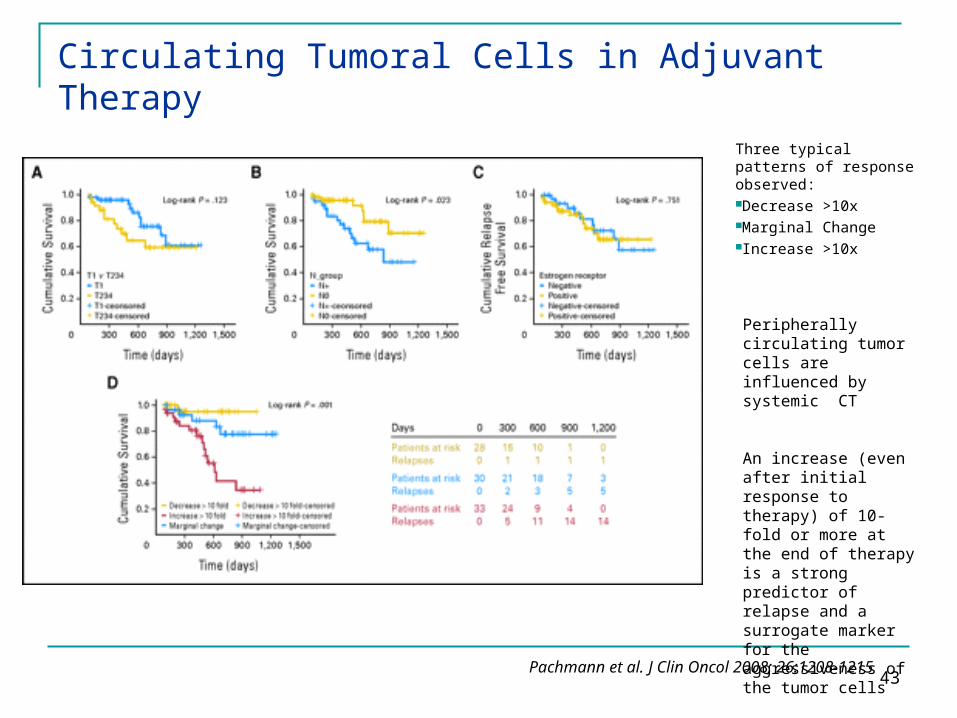
Circulating Tumoral Cells in Adjuvant Therapy
Three typical patterns of response observed:Decrease >10xMarginal ChangeIncrease >10x
Pachmann et al. J Clin Oncol 2008; 26:1208-1215
Peripherally circulating tumor cells are influenced by systemic CT
An increase (even after initial response to therapy) of 10-fold or more at the end of therapy is a strong predictor of relapse and a surrogate marker for the aggressiveness of the tumor cells
44
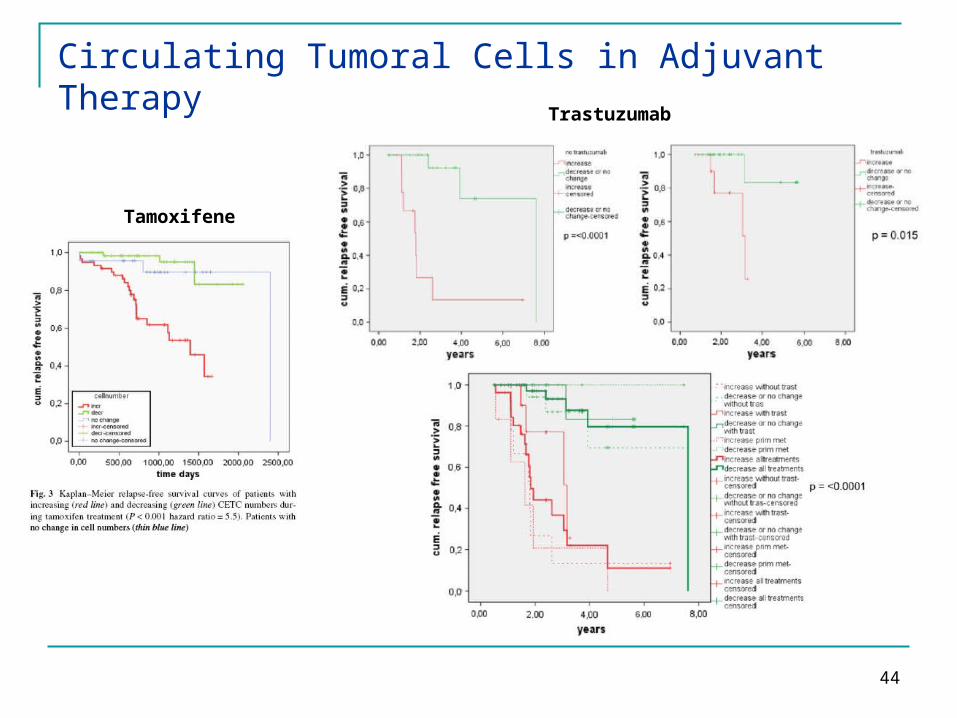
Circulating Tumoral Cells in Adjuvant Therapy
Tamoxifene
Trastuzumab
45
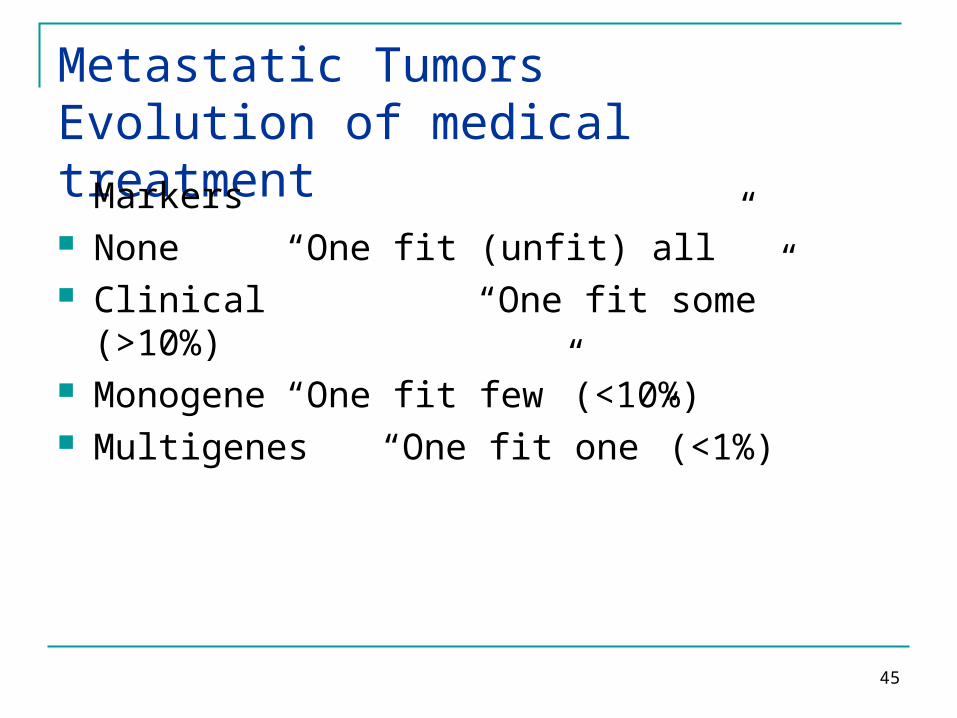
Metastatic Tumors Evolution of medical treatment
Markers None “One fit (unfit) all” Clinical “One fit some” (>10%) Monogene “One fit few” (<10%) Multigenes “One fit one” (<1%)
46
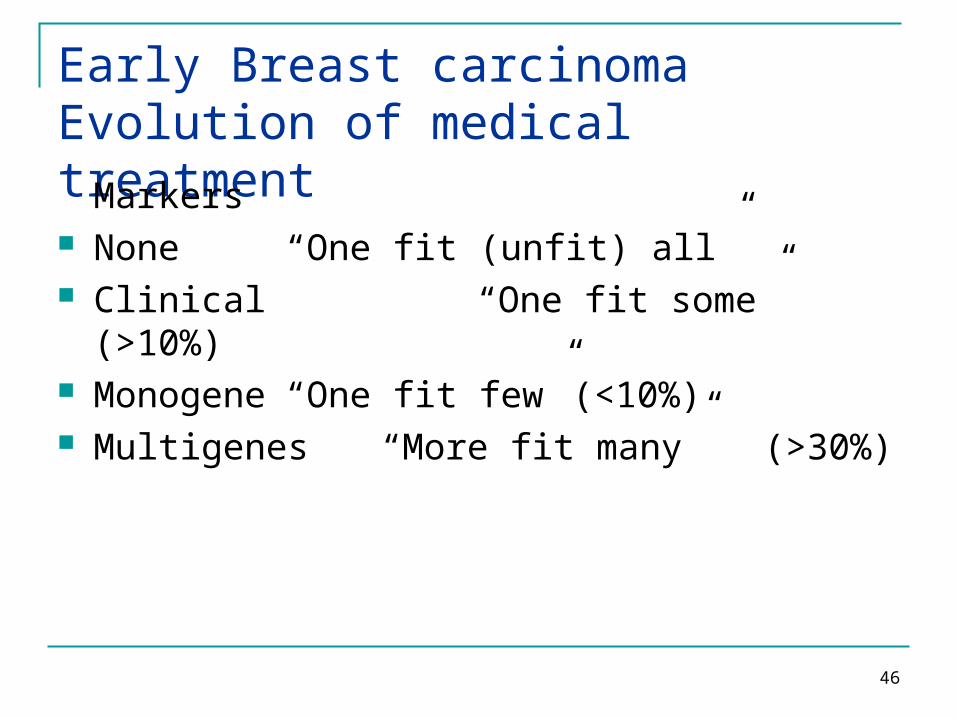
Early Breast carcinoma Evolution of medical treatment
Markers None “One fit (unfit) all” Clinical “One fit some” (>10%) Monogene “One fit few” (<10%) Multigenes “More fit many” (>30%)

47
48
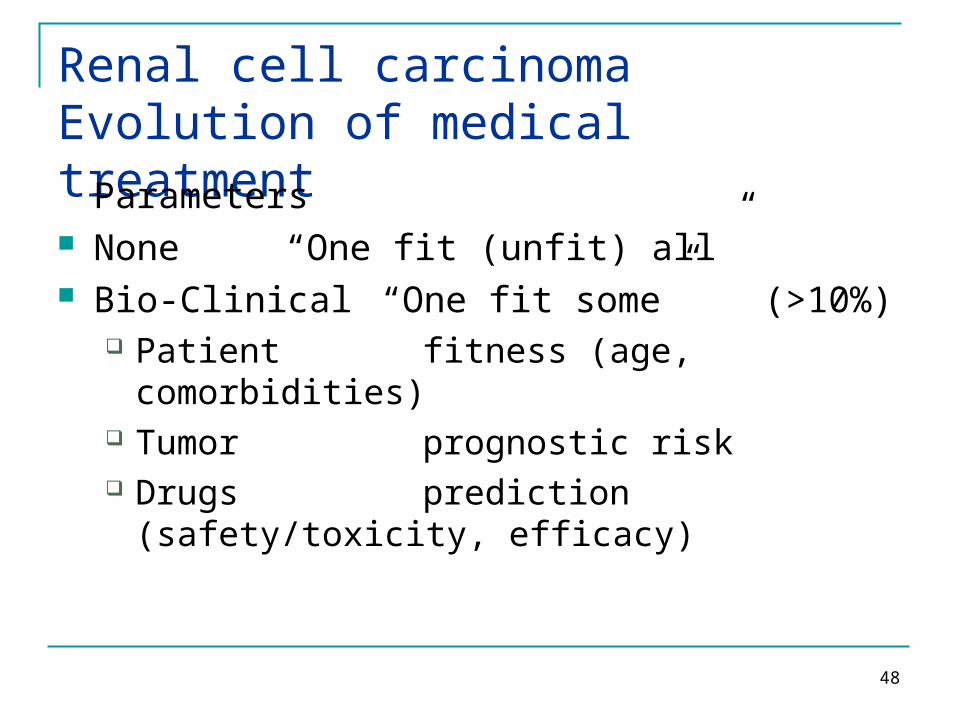
Renal cell carcinoma Evolution of medical treatment
Parameters None “One fit (unfit) all” Bio-Clinical “One fit some” (>10%)
Patient fitness (age, comorbidities) Tumor prognostic risk Drugs prediction (safety/toxicity, efficacy)
49
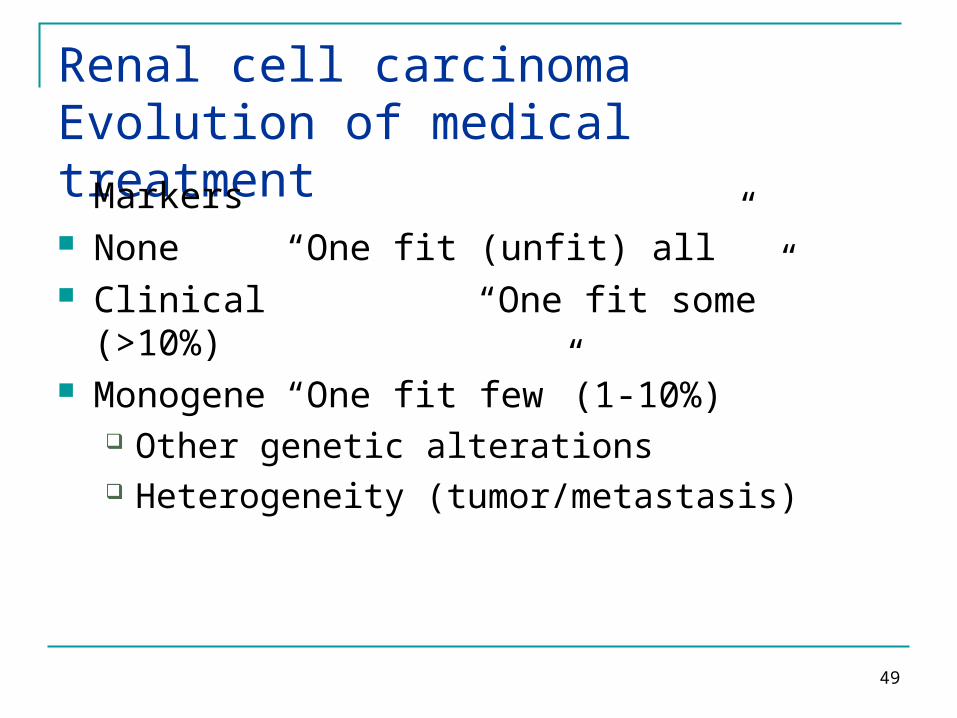
Renal cell carcinoma Evolution of medical treatment
Markers None “One fit (unfit) all” Clinical “One fit some” (>10%) Monogene “One fit few” (1-10%)
Other genetic alterations Heterogeneity (tumor/metastasis)
50
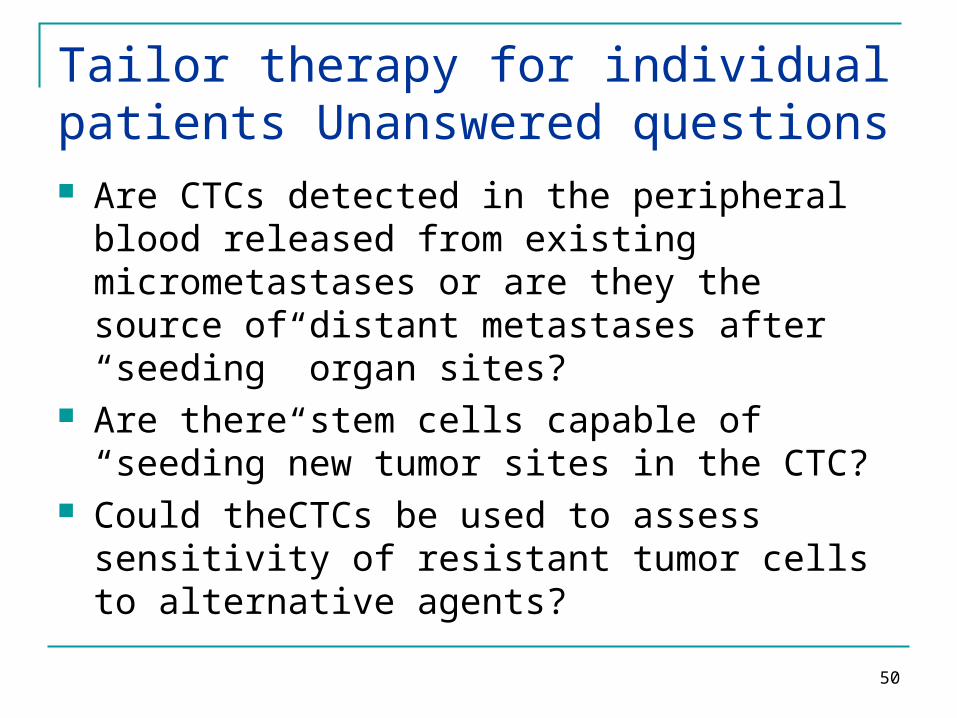
Tailor therapy for individual patients Unanswered questions Are CTCs detected in the peripheral blood
released from existing micrometastases or are they the source of distant metastases after “seeding” organ sites?
Are there stem cells capable of “seeding”new tumor sites in the CTC?
Could theCTCs be used to assess sensitivity of resistant tumor cells to alternative agents?

51
Adjuvant Breast Cancer TreatmentKey questions Selection of appropriate treatment
Chemotherapy anthracycline-based taxane-based +Trastuzumab +Hormonetherapy A/T-based
Hormonetherapy SERMs Aromatase Inhibitors

52
Multi-Gene Predictors in Breast Cancer (1)
ClassificationPerou
Grading Sotiriou
OncotypeDx Genomic Health
MammaPrintAgendia
Number of Genes 427/33,000 97 21 70
Indication Tumor Subtypes Molecular Grading PrognosisTamox/CMF
Prognosis
Guide to Specific Therapy
No No YesCMF
ER/HER2
No
Platform Stanford/ Affymetrix Affymetrix RT-PCR GE/Agilent
FormalinParaffin
In Development No Yes No
FDA Approval No No ? Pending Yes
Commercial Status
None None On the Market On the Market

53
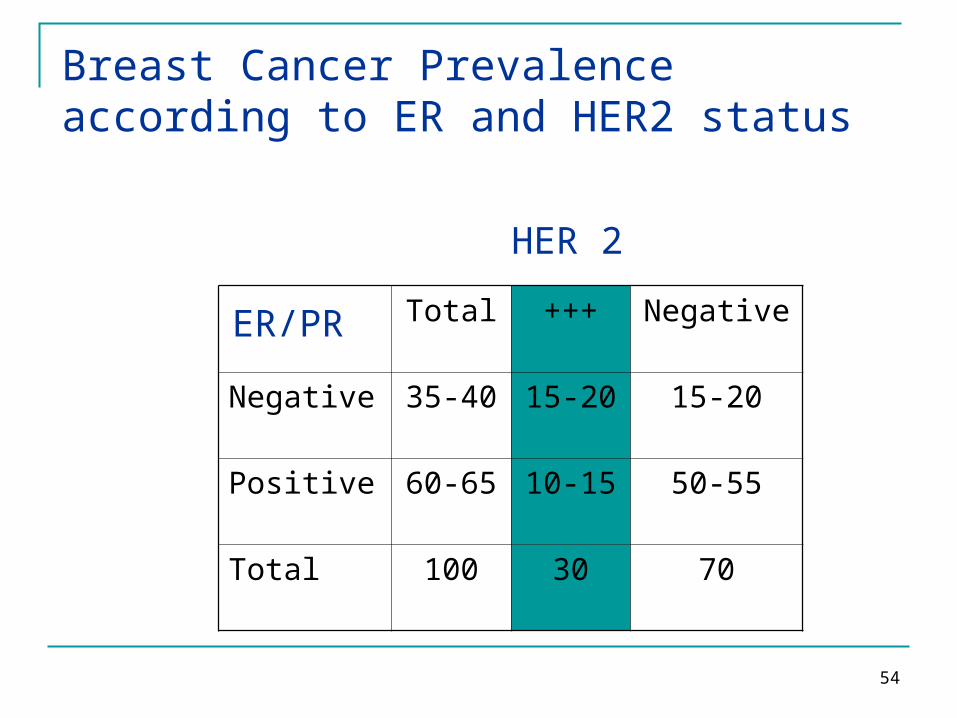
Breast Cancer Prevalence according to ER and HER2 status
Total +++ Negative
Negative 35-40 15-20 15-20
Positive 60-65 10-15 50-55
Total 100 30 70
HER 2
ER/PR
54
Breast Cancer Prevalence according to ER and HER2 status
Total +++ Negative
Negative 35-40 15-20 15-20
Positive 60-65 10-15 50-55
Total 100 30 70
HER 2
ER/PR
55
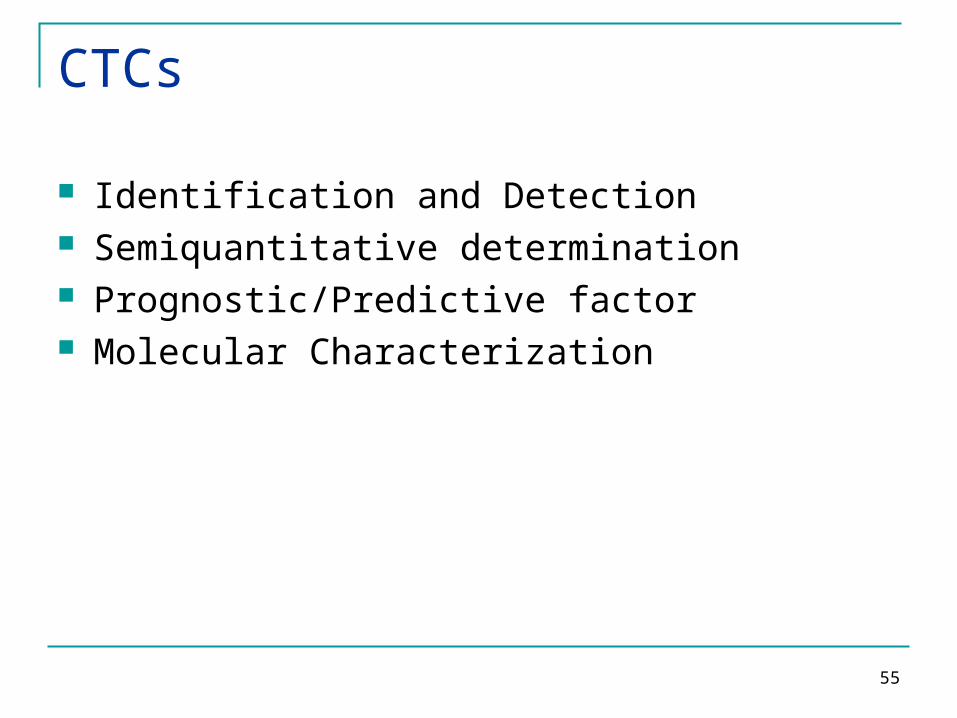
CTCs Identification and Detection Semiquantitative determination Prognostic/Predictive factor Molecular Characterization
56
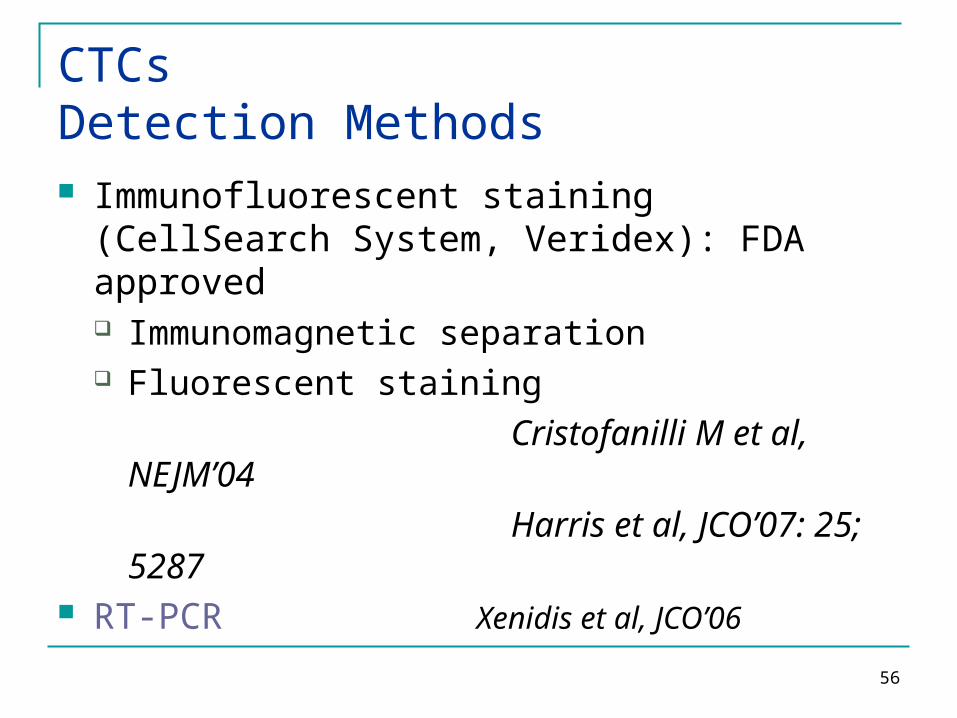
CTCsDetection Methods Immunofluorescent staining (CellSearch System,
Veridex): FDA approved Immunomagnetic separation Fluorescent staining
Cristofanilli M et al, NEJM’04
Harris et al, JCO’07: 25; 5287
RT-PCR Xenidis et al, JCO’06
57
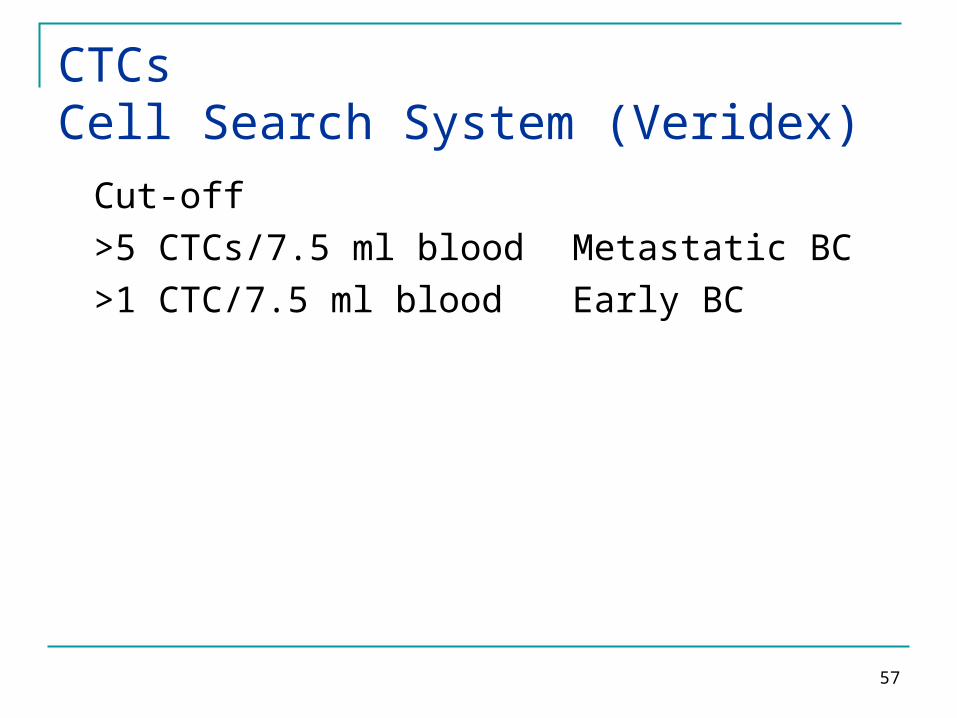
CTCsCell Search System (Veridex)
Cut-off>5 CTCs/7.5 ml blood Metastatic BC>1 CTC/7.5 ml blood Early BC

58
59
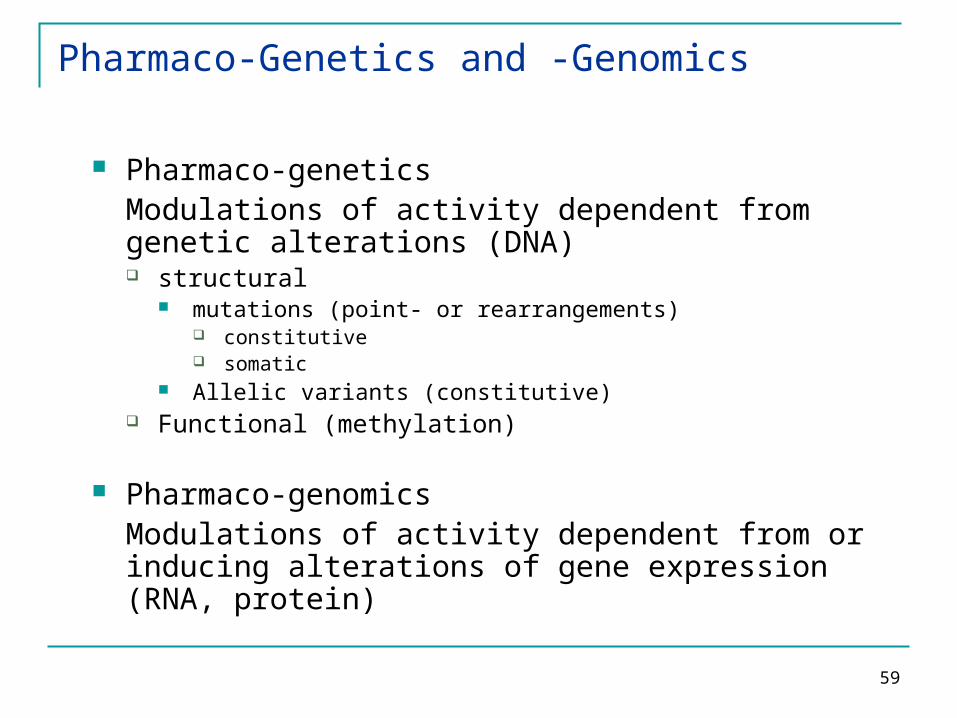
Pharmaco-genetics Modulations of activity dependent from genetic
alterations (DNA) structural
mutations (point- or rearrangements) constitutive somatic
Allelic variants (constitutive) Functional (methylation)
Pharmaco-genomics Modulations of activity dependent from or inducing
alterations of gene expression (RNA, protein)
Pharmaco-Genetics and -Genomics
60
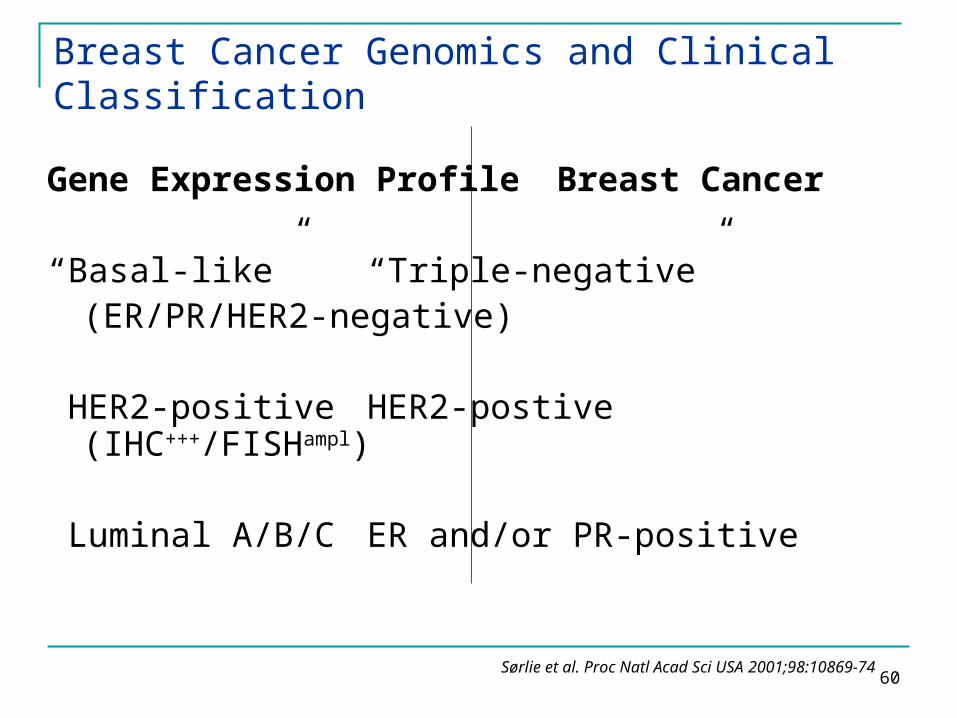
Breast Cancer Genomics and Clinical Classification
Gene Expression Profile Breast Cancer
“Basal-like” “Triple-negative” (ER/PR/HER2-negative)
HER2-positive HER2-postive (IHC+++/FISHampl)
Luminal A/B/C ER and/or PR-positive
Sørlie et al. Proc Natl Acad Sci USA 2001;98:10869-74
61
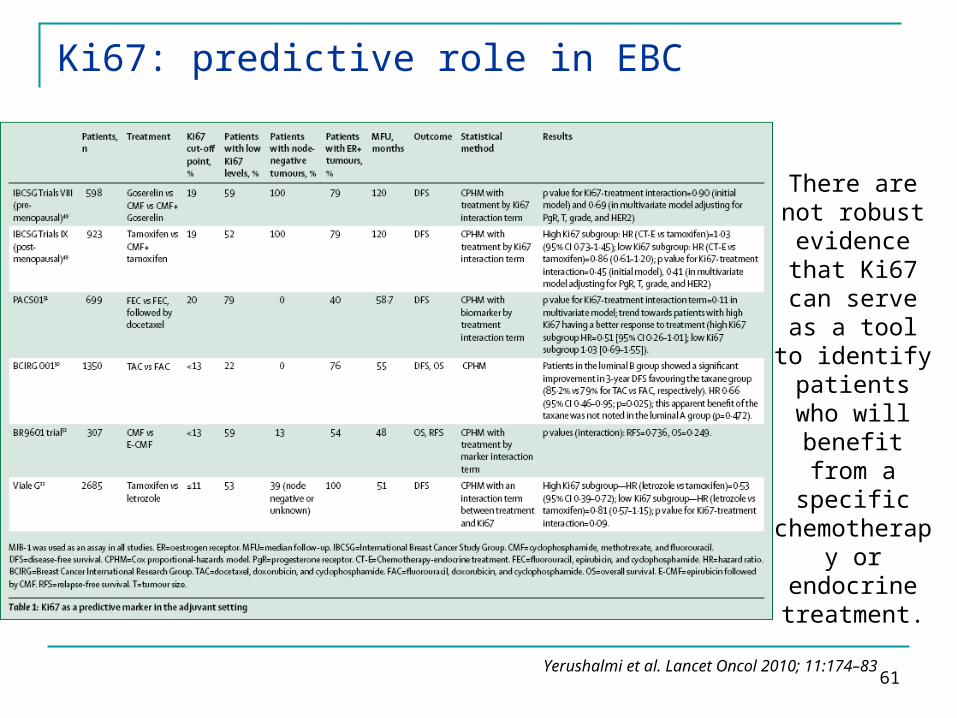
Ki67: predictive role in EBC
There are not robust evidence
that Ki67 can serve as a
tool to identify
patients who will benefit
from a specific
chemotherapy or
endocrine treatment.
Yerushalmi et al. Lancet Oncol 2010; 11:174–83

62
Gene expression profiling
Unfixed samples of tumor tissue obtained during surgery are the
starting material for gene-expression profiling.
The expression levels of a set of prognostically relevant genes are determined by DNA-microarray
analysis.
The resulting molecular signatures allow the patients to be classified into
groups with a poor prognosis or a good prognosis, thus facilitating
therapeutic decision making.
Van’t Veer et al. J Clin Oncol 2005; 23:1631-1635
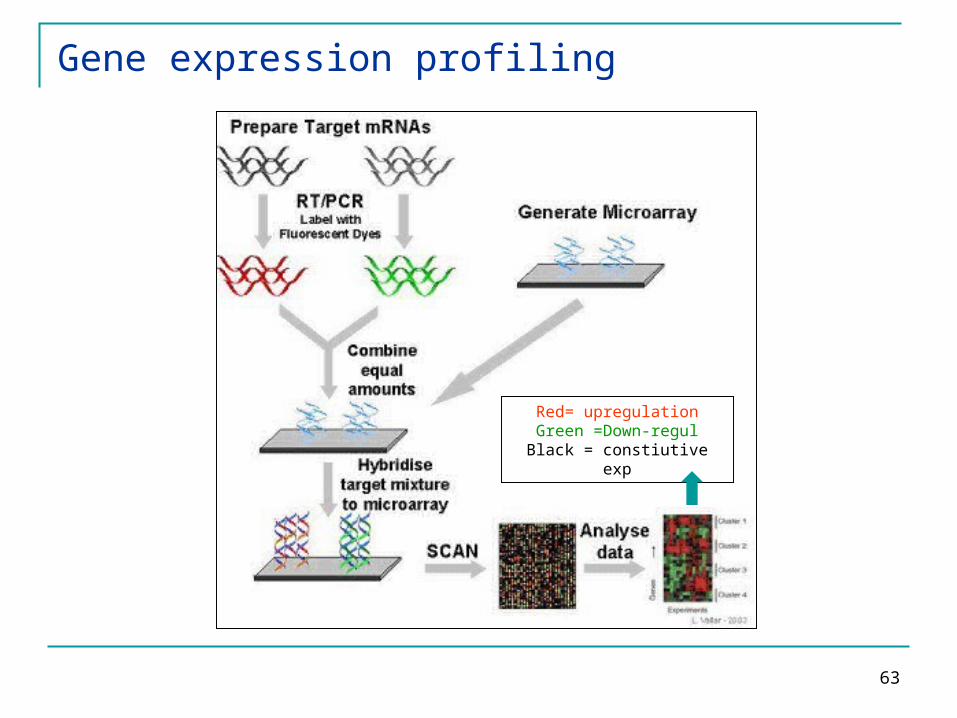
63
Red= upregulationGreen =Down-regul
Black = constiutive exp
Gene expression profiling
64
Thus, are there tumors with favorable prognosis which
don’t benefit from chemotherapy?
65
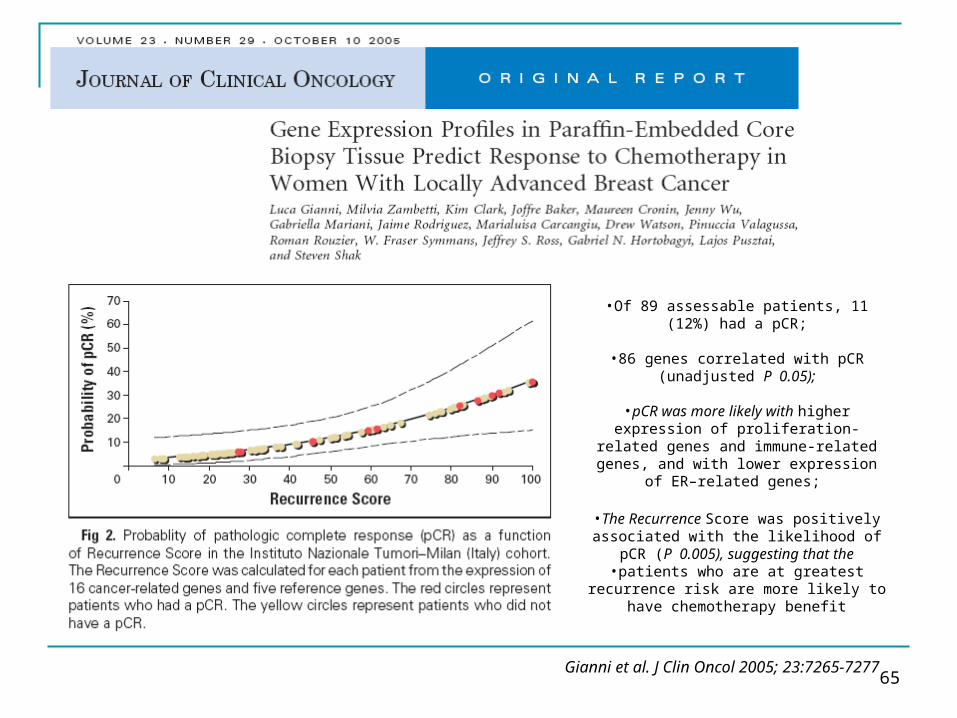
•Of 89 assessable patients, 11 (12%) had a pCR;
•86 genes correlated with pCR (unadjusted P 0.05);
•pCR was more likely with higher
expression of proliferation-related genes and immune-related genes, and with
lower expression of ER–related genes;
•The Recurrence Score was positively associated with the likelihood of pCR (P
0.005), suggesting that the•patients who are at greatest recurrence
risk are more likely to have chemotherapy benefit
Gianni et al. J Clin Oncol 2005; 23:7265-7277
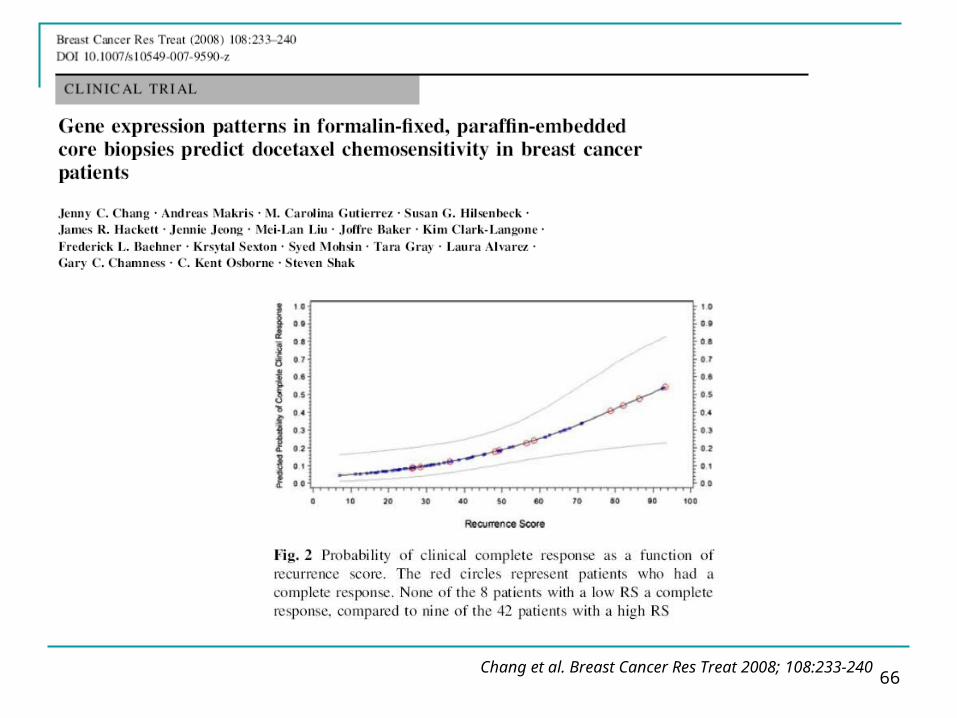
66Chang et al. Breast Cancer Res Treat 2008; 108:233-240
67
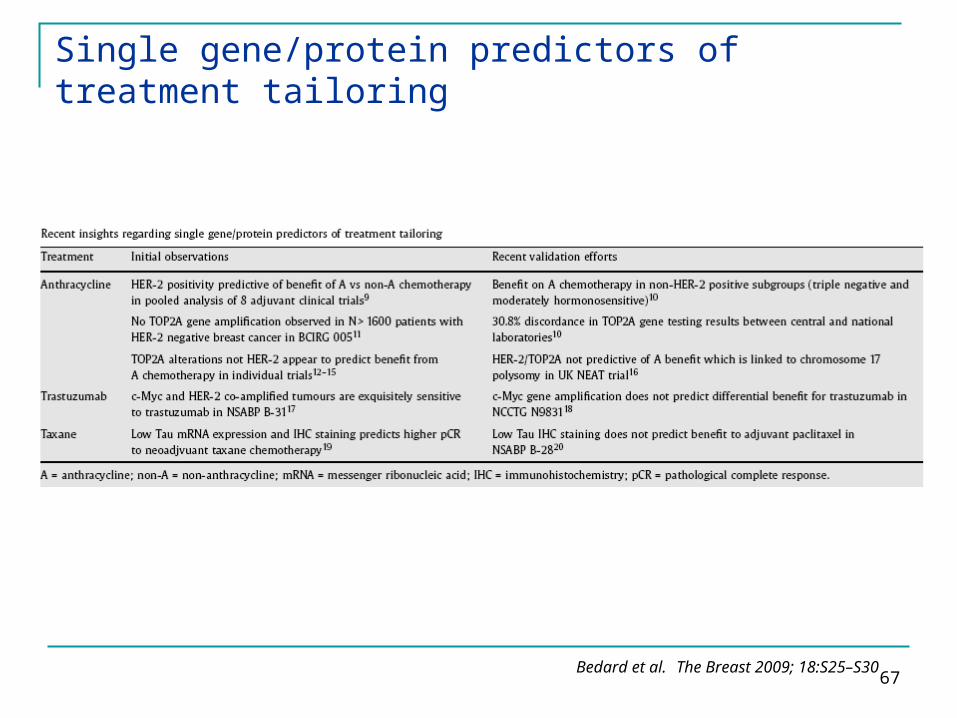
Single gene/protein predictors of treatment tailoring
Bedard et al. The Breast 2009; 18:S25–S30
68
Topoisomerase II and responsiveness to adjuvant Anthracyclines

69

70
Cancer Genetics and Genomics
Genetics → genetic alterations (DNA) structural
mutations (point- or rearrangements) constitutive somatic
Allelic variants (constitutive) Functional (methylation)
Genomics → alterations of gene expression (RNA, protein)

71
Genomics
Identification of biomarkers Response Prediction Target identification
Between patients
Within patients during treatment between primary and
mets
72
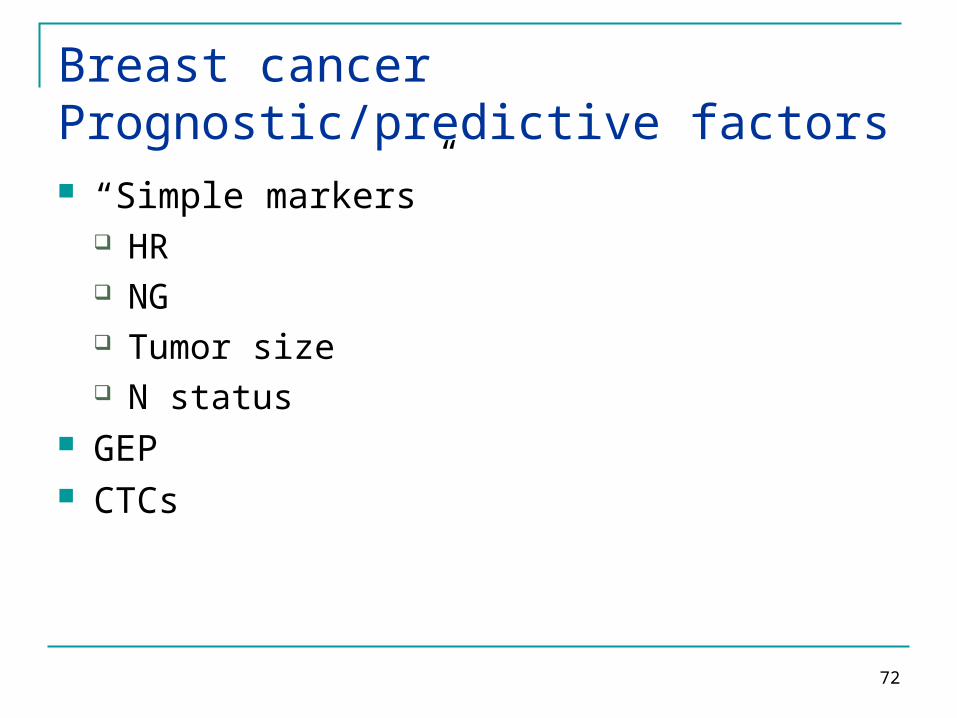
Breast cancerPrognostic/predictive factors “Simple markers”
HR NG Tumor size N status
GEP CTCs
73
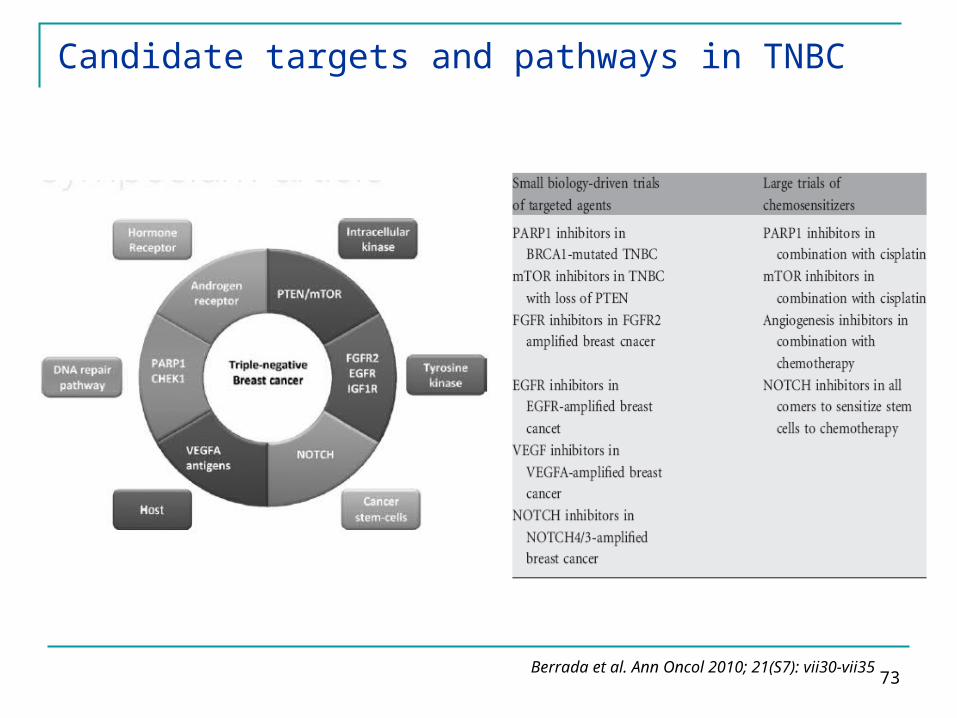
Candidate targets and pathways in TNBC
Berrada et al. Ann Oncol 2010; 21(S7): vii30-vii35
74
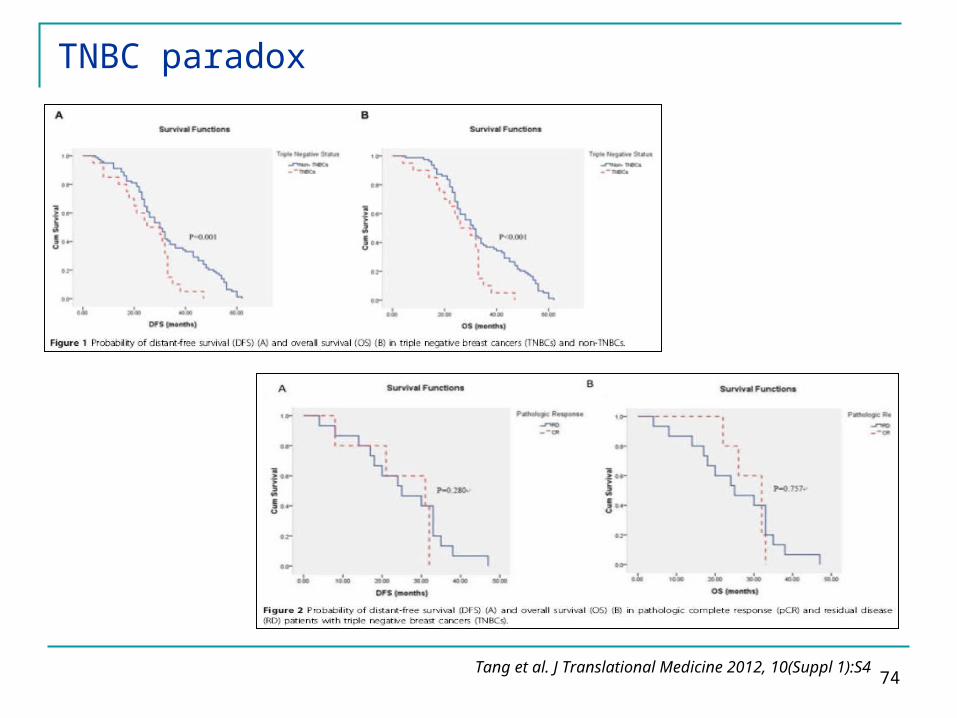
TNBC paradox
Tang et al. J Translational Medicine 2012, 10(Suppl 1):S4
75
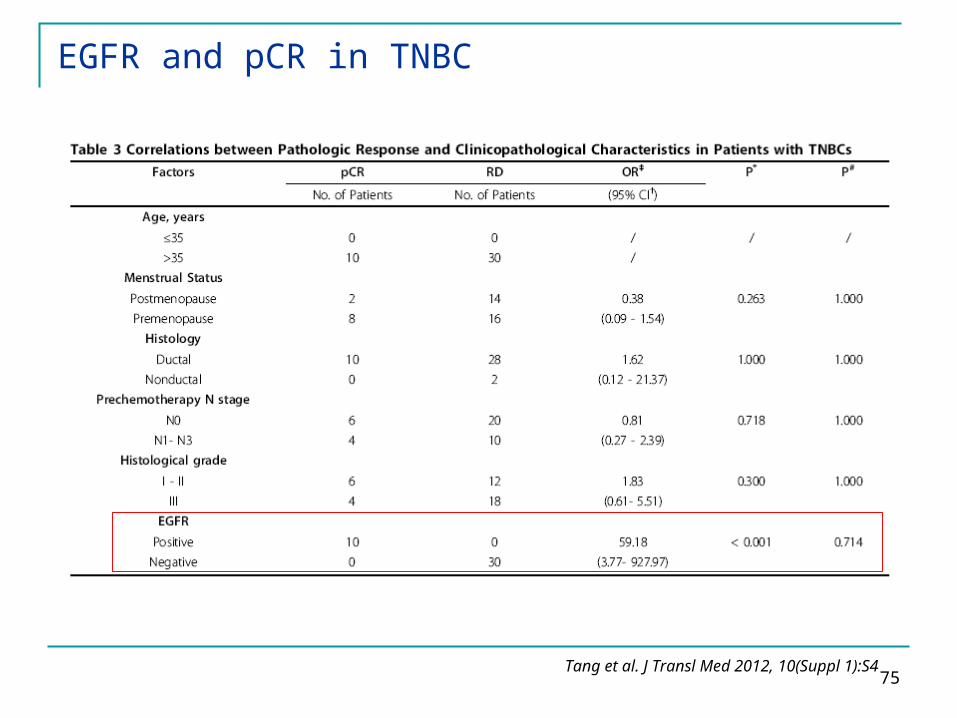
EGFR and pCR in TNBC
Tang et al. J Transl Med 2012, 10(Suppl 1):S4
76
Cancer Genetics and Genomics
Genetics → genetic alterations (DNA) structural
mutations (point- or rearrangements) constitutive somatic
Allelic variants (constitutive) Functional (methylation)
Genomics → alterations of gene expression (RNA, protein)

77
Microtubule-Associated Protein-tau is a bifunctional predictor of endocrine sensitivity and chemotherapy resistance in ER-positive BC
Andrè et al. Clin Cancer Res 2007;13:2061-67
No adjuvant therapyNeoadjuvant T/FAC
Adjuvant tamoxifen

78
Prognostic and predictive value of tau-mRNA expression
• Higher tau-mRNA expression showed borderline non significant association with better prognosis in the absence of systemic adjuvant therapy
• Higher tau-mRNA expression was significantly associated with no recurrence (at 5 and10 years, P =0.005 and P = 0.05, respectively) in patients treated with tamoxifen, indicating a predictive value for endocrine therapy
• Tau expression was significantly lower in patients who achieved pCR to paclitaxel/FAC chemotherapy (P < 0.001)
Andrè et al. Clin Cancer Res 2007;13:2061-67

79
C-Myc alterations and association with benefit from adjuvant trastuzumab
DFS (median follow-up, 4.0 y):
MYC:CEP8 ratio ≤ 2.2↓
HR 0.46 (p 0.001)
MYC:CEP8 ratio > 2.2↓
HR 0.67 (p 0.33)
interaction p 0.38
MYC copies/nucleus ≤ 5.0↓
HR 0.52 (p 0.002)
MYC copies/nucleus > 5.0↓
HR 0.48 (p 0.02)
interaction p 0.94
Perez et al. J Clin Oncol 2011; 29:651-659

80
C-Myc alterations and association with benefit from adjuvant trastuzumab
MYC:CEP8 ratio < 1.3 with normal chromosome 8 copy number
↓HR 0.66 (p 0.28)
MYC:CEP8 ratio ≥ 1.3 or < 1.3 with polysomy 8
↓HR 0.44 (p 0.001)
interaction p 0.23
Perez et al. J Clin Oncol 2011; 29:651-659
MYC copies/nucleus < 2.5 ↓
HR 1.07 (p 0.87)
MYC copies/nucleus ≥ 2.5 ↓
HR 0.42 (p 0.001)
interaction p 0.05
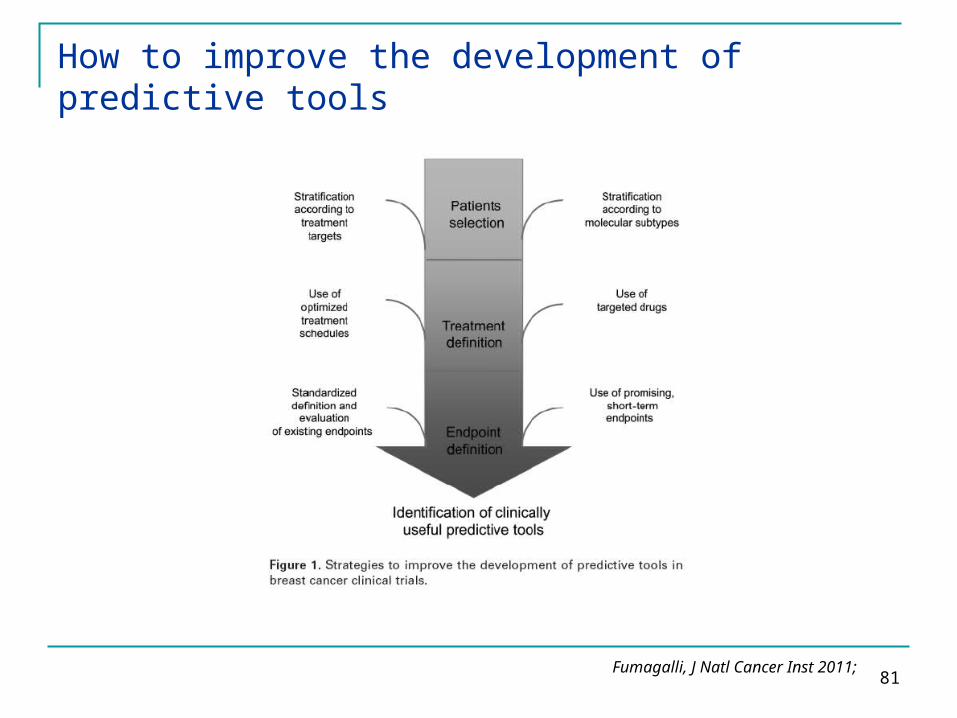
81Fumagalli, J Natl Cancer Inst 2011;
How to improve the development of predictive tools
82
Gene-expression signature is a predictor of DFS and OS in breast cancer
Van de Vijver et al. N Engl J Med 2002;347:1999-2009
83
Molecular basis of histologic grade
Sotiriou et al. J Natl Cancer Inst 2006; 98:262-272

84
Prognostic utility of Recurrence Score compared to clinicopathologic features
The 21-gene assay was a more accurate predictor of
relapse than standard clinical features for
individual patients with HR-positive operable breast
cancer treated with chemohormonal therapyand provides information that is complementary to features typically used in
anatomic staging,such as tumor size and
lymph node involvement.
Goldstein et al. J Clin Oncol 2008; 26:4063-4071
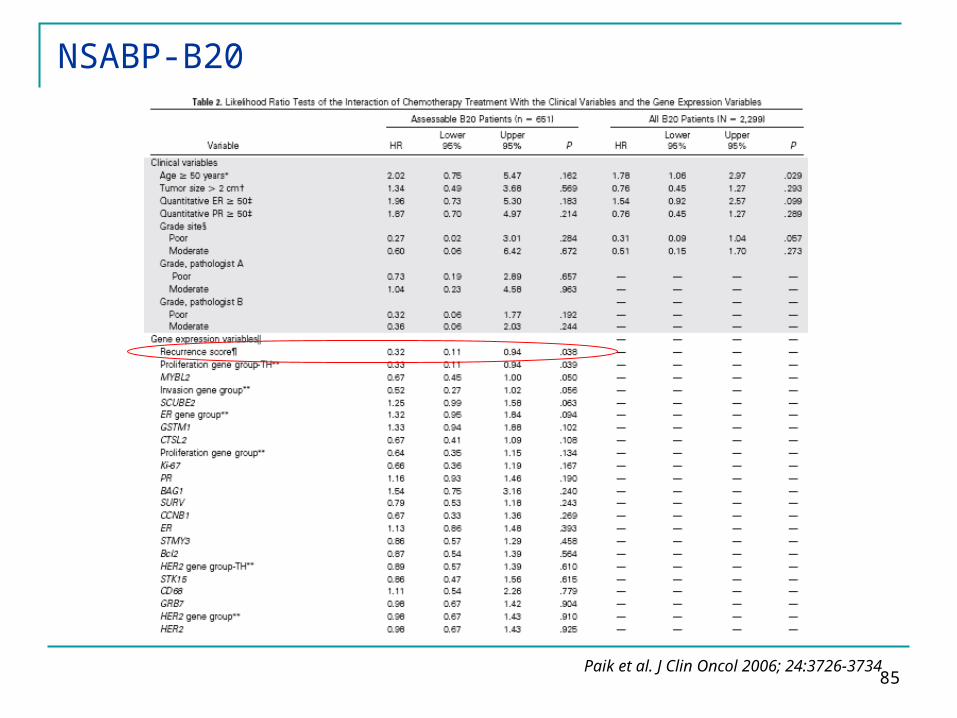
85Paik et al. J Clin Oncol 2006; 24:3726-3734
NSABP-B20
86
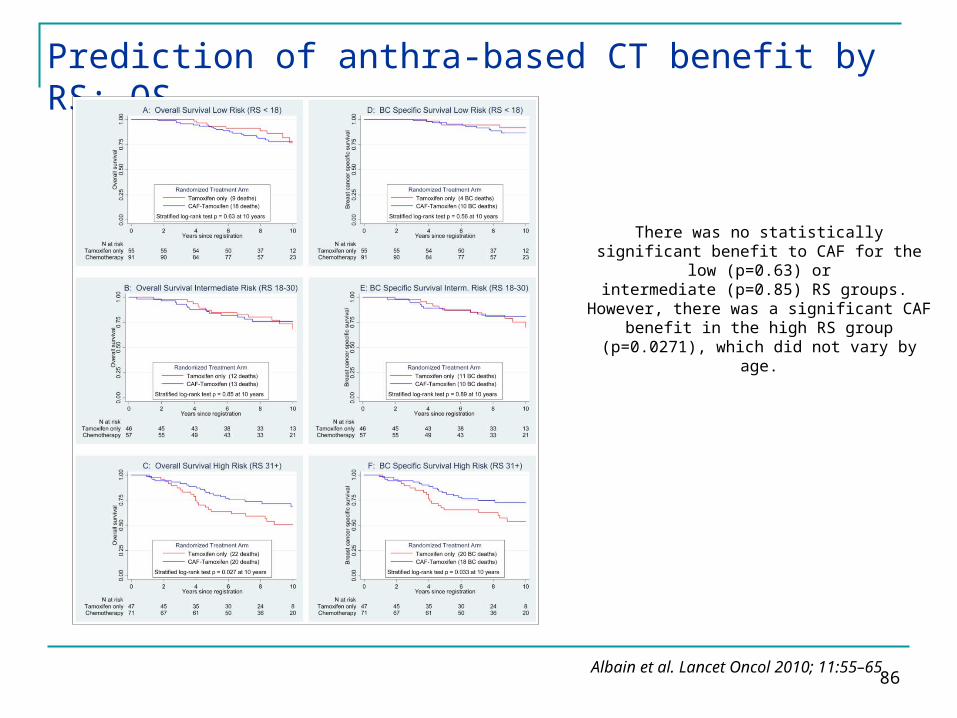
Prediction of anthra-based CT benefit by RS: OS
Albain et al. Lancet Oncol 2010; 11:55–65
There was no statistically significant benefit to CAF for the low (p=0.63) or
intermediate (p=0.85) RS groups. However, there was a significant CAF
benefit in the high RS group (p=0.0271), which did not vary by age.
87
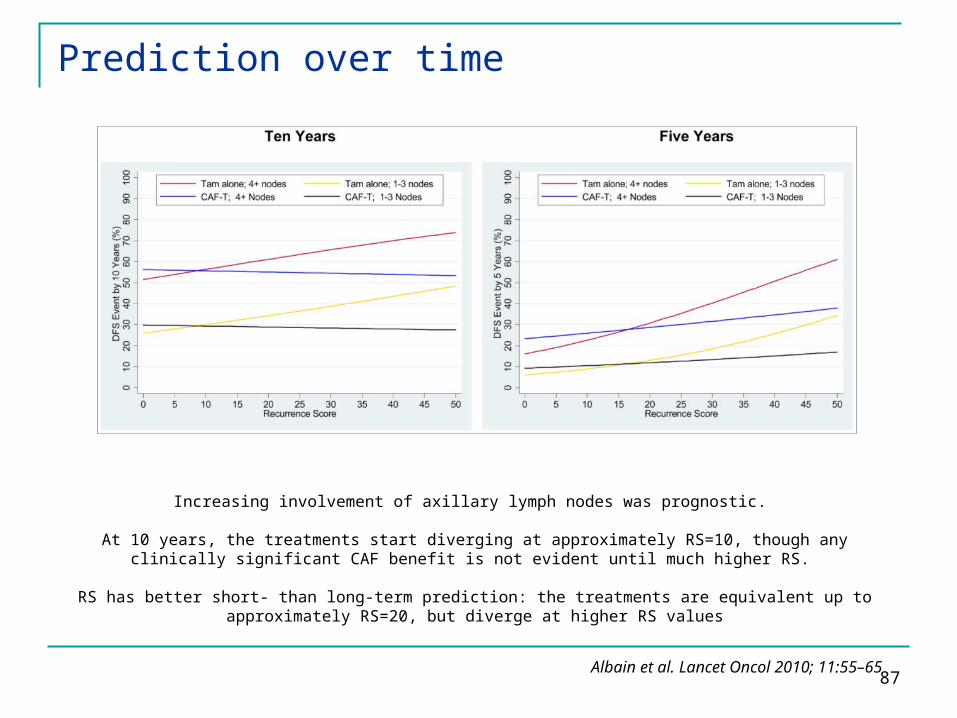
Prediction over time
Albain et al. Lancet Oncol 2010; 11:55–65
Increasing involvement of axillary lymph nodes was prognostic.
At 10 years, the treatments start diverging at approximately RS=10, though any clinically significant CAF benefit is not evident until much higher RS.
RS has better short- than long-term prediction: the treatments are equivalent up to approximately RS=20, but diverge at higher RS values