high-throughput screening of filamentous fungi using ... · high-throughput screening of...
TRANSCRIPT

High-throughput screening of filamentous fungiusing nanoliter-range droplet-based microfluidicsThomas Beneyton1,+, I Putu Mahendra Wijaya1,2,+, Prexilia Postros2, Majdi Najah2, PascalLeblond2, Angelique Couvent2, Estelle Mayot2, Andrew D. Griffiths1,*, and AntoineDrevelle2
1Ecole Superieure de Physique et de Chimie Industrielles de la Ville de Paris (ESPCI ParisTech), CNRS UMR 8231,10, rue Vauquelin, 75231 Paris Cedex 05, France.2Ets J. Soufflet/CRIS-OSIRIS, Quai Sarrail, BP12, 10400 Nogent-sur-Seine, France*[email protected]+these authors contributed equally to this work
Supplementary Information
1

Supplementary Figure S1
a
b
1
1
2 3
2
3
4
a aa a
a a a a
b b
c c
c c
1. Oil inlet2. Aqueous inlet3. Droplets outlet
1. Oil inlet2. Droplets inlet3. Positive outlet4. Negative outlet
a. Shielding electrodesb. Ground electrodec. Charged electrodes
500 µm
500 µm
Figure S 1. Description of microfluidic modules. (a) Dropmaker device: droplets are produced by flow-focusing of theaqueous stream1 with two streams of fluorinated oil containing surfactant. The device was used to produce 10, 18 or 20 nldroplets depending on the experiment. (b) Fluorescence Activated Droplet Sorter (FADS) device: droplets are reloaded (2) andspaced-out at a flow-focusing junction with fluorinated oil. The droplets are analyzed by the optical setup and fluorescentdroplets are sorted at 4 to 20 droplet.s−1 by applying AC field pulses (30 kHz; 1400-1800 Vpp; 10 - 30 ms).
2/16
Supplementary Figure S2
Bar Chart
PMT 4 (RFU)
Log1
0(cou
nt())
+0.1
0 5 10 15 20 25 30 35 40 45 50 55 60 65 70
2,8
2,6
2,4
2,2
2
1,8
1,6
1,4
1,2
1
0,8
0,6
0,4
0,2
0
Ma
CoDro
Bar Chart
PMT 4 (RFU) (1000 bins)
Log1
0(co
unt()
)+0.
1
5,00 10,00 15,00 20,00 25,00 30,00 35,00 40,00 45,00 50,00 55,00
2,2
2
1,8
1,6
1,4
1,2
1
0,8
0,6
0,4
0,2
0
Marking:Marking
Color byDroplets
Population 1
Population 2
Coalescence
a
b
c
0.04%
0.09%
0.2%
1
2
3
4
1
2
3
1
2
3
4
0 10 20 30 40 50 60
Red fluorescence (RFU)
0 10 20 30 40 50 60
Red fluorescence (RFU)
0 10 20 30 40 50 60
Red fluorescence (RFU)
log1
0(n
dro
ple
ts)
log1
0(n
dro
ple
ts)
log1
0(n
dro
ple
ts)
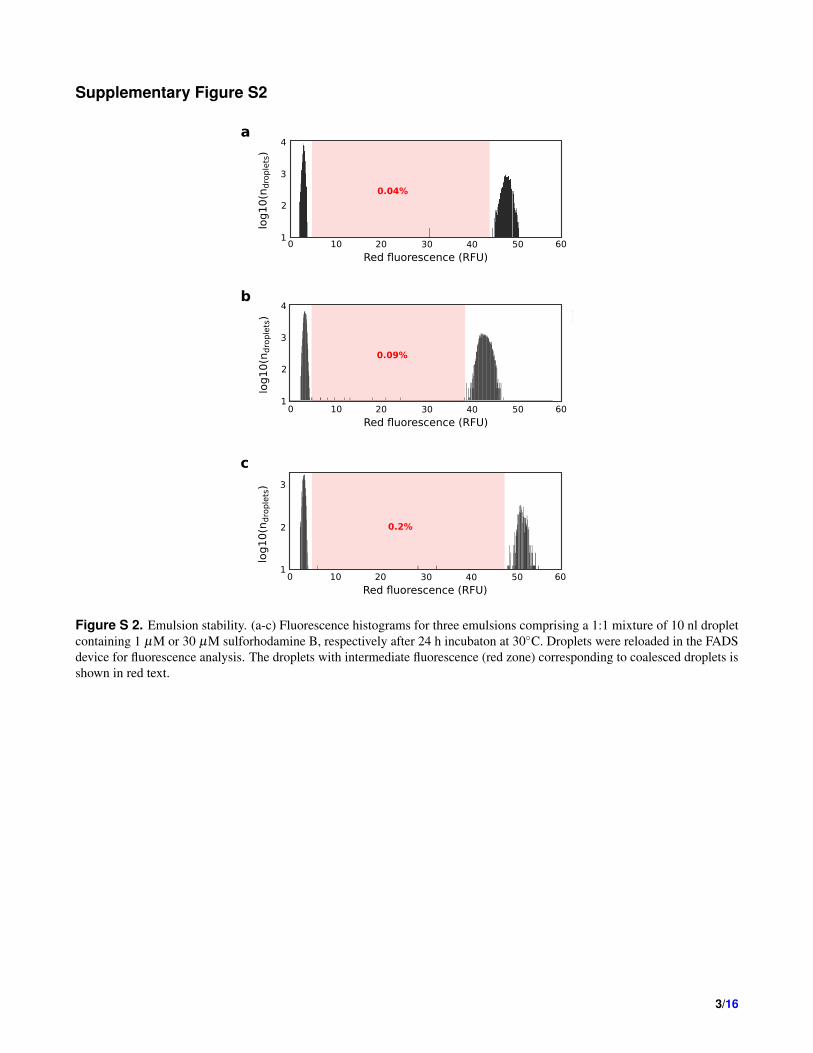
Figure S 2. Emulsion stability. (a-c) Fluorescence histograms for three emulsions comprising a 1:1 mixture of 10 nl dropletcontaining 1 µM or 30 µM sulforhodamine B, respectively after 24 h incubaton at 30◦C. Droplets were reloaded in the FADSdevice for fluorescence analysis. The droplets with intermediate fluorescence (red zone) corresponding to coalesced droplets isshown in red text.
3/16

Supplementary Figure S3
DEP Force (N)0.500.480.450.420.390.360.330.300.270.240.210.180.150.120.090.060.030.00
Potential (V)2101801501209060300
-30-60-90-120-150-180-210
Elec
tric
Fiel
d an
d D
EP fo
rce
Dis
tribu
tion
in M
icro
chan
nel
Maj
di P
utu
Des
ign
sorte
r fun
gi V
3 dØ
clin
aiso
n_co
nnec
tion2
: G
rid#4
P2
Nod
es=5
42 C
ells
=223
RM
S Er
r= 0
.002
Inte
gral
= 19
0554
.9
12:0
5:38
4/3
/14Fl
exPD
E St
uden
t 6.3
2s/W
3
Xe4
-10.
2-9
.9-9
.6-9
.3-9
.
Ye3
6.9.12.
15.
18.
DEP
For
ce
max
13.
2 0
.50
0.48
0.45
0.42
0.3
9 0
.36
0.3
3 0
.30
0.2
7 0
.24
0.2
1 0
.18
0.1
5 0
.12
0.0
9 0
.06
0.0
3 0
.00
min
0.0
0
Elec
tric
Fiel
d an
d D
EP fo
rce
Dis
tribu
tion
in M
icro
chan
nel
Maj
di P
utu
Des
ign
sorte
r fun
gi V
3 dØ
clin
aiso
n_co
nnec
tion1
: G
rid#4
P2
Nod
es=6
64 C
ells
=277
RM
S Er
r= 0
.001
9In
tegr
al=
3038
89.2
12:0
1:12
4/3
/14Fl
exPD
E St
uden
t 6.3
2s/W
32
Xe4
-10.
2-9
.9-9
.6-9
.3-9
.
Ye3
6.9.12.
15.
18.
o
x
Elec
tric
Fiel
d an
d D
EP fo
rce
Dis
tribu
tion
in M
icro
chan
nel
Maj
di P
utu
Des
ign
sorte
r fun
gi V
3 dØ
clin
aiso
n_co
nnec
tion1
: G
rid#4
P2
NIn
tegr
al=
3038
89.2
X
-10.
2-9
.9-9
.6-9
.3-9
.
Ye3
6.9.12.
15.
18.
Elec
tric
Fiel
d an
d D
EP fo
rce
Dis
tribu
tion
in M
icro
chan
nel
Maj
di P
utu
Des
ign
sorte
r fun
giV3
dØ
clin
aiso
n_co
nnec
tion2
: G
rid#4
P2
Inte
gral
= 2.
4806
07e+
7
X
-10.
2-9
.9-9
.6-9
.3-9
.
Ye3
6.9.12.
15.
18.
Elec
tric
Fiel
d an
d D
EP fo
rce
Dis
tribu
tion
in M
icro
chan
nel
Maj
di P
utu
Des
ign
sorte
r fun
gi V
3 dØ
clin
aiso
n_co
nnec
tion2
: G
rid#4
P2
Nod
es=5
42 C
ells
=223
RM
SIn
tegr
al=
2.48
0607
e+7
Flex
PD
Xe4
-10.
2-9
.9-9
.6-9
.3-9
.
Ye3
6.9.12.
15.
18.
o x
Elec
tric
Fiel
d an
d
Maj
di P
utu
Des
ign
soIn
tegr
al=
-4.6
5848
8e+
-10.
2
Ye3
6.9.12.
15.
18.
Elec
tric
Fiel
d an
d D
EP fo
rce
Dis
tribu
tion
in M
icro
chan
nel
Maj
di P
utu
Des
ign
sorte
r fun
gi V
3 dØ
clin
aiso
n_co
nnec
tion1
: G
rid#4
P2
Nod
es=6
64 C
ells
=277
RM
Inte
gral
= -4
.658
488e
+8
Flex
P
Xe4
-10.
2-9
.9-9
.6-9
.3-9
.
Ye3
6.9.12.
15.
18.
o
x
a
(i) (ii)
b
(i) (ii)
c (i) (iii)(ii)
dPixel intensity
0 40 80 120 160Pixel intensity
0 40 80 120 160Pixel intensity
0 40 80 120 160
909 droplets
Positive36.5%
Negative63.5%
767 droplets 99.87%
0.13%
1,278 droplets
100%
Num
ber
of
dro
ple
ts
0
40
80
120
160
200
Num
ber
of
dro
ple
ts
0
40
80
120
160
200
240
280
Num
ber
of
dro
ple
ts
0
300
400
500
100
200
Droplet volume
Sortingrate
ndroplets
nsorted
nunsorted
nflase +
nflase -
4 Hz12 Hz17 Hz21 Hz
1,466131211113
96484
12670
501 (34.2%)46 (35.1%)85 (40.3%)39 (34.5%)
0 (<0.07%)0 (<0.76%)0 (<0.47%)0 (<0.88%)
1 (0.07%)1 (0.76%)
0 (<0.47%)4 (3.5%)
10 nl
Electric field parametersAmplitude Frequency Pulse time
Flow rates (ml.h-1)Emulsion Oil
1,400 V1,600 V1,700 V1,800 V
10 kHz10 kHz10 kHz10 kHz
30 ms10 ms10 ms10 ms
0.1250.4
0.550.7
10171921
20 nl 4 Hz 352 133 (37.8%)209 0 (<0.28%) 10 (2.8%) 1400 V 10 kHz 35 ms 0.15 8
250 µm
Figure S 3. Validation of the FADS module. (a-b) Finite-element simulations of potential (a) and dielectrophoresis force(DEP) (b) distributions across the FADS device channels with the same-side electrode configuration (i) or the cross-sideelectrode configuration (ii). (c) Color image analysis of the sorting efficiency. Images of the emulsion before sorting (i), ofunsorted (ii) and sorted (iii) droplets were analyzed using a homemade MATLAB R2013a routine to distinguish and countnegative colorless droplets and positive blue droplets. (d) Evaluation of the efficiency of the sorting process. Movies of thesorting process were analyzed to determine the number of false negatives and false positives using different throughputs anddroplet volumes. The table summarizes the results of the video analysis, as well as the electric field parameters and the flowrates of the emulsion and the spacing oil.
4/16

Supplementary Figure S4
Page (2)Bar Chart
nPMT2
Log1
0(co
unt()
)+0.
25
0 1 2 3 4 5 6 7 8 9 10 11
4,5
4
3,5
3
2,5
2
1,5
1
0,5
0
Marking:Marking
All values
Page (2)Bar Chart
nPMT2 (1000 bins)
Log1
0(co
unt()
)+0.
25
0,00
1,00
2,00
3,00
4,00
5,00
6,00
7,00
8,00
9,00
10,0
0
11,0
0
4,5
4
3,5
3
2,5
2
1,5
1
0,5
0
Data table:chimique 2h
Marking:Marking
All values
Filter settings
chimique 2h- Droplets: (Ok)- 3000 souches: (OK)sauvage- nPMT2: (0,44 <= nPMT2 <= 1,50) without empty values
Page (3)Bar Chart
nPMT2 (1000 bins)
Log1
0(co
unt()
)+0.
25
0,00 1,00 2,00 3,00 4,00 5,00 6,00 7,00 8,00 9,00 10,00 11,00
4,5
4
3,5
3
2,5
2
1,5
1
0,5
0
Data table:chimique 3H
Marking:Marking
All values
Filter settings
chimique 2h- Droplets: (Ok)- 3000 souches: (OK)sauvage- nPMT2: (0,44 <= nPMT2 <= 1,50) without empty values
10
10
10
Page (2)Bar Chart
nPMT2
Log1
0(co
unt()
)+0.
25
0 1 2 3 4 5 6 7 8
4,5
4
3,5
3
2,5
2
1,5
1
0,5
0
Page (2)Bar Chart
nPMT2Log1
0(co
unt()
)+0.
25
0 1 2 3 4 5 6 7 8
4,5
4
3,5
3
2,5
2
1,5
1
0,5
0
Page (2)Bar Chart
nPMT2
Log1
0(co
unt()
)+0.
25
0 1 2 3 4 5 6 7 8
4,5
4
3,5
3
2,5
2
1,5
1
0,5
0
Sur
viva
l rat
e (%
)
UV-exposure time (s)
a Wild type
MNNG-2 h
MNNG-3 h
UV-30 s
UV-60 s
UV-90 s
Num
ber
of
dro
ple
ts
1
10
100
1,000
10,000
Num
ber
of
dro
ple
ts
1
10
100
1,000
10,000
Num
ber
of
dro
ple
ts
1
10
100
1,000
10,000
Num
ber
of
dro
ple
ts
1
10
100
1,000
10,000
Num
ber
of
dro
ple
ts1
10
100
1,000
10,000
Num
ber
of
dro
ple
ts
1
10
100
1,000
10,000
Green fluorescence (RFU)10 2 3 4 5 6 7 8
Green fluorescence (RFU)10 2 3 4 5 6 7 8
Green fluorescence (RFU)10 2 3 4 5 6 7 8
Green fluorescence (RFU)10 2 3 4 5 6 7 8
Green fluorescence (RFU)10 2 3 4 5 6 7 8
Green fluorescence (RFU)10 2 3 4 5 6 7 8
b
Surv
ival ra
te (
%)
UV-exposure time (s)
20
0
40
60
80
100
0 30 60 90
100 %
32.07 %
5.20 % 2.62 % 0.46 %
Figure S 4. Library construction. (a) Phenotype distribution (α-amylase activity) within different libraries measured at thesingle individual level using droplet-based microfluidics. Histograms of the green fluorescence signal (514 nm; related toα-amylase activity) of the droplets after single spore encapsulation with the fluorogenic substrate and incubation at 30◦Cduring 24 h in the cases of the O58 wild type strain, chemical treatment (2 or 3 h exposure to 2% MNNG) or UV treatment (30,60 or 90s exposure to [254 nm, 1.30 mW/cm−2)] light). The wild-type histogram shows data from ∼200,000 droplets(∼20,000 clones) while the histograms of the libraries each show data from ∼30,000 droplets (∼6,000 strains). (b) Survivalcurve of Aspergillus niger O58 strain exposed to or UV light (254 nm; 1.30 mW.cm−2). Error bars represent ±1 standarddeviation based on triplicate measurements.
5/16
Supplementary Figure S5
0 50 100 150 200 250 300
α-amylase (mU.ml-1)
0
20
40
60
100
80
120
140
Fluore
scen
ce (
RFU
)
y = -0.0022x2 + 1.2201x - 26.76R2 = 0.9956
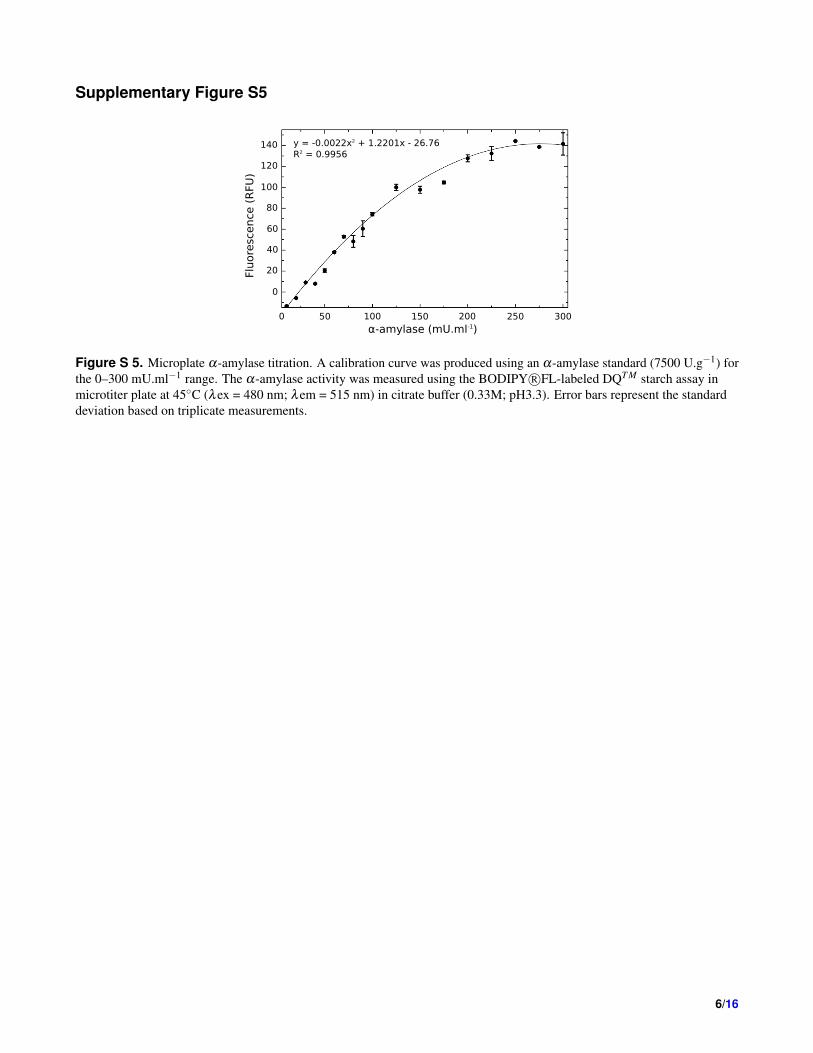
Figure S 5. Microplate α-amylase titration. A calibration curve was produced using an α-amylase standard (7500 U.g−1) forthe 0–300 mU.ml−1 range. The α-amylase activity was measured using the BODIPY R©FL-labeled DQT M starch assay inmicrotiter plate at 45◦C (λex = 480 nm; λem = 515 nm) in citrate buffer (0.33M; pH3.3). Error bars represent the standarddeviation based on triplicate measurements.
6/16

Supplementary Figure S6
A
θ
x
y
x
y
B
10-2510-2010-1510-10
(0,0)
g
θr
tion
Electrode 1 Electrode 2
Electrode 3
x
y
A
B(0,0)
g
θr
ode 1 Electrode 2
Electrode 1 Electrode 2
B(0,0)
g
θr
ode 1 Electrode 2
a
b
c e
d
Flow direction
Electrode 3
Electrode 2Electrode 1
FDEP
FDrag
xy
Flow direction Flow direction
Electrode 1 Electrode 1Electrode 2 Electrode 2
x
y y
y y
x
xx
g
r(0,0) (0,0)
(x,y)w = 3R
L Electrode 3
g
Flow direction
V2.um-3
10-10
10-2010-15
10-25
V2.um-3
10-10
10-2010-15
10-25
Flow direction
Figure S 6. Same-side vs. cross-side electrode configuration. (a) Force diagram of a droplet passing through a sorting chamber. The outlet channels havedifferent widths. By default, droplets flow into the wider channel due to its lower fluidic resistance. When an electric bias is applied to the electrodes, however,the DEP force (FDEP) displaces the droplet in the y-axis orthogonal to the flow, directing the droplets into the narrower channel. The fluorinated carrier oilaround the droplet imparts drag force (FDrag) that opposes the DEP force. The interplay between these two forces determines the sorting frequency of thedroplets. In the same-side configuration, electrode 1 and electrode 2 are connected to the positive and negative outlets of the high voltage amplifier,respectively, and electrode 3 is left unconnected. In the cross-side configuration, electrode 1 and electrode 2 are connected to the positive outlet from thehigh-voltage amplifier, while electrode 3 is connected to the negative outlet. (b) Setup for modeling the same-side electrode configuration. The origin in thederivation is located at the mid-point between the tips of the two electrodes. The r represents the distance from the origin to the centroid of the droplet at anygiven point in time, while θ refers to the angle made between the x-axis and the line r, calculated in counter-clockwise fashion. The distance between theelectrodes is g. (c) Distribution of field inhomogeneity |∇|~E|2| with the same-side electrode configuration. The distance between the electrodes is g. (d) Setupfor modeling the cross-side electrode configuration. The analytical solution to the electric field distribution can be calculated using an approach based on apoint and line electrode. Similar to the previous calculation, the origin in this derivation is located at the mid-point between the tips of electrode 1 and electrode2. In the cross-side configuration, electrode 1 and electrode 2 are both connected to the positive outlet from the high-voltage amplifier, while electrode 3 isconnected to the negative outlet from the high-voltage amplifier. This connection establishes a voltage bias across the sorting chamber. This is in contrast to thesame-side configuration, in which the voltage difference is set only on one side of the sorting chamber. (e) Spatial distribution of field inhomogeneity |∇|~E|2|with the cross-side electrode configuration.
7/16
Supplementary Table S1
Time footprintMicrofluidics Microtiter-plate
Compartmentalization
Culture
Screening
Total
Cost footprintMicrofluidics Microtiter-plate
Picking50 clones.h-1
200 h
Emulsification5.104 clones.h-1
<1 h
Overnight incubation
15 h
5 days incubation120 h
Enzyme solubilization48 h
7,000 clones.h-1
1.5 h400 clones.h-1
25 h
<24 h 393 h $14 $8,770
Medium: 18 nl x 5.104 = 0.9 ml<$1
Syringe, tubing, oil, device$1
Medium: 1 ml x 104 = 10 l<$1
24-well plates x420$420
Water: 1 ml x 104 = 10 l<$1
Tips x10,000$500
-
-
Fluorogenic substrate: 45 µg$12
Syringe, tubing, oil, device$1
Fluorogenic substrate: 25 mg$6,700
96-well plates x105$150
Tips x20,000$1,000
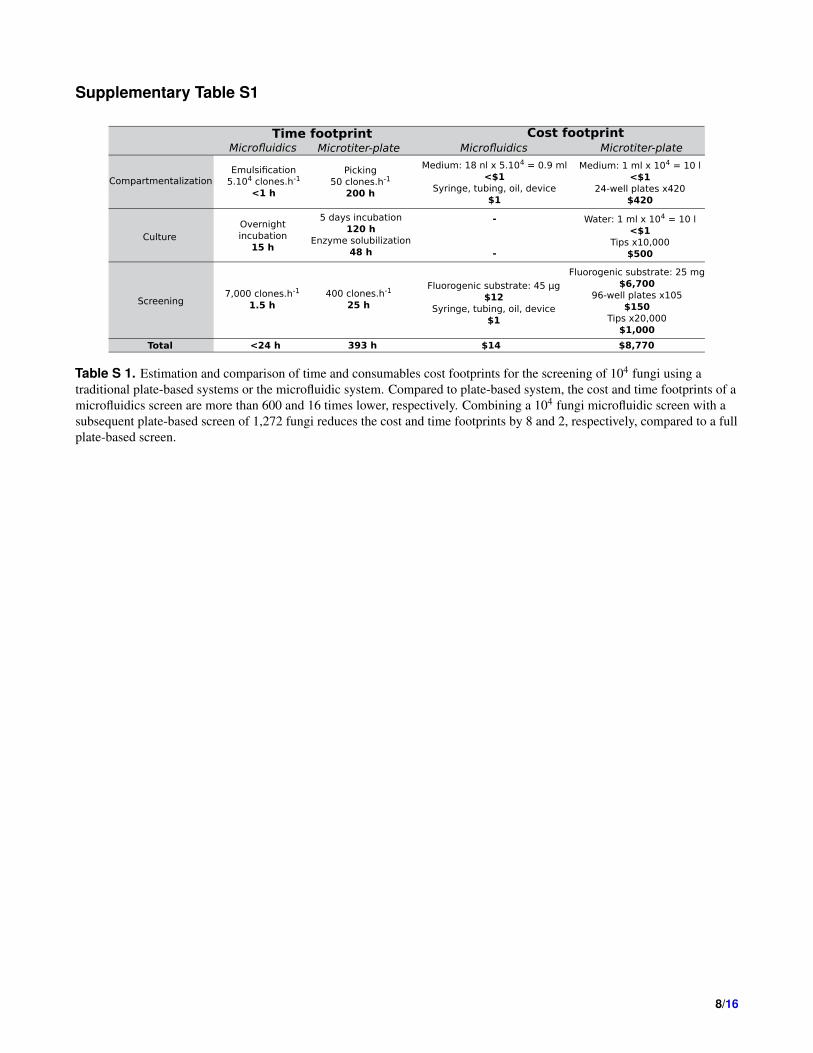
Table S 1. Estimation and comparison of time and consumables cost footprints for the screening of 104 fungi using atraditional plate-based systems or the microfluidic system. Compared to plate-based system, the cost and time footprints of amicrofluidics screen are more than 600 and 16 times lower, respectively. Combining a 104 fungi microfluidic screen with asubsequent plate-based screen of 1,272 fungi reduces the cost and time footprints by 8 and 2, respectively, compared to a fullplate-based screen.
8/16

Supplementary Video S1Movie S1. Spore germination and hyphal growth within 250 pl water in oil droplet. Single spores were encapsulated in 250 pldroplets containing PGS growth medium. Droplets were immobilized in a drop spot array and incubated for 17h at 30◦C.
Supplementary Video S2Movie S2. Production of 10 nl droplets using the dropmaker device.
Supplementary Video S3Movie S3. Fluorescence-activated sorting of 10 nl droplets using (1.4 kV; 30 ms) AC pulses in the case of the cross-sideelectrode configuration
Supplementary Video S4Movie S4. Fluorescence-activated sorting of 10 nl droplets using (1.4 kV; 30 ms) AC pulses in the case of the same-sideelectrode configuration
Supplementary Video S5Movie S5. Fluorescence-activated sorting of 10 nl droplets using at 4 Hz.
Supplementary Video S6Movie S6. Fluorescence-activated sorting of 10 nl droplets using at 17 Hz.
Supplementary Video S7Movie S7. Reinjection of 10 nl droplets in the Fluorescence-Activated Droplet Sorter (FADS) device.
Supplementary Video S8Movie S8. Sorting of Aspergillus niger fungi based on α-amylase secreted activity in 18 nl droplets.
9/16

Theoritical analysis of dielectrophoretic sorting
In dielectrophoretic droplet sorters,1–3 droplets flow in carrier oil towards a Y-shaped junction. With no electric field, all dropsflow into the waste channel which offers lower hydrodynamic resistance than the second, collect channel. To direct droplets intothe collect channel, on chip electrodes are energized, creating an electrical field gradient, which generates a dielectrophoreticforce (DEP) acting on the droplets. In order to be sorted, DEP forces must displace the droplet by a critical distance orthogonalto the flow, do, in the time, tp, it takes the droplet to traverse the electrical field gradient. The DEP force on a spherical dropletis given by equation (1),
| ~FDEP|= 4πε∗mR3Re[ fCM]∇|~E|2 (1)
in which, |FDEP| is the magnitude of the DEP force, R is the radius of the droplet being subjected to the DEP force, Re[ fCM]is the Claussius-Mosscoti factor (which itself depends on ε∗p and ε∗m: the complex permittivity of the droplet and the carrier fluid,respectively) and ∇|~E|2 denotes the electrical field gradient. The carrier oil, however, imparts drag force, which opposes theDEP force as the droplet moves through the fluid orthogonal to the flow (Supplementary Fig. S6). In the limit of low Reynoldsnumber, relevant in microfluidic environment, this drag force is described by:1
Fdrag = 6πηRv (2)
where η designates the viscosity of the carrier oil, R denotes the radius of the droplet, and v denotes the velocity of thedroplet. Hence, applying Newton’s second law, the following relationship can be obtained:
∑Fy = 4πεmR3Re[ fCM]∇|~E|2−6πηRvy = mdvy
dt(3)
Equation (3) describes the movement of the droplet in the y-axis under the influence of DEP and the drag force. By solvingequation (3), we can describe the velocity of the droplet in the y-axis as a function of time:
vy =2R2εmRe[ fCM]∇|~E|2
3η(1− e
−6πηRtm ) (4)
Equation (4) shows that the DEP causes the droplet to accelerate along the y-axis, orthogonal to the flow, before reaching aterminal velocity, vt,y when the drag force balances the DEP force (since Fdrag increases with v):
vt,y =2R2εmRe[ fCM]∇|~E|2
3η(5)
Furthermore, equation (4) also shows the transition time, τ , to reach terminal velocity
τ =m
6πηR(6)
In the regime where the droplet is spherical, the mass of the droplet is related to its radius through relationship:
m = ρ6πR3
3(7)
Substituting equation (7) into equation (6), τ can be written as:
τ =2ρR2
9η(8)
Taking the typical values for all the variables used in the experiments (ρ= 1,000 kg.m−3; R = 250.10−6 m; and η= 0.77Pa.s) the transition time τ ≈ 18 µs. This transition time is significantly smaller than the duration of the sorting pulse, (10 - 40
10/16
ms). Hence, the droplet can be assumed to be at terminal velocity throughout the sorting process and equation (5) can be usedto describe the movement of the droplet in the y-axis within the sorting chamber. However, the droplet also travels in the x-axis,parallel to the flow, carried by the oil. If the droplets do not interact with each other mechanically, the terminal velocity ofthe droplet owing to pressure difference is relatively constant.4 Hence, equation (5) can be used to estimate the theoreticalmaximum sorting frequency, f sort . Assuming that the critical distance d0 the droplet must be displaced in the y-axis in order tobe sorted equals the diameter of the droplet: d0 = 2R; and that in order to prevent false positives, no more than one droplet canbe in the electric field in the sorting chamber at any one time:
fsort =vt,y
wsort=
vt,y
2R=
12R
2R2εmRe[ fCM]∇|~E|2
3η(9)
The derivation of Equation (9) assumes that as soon as one drop is sorted the next droplet arrives in the sorter. During ourexperiments, however, this was not the case. Droplets were spaced with sufficient carrier oil to prevent false positives due totwo consecutive droplets being in the sorter at the same time (Qdroplets 125-700 µl.h−1 and Qoil 10-21 ml.h−1). Therefore theratio between the droplet diameter and the interval to the next droplet is approximately 100:1. This would result in observedsorting frequencies approximately 100-times smaller than that calculated from the theoretical maximum since the droplet travelsthrough a distance of dp ∼ 2R as it undergoes the sorting operation.
As f sort depends on the electric field inhomogeneity ∇|~E|2, we derived the analytical form of for both the same-side andcross-side electrode configurations (Supplementary Fig. S6).
The electric field distribution in the case of electrode with the same-side configuration can be modeled as an electric dipolefield, considering the tips of the electrodes as point electric charges. Standard textbook derivation5 dictates that the electric fielddistribution of a dipole can be written as:
~E =3gvr2 sinθ cosθ i+
gvr2 (3cos2
θ −1) j (10)
where r, g, and θ are as defined in FIGGGGGGUU. Using algebra, the magnitude of the electric field |~E| can be written as:
~E =√
E2x +E2
y =gvr2 (3cos2
θ +1)1/2 (11)
Hence, the term ∇|~E|2 can be derived as follows:
∇|~E|2 = −4g2V 2(1+3cosθ 2)
r5 r+−6g2V 2 cosθ sinθ)
r4 θ (12)
if expressed in polar coordinate form. Hence, the magnitude of ∇|~E|2 can be expressed as
|∇|~E|2|=√
16g4V 4(1+3cosθ 2)2
r10 +36g4V 4 cosθ 2 sinθ 2
r8 (13)
which can be simplified to give:
|∇|~E|2|= 2g2V 2
r5
√4+36cosθ 4 +3cos2 θ(8+3r2 sin2
θ) (14)
The value of cosθ < 1, hence, we can safely neglect the contribution from the term cos4θ � 1. The equation then can bereduced to:
|∇|~E|2|= 2g2V 2
r5
√4+3cos2 θ(8+3r2 sin2
θ) (15)
Supplementary Fig. S6 shows that the magnitude |∇|~E|2| depends on position of the droplet in the sorting chamber: as thedroplet traverses the sorting chamber, the magnitude of |∇|~E|2| varies. The inhomogeneity is extremely large in the region
11/16

very close to the proximity of the tip of the electrodes. However, |∇|~E|2| tapers off rapidly in the region slightly further awayfrom the tip. Indeed, equation (15) shows that |∇|~E|2| decays with the inverse power of five of the distance to the tip of theelectrodes. Supplementary Fig. S6 also reveals that the magnitude of |∇|~E|2| is always minimum at the y-axis (0,y) and cosθ=0.When cosθ=0, equation (15), reduces to:
|∇|~E|2|min = 4g2V 2
r5 (16)
Similarly, Supplementary Fig. S6 also shows that the magnitude of |∇|~E|2| is always maximum on the line y=x and y=-x.When the terms cosθ = 1
2
√2 and sinθ = 1
2
√2, |∇|~E|2| are maximum equation (15) reduces to:
|∇|~E|2|max = 2g2V 2
r5
√16+
9r2
4(17)
Hence, on average, the magnitude of field inhomogeneity that the droplet experiences is:
|∇|~E|2|average =g2(4+
√64+9r2)V 2
2r5 (18)
Since the droplet travels across the sorting chamber, it travels through a distance of r ∼ R as it undergoes the sortingoperation. Hence, through substitution, we can get:
|∇|~E|2|average =g2(4+
√64+9R2)V 2
2R5 (19)
Substituting Equation (19) in place of |∇|~E|2| in equation (9) gives:
fsort =1
2R2R2εmRe[ fCM]
3η
g2(4+√
64+9R2)V 2
2R5 (20)
Which can be rearranged to give:
fsort =εmRe[ fCM]
3η
g2(4+√
64+9R2)V 2
2R4 (21)
Equation (21) shows the relationship between the sorting frequency, f sort , the distance between the positive and negativeelectrode, g, the droplet radius, R, and the applied voltage, V. It can be seen that as the applied voltage is increased, the sortingfrequency is also increased in quadratic fashion.
However, there is a limit to the voltage that one can apply before the droplet splits owing to Maxwell stress exerted upon thedroplet as a result from the applied voltage surmounting the resistance to deformation due to interfacial tension. The magnitudeof the electric field, , above which droplets split6 is given by the expression:
|~E|max =
√γ
ε0εcR(22)
where γ , is the interfacial tension, ε0 is the vacuum permittivity and εc is the permittivity of the carrier fluid. Substitutingthe expression for |~E|=− dV
dR ; we can hence write:
−dVmax
dR=
√γ
ε0εcR(23)
dVmax =−√
γ
ε0εcRdR (24)
12/16

∫dVmax =−
∫ √γ
ε0εcRdR (25)
Vmax = 2R√
γ
ε0εcR(26)
Hence,
V 2max =
4Rγ
ε0εc(27)
Substituting equation (27) into equation (21), then we can obtain the theroretical maximum sorting frequency limited byelectrosplitting, f e:
fe =εmRe[ fCM]
3η
g2(4+√
64+9R2)V 2
2R44Rγ
ε0εc(28)
The cross-side configurations can be modelled as a point charge and line charge (Supplementary Fig. S6). The totalpotential from both point and line charge can be expressed as:
Vtotal =kQ√
x2 + y2− kQ
Llog[
L2 +√(w− y)2 +L2
w− y] (29)
Where k (8.9 109 m.F−1) is the Coulomb constant, Q is the electrostatic charge associated with the electrode5 and L isthe length of the electrode 3, as shown in Supplementary Fig. S6. From which, we can then calculate the scalar field of themagnitude of electric field, as follows:
|~E|=
√k2Q2x2
(x2 + y2)3 +(kLQ(1+
√L2 +(w− y)2)
(L2 +√
L2 +(w− y)2√
L2 +(w− y)2(w− y)+
kQy(x2 + y2)3/2 )
2 (30)
From the above equation, we can hence derive the |∇|~E|2| term which determines the DEP force, and thus the sortingfrequency.
|∇|~E|2|=√((− 6k2Q2x3
(x2 + y2)4 +2k2Q2x
(x2 + y2)3 +6kQxy(−
kQ(− 1√L2+(w−y)2
+L2+√
L2+(w−y)2
(w−y)2)(w−y)
L(L2+√
L2+(w−y)2)− kQy
(w2+y2)3/2)
(x2 + y2)5/2 − 6k2Q2x2y(x2 + y2)4 )
2
+2(kQ(− 1√
L2+(w−y)2+
L2+√
L2+(w−y)2
(w−y)2 )
L(L2 +√
L2 +(w− y)2)−
kQ(2(L2+√
L2+(w−y)2)
(w−y)3 − 1√L2+(w−y)2(w−y)
− w−y(L2+(w−y)2)3/2 (w− y)
L(L2 +√
L2 +(w− y)2)
−kQ(− 1√
L2+(w−y)2+
L2+√
L2+(w−y)2
(w−y)2 )(w− y)2
L(L2 +√
L2 +(w− y)2)2√
L2 +(w− y)2+
3kQy2
(x2 + y2)5/2 −kQ
(x2 + y2)3/2 )
(−kQ(− 1√
L2+(w−y)2+
L2+√
L2+(w−y)2
(w−y)2 )(w− y)
L(L2 +√
L2 +(w− y)2)− kQy
(x2 + y2)3/2 ))2) (31)
Supplementary Fig. S6 shows the distribution of |∇|~E|2| in the sorting chamber, as calculated using Equation (31). Incontrast to the |∇|~E|2| distribution in the same-side configuration, the |∇|~E|2| diminishes more slowly in the case of the
13/16

cross-side configuration as also observed in the finite-element analysis simulations (Supplementary Fig. S3). Within the sortingchamber, the maximum of |∇|~E|2| is located at the y-axis (0,y). Hence, if we take limit x approaching to zero, the equation canbe simplified to:
|∇|~E|2|= 2√((k2Q2(
kLQ(1+√
L2 +(w− y)2)
(L2 +√
L2 +(w− y)2)2(L2 +(w− y)2)− kLQ(1+
√L2 +(w− y)2)
(L2 +√
L2 +(w− y)2)√
L2 +(w− y)2(w− y)2
+kLQ(2L2(1+
√L2 +(w− y)2)+(3+2
√L2 +(w− y)2)(w− y)2)
(L2 +√
L2 +(w− y)2)(L2 +(w− y)2)3/2(w− y)2− 2kQ
√y2
y4 )2
(L(1+
√L2 +(w− y)2)
(L2 +√
L2 +(w− y)2)√
L2 +(w− y)2(w− y)+
√y2
y3 )2) (32)
The width of the sorting chamber is approximately three times the diameter of the droplet, while the droplet itself usually ispositioned at 2R away from the tip of the pointed electrode. Hence, substituting w = 6R, and y = 2R in the above equation, wecan write:
|∇|~E|2|= 12√(k4Q4(
√R2
4R3 +L(1+
√L2 +R2)
R(R2 +L2(1+√
L2 +R2)))2(
√R2
R4 −4L(1+
√L2 +R2)
(L2 +R2)(L2 +√
L2 +R2)2+
4L(1+√
L2 +R2)
R2(R2 +L2(1+√
L2 +R2))− 4L(2L2(1+
√L2 +R2)+R2(3+2
√L2 +R2))
R2(L2 +R2)3/2(L2 +√
L2 +R2))2) (33)
Rearranging equation (29), we can rewrite:
Q =LVtotal
√x2 + y2
k(L−√
x2 + y2 log[L2+√
L2+(w−y)2
w−y ])(34)
Substituting (34) into (33), and simplifying, we get equation (35):
|∇|~E|2|=V 2
total2×
√(
1
(L−√
x2 + y2 log[L2+√
L2+(w−y)2
w−y ])4)(L4(
√R2
4R3 +L(1+
√L2 +R2)
R(R2 +L2(1+√
L2 +R2)))2(
√R2
R4 −4L(1+
√L2 +R2)
(L2 +R2)(L2 +√
L2 +R2)2
+4L(1+
√L2 +R2)
R2(R2 +L2(1+√
L2 +R2))− 4L(2L2(1+
√L2 +R2)+R2(3+2
√L2 +R2))
R2(L2 +R2)3/2(L2 +√
L2 +R2))2(x2 + y2)2)) (35)
Hence, substituting the above equation into Equation (9), we obtain:
fsort =1
2R2R2εmRe[ fCM]
3η
V 2total2×
√(
1
(L−√
x2 + y2 log[L2+√
L2+(w−y)2
w−y ])4)(L4(
√R2
4R3 +L(1+
√L2 +R2)
R(R2 +L2(1+√
L2 +R2)))2(
√R2
R4 −4L(1+
√L2 +R2)
(L2 +R2)(L2 +√
L2 +R2)2
+4L(1+
√L2 +R2)
R2(R2 +L2(1+√
L2 +R2))− 4L(2L2(1+
√L2 +R2)+R2(3+2
√L2 +R2))
R2(L2 +R2)3/2(L2 +√
L2 +R2))2(x2 + y2)2)) (36)
Similar to the case of same-side configuration, the theoretical frequency calculation above dictates the hypothetical sortingfrequency limit at a certain applied voltage for cross-side electrode configuration. However, the voltage that can be applied isalso limited by the surface tension of the droplet. Hence, if we replace the voltage in the equation above with that of maximum
14/16

voltage allowed by surface tension, described by equation (27), we can write the following equation (37), which describes thetheoretical maximum sorting frequency limited by electrosplitting, f e:
fe =1
2R2R2εmRe[ fCM]
3η
12(
4Rγ
ε0εc)×
√(
1
(L−√
x2 + y2 log[L2+√
L2+(w−y)2
w−y ])4)(L4(
√R2
4R3 +L(1+
√L2 +R2)
R(R2 +L2(1+√
L2 +R2)))2(
√R2
R4 −4L(1+
√L2 +R2)
(L2 +R2)(L2 +√
L2 +R2)2
+4L(1+
√L2 +R2)
R2(R2 +L2(1+√
L2 +R2))− 4L(2L2(1+
√L2 +R2)+R2(3+2
√L2 +R2))
R2(L2 +R2)3/2(L2 +√
L2 +R2))2(x2 + y2)2)) (37)
The maximum theoretical sorting frequency, f e, for same-side and cross-side electrode configurations can be calculated bysubstituting experimental values into equation (28) and equation (37). The Re[ fCM], the Claussius-Mossoti factor, capturesthe contribution to the DEP due to dielectric constant difference between that of the object and that of the medium. Owing tothe fact that the dielectric constant changes as a function of the frequency of the applied electric field, the Claussius-Mossotifactor also changes as a function of the frequency of the applied sorting voltage. However, Ahn et al. reported that the realpart of the Claussius-Mossoti factor Re[ fCM] is ∼1 for frequencies up to ∼1 MHz.1 This frequency is much higher thanthe voltage frequency used here: 1.4 kVpp, 30 kHz; hence, the Re[ fCM] was assumed to be 1. Using a droplet volume of10 nl, oil viscosity of 18 mPa.s−1,7 relative permittivity of oil of 2,8 interfacial tension of 10.60 mN.m−1,7 and taking intoconsideration the spacing of droplets with carrier oil (the ratio between the droplet diameter and the interval to the next dropletis approximately 100:1), the maximum theoretical sorting frequency, f e, for same-side configuration is 3 droplet.s−1; while thatfound for cross-side configuration is 46 droplet.s−1. This calculated value for maximum sorting frequency, limited by Maxwellstress, is close to that observed experimentally. Furthermore, plotting f e for different droplet volumes reveals that with bothelectrode configurations f e is inversely proportional to the droplet volume. However, if the droplet volume is >158 pl (∼67 µmdiameter), the sorter with the cross-side electrode configuration allows the highest sorting rate, whereas with droplets of <158pl the sorter with the same-side electrode configuration allows the highest sorting rate.
15/16

Skewness analysis of activities distributions from the microplate screeningFor each distribution, we measured the skewness of the distribution as the third moment of the distribution (Pearson’s momentcoefficient of skewness). We obtained a value of -0.5 for the wild-type (O58) distribution (144 replicates) and 1.05 for thesorted fungi distribution (1,262 strains). For a Gaussian distribution, we performed numerical simulation over 10,000 randomchoices of 144 or 1,262 values and each time measured the skewness. The random selection of 144 values gives a Gaussiandistribution of skewness centered around 0 with a standard deviation (σskewness) of 0.2. The random selection of 1,262 valuesleads to a Gaussian skewness distribution centered around 0 with a σskewness of 0.07. These skewness distributions were thenused to calculate p-values. The O58 skewness was not significantly different from a normal distribution (p = 0.0124; α = 0.01).However, the sorted fungi distribution has a significant positive skew (p < 0.00001; α = 0.01).
References1. Ahn, K. et al. Dielectrophoretic manipulation of drops for high-speed microfluidic sorting devices. Appl. Phys. Lett. 88, 1–3
(2006).
2. Agresti, J. J. et al. Ultrahigh-throughput screening in drop-based microfluidics for directed evolution. Proc. Natl. Acad. Sci.USA 107, 4004–4009 (2010).
3. Baret, J.-C. et al. Fluorescence-activated droplet sorting (FADS): efficient microfluidic cell sorting based on enzymaticactivity. Lab Chip 9, 1850–1858 (2009).
4. Schindler, M. & Ajdari, A. Droplet Traffic in Microfluidic Networks: A Simple Model for Understanding and Designing.Phys. Rev. Lett. 100, 44501 (2008).
5. Gordon, J. & McGrew, R. Physics for scientists ond engineers 5th edn (Saunders College Publishing, 2000).
6. Sherwood, J. D. Breakup of fluid droplets in electric and magnetic fields. J. Fluid Mech. 188, 133–146 (1988).
7. Tice, J. D., Lyon, A. D. & Ismagilov, R. F. Effects of viscosity on droplet formation and mixing in microfluidic channels.Anal. Chim. Acta 507, 73–77 (2004).
8. Fuoss, R. M. Dielectric Constants of Some Fluorine Compounds. J. Am. Chem. Soc. 60, 1633–1637 (1938).
16/16