high-throughput prostate cancer gland detection, segmentation, and classification ... ·...
TRANSCRIPT
High-Throughput Prostate Cancer Gland
Detection, Segmentation, and Classification fromDigitized Needle Core Biopsies
Jun Xu1, Rachel Sparks1, Andrew Janowcyzk1,3, John E. Tomaszewski2,Michael D. Feldman2, and Anant Madabhushi1
1 Department of Biomedical Engineering, Rutgers University, USA2 The Hospital of the University of Pennsylvania, Anatomic and Surgical Pathology
Informatics, Philadelphia, USA3 Department of Computer Science and Engineering, Indian Institute of Technology
(IIT) Bombay, Mumbai, India
Abstract. We present a high-throughput computer-aided system forthe segmentation and classification of glands in high resolution digitizedimages of needle core biopsy samples of the prostate. It will allow forrapid and accurate identification of suspicious regions on these samples.The system includes the following three modules: 1) a hierarchical fre-quency weighted mean shift normalized cut (HNCut) for initial detectionof glands; 2) a geodesic active contour (GAC) model for gland segmen-tation; and 3) a diffeomorphic based similarity (DBS) feature extractionfor classification of glands as benign or cancerous. HNCut is a minimallysupervised color based detection scheme that combines the frequencyweighted mean shift and normalized cuts algorithms to detect the lu-men region of candidate glands. A GAC model, initialized using theresults of HNCut, uses a color gradient based edge detection function foraccurate gland segmentation. Lastly, DBS features are a set of morpho-metric features derived from the nonlinear dimensionality reduction of adissimilarity metric between shape models. The system integrates thesemodules to enable the rapid detection, segmentation, and classificationof glands on prostate biopsy images. Across 23 H & E stained prostatestudies of whole-slides, 105 regions of interests (ROIs) were selected forthe evaluation of segmentation and classification. The segmentation re-sults were evaluated on 10 ROIs and compared to manual segmentationin terms of mean distance (2.6± 0.2 pixels), overlap (62± 0.07%), sensi-tivity (85±0.01%), specificity (94±0.003%) and positive predictive value(68 ± 0.08%). Over 105 ROIs, the classification accuracy for glands au-tomatically segmented was (82.5 ± 9.10%) while the accuracy for glandsmanually segmented was (82.89± 3.97%); no statistically significant dif-ferences were identified between the classification results.
Keywords: High-throughput, geodesic active contour model, morpho-logical feature, prostate cancer, glands, needle biopsy, digital pathology.
A. Madabhushi et al. (Eds.): Prostate Cancer Imaging 2010, LNCS 6367, pp. 77–88, 2010.c© Springer-Verlag Berlin Heidelberg 2010
78 J. Xu et al.
1 Introduction
Digital pathology is a rapidly expanding field for the analysis, viewing, andstorage of histology tissue samples due to the advent and cost-effectiveness ofwhole-slide digital scanners [1]. In the context of prostate cancer (CaP), pathol-ogists grade histopathological specimens by visually characterizing gland mor-phology and architecture in regions they suspect are malignant. The Gleasongrading system is used to describe CaP aggressiveness; nonaggressive glands(grade 1) are medium-sized with round shapes, while aggressive glands (grade5) are small and have irregular shapes [2]. CaP grading of histopathology cantherefore be divided into two separate tasks: identification of malignant regionsand the Gleason grading of the malignant regions. The ability to quickly andaccurately identify suspicious regions in tissue samples will enable the pathol-ogist to focus their grading efforts on candidate regions, minimizing the timespent on identifying CaP regions. Doyle et al. [3] have demonstrated the effec-tiveness for discriminating malignant regions using texture based features at lowimage resolutions. Recently, Monaco et al. [4] showed that gland size can be usedto discriminate between malignant and benign glands on high resolution wholemount histopathology of the prostate. Automated schemes for Gleason grading ofsuspicious regions on prostate histopathology have attempted to leverage glandmorphology by quantifying contour variability, length-to-width ratio, or relatedfeatures [5], [6]. We have recently demonstrated that Diffeomorphic Based Simi-larity (DBS) features are better able to capture subtle morphometric differencesbetween prostate glands of different Gleason grades than previously reportedmorphological features [7].
An important pre-requisite to extracting morphological features is the abil-ity to accurately and efficiently detect the location of glands and segment themaccurately while preserving important morphological information. While activecontour models are good candidate for this task, most active contour modelsare not able to efficiently handle very large images. Region-based active con-tour models do not require accurate contour initialization, however they mayinvolve significant computational overhead [8]. Hence, there is a need for rapididentification of the regions of interest in order to initialize the active contourmodel. Hierarchical mean shift normalized cuts (HNCut) was shown to efficientlydetermine the location of the region of interest on very large histopathology im-ages [9]. Additionally, for most boundary based active contour models, the evo-lution function is dependent on the gray scale intensity gradient [10]. We employa local structure tensor based color gradient, obtained by calculating the localmin/max variations contributed from each color channel (e.g. R, G, B or H, S,V), resulting in stronger object boundaries compared to the gray scale gradient.
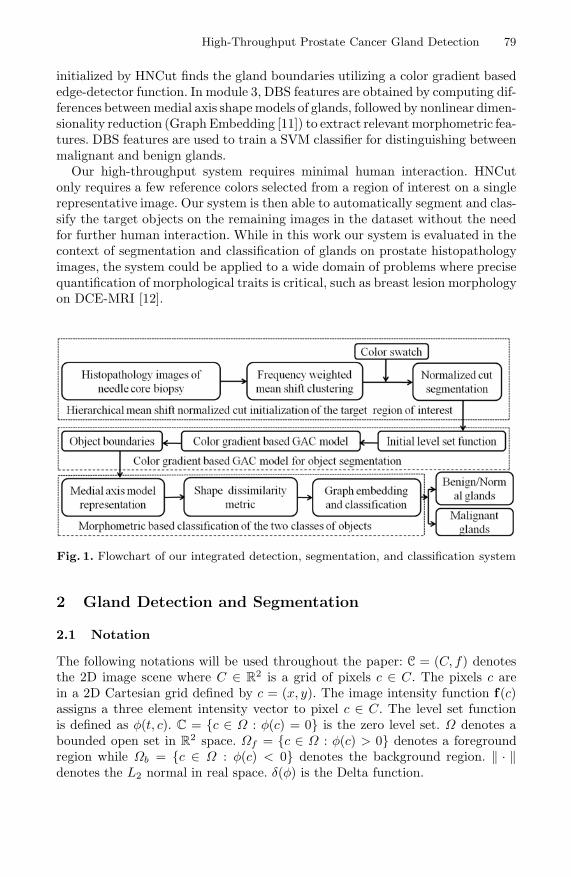
We present a system which applies a geodesic active contour (GAC) model inconjunction with DBS feature extraction to effectively segment and classify theglandular regions of needle core biopsies of the prostate in a high-throughput man-ner. Figure 1 shows the flowchart of our system which is comprised of three mod-ules. Module 1 identifies glands using HNCut, an accurate, efficient, and minimallyinteractive model initialization scheme HNCut. In module 2, our GAC model
High-Throughput Prostate Cancer Gland Detection 79
initialized by HNCut finds the gland boundaries utilizing a color gradient basededge-detector function. In module 3, DBS features are obtained by computing dif-ferences between medial axis shape models of glands, followed by nonlinear dimen-sionality reduction (Graph Embedding [11]) to extract relevant morphometric fea-tures. DBS features are used to train a SVM classifier for distinguishing betweenmalignant and benign glands.
Our high-throughput system requires minimal human interaction. HNCutonly requires a few reference colors selected from a region of interest on a singlerepresentative image. Our system is then able to automatically segment and clas-sify the target objects on the remaining images in the dataset without the needfor further human interaction. While in this work our system is evaluated in thecontext of segmentation and classification of glands on prostate histopathologyimages, the system could be applied to a wide domain of problems where precisequantification of morphological traits is critical, such as breast lesion morphologyon DCE-MRI [12].
Fig. 1. Flowchart of our integrated detection, segmentation, and classification system
2 Gland Detection and Segmentation
2.1 Notation
The following notations will be used throughout the paper: C = (C, f) denotesthe 2D image scene where C ∈ R
2 is a grid of pixels c ∈ C. The pixels c arein a 2D Cartesian grid defined by c = (x, y). The image intensity function f(c)assigns a three element intensity vector to pixel c ∈ C. The level set functionis defined as φ(t, c). C = {c ∈ Ω : φ(c) = 0} is the zero level set. Ω denotes abounded open set in R
2 space. Ωf = {c ∈ Ω : φ(c) > 0} denotes a foregroundregion while Ωb = {c ∈ Ω : φ(c) < 0} denotes the background region. ‖ · ‖denotes the L2 normal in real space. δ(φ) is the Delta function.
80 J. Xu et al.
2.2 Hierarchical Mean Shift Based Normalized Cuts DetectionScheme
The hierarchical mean shift based normalized cuts (HNCut) scheme was origi-nally presented in [9] for rapidly and accurately segmenting the object class ofinterest. By operating in the color domain, as opposed to the spatial domain(on pixels), the scheme is able to rapidly identify the gland regions even on verylarge images. The scheme is outlined below:
1. User selects the domain swatch defined as a set of pixels that are represen-tative of the target class;
2. Frequency weighted mean-shift clustering is performed on a multi-resolutioncolor pyramid;
3. Normalized cuts is used on the reduced color space created by the weightedmean-shift algorithm.
HNCut is robust to human intervention; the first step is only applied to a singlerepresentative image containing the target class. After the color swatch has beenselected from the region of interest in the first image, the same swatch may beapplied to all other images. The resulting target objects make for an excellentinitialization of the active contour model that is subsequently applied.
2.3 Geodesic Active Contour Model
Energy functional. Assume the image plane Ω ∈ R2 is partitioned into 2
non-overlapping regions by a zero level set function φ: the foreground Ωf andbackground Ωb. The optimal partition of the image plane Ω by a zero level setfunction φ can be obtained through minimizing the energy functional as follows,
E(φ) = αE1(φ) + βE2(φ) + γE3(φ), (1)
= α
∫C
g(f(c))dc + β
∫Ωf
g(f(c))dc + γ
∫Ω
12(‖∇φ‖ − 1)2dc,
where E1(φ) is the energy functional of a traditional GAC model. E2(φ) is in-spired by the balloon force proposed in [13]. An additional term E3(φ) is addedto the energy functional to remove the re-initialization phase which is requiredas a numerical remedy for maintaining stable curve evolution in traditional levelset methods [14].
The color gradient. The edge-detector function in the traditional GAC modeland the balloon force are based on the calculation of the gray scale gradient ofthe image [10]. In this paper, the edge-detector function is based on the colorgradient which is defined as g(f(c)) = 1
1+s(f(c)) . s(f(c)) is the local structure ten-
sor based color gradient which is defined as s(f(c)) =√
λ+ − λ− [15], where λ+
and λ− are the maximum and minimum eigenvalues of the local structure tensorof each pixel in the image. It locally sums the gradient contributions from eachimage channel representing the extreme rates of change in the direction of theircorresponding eigenvectors. The methodology for computing the color gradient
High-Throughput Prostate Cancer Gland Detection 81
described above can be applied to different vectorial color representations suchas RGB, HSV, and Luv.
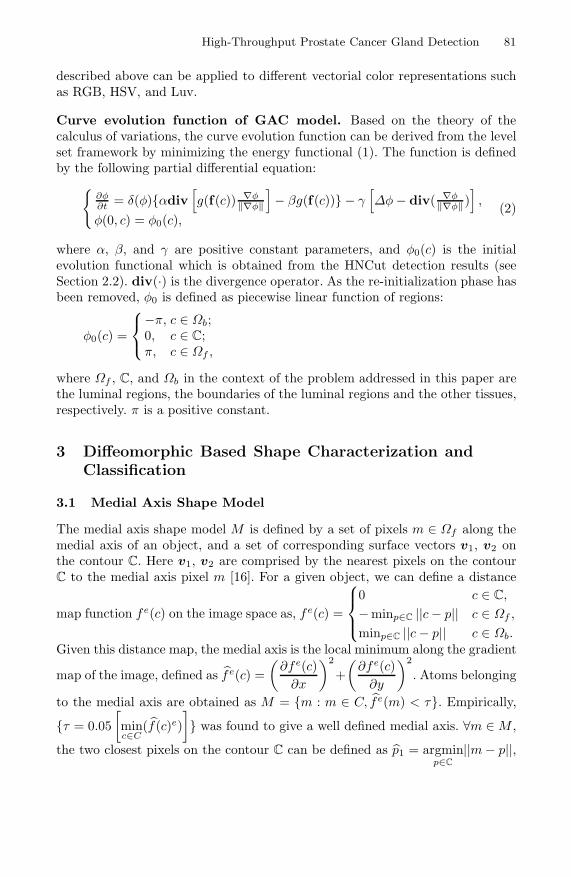
Curve evolution function of GAC model. Based on the theory of thecalculus of variations, the curve evolution function can be derived from the levelset framework by minimizing the energy functional (1). The function is definedby the following partial differential equation:
{∂φ∂t = δ(φ){αdiv
[g(f(c)) ∇φ
‖∇φ‖]− βg(f(c))} − γ
[Δφ − div( ∇φ
‖∇φ‖ )],
φ(0, c) = φ0(c),(2)
where α, β, and γ are positive constant parameters, and φ0(c) is the initialevolution functional which is obtained from the HNCut detection results (seeSection 2.2). div(·) is the divergence operator. As the re-initialization phase hasbeen removed, φ0 is defined as piecewise linear function of regions:
φ0(c) =
⎧⎨⎩
−π, c ∈ Ωb;0, c ∈ C;π, c ∈ Ωf ,
where Ωf , C, and Ωb in the context of the problem addressed in this paper arethe luminal regions, the boundaries of the luminal regions and the other tissues,respectively. π is a positive constant.
3 Diffeomorphic Based Shape Characterization andClassification
3.1 Medial Axis Shape Model
The medial axis shape model M is defined by a set of pixels m ∈ Ωf along themedial axis of an object, and a set of corresponding surface vectors v1, v2 onthe contour C. Here v1, v2 are comprised by the nearest pixels on the contourC to the medial axis pixel m [16]. For a given object, we can define a distance
map function fe(c) on the image space as, fe(c) =
⎧⎪⎨⎪⎩
0 c ∈ C,
−minp∈C ||c − p|| c ∈ Ωf ,
minp∈C ||c − p|| c ∈ Ωb.Given this distance map, the medial axis is the local minimum along the gradient
map of the image, defined as fe(c) =(
∂fe(c)∂x
)2
+(
∂fe(c)∂y
)2
. Atoms belonging
to the medial axis are obtained as M = {m : m ∈ C, fe(m) < τ}. Empirically,
{τ = 0.05[minc∈C
(f(c)e)]} was found to give a well defined medial axis. ∀m ∈ M ,
the two closest pixels on the contour C can be defined as p1 = argminp∈C
||m − p||,
82 J. Xu et al.
(a) (b) (c) (d)
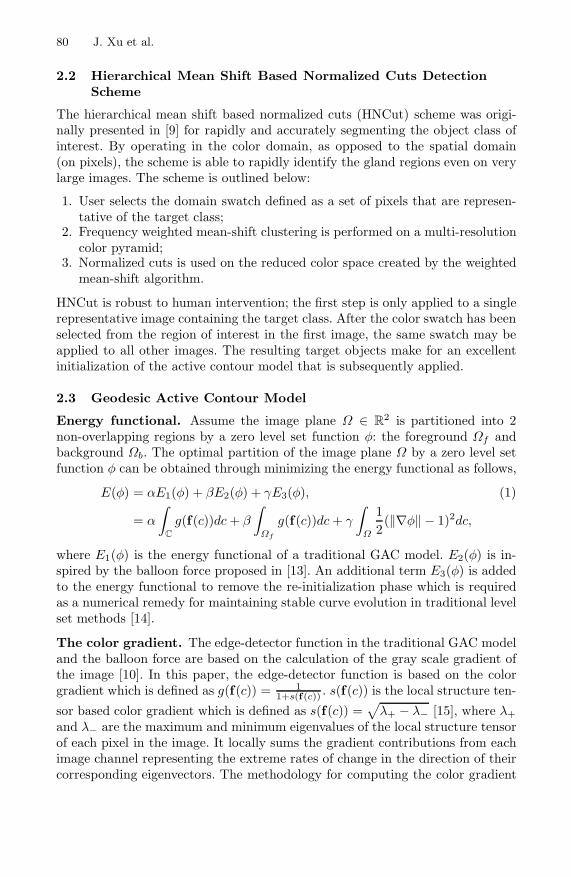
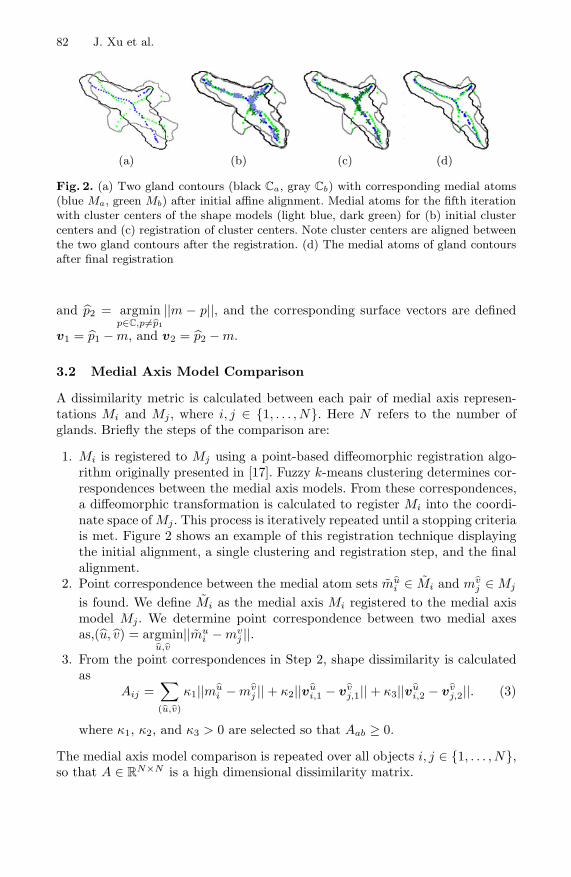
Fig. 2. (a) Two gland contours (black Ca, gray Cb) with corresponding medial atoms(blue Ma, green Mb) after initial affine alignment. Medial atoms for the fifth iterationwith cluster centers of the shape models (light blue, dark green) for (b) initial clustercenters and (c) registration of cluster centers. Note cluster centers are aligned betweenthe two gland contours after the registration. (d) The medial atoms of gland contoursafter final registration
and p2 = argminp∈C,p�=p1
||m − p||, and the corresponding surface vectors are defined
v1 = p1 − m, and v2 = p2 − m.
3.2 Medial Axis Model Comparison
A dissimilarity metric is calculated between each pair of medial axis represen-tations Mi and Mj , where i, j ∈ {1, . . . , N}. Here N refers to the number ofglands. Briefly the steps of the comparison are:
1. Mi is registered to Mj using a point-based diffeomorphic registration algo-rithm originally presented in [17]. Fuzzy k-means clustering determines cor-respondences between the medial axis models. From these correspondences,a diffeomorphic transformation is calculated to register Mi into the coordi-nate space of Mj. This process is iteratively repeated until a stopping criteriais met. Figure 2 shows an example of this registration technique displayingthe initial alignment, a single clustering and registration step, and the finalalignment.
2. Point correspondence between the medial atom sets mui ∈ Mi and mv
j ∈ Mj
is found. We define Mi as the medial axis Mi registered to the medial axismodel Mj. We determine point correspondence between two medial axesas,(u, v) = argmin
u,v||mu
i − mvj ||.
3. From the point correspondences in Step 2, shape dissimilarity is calculatedas
Aij =∑(u,v)
κ1||mui − mv
j || + κ2||vui,1 − vv
j,1|| + κ3||vui,2 − vv
j,2||. (3)
where κ1, κ2, and κ3 > 0 are selected so that Aab ≥ 0.
The medial axis model comparison is repeated over all objects i, j ∈ {1, . . . , N},so that A ∈ R
N×N is a high dimensional dissimilarity matrix.
High-Throughput Prostate Cancer Gland Detection 83
3.3 Feature Extraction
From A, we define similarity matrix W , where Wij = e−Aij/σ, and σ > 0 controlsthe width of the neighborhoods. D is diagonal matrix whose diagonal elementsare defined as dii =
∑j Wij . Here Aij and Wij are elements of matrices A and
W , respectively. From the Laplacian matrix D − W , we find a low dimensionalspace Y = (y(1),y(2), . . . ,y(N))T ∈ R
N×d, where N >> d, that attempts topreserve pairwise distances between glands in A. Let Y∗ be the set of all N × dmatrices Y such that YT DY = Id. The DBS features of each gland will bedetermined from the optimal Y ∈ Y∗ by solving the following minimizationproblem [11]
minY∈Y∗
∑Ni=1
∑Nj=1 ‖y(i) − y(j)‖2Wij = tr(YT(D − W )Y), (4)
s.t YTDY = Id
where y(i) = (y1(i), y2(i), . . . , yd(i))T is the d-dimensional representation of thei-th gland and Id is the d−dimensional identity matrix. Each row vector in Y isused to determine d−dimensional DBS features of a corresponding gland, whered = 3 in this work.
4 Experimental Design and Performance Measures
4.1 Data Description
The data set includes digitized images of whole-slide prostate needle core biopsyspecimens obtained from 23 patients and stained with Hematoxylin & Eosin(H&E). All studies were obtained from the Hospital at the University of Penn-sylvania (UPENN). Each sample was digitized at 20x optical magnification us-ing an Aperio whole-slide digital scanner. For all images, an expert pathologistmanually annotated regions of interest (ROI) with different class labels: benignepithelium, benign stroma, and Gleason grades 3 and 4. Within each ROI, a hu-man observer manually segmented the lumen layer of each gland. A total of 105ROIs were identified consisting of benign (23 ROIs, 66 glands), Gleason grade 3(71 ROIs, 656 glands), and grade 4 (11 ROIs, 36 glands).
4.2 Quantitative Evaluation of Segmentation
Owing to the great deal of manual labor involved in segmenting the gland bound-aries, we limited the quantitative evaluation to only glands present within 10 ROIsfrom 10 whole-slide images randomly selected. The boundaries of automated seg-mentation are defined as the contours of the zero level set function of active con-tour models after convergence. We evaluate the segmentation results via two typesof measurements. For boundary-based measurements, mean absolute distance(MAD) was calculated as MAD = 1
s
∑sν=1{min
χ‖cν − cχ‖}, ∀cχ ∈ G, ∀cν ∈ S
84 J. Xu et al.
where G = {cχ|χ ∈ {1, . . . , t}} and S = {cν |ν ∈ {1, . . . , s}} are closed bound-aries of manual and automated segmentation, respectively. t and s represent thenumber of pixels on the boundaries of manual and automated segmentation, re-spectively. For region-based measurements we calculated overlap (OL), sensitiv-ity (SN), specificity (SP), and positive predictive value (PPV). For each image,the set of pixels lying within the manual delineations of the glands is denoted asA(G). A(S) is the set of pixels whose level set functions are positive, after the con-vergence of active contour model. OL, SN, SP, and PPV are then defined as OL= |A(S)∩A(G)|
|A(S)∪A(G)| , SN = |A(S)∩A(G)||A(G)| , SP = |C−A(S)∪A(G)|
|C−A(G)| , and PPV = |A(S)∩A(G)||A(S)| ,
where |S| represents the cardinality of set S.
4.3 Morphological Feature Set Evaluation
A support vector machine (SVM) classifier [18] was used to evaluate the discrim-inability of the DBS features, with higher SVM accuracy reflecting a feature setthat is better able to describe morphometric differences between gland classes.In this experiment we (a) compare the performance of the DBS features ver-sus traditional boundary based attributes (area, perimeter, area overlap ratio,average radial distance ratio, standard deviation of the normalized distance ra-tio, compactness, and smoothness [12]) and (b) evaluate whether, from a glandclassification perspective, the results obtained from automated and manual seg-mentation were significantly different. Four feature sets were tested comprisingof DBS or traditional morphological features from either automated or manualgland segmentations.
For all feature sets malignant glands were defined as all glands containedwithin ROIs of a Gleason grade 3 or 4, while benign glands are obtained frombenign ROIs. The SVM classifier accuracy was evaluated by utilizing a leave-one-study-out approach. The leave-one-study-out approach selected a testingset consisting of all glands from one patient study while the training set wascomprised of glands from the remaining 22 patient studies. We evaluated theaccuracy of our automated segmentation by performing a paired t-test over all23 test sets between automated and manual segmentation for each feature set.We hypothesize that if no significant difference is found between the classificationaccuracies of the manual and automated schemes, the automated segmentationresults are as good as the manual segmentation.
5 Experimental Results and Discussion
5.1 Segmentation Evaluation
Table 1 shows the results of quantitative evaluation of segmentation by our auto-mated GAC scheme in terms of MAD, OL, SN, SP and PPV across 10 ROIs from
High-Throughput Prostate Cancer Gland Detection 85
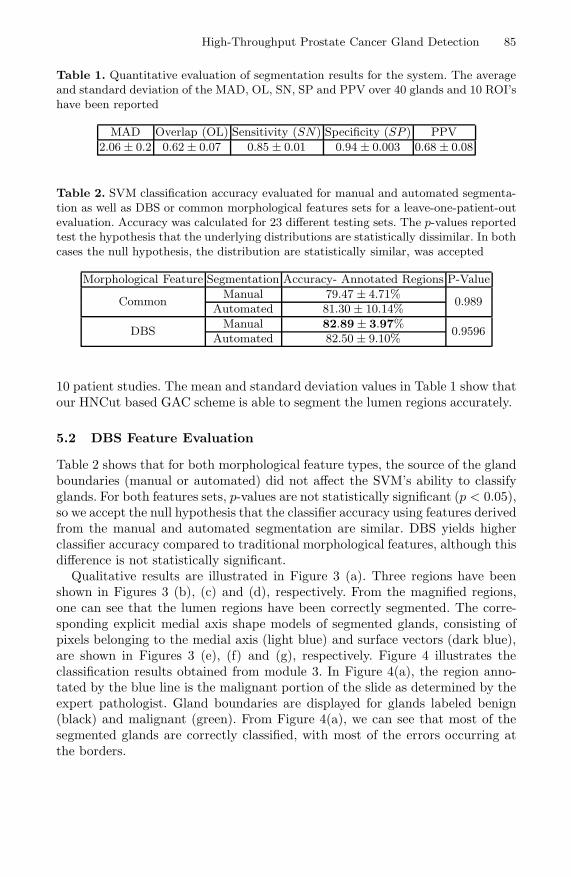
Table 1. Quantitative evaluation of segmentation results for the system. The averageand standard deviation of the MAD, OL, SN, SP and PPV over 40 glands and 10 ROI’shave been reported
MAD Overlap (OL) Sensitivity (SN) Specificity (SP ) PPV
2.06 ± 0.2 0.62 ± 0.07 0.85 ± 0.01 0.94 ± 0.003 0.68 ± 0.08
Table 2. SVM classification accuracy evaluated for manual and automated segmenta-tion as well as DBS or common morphological features sets for a leave-one-patient-outevaluation. Accuracy was calculated for 23 different testing sets. The p-values reportedtest the hypothesis that the underlying distributions are statistically dissimilar. In bothcases the null hypothesis, the distribution are statistically similar, was accepted
Morphological Feature Segmentation Accuracy- Annotated Regions P-Value
CommonManual 79.47 ± 4.71%
0.989Automated 81.30 ± 10.14%
DBSManual 82.89 ± 3.97%
0.9596Automated 82.50 ± 9.10%
10 patient studies. The mean and standard deviation values in Table 1 show thatour HNCut based GAC scheme is able to segment the lumen regions accurately.
5.2 DBS Feature Evaluation
Table 2 shows that for both morphological feature types, the source of the glandboundaries (manual or automated) did not affect the SVM’s ability to classifyglands. For both features sets, p-values are not statistically significant (p < 0.05),so we accept the null hypothesis that the classifier accuracy using features derivedfrom the manual and automated segmentation are similar. DBS yields higherclassifier accuracy compared to traditional morphological features, although thisdifference is not statistically significant.
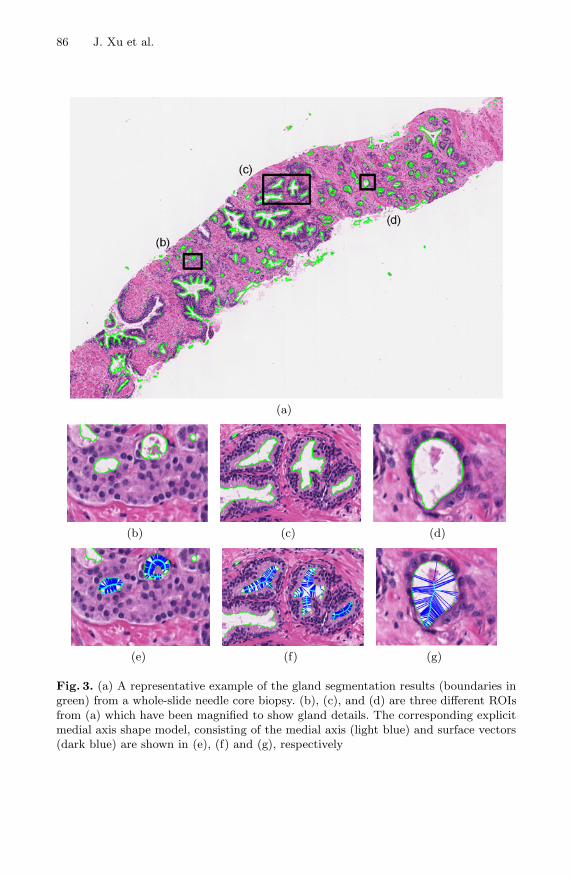
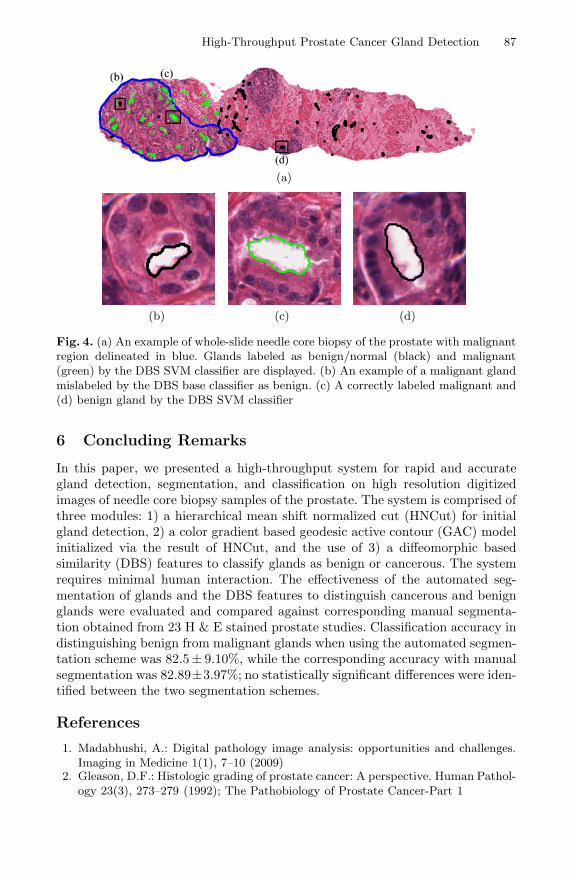
Qualitative results are illustrated in Figure 3 (a). Three regions have beenshown in Figures 3 (b), (c) and (d), respectively. From the magnified regions,one can see that the lumen regions have been correctly segmented. The corre-sponding explicit medial axis shape models of segmented glands, consisting ofpixels belonging to the medial axis (light blue) and surface vectors (dark blue),are shown in Figures 3 (e), (f) and (g), respectively. Figure 4 illustrates theclassification results obtained from module 3. In Figure 4(a), the region anno-tated by the blue line is the malignant portion of the slide as determined by theexpert pathologist. Gland boundaries are displayed for glands labeled benign(black) and malignant (green). From Figure 4(a), we can see that most of thesegmented glands are correctly classified, with most of the errors occurring atthe borders.
86 J. Xu et al.
(a)
(b) (c) (d)
(e) (f) (g)
Fig. 3. (a) A representative example of the gland segmentation results (boundaries ingreen) from a whole-slide needle core biopsy. (b), (c), and (d) are three different ROIsfrom (a) which have been magnified to show gland details. The corresponding explicitmedial axis shape model, consisting of the medial axis (light blue) and surface vectors(dark blue) are shown in (e), (f) and (g), respectively
High-Throughput Prostate Cancer Gland Detection 87
(a)
(b) (c) (d)
Fig. 4. (a) An example of whole-slide needle core biopsy of the prostate with malignantregion delineated in blue. Glands labeled as benign/normal (black) and malignant(green) by the DBS SVM classifier are displayed. (b) An example of a malignant glandmislabeled by the DBS base classifier as benign. (c) A correctly labeled malignant and(d) benign gland by the DBS SVM classifier
6 Concluding Remarks
In this paper, we presented a high-throughput system for rapid and accurategland detection, segmentation, and classification on high resolution digitizedimages of needle core biopsy samples of the prostate. The system is comprised ofthree modules: 1) a hierarchical mean shift normalized cut (HNCut) for initialgland detection, 2) a color gradient based geodesic active contour (GAC) modelinitialized via the result of HNCut, and the use of 3) a diffeomorphic basedsimilarity (DBS) features to classify glands as benign or cancerous. The systemrequires minimal human interaction. The effectiveness of the automated seg-mentation of glands and the DBS features to distinguish cancerous and benignglands were evaluated and compared against corresponding manual segmenta-tion obtained from 23 H & E stained prostate studies. Classification accuracy indistinguishing benign from malignant glands when using the automated segmen-tation scheme was 82.5± 9.10%, while the corresponding accuracy with manualsegmentation was 82.89±3.97%; no statistically significant differences were iden-tified between the two segmentation schemes.
References
1. Madabhushi, A.: Digital pathology image analysis: opportunities and challenges.Imaging in Medicine 1(1), 7–10 (2009)
2. Gleason, D.F.: Histologic grading of prostate cancer: A perspective. Human Pathol-ogy 23(3), 273–279 (1992); The Pathobiology of Prostate Cancer-Part 1
88 J. Xu et al.
3. Doyle, S., Feldman, M., Tomaszewski, J., Madabhushi, A.: A boosted bayesianmulti-resolution classifier for prostate cancer detection from digitized needle biop-sies. IEEE Transactions on Biomedical Engineering (in Press)
4. Monaco, J.P., Tomaszewski, J.E., Feldman, M.D., Hagemann, I., Moradi, M.,Mousavi, P., Boag, A., Davidson, C., Abolmaesumi, P., Madabhushi, A.: High-throughput detection of prostate cancer in histological sections using probabilisticpairwise markov models. Medical Image Analysis 14, 617–629 (2010)
5. Farjam, R., Soltanian-Zadeh, H., Jafari-Khouzani, K., Zoroofi, R.: An image anal-ysis approach for automatic malignancy determination of prostate pathologicalimages. Cytometry Part B (Clinical Cytometry) 72(B), 227–240 (2007)
6. Tabesh, A., Teverovskiy, M., Ho-Yuen, P., Kumar, V.P., Verbel, D., Kotsianti, A.,Saidi, O.: Multifeature prostate cancer diagnosis and gleason grading of histologicalimages. IEEE Transactions on Medical Imaging 26(10), 1366–1378 (2007)
7. Sparks, R., Madabhushi, A.: Novel morphometric based classification via diffeo-morphic based shape representation using manifold learning. In: MICCAI 2010(2010) (in press)
8. Paragios, N., Deriche, R.: Geodesic active regions and level set methods for su-pervised texture segmentation. International Journal of Computer Vision 46(3),223–247 (2002)
9. Janowczyk, A., Chandran, S., Singh, R., Sasaroli, D., Coukos, G., Feldman, M.D.,Madabhushi, A.: Hierarchical normalized cuts: Unsupervised segmentation of vas-cular biomarkers from ovarian cancer tissue microarrays. In: Yang, G.-Z., Hawkes,D., Rueckert, D., Noble, A., Taylor, C. (eds.) MICCAI 2009. LNCS, vol. 5761, pp.230–238. Springer, Heidelberg (2009)
10. Caselles, V., Kimmel, R., Sapiro, G.: Geodesic active contours. International Jour-nal of Computer Vision 22(1), 61–79 (1997)
11. Belkin, M., Niyogi, P.: Laplacian eigenmaps for dimensionality reduction and datarepresentation. Neural Computation 15(6), 1373–1396 (2003)
12. Agner, S., Soman, S., Libfeld, E., McDonald, M., Thomas, K., Englander, S., Rosen,M., Chin, D., Nosher, J., Madabhushi, A.: Textural kinetics: A novel dynamiccontrast enhanced (DCE)- MRI feature for breast lesion classification. Journal ofDigital Imaging (in press)
13. Cohen, L.D.: On active contour models and balloons. CVGIP: Image Un-derst. 53(2), 211–218 (1991)
14. Li, C., Xu, C., Gui, C., Fox, M.D.: Level set evolution without re-initialization: Anew variational formulation. In: CVPR, vol. 1, pp. 430–436 (2005)
15. Sapiro, G.: Color snakes. Computer Vision and Image Understanding 68(2), 247–253 (1997)
16. Blum, H.: A transformation for extracting new descriptors of shape. In: Models forthe Perception of Speech and Visual Form, pp. 367–380. MIT Press, Cambridge(1967)
17. Guo, H., Rangarajan, A., Joshi, S.: Diffeomorphic point matching. In: Handbookof Mathematical Models in Computer Vision, pp. 205–219. Springer, US (2005)
18. Cortes, C., Vapnik, V.: Support-vector networks. Machine Learning 20, 273–297(1995)