high-throughput approaches to dissecting mapk signaling pathways
TRANSCRIPT

Methods 40 (2006) 262–271
www.elsevier.com/locate/ymeth
High-throughput approaches to dissecting MAPK signaling pathways
Adam Friedman, Norbert Perrimon ¤
Department of Genetics, Howard Hughes Medical Institute, Harvard Medical School, 77 Avenue Louis Pasteur, Boston, MA 02115, USA
Accepted 13 May 2006
Abstract
With the development of genome-wide RNAi libraries, it is now possible to screen for novel components of mitogen-activated proteinkinase (MAPK) pathways in cell culture. Although genetic dissection in model organisms and biochemical approaches in mammaliancells have been successful in identifying the core signaling cassettes of these pathways, high-throughput assays can yield unbiased, func-tional genomic insight into pathway regulation. We describe general high-throughput approaches to assaying MAPK signaling and thereceptor tyrosine kinase (RTK)/extracellular signal-regulated kinase (ERK) pathway in particular using a phospho-speciWc antibody-based readout of pathway activity. We also provide examples of secondary validation screens and methods for managing large datasetsfor future in vivo functional characterization.© 2006 Elsevier Inc. All rights reserved.
Keywords: High-throughput screen; RNAi; dsRNA; ERK; MAPK; RTK signaling; Data mining; dpERK; Drosophila
1. Introduction
Signaling through receptor tyrosine kinases (RTKs)plays highly conserved roles in metazoans, controlling fatedetermination, diVerentiation, proliferation, survival,migration, and growth [1,2]. Although RTKs activate mul-tiple downstream pathways, one particularly well-studiedand evolutionarily conserved pathway is that of the extra-cellular signal-regulated kinases (ERKs), members of themitogen-activated protein kinase (MAPK) superfamily,which also include the stress-activated protein kinases(SAPKs) such as c-Jun N-terminal kinase (JNK) and p38[3,4]. The broad importance of RTK/ERK signaling ishighlighted by the well-documented pathway dysregulationin human disease, most notably cancer. Mutations in multi-ple RTKs have been implicated in a variety of cancers, suchas the epidermal growth factor receptor family members inbreast and lung cancers [5]. Thirty percent of all solidtumors have mutations in Ras or Raf, including up to 90%of pancreatic adenocarcinomas [6].
* Corresponding author.E-mail address: [email protected] (N. Perrimon).
1046-2023/$ - see front matter © 2006 Elsevier Inc. All rights reserved.doi:10.1016/j.ymeth.2006.05.002
Given the recent success of targeted therapies in cancerdrug discovery [7], there is considerable interest in the dis-covery of novel components of RTK/ERK signaling. Ourcurrent knowledge of RTK/ERK signaling is the synthesisof decades of dissection in model systems such as analysisof the yeast MAPK mating-type response, vulva formationin Caenorhabditis elegans, sensitized genetic screens formorphogenesis defects in Drosophila, and biochemical andcell biology in mammalian tissue culture. Subsequent to thecharacterization of the core signaling cascade culminatingin ERK activation, recent research has focused on the roleof feedback regulation and signaling dynamics in control-ling output [8–12], placing the core cassette within a largernetwork of regulatory proteins.
Faithful recreation of endogenous cell circuits dependson the identiWcation of all components of the pathways.Discovery of novel components of this pathway and thoseof the surrounding regulatory network requires the devel-opment of new technologies, as many genes may not havebeen discovered through traditional genetic techniques dueto pleiotropy of genes with functions in multiple pathways,mutational bias, redundancy, and/or the requirement forvisible phenotypes. We have previously shown thatgenome-wide RNAi screens in cell culture can identify

A. Friedman, N. Perrimon / Methods 40 (2006) 262–271 263
novel members of signaling pathways in an unbiased man-ner [13–15]. Building upon this work, we Wrst outline gen-eral assays for dissection of the RTK/ERK signalingpathway. Second, we describe in detail a phospho-speciWcantibody method we have used to discover novel genes con-trolling ERK activation in a quantitative, loss-of-functionassay (A.F. and N.P., submitted). These methods are gener-ally applicable to other MAPK RNAi screens.
2. General considerations for high-throughput RTK/ERK assay development
Assays for genetic dissection of RTK/ERK signalingdepend on knowledge of the core signaling cassette tomeasure activities of proteins at particular points duringsignal propagation. A summary of potential assays forpathway measurement is presented in Fig. 1. Approachesfor elucidating signaling pathways in general by RNAiscreening in mammalian cells has been recently reviewed[16]. Theoretically, more proximal assays measuringpathway activity near the activated RTK would identifyfewer regulators than more distal assays and may misscomponents of input branches from other receptors.However, distal pathway readouts (e.g., transcriptionalreporters or morphological outputs) may integrate morepathways than is desirable, only some of which may beknown, challenging outcome attribution to the upstreamMAPK pathway. Analysis of signal transduction cas-cades has traditionally relied on the use of transcrip-tional reporters, e.g., [13–15]. Although many eVectors ofRTK/ERK signaling have been identiWed, well-known
transcriptional targets of this pathway include membersof the ETS-domain-containing class of transcription fac-tors [17]. A multimerized ETS-binding site-based tran-scriptional reporter has been successfully used inDrosophila for readout of this pathway [18,19] and maybe a viable HTS RNAi assay. However, transcriptionalreporters that rely on such artiWcial, multimerized motifsmay not faithfully report output in all cell types or mayintegrate additional pathways during transcriptionalactivation; in addition, the quantitative relationshipbetween endogenous pathway activity and output ofthese reporters is unclear. More generally, microarray-based functional genomic analysis, based on responses togain or loss-of-function of speciWc pathway components,can yield downstream eVectors. For RTK/ERK signalingin Drosophila, this approach has been successfullyapplied to measure changes in transcription in vivo inresponse to RasV12 expression in hemocytes [20] andgain- and loss-of-function alleles of RTK/ERK pathwaymembers in the Drosophila ovary [21].
More proximal assays may rely on microscopy (“high-content screening,” HCS) or plate-reader (PR) assays ofspeciWc signaling events. Although PR assays are usuallyfaster than HCS and simplify analysis by reducing pathwayactivity to a single number representing a population aver-age, HCS can capture much more information about apathway [22]. HCS assays can be multiplexed to follow, forexample, both protein localization and abundance, and cancapture many parameters of pathway modulation such ascell-to-cell variability in signal transduction [23]. On theother hand, HCS automated image analysis, feature
Fig. 1. Potential assays for high-throughput analysis of RTK/ERK signaling. We show for reference the canonical RTK/ERK signaling cascade in Dro-sophila, from ligand binding and RTK activation, to ERK phosphorylation (see review by [2]). For most proteins in the cascade, reagents have been devel-oped that can be used in HTS assays in cell culture. Many assays, such as protein phosphorylation, may be assayed by either PR or HCS. In addition,pathway outputs, such as transcriptional activation or phenotypic changes, could be used as screen assays. FRET, Xuorescence resonance energy transfer;HCS, high-content microscopy-based screening; PR, plate-reader.
Grb2Shc RasSos
Raf
MEK
ERK
Csw
Ksr
Cnk
RTK
RasGAP
PTP-ER
nuclear targets cytoplasmic targets
Receptor internalization (HCS)Receptor localization (HCS)
Receptor phosphorylation (HCS/PR)
Ligand binding (HCS/PR)
Adaptor localization (HCS)Adaptor binding (FRET-HCS/PR)
Adaptor phosphorylation (HCS/PR)
Ras activation (FRET-HCS/PR)
Raf localization (HCS)Raf phosphorylation (HCS/PR)
MEK-ERK binding (FRET-HCS/PR)MEK phosphorylation (HCS/PR)
ERK localization (HCS)ERK phosphorylation (HCS/PR)
Transcriptional reporter (PR)Microarray (cDNA or oligonucleotide)
Morphology (HCS)Viability (PR)
Oncogenic behaviors (HCS)

264 A. Friedman, N. Perrimon / Methods 40 (2006) 262–271
extraction, and data storage can be challenging and isundergoing rapid development.
Here, we describe speciWcally an assay based on acti-vation of ERK using phospho-speciWc antibodies. Manyother activation-state-speciWc reagents have been devel-oped, such as antibodies to phosphorylated RTKs them-selves, activating and inhibitory sites on Raf, andphosphorylated MEK. Staining intensity could be ana-lyzed either using a plate-reader, which reports a singleintensity measurement in each well, or HCS, which cap-tures the immunoXuorescence image. More exotic assays,based on Xuorescence resonance energy transfer (FRET)detecting recruitment of adaptor proteins to receptors[24] or Ras activation [25] are also feasible. Other HCSassays such as nuclear–cytoplasmic shuttling of ERK[26], receptor internalization [27], or Ras localization [28]can be combined with phospho-speciWc antibodyreagents to yield multiple variables that may give furtherinsight into the function of the given gene. Finally, down-stream phenotypic outputs of MAPK pathway activationcould also identify novel genes. For example, a previousHCS screen focusing on cell morphology identiWed RTK/ERK signaling components including Ras, Raf, and Ksr[22]; other genes isolated in this screen with similar pat-terns of morphological changes may also be componentsof this pathway. Oncogene-mediated growth arrest ortransformation phenotypes have also been used as assaysin RNAi HTS, uncovering components of MAPKpathways [29,30].
3. A high-throughput assay for RTK/ERK signaling in Drosophila cells
Given the pivotal role of ERKs as RTK eVectors andthe commercial availability of well-characterized anti-bodies directed towards highly conserved, dually phos-phorylated, active ERK1/2 (dpERK), we developed ahigh-throughput assay for analyzing dpERK levels inDrosophila cells (A.F. and N.P., submitted). ERK activa-tion is a common feature of RTK activation for bothmammalian receptors and their Drosophila orthologs. InDrosophila cells, elevation of dpERK following ligandstimulus has been observed following insulin activationof insulin receptor (InR) [31], epidermal growth factor(EGF) ligand Spitz activation of Drosophila EGFR [32],and Pvf ligand activation of the PDGF/VEGF homologreceptor (PVR) [33].
Our assay was adapted from traditional immunohisto-chemical techniques (outlined in Fig. 2). More general pro-cedures for RNAi HTS, particularly using transcriptionalreporters, have been previously published [34]. Advantagesof RNAi HTS for MAPK screening in Drosophila include(1) the broad conservation of the RTK/ERK signaling cas-sette between Drosophila and mammals, (2) the advantagesof gene discovery in Drosophila due to reduced gene redun-dancy, and (3) the ease of genetic manipulation in bothDrosophila cell culture through RNAi technology and
in vivo through mutational and transgenic techniques. Allof the principles we describe can easily be applied to mam-malian RNAi screening platforms.
3.1. Assay optimization
We chose cell number, length of soaking in serum-freemedium, length of incubation, and reagent volumes tomaximize signal:noise and cell viability. Although there isbaseline ERK activation in S2 cells [33], increasing sig-nal:noise by stimulating the pathway improves the dynamic
Fig. 2. Outline of phospho-speciWc antibody HTS. Flowchart for a phos-pho-speciWc antibody-based RNAi screening procedure detecting duallyphosphorylated, active ERK, normalized to its YFP tag, as described inthe text.

A. Friedman, N. Perrimon / Methods 40 (2006) 262–271 265
range and thus the sensitivity to perturbations such as bydsRNAs targeting genes involved in pathway regulation.As S2 cells endogenously express the Drosophila insulinreceptor and can be easily activated by commercially avail-able insulin [31], we used this ligand to stimulate the path-way. As dpERK levels peak at 10 min following insulinstimulation, we measured pathway activity at this timepoint as well as at baseline. Dynamic range and sensitivityof the assay were optimized using dsRNAs targetingknown components of the RTK/ERK pathway such as InRitself, Ras, Raf, PTP-ER, and MEK. In general, thisphospho-speciWc antibody approach led to a dynamicrange of 30–150% normalized dpERK compared to controldsRNAs; this range is much narrower than enzyme-basedtranscriptional reporters but may more faithfully reportendogenous signal intensity.
3.2. Cell seeding
We chose the S2 sub-line S2R+ because it is adherent andthus has less cell loss during plate manipulations. DrosophilaS2R+ cells (4£104) were seeded in 20�L serum-free mediumin black, clear-bottom 384-well plates (Corning) with theDRSC dsRNA collection suspended in 5�L water per welland spun for 1� at 1200 rpm. After 45 min, 20�L of mediumwith 20% serum (2£) was added and the plates spun again.Plates were incubated for four days at 25 °C. We placed theplates in humidiWed secondary containers in humidiWed incu-bators to reduce evaporation, which can lead to “edgeeVects” and diVerential growth by well location.
3.3. Detection
Following incubation, the plates were stimulated byadding 10 �L phosphate-buVered saline (PBS) containinginsulin (Sigma), to a 25 �g/mL Wnal concentration. After10 min, the stimulated and unstimulated cells were Wxed informaldehyde at 4% Wnal concentration in 10 �LPBS + 0.1% Triton (PBST). As primary and secondaryscreening often requires parallel processing of many platesat a time, we manipulated the plates such that they were allstimulated and Wxed in the same order to ensure uniformactivation time. Following a 10 min Wxation, the cells werespun for 1� at 1200 rpm and washed twice with 50–80 �LPBST for a total of at least 30 min of washing. After eachwash step and all subsequent steps the plates were spun for1� at 1200 rpm.
After the second wash step, the cells were incubated in10�L PBST containing 3% bovine serum albumin (BSA) and750 ng/mL dpERK antibody (Cell Signaling Technology). Inorder to reduce the number of manipulations required, weXuorescently conjugated the puriWed mouse monoclonalantibodies using the Alexa Fluor 647 Protein Labeling Kit(Molecular Probes). Following overnight incubation at 4 °C,the cells were again washed twice with 50–80�L PBST andstaining intensity read on a Xuorescent plate-reader (AnalystGT by Molecular Devices) in 30�L PBST.
Many dsRNAs in the DRSC collection reduce cell via-bility [35]. A normalization vector is therefore required toaccount for general eVects on cell number rather than regu-latory changes to the relative phosphorylation status ofERK. The cell line we used for primary screening stablyexpressed Drosophila ERK tagged with YFP; this overex-pression increased signal:noise of the assay in general andprovided a rapid internal normalization for total ERK. Forsecondary screening, however, we used wild-type cells andnormalized with total ERK antibodies. For detection, wemeasured YFP Xuorescence using the following Wlters(Chroma): excitation 500/20 nm, emission 535/30 nm, and a445/520 nm double dichroic. For Alexa 647 detection, weused excitation 615/40 nm, emission 650LP, and the 445/520 nm double dichroic, which contains a harmonic win-dow in the far red range. Excitation time was 100 ms/well.Although the YFP channel of the Wxed cells provides anapproximation of cell number, we also measured the liveYFP channel during stimulation time in order to moreaccurately measure this value before the many plate manip-ulations later, which may alter true eVects on viability.
3.4. Data analysis
Correcting and normalizing the large number of datapoints from HTS is essential to extracting valid, unbiasedgenomic information, and isolating the true regulators [36].Raw Xuorescence values for the Alexa 647/dpERK channeland YFP/ERK normalization channel were background sub-tracted using an average of readings from three blank 384-well plates and the dpERK/ERK ratio was calculated foreach well. Since there is considerable geographic variability inscreening plates due to plate manufacturing defects and/ordiVerential growth of cells, we corrected for this by dividingthe dpERK/ERK ratio by the product of the median of eachwell’s row and column (moving median). To account forplate-to-plate variability, we converted these normalized, cor-rected ratios to “Z-scores,” the plate average subtracted fromthe well value divided by the standard deviation of the plate.DRSC screens are typically performed in duplicate, leading totwo such Z-scores that are averaged. Occasionally assay noiseleads to outliers in one of the two readings. To Wlter these out-liers, we converted the individual Z-scores to their rank withinthe plate, summed the two ranks, and re-selected the top andbottom 1000 wells. These 2000 wells were then re-convertedto the Z-scores and the two replicates averaged. We chose aZ-score cutoV of §1.5, but this is usually chosen by thescreener based on location of the known regulators in the list,the distribution of all amplicons, and the desired number ofregulators for follow-up.
3.5. Interpretation
Like traditional forward genetic screens, RNAi HTS canisolate novel regulators of particular signaling pathways.Genes in a primary screen hit list can be validated in sec-ondary screens, and investigators can follow-up on a few

266 A. Friedman, N. Perrimon / Methods 40 (2006) 262–271
chosen novel regulators with more detailed functional anal-yses. However, unbiased, genome-wide RNAi screens alsoprovide a glimpse into the systems-level regulation of theparticular pathway—how the cell as a whole modulates theprecise level of pathway output and develops robustness toperturbation through loss-of-function. These types of anal-yses are only more recently becoming possible throughstandardization of statistical techniques and availability ofmany genome-scale datasets. We have used the functionalgenomic information from an RTK/ERK signaling screento observe particular patterns in the dataset, usually enrich-ment for particular classes. For example, we compared theprevalence of genes conserved in humans or particular geneontology (GO) functional groups in the original screeningcollection (essentially the Drosophila genome) and in ourWnal primary screen hit list. We determined conservationpatterns from the Homologene [37] and InParanoid [38,39]genome comparisons. Statistical techniques to gauge thesigniWcance of such patterns, such as tests using the hyper-geometric distribution, are common and have been incor-porated into some software packages, e.g., [40].
More broadly, RNAi HTS datasets can be combined, forexample, with functional expression analyses using micro-arrays or high-throughput protein–protein interaction (PPI)maps using statistical techniques to model the signaling regu-latory network on a larger scale. Such models can help placethe individual regulators isolated from a RNAi screen at par-ticular points within the network, uncovering the hierarchicalrelationships between proteins. Combining this data on alarge scale has been successful for Caenorhabditis elegans [41]and Saccharomyces cerevisiae [42] genomic information andwill likely be applied to RNAi HTS in Drosophila and mam-mals once similar datasets are generated.
4. Secondary screening
In most cases, only a s mall number of replicates can beprovided per dsRNA for genome-wide screens due to thelarge number of genes to analyze. In order to validate thatthe isolated genes are indeed true positives and not due toassay noise, secondary screening is required. Secondaryscreening of a smaller number of genes also provides theopportunity to begin functional dissection of each gene byusing diVerent assays or epistasis tests.
4.1. Gene choice
SuperWcially, the genes further screened can be the top200 or so genes isolated. However, it is clear from manyHTS performed thus far that the strongest regulators, inaddition to known components of the pathway, may alsobe components of large molecular complexes such as theproteasome or ribosome. These proteins may play a directrole in modulating pathway activity by interacting with thecore signaling cassette, or their activities (e.g., protein syn-thesis) may be non-speciWcally permissive for signal trans-duction in general. Components of a single complex likely
function similarly in the pathway. Thus using only strengthof primary screen hit as the selection criteria may unneces-sarily further validate and classify genes that all play verysimilar and possibly indirect roles in the pathway.
In our primary screen for RTK/ERK regulators, basedon our Z-score threshold, we eventually chose »1700 genesas “hits.” This is an unreasonable number to attempt sec-ondary validation and we therefore hand-selected »375. Inselecting a secondary validation set, we chose many of thegenes with the strongest eVects on the pathway, but, onlyused representative members of large complexes; for exam-ple, we selected a member of the large and small ribosomalcomplexes, regulatory and catalytic proteasome particles,and a handful of other translational/mRNA processinggenes. We also biased towards genes that were conserved inmammals and annotation categories known to be impor-tant in signal transduction cascades, e.g., kinases and phos-phatases. We resynthesized these cherry picked dsRNAsfrom the DRSC collection, as described [43].
4.2. Reducing false positives
Although little is understood of their exact mechanism,sequence-speciWc oV-target eVects of siRNAs in mamma-lian cells or dsRNAs in Drosophila cells are a known sourceof false positives in RNAi screens. Consequently, any sec-ondary validation of HTS for MAPK pathways likelyshould include an estimation of this rate. A reasonableapproach to this is to synthesize additional, non-overlap-ping dsRNAs targeting the same gene, assuming these dsR-NAs do not have overlapping oV-target eVects (for adiscussion of OTE, see [44]). Tools for designing and syn-thesizing new dsRNAs are available online (e.g., [43]).
4.3. Secondary assay format
Unlike in primary screening, secondary screens providethe opportunity to more robustly determine statistical sig-niWcance of the genes tested by increasing the number ofreplicates and reducing assay noise. For our secondaryscreens, we used 5–7 replicates (250 ng/well of eachdsRNA) per assay and distributed these replicates ran-domly in the 384-well screening plates, along with 14–30controls (a negative control dsRNA such as luciferase).We then ran each assay 2–3 times, providing between 10–21 samples and up to 90 controls per data point. Usingthis data, we calculated the average reduction or elevationin normalized dpERK and p values for each gene. Becauseof the large number of samples and conditions tested (seebelow), these p values are corrected for the multiplehypotheses using the False Discovery Rate often imple-mented in microarray analysis [45,46]. A Bonferroni cor-rection can also be applied but may be too conservativefor secondary screens when such a high number of truepositives are expected. A third approach is to empiricallydetermine the signiWcance threshold based on permuta-tion of the data points.
A. Friedman, N. Perrimon / Methods 40 (2006) 262–271 267
In our speciWc assay, we adjusted our assays to use wild-type cells rather than ERK-YFP-expressing cells. In orderto provide a normalization vector, we used unconjugatedmouse monoclonal dpERK antibodies (1:1000, Cell Signal-ing Technology) and rabbit polyclonal total ERK antibod-ies (1:1000, Cell Signaling Technology) in the 10 �LPBST + 3% BSA incubation reaction at 4 °C overnight.After washing twice in 50–80 �L PBST, we incubated thesecondary screening plates for 1–2 h at room temperaturein 10 �L PBST + 3% BSA and the following secondary anti-bodies: goat anti-rabbit Alexa 488 conjugated (1:1000,Molecular Probes) and goat anti-mouse Alexa 647 conju-gated (1:1000, Molecular Probes), along with DAPI to staincell nuclei (10 �g/mL, Molecular Probes). Following twowashes in PBST (50–80 �L), we read the three Xuorescentchannels on a plate-reader in 30 �L PBST. After everyreagent exchange, we spun the plates for 1� at 1200 rpm.For detection, we again used a 100 ms read time and the fol-lowing Wlter sets: for DAPI detection, excitation 360/40 nm,emission 460/50 nm, and a 400 nm dichroic; for Alexa 488,excitation 485/20 nm, emission 530/25 nm, and a 505 nmdichroic; for Alexa 647 detection, excitation 615/40 nm,emission 650LP, and the 445/520 nm dichroic. Similar back-ground subtraction and median corrections were per-formed and normalized, corrected dpERK/ERK valueswere used for the Wnal analysis. Normalization to DAPIgave similar results.
4.4. Secondary screen assays
Repeating the screening assay can validate the initial pri-mary screening result with greater statistical conWdence.However, because fewer genes and therefore plates are pro-cessed in secondary screens, this format is useful to begin afunctional classiWcation of genes by conducting diVerentassays. For example, in our assay for RTK/ERK regula-tors, we have tested diVerent cell lines and multiple ligandsstimulating diVerent RTKs. Assays measuring otherMAPK cascades could similarly use diVerent cell lines andstimuli, such as diVerent stress sources for p38/JNK, to clas-sify genes as condition-speciWc or non-speciWc.
Moreover, any of the assays we suggested above as a pri-mary screen assay could theoretically be used in secondaryscreens to begin placing genes within the signaling cascadeaccording to function. For example, an ERK transcrip-tional reporter primary screen could be followed up by sec-ondary screens measuring Ras activation, ERKphosphorylation, and ERK nuclear–cytoplasmic shuttlingin a HCS microscopy-based format.
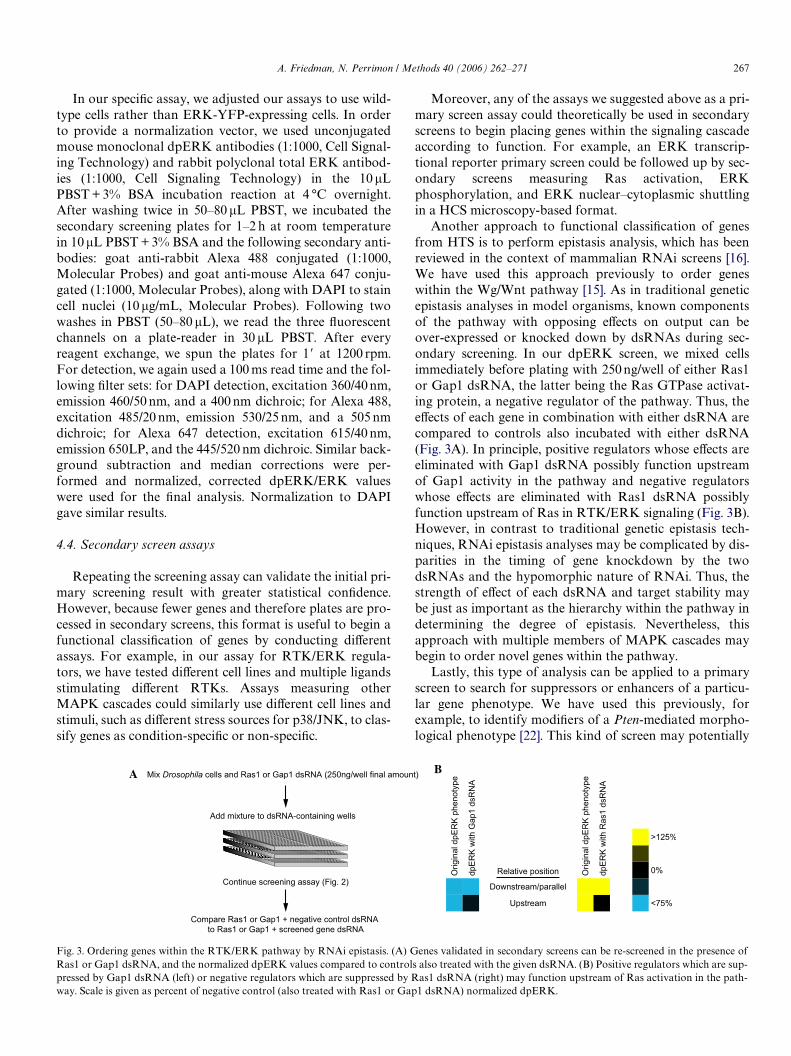
Another approach to functional classiWcation of genesfrom HTS is to perform epistasis analysis, which has beenreviewed in the context of mammalian RNAi screens [16].We have used this approach previously to order geneswithin the Wg/Wnt pathway [15]. As in traditional geneticepistasis analyses in model organisms, known componentsof the pathway with opposing eVects on output can beover-expressed or knocked down by dsRNAs during sec-ondary screening. In our dpERK screen, we mixed cellsimmediately before plating with 250 ng/well of either Ras1or Gap1 dsRNA, the latter being the Ras GTPase activat-ing protein, a negative regulator of the pathway. Thus, theeVects of each gene in combination with either dsRNA arecompared to controls also incubated with either dsRNA(Fig. 3A). In principle, positive regulators whose eVects areeliminated with Gap1 dsRNA possibly function upstreamof Gap1 activity in the pathway and negative regulatorswhose eVects are eliminated with Ras1 dsRNA possiblyfunction upstream of Ras in RTK/ERK signaling (Fig. 3B).However, in contrast to traditional genetic epistasis tech-niques, RNAi epistasis analyses may be complicated by dis-parities in the timing of gene knockdown by the twodsRNAs and the hypomorphic nature of RNAi. Thus, thestrength of eVect of each dsRNA and target stability maybe just as important as the hierarchy within the pathway indetermining the degree of epistasis. Nevertheless, thisapproach with multiple members of MAPK cascades maybegin to order novel genes within the pathway.
Lastly, this type of analysis can be applied to a primaryscreen to search for suppressors or enhancers of a particu-lar gene phenotype. We have used this previously, forexample, to identify modiWers of a Pten-mediated morpho-logical phenotype [22]. This kind of screen may potentially
Fig. 3. Ordering genes within the RTK/ERK pathway by RNAi epistasis. (A) Genes validated in secondary screens can be re-screened in the presence ofRas1 or Gap1 dsRNA, and the normalized dpERK values compared to controls also treated with the given dsRNA. (B) Positive regulators which are sup-pressed by Gap1 dsRNA (left) or negative regulators which are suppressed by Ras1 dsRNA (right) may function upstream of Ras activation in the path-
way. Scale is given as percent of negative control (also treated with Ras1 or Gap1 dsRNA) normalized dpERK.
268 A. Friedman, N. Perrimon / Methods 40 (2006) 262–271
be more sensitive in identifying new components of a givenpathway, analogous to traditional genetic screens in sensi-tized backgrounds originally used to identify componentsof the Ras pathway (e.g., [47]).
5. Data mining techniques for in vivo validation
HT screening, both primary and secondary, is a power-ful approach to identifying and classifying new componentsof signaling pathways. However, the in vivo relevance of thegiven genes can currently only be tested using “low-throughput” traditional approaches in model organisms.For our Drosophila cell-based screens, we tested novel regu-lators in the context of RTK/ERK signaling-dependentdevelopment. Drosophila is a well-characterized systemwith many tools available for genetic dissection of thispathway, as well as other MAPK pathways (e.g., JNK,reviewed in [48]). Genes that validate as physiologically rel-evant are potentially conserved and of greater importancein regulating the RTK/ERK pathway.
Even in secondary screens, hundreds of genes are ana-lyzed, and testing for physiological relevance in vivo canonly feasibly be performed in any depth on a few genes.Choosing which genes to analyze from the hundreds ofvalidated regulators is a signiWcant challenge followingHT screens. While the strongest novel regulators mayseem to be the most likely to test Wrst, we have observed,anecdotally, that these have not necessarily been thestrongest in vivo regulators. Our approach, outlinedbelow, has been to use additional data sources to identifywhich genes are the most likely to regulate the core sig-naling cassette. As we describe above for primary screendata sets, combination of functional genomic and proteo-mic information can be performed in a more systematicand statistically robust manner given the availability ofsuch resources and analytical tools. Our methods arebased on manual curation of public Drosophila dat-abases; similar approaches could be applied to mamma-lian datasets.
5.1. Genetic interactions
Because of the extensive use of Drosophila to studyRTK/ERK signaling, there are many alleles of pathwaycomponents available and a wealth of genetic interactionstested using pathway components. We hypothesized thatnovel regulators isolated from our screen may have director indirect genetic interactions previously tested, givenavailability of known alleles. Using an online geneticinteractions tool [49] that references interactions curatedfrom FlyBase [50], the genetic interactions betweenknown pathway components and all other genes weredownloaded. Next, genetic interactions between regula-tors validated in our secondary screens and all other geneswere collected. By cross-referencing these lists, two sets ofinteractions were generated: (1) previously describeddirect genetic interactions between known components of
the pathway and validated regulators from our screen;and (2) “Transitive” genetic interactions, such as thosewhere a known pathway component and a novel regulatorboth interact with another gene, “Gene X,” implying anpotential indirect genetic interaction between the knownpathway component and the novel regulator. This list ofbinary interactions was formatted and visualized usingthe freely available GraphViz software. These interactionsare shown in Fig. 4A, indicating the position of knownpathway components and screen hits. In general, however,this analysis was not particularly useful: Wrst, only knowngenes with alleles can be examined, excluding all trulyuncharacterized genes. Second, for those genes withalleles, genetic interactions tested tended to be highlybiased towards one or two known pathway componentsfrequently used for such interactions, as evidenced fromthe large hubs in the genetic interaction network. In addi-tion, automatic curations can be contaminated with failed(negative) genetic interactions as well as true interactions,complicating the analysis.
5.2. Protein–protein interactions
Unbiased datasets could provide more useful informa-tion than the biased genetic datasets. At least two large-scale protein–protein interaction (PPI) datasets have beengenerated for the Drosophila proteome [51,52]. Hits isolatedfrom HTS which interact with known components ofMAPK pathways may be bona Wde novel components ofthe cascades and provide testable hypotheses for futurefunctional characterization. As with the genetic interac-tions, we downloaded PPI between known pathway com-ponents and all other proteins using the BiomolecularInteraction Network Database (BIND) [52] and the FlyNetserver [53], which also provides interologs, or predictedinteractions, based on S. cerevisiae and C. elegans screens,which tend to be richer than the Drosophila databases. Wealso downloaded interactions between the regulators vali-dated in our secondary screens and all other proteins usingthese databases. We assembled a RTK/ERK signaling pro-tein interaction network by combining these two lists andmapping interactions between known pathway componentsand novel regulators or between known components and asingle intervening protein, which also interacts with novelregulators. We visualized this network using GraphViz, asbefore (Fig. 4B).
These interactions provided insight into the potentialfunctions of novel regulators. Although large-scale PPImaps contain many false positives, we were able tovalidate some of these interactions by co-immunoprecipi-tation (A. F. and N. P., unpublished). However, thesemaps currently also have a very high false negative rate, asevidenced by the low overlap between the two large-scaledatasets and the lack of interactions between knowncomponents of the pathway extensively validated to bind.As additional interactions are added, converging RNAiand PPI datasets will become more useful for hypothesis

A. Friedman, N. Perrimon / Methods 40 (2006) 262–271 269
generation and identifying regulators from HTS forin vivo follow-up.
5.3. Potential feedback circuits
RTK/ERK signaling is extensively regulated by positiveand negative feedback circuits. Novel regulators that arepotential components of such circuits may play an impor-tant, conserved role in modulating this pathway in vivo. Wehave taken two approaches to identify such genes in a sec-ondary screen list.
Genes that are transcriptionally regulated by pathwayactivation and also score in RNAi screens may becomponents of these feedback loops. Using this principle,we downloaded microarray data from two functionalexpression analyses related to RTK signaling in Drosophila:an analysis of transcriptional changes upon RasV12 expres-sion in hemocytes in vivo [20] and a comprehensive study ofEGFR/Ras signaling components over-expressed ormutated in the Drosophila ovary [21]. Similar datasets maybe available for other MAPK pathways.
Additionally, we have used the ScanSite web-based plat-form [54] to identify hits in our screen that contain ERK con-sensus docking and phosphorylation sites. Genes with thesesites may be direct targets of ERK signaling and, as hits inour screen, components of feedback regulation. Although wehave not validated the results from either of these two datamining approaches thus far, this information provides addi-tional evidence supporting characterization in vivo.
5.4. Other considerations for gene selection
In addition to these data sources, we also considered thestrength of the regulation, the pattern or consistency ofeVect across cell lines and RTK stimuli (with a bias towardsconsistent regulators), evolutionary conservation (biasedtowards those with highly conserved orthologs), and theannotation category (e.g., biased towards kinases and phos-phatases). In addition, novel information sources such asliterature mining tools [55] could also be used for assem-bling additional data for each gene.
In summary, a data mining approach towards a high-throughput gene list could direct future functional andin vivo characterization towards genes with other datasources linking them to the canonical signaling cascade.Other unbiased data sources such as protein–proteininteraction maps and microarray analyses provide themost useful information for this approach. Although wehave begun validating a few genes identiWed through thisprocess in vivo, whether using other data sources can trulyimprove the in vivo validation rate compared to that usingRNAi screen data alone awaits a large-scale validationeVort.
6. Future directions
We have described a high-throughput approach to dis-secting the ERK MAPK cascade using a phospho-speciWcantibody-based RNAi screening platform in Drosophila
Fig. 4. Examples of genetic and protein–protein interaction data mining. Genes validated in a secondary screen for regulators of RTK/ERK signaling werecross-referenced with databases of genetic interactions (A) or protein–protein interactions (B) as described in the text.

270 A. Friedman, N. Perrimon / Methods 40 (2006) 262–271
cells. This approach, which can be extended to many com-ponents of other MAPK cascades, provides a signiWcantstep beyond traditional methods using forward geneticscreens and mammalian cell biology to build the canonicalcore signaling cassette. Combination of this data with otherprimary or secondary screens, enhancer/suppressor analysisby co-RNAi, and curationg by data mining of other sourcesof information on the pathway, should support a systems-level understanding of cellular regulation of this pathway.Similar approaches could be applied to mammalian RNAiscreens of MAPK cascades and gain-of-function studies inDrosophila or mammalian cell culture. Novel regulators ofMAPK cascades isolated from such screens may be attrac-tive targets of drug discovery. Moreover, for existing drugs,combining genome-wide RNAi screens with chemical treat-ment may help identify their target proteins or pathways[56] as has been demonstrated in S. cerevisiae [57–59].
Acknowledgments
We thank L. Kockel for pioneering the phospho-spe-ciWc antibody HTS approach in our laboratory and B.Mathey-Prevot for critical manuscript review. A.F. issupported by a Medical Scientist Training Program(MSTP) grant. N.P. is an investigator of the HowardHughes Medical Institute.
References
[1] J. Schlessinger, Cell 103 (2000) 211–225.[2] I. Rebay, Dev. Biol. 251 (2002) 1–17.[3] G. Pearson, F. Robinson, T. Beers Gibson, B.E. Xu, M. Karandikar,
K. Berman, M.H. Cobb, Endocr. Rev. 22 (2001) 153–183.[4] G.L. Johnson, R. Lapadat, Science 298 (2002) 1911–1912.[5] S. Madhusudan, T.S. Ganesan, Clin. Biochem. 37 (2004) 618–635.[6] R.A. Hilger, M.E. Scheulen, D. Strumberg, Onkologie 25 (2002) 511–
518.[7] M.R. Green, N. Engl. J. Med. 350 (2004) 2191–2193.[8] S. Sasagawa, Y. Ozaki, K. Fujita, S. Kuroda, Nat. Cell Biol. 7 (2005)
365–373.[9] T.G. Smith, D. Sweetman, M. Patterson, S.M. Keyse, A. Munsterberg,
Development 132 (2005) 1305–1314.[10] A.S. Yoo, C. Bais, I. Greenwald, Science 303 (2004) 663–666.[11] M. Iwanami, Y. Hiromi, M. Okabe, Genes Cells 10 (2005) 743–752.[12] W. Xiong, J.E. Ferrell Jr., Nature 426 (2003) 460–465.[13] K. Nybakken, S.A. Vokes, T.Y. Lin, A.P. McMahon, N. Perrimon,
Nat. Genet. 37 (2005) 1323–1332.[14] G.H. Baeg, R. Zhou, N. Perrimon, Genes Dev. 19 (2005) 1861–1870.[15] R. DasGupta, A. Kaykas, R.T. Moon, N. Perrimon, Science 308
(2005) 826–833.[16] J. MoVat, D.M. Sabatini, Nat. Rev. Mol. Cell Biol. 7 (2006) 177–187.[17] S.H. Yang, A.D. Sharrocks, A.J. Whitmarsh, Gene 320 (2003) 3–21.[18] T.L. Tootle, P.S. Lee, I. Rebay, Development 130 (2003) 845–857.[19] E.M. O’Neill, I. Rebay, R. Tjian, G.M. Rubin, Cell 78 (1994) 137–147.[20] H. Asha, I. Nagy, G. Kovacs, D. Stetson, I. Ando, C.R. Dearolf,
Genetics 163 (2003) 203–215.[21] K.C. Jordan, S.D. HatWeld, M. Tworoger, E.J. Ward, K.A. Fischer, S.
Bowers, H. Ruohola-Baker, Dev. Dyn. 232 (2005) 709–724.[22] A. Kiger, B. Baum, S. Jones, M. Jones, A. Coulson, C. Echeverri, N.
Perrimon, J. Biol. 2 (2003) 27.[23] G. Lahav, N. Rosenfeld, A. Sigal, N. Geva-Zatorsky, A.J. Levine,
M.B. Elowitz, U. Alon, Nat. Genet. 36 (2004) 147–150.
[24] A. Sorkin, M. McClure, F. Huang, R. Carter, Curr. Biol. 10 (2000)1395–1398.
[25] N. Mochizuki, S. Yamashita, K. Kurokawa, Y. Ohba, T. Nagai, A.Miyawaki, M. Matsuda, Nature 411 (2001) 1065–1068.
[26] A. Harding, T. Tian, E. Westbury, E. Frische, J.F. Hancock, Curr.Biol. 15 (2005) 869–873.
[27] M.J. Clague, S. Urbe, J. Cell Sci. 114 (2001) 3075–3081.[28] S.R. Hingorani, D.A. Tuveson, Curr. Opin. Genet. Dev. 13 (2003) 6–
13.[29] B. Nicke, J. Bastien, S.J. Khanna, P.H. Warne, V. Cowling, S.J. Cook,
G. Peters, O. Delpuech, A. Schulze, K. Berns, J. Mullenders, R.L. Beij-ersbergen, R. Bernards, T.S. Ganesan, J. Downward, D.C. Hancock,Mol. Cell 20 (2005) 673–685.
[30] T.F. Westbrook, E.S. Martin, M.R. Schlabach, Y. Leng, A.C. Liang, B.Feng, J.J. Zhao, T.M. Roberts, G. Mandel, G.J. Hannon, R.A. Dep-inho, L. Chin, S.J. Elledge, Cell 121 (2005) 837–848.
[31] J.C. Clemens, C.A. Worby, N. Simonson-LeV, M. Muda, T. Maehama,B.A. Hemmings, J.E. Dixon, Proc. Natl. Acad. Sci. USA 97 (2000)6499–6503.
[32] R. Schweitzer, M. Shaharabany, R. Seger, B.Z. Shilo, Genes Dev. 9(1995) 1518–1529.
[33] P. Duchek, K. Somogyi, G. Jekely, S. Beccari, P. Rorth, Cell 107(2001) 17–26.
[34] S. Armknecht, M. Boutros, A. Kiger, K. Nybakken, B. Mathey-Pre-vot, N. Perrimon, Methods Enzymol. 392 (2005) 55–73.
[35] M. Boutros, A.A. Kiger, S. Armknecht, K. Kerr, M. Hild, B. Koch,S.A. Haas, H.F. Consortium, R. Paro, N. Perrimon, Science 303 (2004)832–835.
[36] N. Malo, J.A. Hanley, S. Cerquozzi, J. Pelletier, R. Nadon, Nat. Bio-technol. 24 (2006) 167–175.
[37] HomoloGene, http://www.ncbi.nlm.nih.gov/entrez/query.fcgi?db Dhomologene (2006).
[38] M. Remm, C.E. Storm, E.L. Sonnhammer, J. Mol. Biol. 314 (2001)1041–1052.
[39] InParanoid, http://inparanoid.cgb.ki.se/ (2006).[40] P. Hong, W.H. Wong, BMC Bioinformatics 6 (2005) 20.[41] S. Li, C.M. Armstrong, N. Bertin, H. Ge, S. Milstein, M. Boxem, P.O.
Vidalain, J.D. Han, A. Chesneau, T. Hao, D.S. Goldberg, N. Li, M.Martinez, J.F. Rual, P. Lamesch, L. Xu, M. Tewari, S.L. Wong, L.V.Zhang, G.F. Berriz, L. Jacotot, P. Vaglio, J. Reboul, T. Hirozane-Kis-hikawa, Q. Li, H.W. Gabel, A. Elewa, B. Baumgartner, D.J. Rose, H.Yu, S. Bosak, R. Sequerra, A. Fraser, S.E. Mango, W.M. Saxton, S.Strome, S. Van Den Heuvel, F. Piano, J. Vandenhaute, C. Sardet, M.Gerstein, L. Doucette-Stamm, K.C. Gunsalus, J.W. Harper, M.E.Cusick, F.P. Roth, D.E. Hill, M. Vidal, Science 303 (2004) 540–543.
[42] I. Lee, S.V. Date, A.T. Adai, E.M. Marcotte, Science 306 (2004) 1555–1558.
[43] Drosophila RNAi Screening Center, www.Xyrnai.org (2006).[44] C.J. Echeverri, N. Perrimon, Nat. Rev. Genet. (2006).[45] Y. Benjamini, D. Drai, G. Elmer, N. KafkaW, I. Golani, Behav. Brain
Res. 125 (2001) 279–284.[46] Y. Benjamini, D. Yekutieli, Genetics 171 (2005) 783–790.[47] M.A. Simon, D.D. Bowtell, G.S. Dodson, T.R. Laverty, G.M. Rubin,
Cell 67 (1991) 701–716.[48] L. Kockel, J. Zeitlinger, L.M. Staszewski, M. Mlodzik, D. Bohmann,
Genes Dev. 11 (1997) 1748–1758.[49] I. Flockhart, M. Booker, A. Kiger, M. Boutros, S. Armknecht, N.
Ramadan, K. Richardson, A. Xu, N. Perrimon, B. Mathey-Prevot,Nucleic Acids Res. 34 (2006) D489–D494.
[50] FlyBase, http://www.Xybase.org (2006).[51] L. Giot, J.S. Bader, C. Brouwer, A. Chaudhuri, B. Kuang, Y. Li, Y.L.
Hao, C.E. Ooi, B. Godwin, E. Vitols, G. Vijayadamodar, P. Pochart,H. Machineni, M. Welsh, Y. Kong, B. Zerhusen, R. Malcolm, Z. Var-rone, A. Collis, M. Minto, S. Burgess, L. McDaniel, E. Stimpson, F.Spriggs, J. Williams, K. Neurath, N. Ioime, M. Agee, E. Voss, K. Fur-tak, R. Renzulli, N. Aanensen, S. Carrolla, E. Bickelhaupt, Y. Lazo-vatsky, A. DaSilva, J. Zhong, C.A. Stanyon, R.L. Finley Jr., K.P.White, M. Braverman, T. Jarvie, S. Gold, M. Leach, J. Knight, R.A.

A. Friedman, N. Perrimon / Methods 40 (2006) 262–271 271
Shimkets, M.P. McKenna, J. Chant, J.M. Rothberg, Science 302(2003) 1727–1736.
[52] E. Formstecher, S. Aresta, V. Collura, A. Hamburger, A. Meil, A. Tre-hin, C. Reverdy, V. Betin, S. Maire, C. Brun, B. Jacq, M. Arpin, Y. Bel-laiche, S. Bellusci, P. Benaroch, M. Bornens, R. Chanet, P. Chavrier,O. Delattre, V. Doye, R. Fehon, G. Faye, T. Galli, J.A. Girault, B.Goud, J. de Gunzburg, L. Johannes, M.P. Junier, V. Mirouse, A. Muk-herjee, D. Papadopoulo, F. Perez, A. Plessis, C. Rosse, S. Saule, D.Stoppa-Lyonnet, A. Vincent, M. White, P. Legrain, J. Wojcik, J.Camonis, L. Daviet, Genome Res. 15 (2005) 376–384.
[53] Flynet Server, http://macbeth.clark.jhu.edu/cgi-bin/Xynew.pl (2005).[54] J.C. Obenauer, L.C. Cantley, M.B. YaVe, Nucleic Acids Res. 31 (2003)
3635–3641.
[55] L.J. Jensen, J. Saric, P. Bork, Nat. Rev. Genet. 7 (2006) 119–129.[56] U.S. Eggert, A.A. Kiger, C. Richter, Z.E. Perlman, N. Perrimon, T.J.
Mitchison, C.M. Field, PLoS Biol. 2 (2004) e379.[57] K. Baetz, L. McHardy, K. Gable, T. Tarling, D. Reberioux, J. Bryan,
R.J. Andersen, T. Dunn, P. Hieter, M. Roberge, Proc. Natl. Acad. Sci.USA 101 (2004) 4525–4530.
[58] G. Giaever, P. Flaherty, J. Kumm, M. Proctor, C. Nislow, D.F. Jara-millo, A.M. Chu, M.I. Jordan, A.P. Arkin, R.W. Davis, Proc. Natl.Acad. Sci. USA 101 (2004) 793–798.
[59] P.Y. Lum, C.D. Armour, S.B. Stepaniants, G. Cavet, M.K. Wolf, J.S.Butler, J.C. Hinshaw, P. Garnier, G.D. Prestwich, A. Leonardson, P.Garrett-Engele, C.M. Rush, M. Bard, G. Schimmack, J.W. Phillips,C.J. Roberts, D.D. Shoemaker, Cell 116 (2004) 121–137.