high-tech exit report 2020
TRANSCRIPT

PwC Israel Exit Report 2020
PwC IsraelHigh-Tech Exit Report
2020
1

This time last year, we reflected back on an amazing decade full of achievements for the Israeli tech industry. However, in none of our scenarios or working assumptions did we even imagine what was to come in the first year of the new decade. The COVID pandemic brought wild swings in economic metrics and social sentiment that were unprecedented in recent history and very much unpredictable. This was also a once-in-a-century test of resilience for the local tech market.Although this year had far fewer deals (60 vs. 80 last year), their cumulative value soared to a whopping $15.4 billion, from $9.9 billion in 2019, which was then a record year since the first publication of this report.
As always in our PwC Israel Exit Report, we try this year too to look beyond the headline figures and drill down into the data and give you some insights about the driving forces, to help see the trees from the forest.
A bridge over troubled water
COVID was a stark reminder to all of how much the global economy is fragile and exposed. Lockdowns, restrictions on movement, virtually no international travel and disparate policies among governments worldwide, often intensified this sense of insecurity and lack of confidence throughout this year. We are just now starting to see the first steps towards mass vaccination. However, in the face of all that hardship, global and local tech companies seemed to have natural immunity.
While we were used in recent years to see a diverse mix of multiple verticals seeking to acquire Israeli technology companies, most went to the sidelines in 2020, again leaving the field for tech giants. The testing times underscored the need for deeper and more advanced technologies and solutions, and combined with more seasoned entrepreneurs and management teams, the eventual outcome was impressive by any standard.
Despite the 25% fall in the number of deals, taking a more granular view highlights even further the remarkable ability of the local tech industry to recover, with the number of deals going from 26 in H1 to 34 in H2, including 16 IPOs (vs. only 3 in the preceding half-year).
Another interesting piece of data is the fact that the number of over-$100M deals remained the same as last year, at 24, with an average value per such deal rising from $124 million last year to $257 million in 2020. Yet, the biggest story this year is without a doubt the comeback of tech companies in the IPO market, which is further discussed in the next paragraph.
Exit Report 2020
2
IPOs come to the forefront
The end of 2020 would probably have been different without the surge in the number and value of IPOs by Israeli tech companies in the US and Israel. Not less than 19 IPOs took place this year, up from 13 in 2019, with the share of IPOs in the total value of deals surging to $9.3 billion (or 60% of total deal value), from $2.2 billion in 2019 (or 22% of total deal value). The average value per deal also shot up from $169 million last year to $489 million in 2020, mainly led by Lemonade, JFrog and Nanox in the US, and Ecoppia and Aquarius Engines in Israel.
The resurgence of tech companies in the equity market has several reasons. Low interest rate, a larger monetary base, more government incentives and other capital directed to tech companies, and even a psychological shift in the Israeli capital market that make investors gravitate more towards tech are all plausible factors that may have generated this friendly environment for IPOs and value creation. Clearly, Israeli entrepreneurs did not miss out on that opportunity. The great results that stemmed from all the above probably accelerated processes that in normal times would have taken a far longer period to mature.
What does the future hold?
It is too early to talk about the end of the crisis and many tech companies are actually experiencing challenges, but it may be possible to start, with due caution, hoping COVID might be soon behind us. The impact of the pandemic is likely to linger for quite a few years, and some are here to stay and be a new normal. But whatever turns out, one thing is beyond debate, and it is that technology and its different derivatives are vital and will only be enhanced. On top of that, Israel continues to grow as a fertile breeding ground for vast research and development, supported by a vibrant entrepreneurial culture. Several notable companies have been added to the list of unicorns, like Armis (acquired by Insight) and Checkmarx (acquired by Hellman & Friedman), each for about $1.1 billion. They joined a long list, including IronSource and Monday.com, which we talked about last year following especially strong capital raises. The confluence of the ever-growing need for technological solutions; robust markets that are willing to handsomely price tech companies; eager entrepreneurs looking to build independent, high-value companies all represent an excellent mix for this positive trend going forward. We believe that the revival of the Tel Aviv Stock Exchange, the expected significant IPOs by Israeli companies in the US during 2021, coupled with increased use of SPACs, will continue to drive great performance in the coming year as well. Most of all, this may be a reflection of a new and important developmental phase for the local ecosystem, opening up of alternative financing and liquidity to allow companies stay independent for the longer run.
Yaron WeizenbluthHead of Hi-Tech ClusterPwC Israel

Total exits (M&As and IPOs) in the last decade (million US$)
2011 2012 2013 2014 2015 2016 2017 2018 2019 2020
Total amount ($M) 5,078 5,567 7,643 14,850 10,695 3,531 7,442 4,944 9,917 15,429
Number of deals 63 50 45 70 70 55 70 61 80 60
Average deal size ($M) 81 111 170 212 153 64 106 81 124 257
5,0785,567
7,643
14,850
10,695
3,531
7,442
4,944
9,917
15,429
63 50 45
70 70
55
70
61
80
6081
111
170
212
153
64
106
81
124
257
0
2,000
4,000
6,000
8,000
10,000
12,000
14,000
16,000
18,000
0
50
100
150
200
250
300
3
The value of M&As and listings in 2020 was $15.4 billion, up 55% from $9.9 billion in 2019. This is the highest yearly total value since this report was first published and surpasses the previous record set in 2014 (the year of the Mobileye IPO).
60 deals took place in 2020, down from 80 last year. Average deal size trended up, with an all-time-high average of $257 million per deal, or a 207% increase y/y.
* This report refers only to exits valued more than $10 million.
Two follow-on deals were excluded from this report, as they were already featured in past editions (when those companies first exited through an IPO or an M&A deal). Including them again in this report would have distorted the ability to make year-over-year comparative analysis (see a separate chapter that analyzes this year's activity including those follow-on transactions) .
Follow-on transactions that were excluded from this report are:Forescount (acquired by Advent)Taldor (acquired by One1)
The total value of follow-on transactions that were excluded from this report is $1.6 billion.

PwC Israel 2019אקזיטיםח "דו
#
Overall analysis of follow-on deals
$1.6B
$1.1B
$1.6B
$3.9B
$1.1B
14,674
9,917
4,944
1,67612,978
8,538
202020192018
לרדו
ן יו
ילמ
2018-2020מיזוגים ורכישות (כולל עסקאות המשך)
סך עסקאות בנטרול עסקאות המשך עסקאות המשך
4
15,429
9,917
4,944
1,67612,978
8,538
202020192018
M&As and IPOs in 2019-2020 ($M)(including a follow-on transactions
Total deals Follow-on transactions
The $1-billion mark was crossed by tech companies five times in 2020, including in two massive IPOs:
When follow-on transactions are taken into account, total deal value in 2020 is $17.1 billion. Although lower by 26% relative to 2019 ($22.8 billion), this figure is still higher than that in previous years.

M&As vs. IPOs
5
2016 2017 2018 2019 2020
Total amount ($M) 3,531 5,978 4,056 7,720 6,135
Number of deals 55 59 52 67 41
Average deal size ($M) 64 101 78 115 150
3,531 5,978 4,056 7,720 6,135
5559
52
67
41
64
101
78
115
150
0
20
40
60
80
100
120
140
160
M&A only 2016-2019 ($M)
2016 2017 2018 2019 2020
Total amount ($M) 0 1,463 888 2,197 9,294
Number of deals 2 11 9 13 19
Average deal size ($M) 0 133 99 169 489
01,463
888
2,197
9,294
2 11 9 13 19
13399
169
489
0
100
200
300
400
500
600
0
1,000
2,000
3,000
4,000
5,000
6,000
7,000
8,000
9,000
10,000
IPO only 2016-2019 ($M)
IPOs only in 2016-2020
A record year in terms of IPOs, with not less than 19 in 2020, led by JFrog, Lemonade and Nanox in the US. IPOs on the local stock exchange also gained significant momentum, as nine tech companies did so, led by Ecoppia and Aquarius Engines.
*IPOs by R&D partnerships and SPACs were not included in this report – they will be counted as exits when they invest in target companies.
M&A only in 2016-2020
The total value of M&A deals in 2020 (excluding IPOs) was $6.1 billion, down 21% relative to 2019 ($7.7 billion). However, the average deal size was up, reaching $150 million, compared to $115 million last year.

M&As vs. IPOs
6
M&A, 150 IPO, 489 50
100
150
200
250
300
350
400
450
500
Average deal size ($M)
M&A, 6,135 ,
40%
IPO, 9,294, 60%
Total amount ($M)
M&A, 41 , 68%
IPO, 19,
32%
Number of deals
The average IPO size leaped to $489 million, much higher than last year ($169 million), mainly thanks to the IPOs by JFrog, Lemonade and Nanox in the US and Ecoppia and Aquarius Engines in Israel.
The average size of M&A deals also went up from $115 million in 2019 to $150 million in 2020.

M&As and IPO – Analysis by deal size
40%
20%
30%
3%7%
2020
15%
39%18%
26%
2%
2018
22%
35%13%
25%
4% 1%
2019
7
5 5
8 79
18
2325
30
27
24
28
24
5
17
9
1311 10
12
34
18
8
20
16
2018
2 3
0
31
3 21 20 0 0 1
4
0
5
10
15
20
25
30
35
40
2014 2015 2016 2017 2018 2019 2020
Num
ber
of
deals
<$10M
$10M to $50M
$50M to $100M
$100M to $500M
$500M to $1B
>$1B
6 significant transactions (> $500 million) occurred in 2020 with a total value of $9.4 billion, whereas last year had only 4 such deals with a total value of $3.7 billion. The $10M-$50M range continued to be ahead this year too, accounting for 40% of all transactions.
*The graphs do not include follow-on transactions. Additionally, the threshold for inclusion of transactions in the report was raised from $5 million to $10 million this year, for materiality reasons.

M&As and IPOs – Analysis by sector
8
Life SciencesInternetIT & Enterprise SoftwareCommunicationSemiconductorsCleantechMiscellaneousTechnologies
2020 2,6982,2807,3981,099395770789
2019 1,6961,0494,5242572,2985835
2018 1,6461052,35642755154202
2,6982,280
7,398
1,099
395770789
1,696
1,049
4,524
257
2,298
5835
1,646
105
2,356
42755154202
0
500
1,000
1,500
2,000
2,500
3,000
3,500
4,000
4,500
5,000
5,500
6,000
6,500
7,000
7,500
8,000
The IT & Enterprise Software segment continues to dominate in 2020, having the largest share of deal value ($7.4 billion), growing significantly relative to 2019 and especially thanks to the JFrog IPO. The Internet segment also grew substantially (mainly owing to the Lemonade IPO) and so did Life Sciences. Cleantech exits expanded as well, following the Ecoppia and GenCell IPOs on the local exchange. Semiconductors was significantly down versus 2019, but this was mainly due to the Habana deal last year (acquired by Intel).
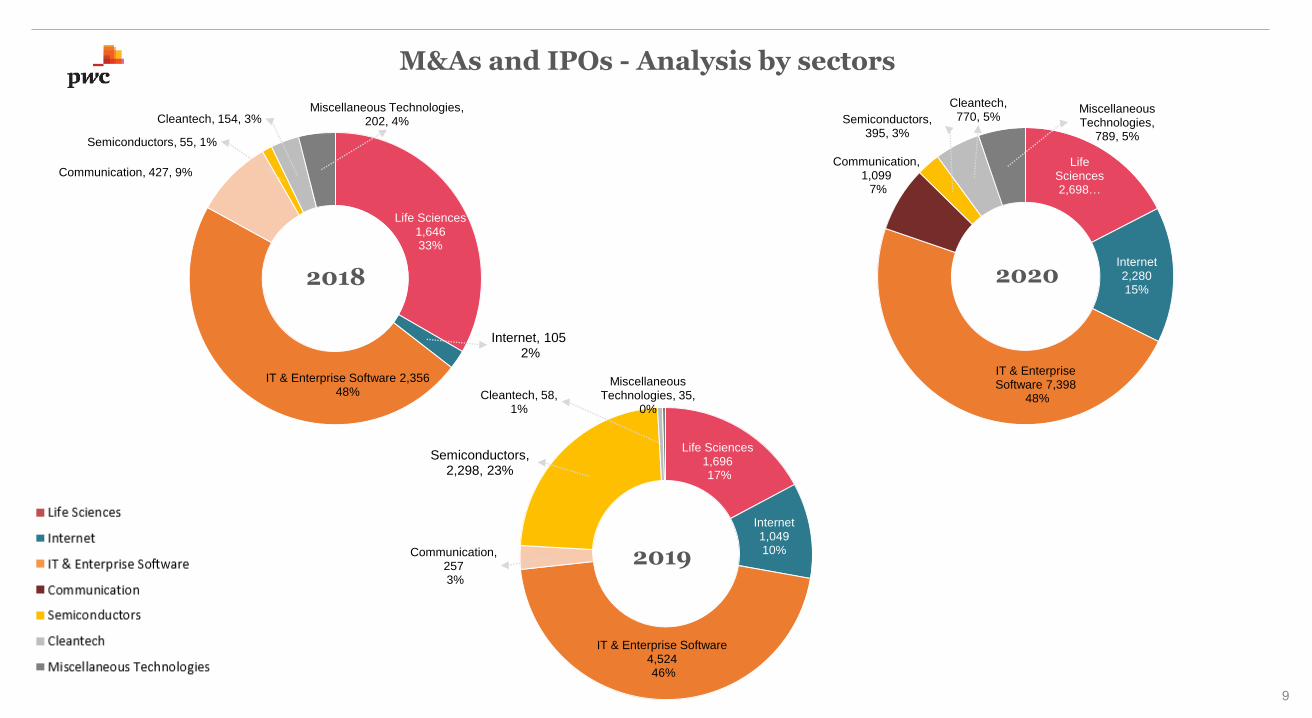
M&As and IPOs - Analysis by sectors
9
Life Sciences1,69617%
Internet1,04910%
IT & Enterprise Software4,52446%
Communication, 2573%
Semiconductors,2,298, 23%
Cleantech, 58, 1%
Miscellaneous Technologies, 35,
0%
Life Sciences2,698…
Internet2,28015%
IT & Enterprise Software 7,398
48%
Communication, 1,099
7%
Semiconductors, 395, 3%
Cleantech, 770, 5%
Miscellaneous Technologies,
789, 5%
2020
Life Sciences1,64633%
Internet, 1052%
IT & Enterprise Software 2,35648%
Communication, 427, 9%
Semiconductors, 55, 1%
Cleantech, 154, 3%Miscellaneous Technologies,
202, 4%
2018
2019

Analysis by segment – Life Science and Internet
Life ScienceInternet
10
2008 2009 2010 2011 2012 2013 2014 2015 2016 2017 2018 2019 2020
Total amount ($M) 235 27 162 1,480 554 2,142 1,841 672 421 1,042 105 1,049 2,280
Number of deals 11 12 5 15 10 9 16 18 15 17 3 12 9
Average deals size ($M) 21 2 32 99 55 238 115 37 28 61 35 87 253
0
50
100
150
200
250
300
0
500
1,000
1,500
2,000
2,500
2008 2009 2010 2011 2012 2013 2014 2015 2016 2017 2018 2019 2020
Total amount ($M) 920 778 18 488 1,276 2,471 2,251 3,574 552 951 1,646 1,696 2,698
Number of deals 11 15 3 6 9 13 14 8 6 8 18 19 14
Average deals size ($M) 84 52 6 81 142 190 161 447 92 119 91 89 193
0
50
100
150
200
250
300
350
400
450
500
0
500
1,000
1,500
2,000
2,500
3,000
3,500
4,000
Life Sciences had $2.7 billion in exits, a figure second only to the record-year 2015. Most of that came from seven IPOs, headed by Nanox. Average deal size in that segment went from $89 million in 2019 to $193 million in 2020.
The Internet segment had a record-breaking year. The $1.6 billion Lemonade IPO on NYSE and the $420 million NeoGames on Nasdaq accounted for much of the $2.3 billion tally in that segment, which was achieved in 9 deals overall.

Analysis by segment – Communications and IT & Enterprise Software
IT & Enterprise SoftwareCommunications
11
2008 2009 2010 2011 2012 2013 2014 2015 2016 2017 2018 2019 2020
Total amount ($M) 1,088 416 347 945 1,7981,3323,0844,5111,6134,0132,3564,5247,398
Number of deals 26 17 6 22 10 11 23 29 19 24 21 38 18
Average deals size ($M) 42 24 58 43 180 121 134 156 85 167 112 119 411
0
50
100
150
200
250
300
350
400
450
0
1,000
2,000
3,000
4,000
5,000
6,000
7,000
8,000
2008
2009
2010
2011
2012
2013
2014
2015
2016
2017
2018
2019
2020
Total amount ($M) 234 338 302 768 1,11 1,20 1,44 267 326 664 427 257 1,09
Number of deals 18 14 4 11 10 8 9 5 10 10 8 5 6
Average deals size ($M) 13 24 75 70 112 151 160 53 33 66 53 51 183
0
20
40
60
80
100
120
140
160
180
200
0
200
400
600
800
1,000
1,200
1,400
1,600
The IT & Enterprise Software segment stayed on top in terms of deal number , at 18, accounting for about 46% of the overall individual deals. The $3.9 billion IPO by JFrog along with the Checkmarx and Armis deals ($1.1 billion each) were major factors in bringing total value for the segment to $7.4 billion. Average deal size ($411 million) is three-times higher than last year.
As in previous years, there were not many deals in this segment. However, like in all other segments, Communications also experienced a strong increase in total value, mainly pushed forward by the acquisition of Moovit by Intel for $900 million.

Analysis by segment – Cleantech and semiconductors
CleantechSemiconductors
12
2008 2009 2010 2011 2012 2013 2014 2015 2016 2017 2018 2019 2020
Total amount ($M) 80 419 341 1,046 812 458 5,690 493 582 54 55 2,298 395
Number of deals 5 6 3 4 8 3 2 4 3 2 1 4 2
Average deals size ($M) 16 70 114 261 101 153 2,845 123 194 27 55 575 198
0
500
1,000
1,500
2,000
2,500
3,000
0
1,000
2,000
3,000
4,000
5,000
6,000
2008 2009 2010 2011 2012 2013 2014 2015 2016 2017 2018 2019 2020
Total amount ($M) 87 593 0 25 10 35 430 763 0 42 154 58 770
Number of deals 6 3 0 1 1 1 5 3 0 1 2 1 3
Average deals size ($M) 15 198 0 25 10 35 86 254 0 42 77 58 257
0
50
100
150
200
250
300
0
100
200
300
400
500
600
700
800
900
Cleantech had, all in all, 3 deals with a total value of $770 million: the local IPOs by Ecoppia and GenCell and the acquisition of ARI by MAT Holding Group. The figure is the highest since we started publishing this report, and slightly above the previous record from 2015.
Semiconductors had only a couple of deals, for a combined sum of only $395 million, or a paltry 3% of all deal value in 2020. The most notable deal here is the acquisition of Optimal Plus by National Instruments.

M&As and IPOs – Buyers by geography
Number of DealsValue ($M)
13
13 , 0% 60 , 0%593 , 4%
2,382 , 16%
12,381 , 80%
AUS Canada EUR Israel US
1 24
2033
AUS Canada EUR Israel US
Israel as a venue for local tech exits has gained ground relative to previous years. Nine IPOs on the Tel Aviv Stock Exchange raised $1.6 billion. The portion of deals from regions other than the US or Israel (i.e. Europe, Asia, Canada and Australia) has greatly declined.

Top 10 Deals
$800M
IT & Enterprise Software
$900M
$420M$420M$450M $382M
Miscellaneous Technologies
$1.1B$1.1B
Life Sciences
$3.9B
IT & Enterprise Software
$1.6B
Internet IT & Enterprise Software Communications
IT & Enterprise Software Internet Life Sciences
IPO
IPO IPO IPO IPO
IPO
14

PwC Israel Exit Report 2020
©2020 Kesselman & Kesselman. All rights reserved.In this document, “PwC Israel” refers to Kesselman & Kesselman, which is a member firm of PricewaterhouseCoopers InternationalLimited, each member firm of which is a separate legal entity. Please see www.pwc.com/structure for further details.This document does not constitute professional advice. It does not take into account any objectives, financial situation or needs of any recipient. Any recipient should not actupon the information contained in this publication without obtaining specific professional advice. No representation or warranty (express or implied) is given as to the accuracyor completeness of the information contained in this publication, and, to the extent permitted by law, Kesselman & Kesselman, and any other member firm of PwC, its members,employees and agents do not accept or assume any liability, responsibility or duty of care for any consequences of you or anyone else acting, or refraining to act, in reliance on theinformation contained in this publication or for any decision based on it, or for any direct and/or indirect and/or other damage caused as a result of using the publication and/orthe information contained in it.
Notes to the report:
▪ The report covers both asset acquisition transactions and merger and acquisition deals (i.e. share acquisition) of Israeli companies or companies withsignificant affiliation to Israel. An exit is defined as closing of a share acquisition deal, asset acquisition deal or activity by a target company for cash orshares of the buyer. An exit is also an initial public offering (IPO) on any stock exchange. Public offering values in this report are based on the value of thelisted company at the opening of the trading session.
▪ The above information excludes follow-on deals by companies that have already been included in our reports in the past (acquisition or IPO).▪ There may be significant differences between this report and the PwC Israel M&As Report. This report does not account for figures that are covered by the
M&A report, such as overseas acquisitions by Israeli companies, non-tech deals, transactions of less than $10 million, and deals that have been signed butmay not be closed.
▪ Research data was taken from media publications and Reuters Thomson databases and are updated through December 20,2020.
Yaron WeizenbluthHead of Hi-Tech Cluster
T:+972-3-7954930M:+972-54-6300504 E:[email protected]
Itamar BrodHi-Tech Business Development
T:+972-3-747673839M:+972-54-5531597 E:[email protected]
Amos AvnerHead of Hi-Tech Business Development
T:+972-3-7953887M:+972-51-2060185E: Amos.Avner@pwc@com
15
For any questions: