high-resolution mapping of glacier surface features… · high resolution mapping of glacier...
TRANSCRIPT
25
AbstrAct: D. Fugazza, a.SeneSe, R.S. azzoni, C. SmiRaglia, m. CeR-nuSChi, D. SeveRi & g. a. Diolaiuti. High resolution mapping of glacier surface features. The UAV survey of the Forni Glacier (Stelvio National Park, Italy) (IT ISSN 0391-9838, 2015).
Fast, reliable and accurate methods for glacier mapping are neces-sary for understanding glacier dynamics and evolution and assessing their response to climate change. Conventional semi-automatic approaches are based on medium-resolution satellite images, but their use can cause significant loss of accuracy when analyzing small glaciers, which are pre-dominant in the Alps. In this paper, we present a semi-automatic seg-mentation approach based on very high-resolution visible RGB images acquired from a UAV (Unmanned Aerial Vehicle) survey of the Forni Glacier, in the Italian Alps, using an off-the-shelf digital camera. The method has the ability to map large-scale morphological features, i.e. bare ice and medial moraines, with better accuracy than methods relying on medium-resolution satellite imagery, with only slight misclassification at the margins. By using segmentation, we also mapped small-scale mor-phologies not discernible on satellite images, including epiglacial lakes and snow patches, in a semi-automatic way. On a small portion of the eastern ablation tongue, featuring homogeneous illumination conditions, we also investigated in finer detail the occurrence of fine and sparse de-bris and tested a texture filter technique for mapping crevasses, which showed promising results. Our analyses confirm that the glacier is un-
dergoing intense dynamic processes, including darkening of the ablation tongue and increased surface instability, and show the potential of UAVs to revolutionize glaciological studies. We suggest that by using a combi-nation of different payloads, mapping of glacier features via UAVs could reach high levels of accuracy and speed, making them useful tools for glacier inventories and geomorphological maps.
Key woRDS: High resolution mapping, Remote sensing, UAV (Unmanned Aerial Vehicle), Alpine glaciers, Forni Glacier, Italy.
riAssunto: D. Fugazza, A. SeneSe, R.S. azzoni, C. SmiRaglia, M. CeR-nuSChi, D. SeveRi & G. A. Diolaiuti. Cartografia ad alta risoluzione della superficie glaciale e delle sue forme. Il rilievo tramite drone del Ghiacciaio dei Forni (Parco Nazionale dello Stelvio, Italia). (IT ISSN 0391-9838, 2015).
La cartografia delle superfici glaciali richiede l’utilizzo di metodi ve-loci, precisi e affidabili, per meglio comprendere le dinamiche glaciali, i processi evolutivi e la risposta dei ghiacciai ai cambiamenti climatici. L’ uso di approcci semi-automatici tradizionali, basato su immagini satelli-tari alle medie risoluzioni, può causare notevoli perdite di precisione nell’ analisi di corpi glaciali di piccole dimensioni, che costituiscono la maggior parte dei glacialismo alpino. In questo studio, presentiamo un nuovo ap-proccio semi-automatico basato sulla segmentazione di immagini ad altis-sima risoluzione acquisite tramite fotocamera digitale durante un rilievo del Ghiacciaio dei Forni (Parco Nazionale dello Stelvio, Italia), effettuato con un drone (Aeromobile a Pilotaggio Remoto). Con questo metodo è stato possibile cartografare forme a grande scala, ovvero ghiaccio esposto e morene mediane, con maggiore precisione rispetto ai metodi basati su immagini satellitari a media risoluzione, nonostante alcuni trascurabili errori di classificazione ai margini del ghiacciaio. L’uso della segmentazio-ne ha permesso anche la cartografia semi-automatica di forme a piccola scala, non visibili da immagini satellitari, inclusi laghi epiglaciali e nevai. Su una porzione ridotta della lingua d’ablazione orientale, caratterizzata da condizioni di illuminazione uniforme nelle immagini, abbiamo inoltre indagato con maggiore dettaglio la presenza di detrito fine e sparso e sperimentato un filtro d’immagine basato sulle texture per cartografare i crepacci, con risultati molto incoraggianti. Le analisi forniscono una con-ferma degli intensi processi dinamici a cui è sottoposto il ghiacciaio, come la sempre maggiore presenza di detrito sulla lingua d’ablazione e un in-cremento di instabilità superficiale, e dimostrano le potenzialità dei droni per innovare gli studi glaciologici. Attraverso la combinazione di diversi
Geogr. Fis. Dinam. Quat. DOI 10.4461/GFDQ.2015.38.0338 (2015), 25-33, 4 figg., 2 tab.
DaviDe FUGAzzA(*), antonella SeNeSe(*), RobeRto SeRgio AzzONI(*), ClauDio SMIRAGLIA(*), maSSimo CeRNUSCHI(**),
DaviDe SeVeRI(**) & guglielmina aDele DIOLAIUTI(*)
HIGH-RESOLUTION MAPPING OF GLACIER SURFACE FEATURES. THE UAV SURVEY OF THE FORNI GLACIER
(STELVIO NATIONAL PARK, ITALY)
————————(*) Dipartimento di Scienze della Terra, Università degli Studi di Milano.(**) Agricola 2000 S.c.p.A., Milano. (*) corresponding authors: [email protected], guglielmina.
[email protected] research was performed under the umbrella of an agreement be-
tween the Università degli Studi di Milano and Sanpellegrino SpA brand Le-vissima. Moreover the Agricola 2000 S.c.p.A supported this study taking part with their UAV to the field investigations and also participating to the Lab analysis. The authors kindly acknowledge the Stelvio National Park manag-ers and staff for their help and support. This work was also performed in the framework of the PRIN project 2010/2011 (2010AYKTAB_006), local leader C. Smiraglia. The results of this research also represent a contribution to the development of the updated guidelines of the New Italian Geomor-phological Map under the umbrella of the AIGEO working group devoted to this issue.
26
sensori, la cartografia delle superfici glaciali tramite droni potrebbe in futuro raggiungere elevati livelli di precisione e rapidità, risultando così uno strumento utile per i catasti glaciali e la cartografia geomorfologica.
teRmini Chiave: Cartografia ad alta risoluzione, Telerilevamento, Drone - APR (Aeromobile a Pilotaggio Remoto), Ghiacciai alpini, Ghiacciaio dei Forni, Italia.
INTRODUCTION
Retreat of glaciers worldwide since the Little Ice Age is one of the clearest clues of climate change. In the Alps, gla-cier shrinkage has been particularly severe since the 1980s and if the trend continues, many Alpine glaciers could dis-appear during the 21st century, with a serious impact on the energy and water supply (eeA, 2012). During its active phase, glacier recession is also followed by geomorphologi-cal changes such as an increase in supraglacial debris cover and formation of epiglacial lakes (Diolaiuti & Smiraglia, 2010). Debris cover affects ice albedo and plays an impor-tant role in the glacier energy balance (Oerlemans & alii, 2009), while ice-contact lakes can increase ice ablation via calving processes (Benn & alii, 2012).
Fast and reliable methods for glacier mapping are nec-essary to study the evolution of glaciers and assess their response to climate change. For this purpose, several semi-automatic approaches employing medium-resolution satel-lite imagery such as ASTeR and Landsat (15-30 m of pixel resolution) have been developed, using a combination of optical, thermal and/or morphometric data (for a review see Shukla & alii, 2010). Accuracy of medium-resolution methods, however, decreases when analyzing changes in smaller glaciers (Paul & alii, 2013). This precludes map-ping of small-scale geomorphological features, including crevasses, snow patches and small epiglacial lakes, and of fine and sparse debris, which is widespread on most gla-ciers and likewise has an impact on the albedo (Azzoni & alii, 2014).
In theory, images with higher resolution could provide a more detailed discrimination of supraglacial features. High-resolution satellite imagery however is available at a high cost to the end users, and so far it has mainly been employed as a means of validating lower resolution meth-ods, substituting fieldwork. In glacier inventories, ortho-mosaics from aerial surveys are also employed for map-ping glacier boundaries via manual delineation, as in the recently developed Swiss Glacier inventory (Fischer & alii, 2014). However, this process is slow and further informa-tion is usually needed to identify glacier margins on highly debris-covered glaciers. A semi-automatic approach, de-veloped by Knoll & Kerschner (2009) for the Tyrol Inven-tory, was based on Airborne Laser Scanning (ALS) surveys, but whenever it was applied over debris-covered glaciers manual correction was required. ALS surveys are also ex-pensive, and this limits their application on a global scale.
More recently, unmanned aerial vehicles (UAV) have been introduced to the field of glacier studies. These enable low cost on-demand inspection of relatively wide areas of interest, with the ability to carry different types of payload (e.g. a digital camera, near-infrared or thermal sensor) and to survey an area with a better resolution than commer-cial satellites. UAV-derived orthomosaics have been used to analyze specific features such as cryoconite holes and granules, in combination with ground photography (Hod-son & alii, 2007), supraglacial lakes (Immerzeel & alii, 2014), and crevasses, mapped by Ryan & alii (2015) via manual delineation. In this paper, we assess the feasibility of mapping several glacier features (i.e. snow, buried- and bare-ice, epiglacial lakes, and crevasses) of the Forni Gla-cier from a UAV high-resolution orthomosaic produced using an off-the-shelf digital camera with a semi-automatic approach. In addition, we investigate in more detail these glacier features analyzing a smaller area along the Forni Glacier ablation tongue featuring homogeneous illumina-tion conditions. Finally, to evaluate the advantages pro-vided by this methodology we compare it to classification based on medium-resolution data acquired by Landsat 8.
STUDY AReA
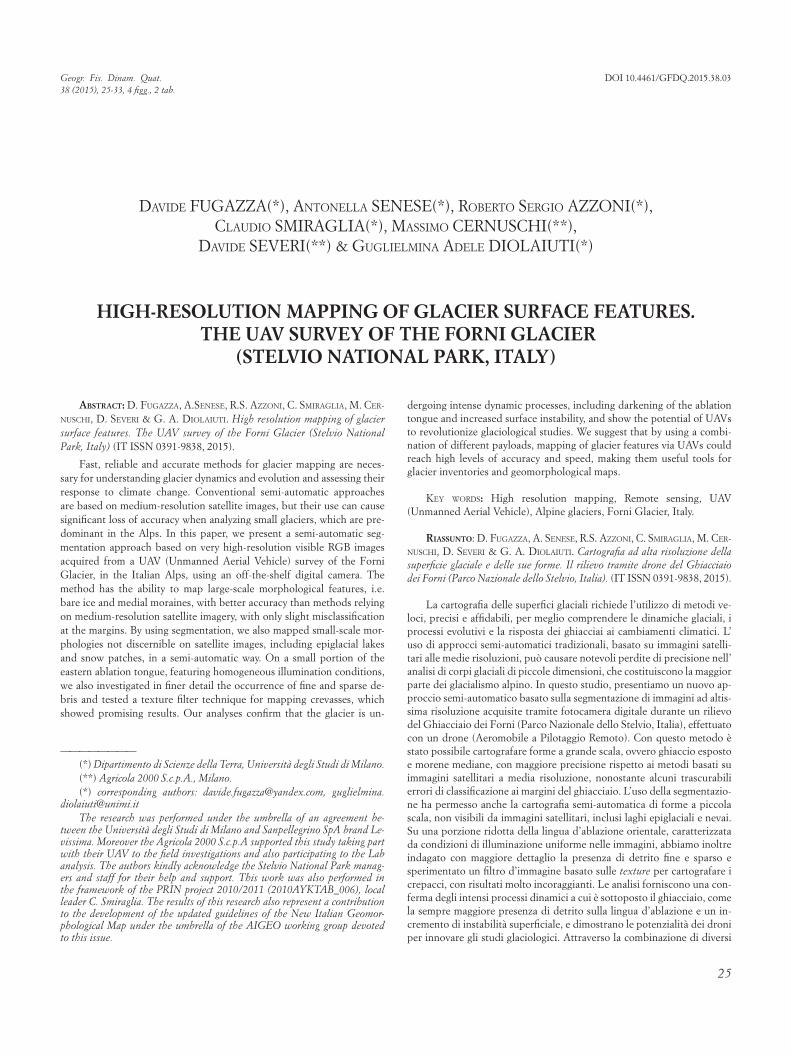
The Forni Glacier is part of the Ortles-Cevedale group, Lombardy Alps, and of the Stelvio National Park (fig. 1). It is the widest Italian valley glacier (ca. 11.36 km2; D’Agata & alii, 2014), with a northerly aspect and an elevation range between 3670 and 2600 m. It is a composite glacier, formed by three ice streams joining into a tongue that extends for ca. 2 km. Two medial moraines are located on the tongue, origi-nating from rock outcrops located below the snow line and nourished by supra-glacial debris derived from valley rocks (Smiraglia, 1989). The ablation tongue is mostly debris-free, although a recent increase in fine and sparse debris deposi-tion due to the ongoing glacier shrinkage has been reported (Diolaiuti & Smiraglia, 2010; Senese & alii, 2012a). Other considerable morphological changes have lately taken place, including the appearance of debris cones, epiglacial ponds and the formation of neo-moraines. Owing to this diverse range of glacial features, together with the ease of access and the long series of volume, area and length dataset, the Forni Glacier is an ideal ground for evaluating our methodology.
MeTHODS
The methodology proposed in this study aims at clas-sifying both large-scale and small-scale features on the sur-face of the Forni Glacier ablation tongue. We consider as large-scale features the main glacier body and the medial moraines. These are much larger than a Landsat pixel, and
27
thus clearly identifiable on both Landsat and UAV images. It follows that small-scale features are those smaller than a Landsat pixel, and we considered among them debris-rich ice, snow-patches, epiglacial lakes and crevasses.
Data SouRCeS
The UAV used in this study was SwingletCAM, built by SenseFly. SwingletCAM is a fixed-wing UAV, with a weight of only 0.5 kg including GPS receiver, altimeter, wind speed sensor and a Canon IXUS 125 HS digital camera, automati-cally triggered for picture acquisition. The camera has a 16 megapixel CMOS sensor, capable of 4608 by 3456 pixels resolution with a 4:3 aspect ratio, and captures JPeG for-mat images in the visible light range. The device operates in full-auto mode, including self-adjustment of aperture, ISO and shutter speed for the given light condition. In our sur-vey, this resulted in ISO values in the range 100–500 and shutter speeds of 1/125–1/640 s with an aperture of f/2.7.
The survey took place on 28 August 2014, at approxi-mately 8:20 AM. This time was chosen i) to avoid direct illumination of the glacier surface and thus a higher solar reflection which could saturate the pictures, and ii) to mini-mize wind speed that can cause staggering of the UAV and consequently produce blurred pictures (katabatic winds can occur along the Forni ablation tongue, see Senese & alii, 2012b; Gambelli & alii, 2014). Launch and landing loca-tion was set beside Rosole Lake at 2493 m a.s.l. (the yellow
dot in fig. 1b), close to Branca refuge and on the way to the glacier, and the maximum flight height was 250 m. The UAV was flown on the central and eastern parts of the tongue (see fig. 1b), for a total flight time of less than 30 minutes. The upper basins were not investigated due to UAV flight limitations, including battery life and line-of-sight operation and considering that reaching higher elevation in a short time could have entailed significant radial distortion in the acquired pictures. Images were processed via bundle block adjustment, including geometric correction to compensate for radial distortion in Menci APS software, to produce an orthomosaic with a ground resolution of 0.15 m x 0.15 m and a DeM with slightly lower resolution of 0.60 m x 0.60 m, to avoid gaps and artefacts generated by the stereo-matching process. In the absence of ground control points (GCPs), we estimated positional accuracy of the orthophoto and DeM to be about 3 m in the x and y coordinates, fol-lowing Küng & alii (2011).
To compare this high-resolution image with a medi-um-resolution one, we obtained from USGS a Landsat 8 OLI/TIRS image acquired on 14/9/2014. This was the closest date of a Landsat overpass where the ablation tongue was free from cloud cover and shadows. We con-verted DN values (i.e. quantized and calibrated scaled Digital Numbers) to units of reflectance and brightness temperature using the coefficients found in the scene metadata (USGS, 2013). Geometric accuracy of the Landsat 8 OLI/TIRS sensors is estimated to be approxi-mately 12 m (Storey & alii, 2014).
Fig. 1 - (A) Map of the Forni Glacier from aerial orthophoto acquired in 2003: medial moraines and supraglacial debris are indicated in light-grey (1), and nunataks are highlighted in dark-grey (2). (B) Area imaged by the UAV in August 2014: the yellow dot displays the UAV launch and landing location, while
the area investigated in higher detail is shown as the red box.
28
extRaCtion oF glaCieR laRge-SCale FeatuReS baSeD on the uav oRthomoSaiC
Concerning separability in the spectral domain, the me-dial moraines clearly stand out due to overall low values in all RGB channels of the orthomosaic, an effect that is also visible to a lesser degree on the Landsat image, caused by absorption of light at visible wavelengths by meltwater. Other features however are less distinct. In particular, the proglacial stream (i.e. Frodolfo stream) has similar spectral features as the glacier itself, with colors varying from a clear blue to al-most saturation of the sensor, depending on water turbidity. Fine and sparse debris located on the tongue and on snow patches is also spectrally similar to proglacial debris.
In order to isolate large-scale features from the rest of the scene, we adopted a segmentation approach, identify-ing connected segments where pixels show similar spectral characteristics. This is in fact the recommended approach when dealing with high-resolution imagery, where objects to be identified are much larger than pixel size (Blaschke, 2010). We adopted different strategies to discriminate be-tween features: the blue channel is ideal for identifying the glacier surface and the red channel for identifying the me-dial moraines.
extRaCtion oF glaCieR laRge-SCale FeatuReS baSeD on lanDSat imageRy
To classify large-scale features of the Forni Glacier ab-lation tongue based on the Landsat OLI/TIRS image ac-quired on 14 September 2014, we employed optical and thermal information. First, we performed a supervised classification of the whole glacier surface using a stack of Landsat 8 bands, excluding band 1 (used for coastal aerosol detection), 8 (panchromatic) and 9 (cirrus detection), and including both thermal bands (i.e. 10 and 11). In particular, we defined training areas for the classification process by using the UAV image as a reference. Finally, by means of the shapefile created from the UAV orthomosaic, we selected the glacier ablation tongue on the Landsat image. This al-lowed a direct comparison between the two different ap-proaches for identifying large-scale features: segmentation based on the UAV orthomosaic and supervised classification based on the Landsat OLI/TIRS image.
ClaSSiFiCation oF the glaCieR Small-SCale FeatuReS baSeD on the uav oRthomoSaiC
Once the glacier area was identified via segmentation, we attempted to further classify the different glacier surfaces byi) segmentation (i.e. snow, exposed ice, debris-rich ice, mo-
raines, and water pond)
ii) partitioning into different classes based on RGB values (i.e. debris free or debris covered ice)
iii) Gabor filters (i.e. crevasses).
Concerning segmentation, given the differences in water color, no single spectral threshold could be used to extract all of the lakes, so they were identified separately. The larg-est lakes exhibit a greenish hue, likely due to a combination of suspended sediments and populations of algae that have colonized them (see also Boggero & alii, 2014). One exam-ple is the epiglacial pond on the eastern tongue, extracted based on the condition green > red > blue, whereas smaller ponds were identified via the blue channel. Snow patches featured different RGB values depending on clean and dirty snow, thus requiring two separate segmentation steps to identify them.
Concerning the second approach, an underlying as-sumption was made that over a glacier surface lower RGB values represent an increasing amount of fine debris deposi-tion (in case of snow or ice), a wet surface (whenever water ponds occur) or shadows. In fact, localized shadow effects produced by surface topography at the time of image ac-quisition made it difficult to apply a single classification ap-proach over the whole glacier surface. Over large areas, two pixels can feature a similar RGB value even if characterized by different surface conditions, e.g. one can be shadowed and the other one can feature a debris-covered surface. We therefore generated a hillshading map using the DeM ex-tracted from the UAV survey (see section on Data Sources) and solar zenith and azimuth angles (Dozier & Frew, 1990) in order to identify an area with relatively uniform shad-owing. We found that a limited part of the eastern tongue revealed these characteristics (red box in fig. 1b). Finally, we performed a decision-tree classification based on spectral properties in the RGB domain. This approach was chosen over supervised classification given the difficulty inherent in selecting homogeneous training areas.
Concerning crevasses, previous work on automatic de-lineation by Johannesson & alii (2011) was based on the lo-cal curvature of the ice surface obtained from a LiDAR dig-ital elevation model (DeM). The photogrammetric DeM obtained from the UAV survey however was of insufficient resolution to test this method. In fact, most crevasses on the surface of the Forni Glacier that can be located on the or-thomosaic are less than 0.50 m wide, whereas the resolution of the DeM was slightly coarser (0.60 x 0.60 m). Besides, photogrammetric DeM generation is known to be prone to errors in crevassed areas (Barrand & alii, 2009). The or-thomosaic was therefore chosen to perform the detection. Our approach was based on Gabor filters, an image analysis technique for texture extraction that emphasizes linear fea-tures in an image, with tunable parameters of orientation, wavelength and frequency. In a glaciological context, Gabor filters have been used by Brenning & alii (2012) to map rock
29
glacier flow patterns. Here we used a bank of filters with 8 different orientations and wavelengths between 5 and 10 m. The analysis was performed using OpenCV implementa-tion of Gabor filters, written in the Python programming language.
ReSULTS AND DISCUSSION
iDentiFiCation oF laRge-SCale FeatuReS
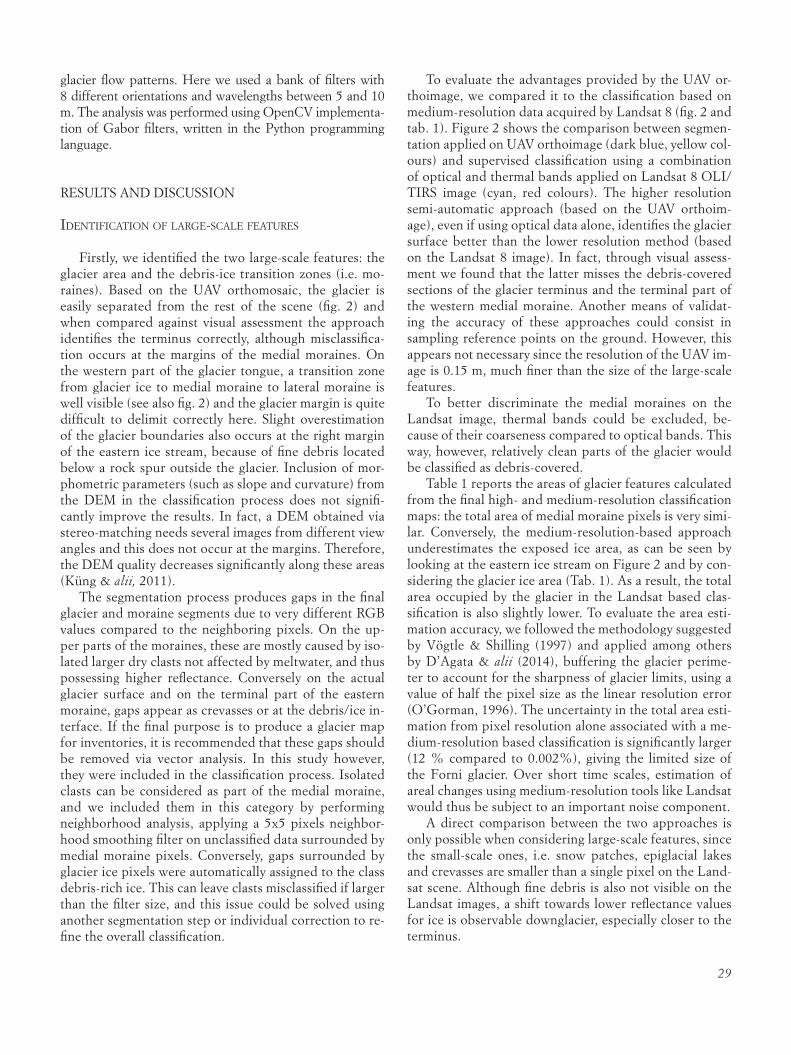
Firstly, we identified the two large-scale features: the glacier area and the debris-ice transition zones (i.e. mo-raines). Based on the UAV orthomosaic, the glacier is easily separated from the rest of the scene (fig. 2) and when compared against visual assessment the approach identifies the terminus correctly, although misclassifica-tion occurs at the margins of the medial moraines. On the western part of the glacier tongue, a transition zone from glacier ice to medial moraine to lateral moraine is well visible (see also fig. 2) and the glacier margin is quite difficult to delimit correctly here. Slight overestimation of the glacier boundaries also occurs at the right margin of the eastern ice stream, because of fine debris located below a rock spur outside the glacier. Inclusion of mor-phometric parameters (such as slope and curvature) from the DeM in the classification process does not signifi-cantly improve the results. In fact, a DeM obtained via stereo-matching needs several images from different view angles and this does not occur at the margins. Therefore, the DeM quality decreases significantly along these areas (Küng & alii, 2011).
The segmentation process produces gaps in the final glacier and moraine segments due to very different RGB values compared to the neighboring pixels. On the up-per parts of the moraines, these are mostly caused by iso-lated larger dry clasts not affected by meltwater, and thus possessing higher reflectance. Conversely on the actual glacier surface and on the terminal part of the eastern moraine, gaps appear as crevasses or at the debris/ice in-terface. If the final purpose is to produce a glacier map for inventories, it is recommended that these gaps should be removed via vector analysis. In this study however, they were included in the classification process. Isolated clasts can be considered as part of the medial moraine, and we included them in this category by performing neighborhood analysis, applying a 5x5 pixels neighbor-hood smoothing filter on unclassified data surrounded by medial moraine pixels. Conversely, gaps surrounded by glacier ice pixels were automatically assigned to the class debris-rich ice. This can leave clasts misclassified if larger than the filter size, and this issue could be solved using another segmentation step or individual correction to re-fine the overall classification.
To evaluate the advantages provided by the UAV or-thoimage, we compared it to the classification based on medium-resolution data acquired by Landsat 8 (fig. 2 and tab. 1). Figure 2 shows the comparison between segmen-tation applied on UAV orthoimage (dark blue, yellow col-ours) and supervised classification using a combination of optical and thermal bands applied on Landsat 8 OLI/TIRS image (cyan, red colours). The higher resolution semi-automatic approach (based on the UAV orthoim-age), even if using optical data alone, identifies the glacier surface better than the lower resolution method (based on the Landsat 8 image). In fact, through visual assess-ment we found that the latter misses the debris-covered sections of the glacier terminus and the terminal part of the western medial moraine. Another means of validat-ing the accuracy of these approaches could consist in sampling reference points on the ground. However, this appears not necessary since the resolution of the UAV im-age is 0.15 m, much finer than the size of the large-scale features.
To better discriminate the medial moraines on the Landsat image, thermal bands could be excluded, be-cause of their coarseness compared to optical bands. This way, however, relatively clean parts of the glacier would be classified as debris-covered.
Table 1 reports the areas of glacier features calculated from the final high- and medium-resolution classification maps: the total area of medial moraine pixels is very simi-lar. Conversely, the medium-resolution-based approach underestimates the exposed ice area, as can be seen by looking at the eastern ice stream on Figure 2 and by con-sidering the glacier ice area (Tab. 1). As a result, the total area occupied by the glacier in the Landsat based clas-sification is also slightly lower. To evaluate the area esti-mation accuracy, we followed the methodology suggested by Vögtle & Shilling (1997) and applied among others by D’Agata & alii (2014), buffering the glacier perime-ter to account for the sharpness of glacier limits, using a value of half the pixel size as the linear resolution error (O’Gorman, 1996). The uncertainty in the total area esti-mation from pixel resolution alone associated with a me-dium-resolution based classification is significantly larger (12 % compared to 0.002%), giving the limited size of the Forni glacier. Over short time scales, estimation of areal changes using medium-resolution tools like Landsat would thus be subject to an important noise component.
A direct comparison between the two approaches is only possible when considering large-scale features, since the small-scale ones, i.e. snow patches, epiglacial lakes and crevasses are smaller than a single pixel on the Land-sat scene. Although fine debris is also not visible on the Landsat images, a shift towards lower reflectance values for ice is observable downglacier, especially closer to the terminus.
30
iDentiFiCation oF Small-SCale FeatuReS baSeD on the uav oRthomoSaiC
Visual inspection of the entire UAV orthomosaic reveals many features not discernible on lower resolution images, namely: i) snow patches prominent on the upper parts (rela-
tive to the study area) of the eastern and central ice streams; ii) fine and sparse debris patches and debris bands located on the glacier surface; iii) the debris cone on the central part of the tongue; iv) the supraglacial pond located on the east-ern part of the tongue and the small lake at the take-off site (Rosole Lake), as well as smaller scattered proglacial and ep-iglacial ponds; and v) longitudinal and transverse crevasses widespread on the glacier surface, especially the eastern ice stream.
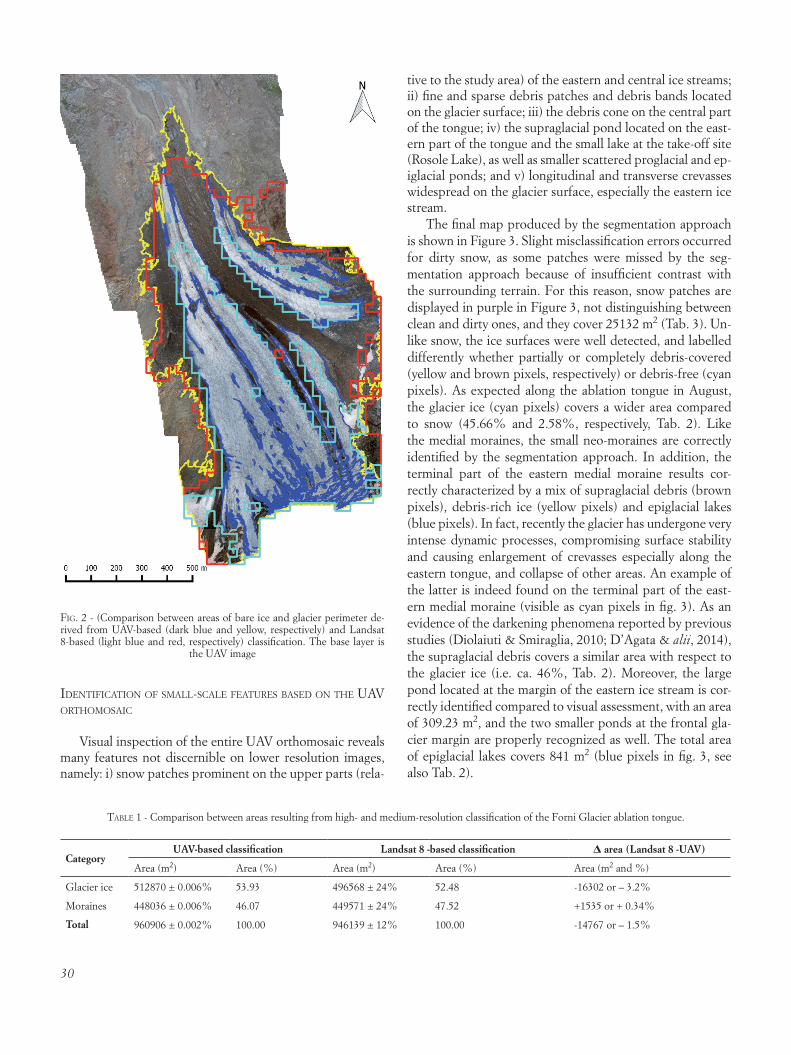
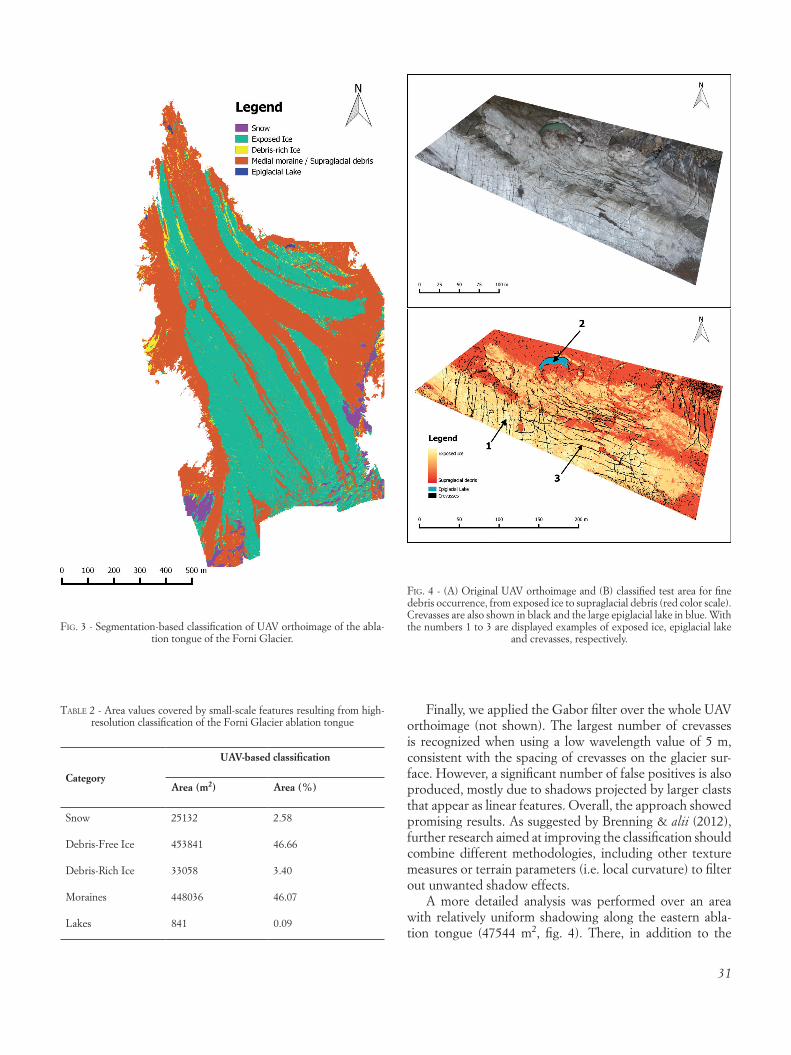
The final map produced by the segmentation approach is shown in Figure 3. Slight misclassification errors occurred for dirty snow, as some patches were missed by the seg-mentation approach because of insufficient contrast with the surrounding terrain. For this reason, snow patches are displayed in purple in Figure 3, not distinguishing between clean and dirty ones, and they cover 25132 m2 (Tab. 3). Un-like snow, the ice surfaces were well detected, and labelled differently whether partially or completely debris-covered (yellow and brown pixels, respectively) or debris-free (cyan pixels). As expected along the ablation tongue in August, the glacier ice (cyan pixels) covers a wider area compared to snow (45.66% and 2.58%, respectively, Tab. 2). Like the medial moraines, the small neo-moraines are correctly identified by the segmentation approach. In addition, the terminal part of the eastern medial moraine results cor-rectly characterized by a mix of supraglacial debris (brown pixels), debris-rich ice (yellow pixels) and epiglacial lakes (blue pixels). In fact, recently the glacier has undergone very intense dynamic processes, compromising surface stability and causing enlargement of crevasses especially along the eastern tongue, and collapse of other areas. An example of the latter is indeed found on the terminal part of the east-ern medial moraine (visible as cyan pixels in fig. 3). As an evidence of the darkening phenomena reported by previous studies (Diolaiuti & Smiraglia, 2010; D’Agata & alii, 2014), the supraglacial debris covers a similar area with respect to the glacier ice (i.e. ca. 46%, Tab. 2). Moreover, the large pond located at the margin of the eastern ice stream is cor-rectly identified compared to visual assessment, with an area of 309.23 m2, and the two smaller ponds at the frontal gla-cier margin are properly recognized as well. The total area of epiglacial lakes covers 841 m2 (blue pixels in fig. 3, see also Tab. 2).
Fig. 2 - (Comparison between areas of bare ice and glacier perimeter de-rived from UAV-based (dark blue and yellow, respectively) and Landsat 8-based (light blue and red, respectively) classification. The base layer is
the UAV image
CategoryUAV-based classification Landsat 8 -based classification Δ area (Landsat 8 -UAV)
Area (m2) Area (%) Area (m2) Area (%) Area (m2 and %)
Glacier ice 512870 ± 0.006% 53.93 496568 ± 24% 52.48 -16302 or – 3.2%
Moraines 448036 ± 0.006% 46.07 449571 ± 24% 47.52 +1535 or + 0.34%
Total 960906 ± 0.002% 100.00 946139 ± 12% 100.00 -14767 or – 1.5%
table 1 - Comparison between areas resulting from high- and medium-resolution classification of the Forni Glacier ablation tongue.
31
Finally, we applied the Gabor filter over the whole UAV orthoimage (not shown). The largest number of crevasses is recognized when using a low wavelength value of 5 m, consistent with the spacing of crevasses on the glacier sur-face. However, a significant number of false positives is also produced, mostly due to shadows projected by larger clasts that appear as linear features. Overall, the approach showed promising results. As suggested by Brenning & alii (2012), further research aimed at improving the classification should combine different methodologies, including other texture measures or terrain parameters (i.e. local curvature) to filter out unwanted shadow effects.
A more detailed analysis was performed over an area with relatively uniform shadowing along the eastern abla-tion tongue (47544 m2, fig. 4). There, in addition to the
Fig. 3 - Segmentation-based classification of UAV orthoimage of the abla-tion tongue of the Forni Glacier.
Fig. 4 - (A) Original UAV orthoimage and (B) classified test area for fine debris occurrence, from exposed ice to supraglacial debris (red color scale). Crevasses are also shown in black and the large epiglacial lake in blue. With the numbers 1 to 3 are displayed examples of exposed ice, epiglacial lake
and crevasses, respectively.
Category
UAV-based classification
Area (m2) Area (%)
Snow 25132 2.58
Debris-Free Ice 453841 46.66
Debris-Rich Ice 33058 3.40
Moraines 448036 46.07
Lakes 841 0.09
table 2 - Area values covered by small-scale features resulting from high-resolution classification of the Forni Glacier ablation tongue
32
delineation of water ponds and crevasses, fine debris cover is more deeply analyzed. In this area, debris supply comes mostly from macrogelivation and rock degradation proc-esses (Azzoni & alii, 2014) and a transition from supragla-cial debris (i.e. buried-ice) to exposed ice (i.e. bare-ice) is well discerned away from the margin towards the center (lower part of both the images in fig. 4). Here, the dark-ening phenomena are even more evident compared to the picture showing the entire tongue (fig. 3): the bare-ice pixels are 7.49% of the total excluding water pond and crevasses. The area is also heavily crevassed and here application of the Gabor filter is particularly successful (black pixels in fig. 4). This is a consequence of uniform illumination restricting the range of RGB values, although some sections are still missed because of lack of contrast. As expected the water pond is also well identified. The analysis shown in Figure 4 is a fur-ther proof of the intensity of the recent glacier dynamics. In fact, in spite of crevasses covering only 2.79% of the to-tal investigated area, the surface appears very fragmented due to their wide spatial distribution. In addition, the water pond was likely created by a significant collapse.
CONCLUSIONS
The methodology presented here shows that it is pos-sible to provide high-resolution mapping of a glacier using a semi-automatic approach based on uncalibrated RGB data, obtained with a low cost on-demand UAV survey, with an accuracy comparable or higher than when using medium-resolution satellite data. Large-scale features (i.e. exposed glacier surface and medial moraines) could be easily identi-fied using this approach, with only slight misclassification at the margins of the medial moraines. This suggests that for the purpose of generating glacier inventories a segmenta-tion step based on high-resolution orthoimagery (from UAV or conventional aerial surveys) could speed up delineation of glacier boundaries especially on debris free glaciers. An-other significant advantage of a high-resolution approach is the decrease in uncertainty related to pixel size, poten-tially enabling estimation of areal changes over short peri-ods. Classification of debris-covered glaciers with different lithology and morphology of debris cover remains to be tested, although the capability of UAVs to carry different payloads means that different data sets, including near in-frared, thermal and morphometric data could be used to improve accuracy of the results. The inclusion of these data sets could also lead to faster algorithms. In fact, compared with coarser resolution approaches, the methodology we proposed requires considerable user input for threshold se-lection and manual checking of the segments.
An important improvement over medium-resolution based classification is the ability to map smaller geomorpho-logical features, including snow coverage, epiglacial lakes
and crevasses. For the latter, a new approach was presented here based on Gabor filters, which showed promising re-sults. Continuous mapping of these features can inform the local communities, as these features can represent a hazard, and give important clues as to the evolution of the glacier and the magnitude of the stresses acting upon the surface.
Our findings represent a further proof of the general darkening phenomena occurring at the Alpine debris-free glaciers (Oerlemans & alii, 2009; Diolaiuti & Smiraglia, 2010) and in particular at the Forni Glacier tongue (D’Agata & alii, 2014). Indeed, we found that the bare-ice surfaces cover a similar area compared to the buried-ice ones. In addition, the intensity of recent glacier dynamics and the resulting surface instability is evident in the mapped mor-phologies such as crevasses (2.79% of the total area investi-gated in detail) and water ponds.
UAV-based remote sensing is still explorative, and at present there is a lack of standard procedures for correct calibration of the data, when they are used to estimate phys-ical quantities (e.g. reflectance) rather than for qualitative assessment such as mapping. As an example, in our research we found the shadowing effect of local topography and ge-ometry of the illumination to be important factors in driving the final RGB values of the orthomosaic. This prevented fur-ther classification of fine debris glacier-wide, and although these issues have been tackled for spaceborne sensors, the algorithms will have to be adapted for the platform shift.
Another critical issue of UAV-based remote sensing, also noted by Whitehead & alii (2013), is that limitations im-posed by battery life and line-of-sight operation currently restrict flight time, so that for instance an entire survey of the Forni Glacier would have required multiple flights. Howev-er, this is the largest valley glacier in the Italian Alps, where instead smaller glaciers are predominant. Since small gla-ciers are more likely to be inaccurately classified when using lower resolution data and have been shown to react strongly to climate change (e.g. D’Agata & alii, 2014; Diolaiuti & alii, 2012), the introduction and improvement of low-cost mapping methods can make an important contribution to Alpine glaciological and geomorphological studies.
ReFeReNCeS
azzoni R.S., SeneSe a., zeRboni a., maugeRi m., SmiRaglia C. & Di-olaiuti g. (2014) - A novel integrated method to describe dust and fine supraglacial debris and their effects on ice albedo: the case study of Forni Glacier, Italian Alps. The Cryosphere Discuss, 8, 3171-3206
baRRanD n.e., muRRay t., JameS t.D., baRR S.l. & millS J.P. (2009) - Op-timizing photogrammetric DEMs for glacier volume change assessment using laser-scanning derived ground-control points. Journal of Glaciol-ogy, 55, 106-116
benn D.i., bolCh t., hanDS K., gulley J., luCKman a., niCholSon l.i., QuinCey D., thomPSon S., toumi R. & wiSeman S. (2012) - Response of debris-covered glaciers in the Mount Everest region to recent warm-
33
ing, and implications for outburst flood hazards. earth Science Reviews, 114,156-174
blaSChKe t. (2010) - Object-based image analysis for remote sensing. ISPRS Journal of Photogrammetry and Remote Sensing, 65, 2-16
boggeRo a., RogoRa m., muSazzi S., zauPa S., lami a., SaleRno F., guzzella l., gambelli S., guyennon n., viviano g., thaKuRi S. & taRtaRi g. (2013) - Un Mondo D’acqua In Alta Quota. Le acque del Parco Nazionale dello Stelvio, un laboratorio a cielo aperto per lo studio dei cambiamenti climatici. ed. Associazione Comitato ev-K2-CNR, 91 pp.
bRenning a., long S. & Fieguth P. (2012) - Detecting rock glacier flow structures using Gabor filters and IKONOS imagery. Remote Sensing of environment, 125, 227-237
D’agata C., boCChiola D., maRagno D., SmiRaglia C. & Diolaiuti g. (2014) - Glacier shrinkage driven by climate change during half a cen-tury (1954–2007) in the Ortles-Cevedale group (Stelvio National Park, Lombardy, Italian Alps). Theory of Applied Climatology, 116, 169-190
Diolaiuti g., boCChiola D., D’agata C., & SmiRaglia C. (2012) - Evidence of climate change impact upon glaciers’ recession within the Italian alps: the case of Lombardy glaciers. Theoretical and Applied Climatology, 109, 429-445
Diolaiuti g. & SmiRaglia C. (2010) - Changing glaciers in a changing cli-mate: how vanishing geomorphosites have been driving deep changes in mountain landscapes and environments. Géomorphologie : relief, proc-essus, environnement, 2, 131-152
DozieR J. & FRew J. (1990) - Rapid Calculation of Terrain Parameters For Radiation Modeling From Digital Elevation Data. Ieee Transactions on Geoscience and Remote Sensing, 28, 963-969
eeA (euRoPean enviRonment agenCy) (2012) - Climate change, impacts and vulnerability in Europe 2012. http://www.eea.europa.eu/publica-tions/climate-impacts-and-vulnerability-2012/at_download/file
FiSCheR m., huSS m., baRboux C. & hoelzle m. (2014) - The new Swiss Glacier Inventory SGI2010: relevance of using high-resolution source data in areas dominated by very small glaciers. Arctic, Antarctic and Alpine Research, 46, 933–945
gambelli S., SeneSe a., D’agata C., SmiRaglia C. & Diolaiuti g. (2014) – Distribution of the surface Energy budget: preliminary anlysis on the incoming solar radiation. The case study of the Forni Glacier (Italy). Geografia Fisice e Dinamica Quaternaria, 37, 15-22.
hoDSon a., aneSio a.m., ng F., watSon R., QuiRK J., iRvine-Fynn t., Dye a., ClaRK C., mCCloy P., KohleR J. & SattleR b. (2007) - A glacier respires: Quantifying the distribution and respiration CO2 flux of cryoco-nite across an entire Arctic supraglacial ecosystem. Journal of Geophysi-cal research, 112, 1-9
immeRzeel w.w., KRaaiJenbRinK P.D.a., Shea m. J., ShReStha a.b., Pel-liCCiotti F., bieRKenS m.F.P. & De Jong S.m. (2014) - High-resolution monitoring of Himalayan glacier dynamics using unmanned aerial vehi-cles. Remote Sensing, 150, 93-103
JohanneSSon t., bJoRnSSon h., PalSSon F., SiguRDSSon o. & ÞoRSteinS-Son Þ. (2011) - LiDAR mapping of the Snæfellsjökull ice cap, western Iceland. Jokull, 61, 19-32
Knoll C. & KeRSChneR h. (2009) - A glacier inventory for South Tyrol, Ita-ly, based on airborne laser-scanner data. Annals of Glaciology, 50, 46-52
Küng o., StReCha C., beyeleR a., zuFFeRey J.C., FloReano D., Fua P. & geRvaix F. (2011) - The Accuracy Of Automatic Photogrammetric Techniques On Ultra-Light Uav Imagery. 38, International Archives of the Photogrammetry, Remote Sensing and Spatial Information Sci-ences, Conference on Unmanned Aerial Vehicle in Geomatics, zurich, Switzerland
oeRlemanS J., gieSen R.h. & van Den bRoeKe m.R. (2009) - Retreating alpine glaciers: increased melt rates due to accumulation of dust (Vadret da Morteratsch, Switzerland). Journal of Glaciology, 55, 729-736
o’goRman l. (1996) - Subpixel precision of straight-edged shapes for regis-tration and measurement. Ieee Transactions on Pattern Analysis and Machine Intelligence, 18, 746-751
Paul F., baRRanD n.e., baumann S., beRthieR e., bolCh t., CaSey K., FRey h., JoShi S.P., Konovalov v., le bRiS n., molg n., noSenKo g., nuth C., PoPe a., RaCoviteanu a., RaStneR P., RauP b., SChaRReR K., SteFFen S. & winSvolD S. (2013) - On the accuracy of glacier outlines derived from remote-sensing data. Annals of Glaciology, 54, 171-182
Ryan J.C., hubbaRD a.l., box J.e., toDD J., ChRiStoFFeRSen P., CaRR J.R., holt t.o. & SnooKe n. (2015) - UAV photogrammetry and structure from motion to assess calving dynamics at Store Glacier, a large outlet draining the Greenland ice sheet. The Cryosphere, 9, 1-11
SeneSe a., Diolaiuti g., mihalCea C. & SmiRaglia C. (2012a) – Energy and mass balance of Forni Glacier (Stelvio National Park, Italian Alps) from a 4-year meteorological data record. Arctic, Antarctic, and Alpine Research, 44, 122-134
SeneSe a., Diolaiuti g., veRza g.P. & SmiRaglia C. (2012b) – Surface energy budget and melt amount for the years 2009 and 2010 at the Forni Glacier (Italian Alps, Lombardy). Geografia Fisica e Dinamica Quater-naria, 35, 69-77
ShuKla a., aRoRa m.K. & guPta R. P. (2010) - Synergistic approach for mapping debris-covered glaciers using optical–thermal remote sensing data with inputs from geomorphometric parameters. Remote Sensing of environment, 114, 1378-1387
SmiRaglia C. (1989) - The Medial moraines of Ghiacciaio dei Forni, Valtel-lina, Italy: morphology and sedimentology. Journal of glaciology, 35, 81-84
StoRey J., Choate m. & lee K. (2014) - Landsat 8 Operational Land Imager On-Orbit Geometric Calibration and Performance. Remote sensing, 6, 11127-11152
USGS (uniteD StateS geologiCal SuRvey) (2013) - Using the USGS Landsat 8 Product. Available at: http://landsat.usgs.gov/Landsat8_Us-ing_Product.php, Last Accessed 17/5/2013
vögtle t. & SChilling K. J. (1999) - Digitizing Maps. In: bähR h.-P. & vögtle t. (eds.), «GIS for environmental Monitoring», Stuttgart, Schweizerbart, 201-216.
whiteheaD K., mooRman b.J. & hugenholtz C.h. (2013). Brief Commu-nication: Low-cost, on-demand aerial photogrammetry for glaciological measurement. The Cryosphere, 7, 1879-1884
(Ms received 1 March 2015; Accepted 1 June 2015)
