high resolution magic angle spinning nuclear …
TRANSCRIPT
ECBC-TR-1326
HIGH RESOLUTION MAGIC ANGLE SPINNING NUCLEAR MAGNETIC RESONANCE (HRMAS NMR)
FOR STUDIES OF REACTIVE FABRICS
David J. McGarvey
RESEARCH AND TECHNOLOGY DIRECTORATE
William R. Creasy
LEIDOS, INC.Gunpowder, MD 21010-0068
November 2015
Approved for public release; distribution is unlimited.

Disclaimer
The findings of this report are not to be construed as an official Department of the Army position unless so designated by other authorizing documents.

REPORT DOCUMENTATION PAGE Form Approved
OMB No. 0704-0188 Public reporting burden for this collection of information is estimated to average 1 hour per response, including the time for reviewing instructions, searching existing data sources, gathering and maintaining the data needed, and completing and reviewing this collection of information. Send comments regarding this burden estimate or any other aspect of this collection of information, including suggestions for reducing this burden to Department of Defense, Washington Headquarters Services, Directorate for Information Operations and Reports (0704-0188), 1215 Jefferson Davis Highway, Suite 1204, Arlington, VA 22202-4302. Respondents should be aware that notwithstanding any other provision of law, no person shall be subject to any penalty for failing to comply with a collection of information if it does not display a currently valid OMB control number. PLEASE DO NOT RETURN YOUR FORM TO THE ABOVE ADDRESS.
1. REPORT DATE (DD-MM-YYYY) XX-11-2015
2. REPORT TYPE
Final 3. DATES COVERED (From - To)
Aug 2011 - Nov 2014
4. TITLE AND SUBTITLE
High Resolution Magic Angle Spinning Nuclear Magnetic Resonance (HRMAS NMR) for Studies of Reactive Fabrics
5a. CONTRACT NUMBER
W911SR-11-C-0047 5b. GRANT NUMBER 5c. PROGRAM ELEMENT NUMBER
6. AUTHOR(S
McGarvey, David J. (ECBC); and Creasy, William R. (Leidos) 5d. PROJECT NUMBER
5e. TASK NUMBER 5f. WORK UNIT NUMBER
7. PERFORMING ORGANIZATION NAME(S) AND ADDRESS(ES)
Director, ECBC, ATTN: RDCB-DRT-T, APG, MD 21010-5424 Leidos, Inc., P.O. Box 68, Gunpowder, MD 21010-0068
8. PERFORMING ORGANIZATION REPORT NUMBER ECBC-TR-1326
9. SPONSORING / MONITORING AGENCY NAME(S) AND ADDRESS(ES)
10. SPONSOR/MONITOR’S ACRONYM(S)
11. SPONSOR/MONITOR’S REPORT
NUMBER(S)
12. DISTRIBUTION / AVAILABILITY STATEMENT
Approved for public release; distribution is unlimited.
13. SUPPLEMENTARY NOTES
14. ABSTRACT
An analytical chemistry method is described for measuring the reactivity and permeation of fabrics, films, and other solid materials. Reactivity is measured using nuclear magnetic resonance spectroscopy with a high resolution magic angle spinning (solids) probe. Methods for sample preparation and interpretation of results are described.
15. SUBJECT TERMS Nuclear magnetic resonance spectroscopy (NMR) Self-decontaminating fabric Reactive fabric HD Reactive polymer GD
16. SECURITY CLASSIFICATION OF:
17. LIMITATION OF ABSTRACT
UU
18. NUMBER OF PAGES
19a. NAME OF RESPONSIBLE PERSON
Renu B. Rastogi
a. REPORT
U b. ABSTRACT
U c. THIS PAGE
U 36 19b. TELEPHONE NUMBER (include area code) (410) 436-7545
Standard Form 298 (Rev. 8-98)Prescribed by ANSI Std. Z39.18

ii
Blank
iii
PREFACE
The work described in this report was authorized under Contract No. W911SR-11-C-0047. This work was started in August 2011 and completed in November 2014.
The use of either trade or manufacturers' names in this report does not constitute an official endorsement of any commercial products. This report may not be cited for purposes of endorsement.
The text of this report is published as received and was not edited by the
Technical Releases Office, U.S. Army Edgewood Chemical Biological Center. This report has been approved for public release.
Acknowledgments The authors thank Heidi Schreuder-Gibson, Natalie Pomerantz, Nazli El Samaloty, Andra Kirsteins (U.S. Army Natick Soldier Research, Development, and Engineering Center, Warfighter Directorate) and members of the Defense Threat Reduction Agency for support under the Integrated Protective Fabric System project.

iv
Blank

v
CONTENTS ABSTRACT .............................................................................................................1 1.0 SCOPE AND APPLICATION ................................................................................1 1.1 Method Background and Limitations ..........................................................2 1.2 General Information on NMR ......................................................................3 2.0 SUMMARY OF METHOD .....................................................................................4 3.0 DEFINITIONS .........................................................................................................4 4.0 INTERFERENCES ..................................................................................................5 5.0 SAFETY ..................................................................................................................5 6.0 EQUIPMENT AND SUPPLIES ..............................................................................6 7.0 REAGENTS AND STANDARDS ..........................................................................7 8.0 SAMPLE COLLECTION, PRESERVATION, AND STORAGE..........................8 9.0 QUALITY CONTROL ............................................................................................9 9.1 Routine Stability Testing .............................................................................9 9.2 Purity of Standard Reagents .........................................................................9 9.3 Initial Demonstration of Proficiency ...........................................................9 9.4 Check for Interferences ..............................................................................10 9.5 Sample Quality Control for Preparation and Analysis ..............................10 10.0 CALIBRATION AND STANDARDIZATION ....................................................11 11.0 PROCEDURE ........................................................................................................11 12.0 DATA ANALYSIS AND CALCULATIONS ......................................................13 12.1 Qualitative Information ..............................................................................13 12.2 Quantitative Analysis .................................................................................13 13.0 METHOD PERFORMANCE ................................................................................16 13.1 Example of Well-Characterized Kinetic Data for PANOx and
PHA Reactions ...........................................................................................16 13.2 Kinetic Data that is Difficult to Interpret: VX + Cleanshell Fabric ...........20

vi
13.3 Kinetic Data that is Unprocessable: HD on Carbon ..................................22 REFERENCES ......................................................................................................24

vii
FIGURES
Figure 1: Examples of Kinetics of GD and VX Degradation at 20oC on Hydrated PANOx-A, PANOx-B and PHA Samples. ...................................................................................................... 17 Figure 2: NMR Spectrum of the VX + PANOx-B Sample, Started 7.5 min after Spiking the Sample, and Completed 9.0 min after Spiking. . ......................................................................... 18 Figure 3: Kinetic Plot for the Reaction System GD + PHA.. ...................................................... 19 Figure 4: Kinetic Data for the Reaction of VX on Cleanshell Control Fabric. ......................... 21 Figure 5: Kinetic Data for the Reaction of VX on 3 Cleanshell Fabrics. . ................................. 21 Figure 6: VX Spiked on Fabric Samples after 67 hrs of Reaction Time….. . .......................... 222 Figure 7: Stacked Plot of C-13 NMR Spectra for HD Spiked on Carbon. . ............................. 233
TABLES
Table 1: Analytes that have been Determined by this Method. ..................................................... 1 Table 2: Simulant Compounds that can be Used in this Method to Mimic the Reactivity of CW Agents. ............................................................................................................................................ 2 Table 3: Instrument Conditions for P-31 or C-13 NMR on a Solids NMR Sample. ................. 122 Table 4: Data from 5 Spectra Runs that are Used in Plot #5, VX + PANOx-B in Figure 1. ..... 198 Table 5: Observed Rate Constant (kobs) and Half-Life (t1/2) for the Reactions of GD and VX 209

viii
Blank
1
HIGH RESOLUTION MAGIC ANGLE SPINNING NUCLEAR MAGNETIC RESONANCE (HRMAS NMR) FOR STUDIES OF REACTIVE FABRICS
ABSTRACT
An analytical chemistry method is described for measuring the reactivity and permeation of fabrics, films, and other solid materials. Reactivity is measured using nuclear magnetic resonance (NMR) spectroscopy with a high resolution magic angle spinning (HRMAS solids) probe. Methods for sample preparation and interpretation of results are described. 1.0 SCOPE AND APPLICATION
High resolution magic angle spinning (solids) nuclear magnetic resonance is used to measure reactivity of chemical weapons (CW) agents or simulants after they are deposited on fabrics, polymers, or other solid materials. The purpose of the method is to determine whether the analyte is reactive and converts to a degradation product. Kinetic rates of the conversion can be measured by taking time-dependent data.
The material must be placed in a ceramic rotor that is used for spinning the sample to at least 1000 revolutions per second (rps or Hz), but more typically to 5000 rps. The rotor has an inner diameter (I.D.) of 3 mm. The material can be a fabric that can be rolled up into a tube. If the material is a solid block or a brittle film that cannot be rolled, it can be broken into pieces or crushed, and the pieces or powder can be placed into the rotor. If it is a fabric or composite material that is too thick to be rolled, it can be cut into strips or small sections to be placed in the rotor. For a rolled tube, it is possible to deposit the analyte on a specific side of the material, for example if there is an outside or inside surface. For small pieces of material, the agent cannot be deposited on one side.
Table 1 shows the CW agents that have been tested using the method. Table 2 shows a list of some possible simulant materials that have reactivity that may be similar to CW agents under some conditions.
Table 1: Analytes that have been Determined by this Method.
CW agent Chemical name CAS RN GB Isopropyl methylphosphonofluoridate 107-44-8 GD Pinacolyl methylphosphonofluoridate 96-64-0
HD* Bis(2-chloroethyl)sulfide 505-60-2 VX O-ethyl S-[2-diisopropylaminoethyl] methylphosphonothioate 50782-69-9
* Tested as a C-13 labeled compound to increase sensitivity to C-13 NMR. The compound was synthesized at ECBC.
2
Table 2: Simulant Compounds that can be used in this Method to Mimic the Reactivity of CW Agents.
Common name
Simulant for agent
Chemical name CAS RN
DFP GB or GD Diisopropyl fluorophosphate 55-91-4 CEES HD Chloroethyl ethyl sulfide 693-07-2
Demeton-S VX S-[2-(Ethylthio)ethyl] O,O-diethyl phosphorothioate 126-75-0 CAUTION: The CW agents listed in Table 1 are extremely toxic compounds, and they should be
handled only with approved SOPs, protective equipment, hoods, and adequate training to avoid hazards. They are regulated under national laws and international treaties and can only be used at approved facilities. The compounds in Table 2 are significantly less toxic and unregulated, but they are still very hazardous compounds and should be handled with caution.
1.1 Method Background and Limitations
NMR is used for this method because it has the ability to nondestructively analyze a sample. Repeated analyses are used to determine kinetic information. Reactants and products are measured in a quantitative way.
NMR has been used in many studies of chemical weapons. NMR of liquid solutions is routinely used for determination of purity of standard solutions.1,2 NMR of solid samples has been studied to determine the reactions of reagents including chemical weapons on materials like concrete, soil, and sand, as well as reactive polymers.3,4,5,6,7
There are limitations to the analytical method. NMR is not a sensitive technique compared to gas chromatography (GC) or mass spectrometry (MS) methods, although those methods often involve extraction or other sample preparation that prevents the sample from being used for further kinetic analysis. For NMR, when a sample is spiked with a 1 mg quantity of analyte, the analyte can be detected when 1-10% of the original amount still remains in the sample, using a signal averaging time of 5-10 min., typically, when P-31 or C-13 NMR detection is used. (For C-13 detection, this sensitivity is only possible for a C-13 labeled compound. Without a C-13 label, the signal averaging detection time must be much longer.) Proton NMR can be used for kinetic studies, but the spectral resolution is not as good as P-31 or C-13, so a complex sample can make it difficult to resolve the peaks of interest.
Another limitation is a peak-broadening effect. This problem has been observed only for some materials. If the agent is spiked on some materials, the NMR lines broaden and merge with the baseline over time so that they are difficult to integrate. The physical reason for the broadening is the strong binding to the solids and low mobility of the analyte molecules. Narrow peak shapes require high mobility of the molecules so that the local magnetic field that they experience is averaged over the microscopic variations in the material. Without mobility, each molecule is located in a different microenvironment and the nucleus of interest has a range of different chemical shifts. The overall signal from the sample is a sum of many different chemical shifts, producing a wide line in the spectrum, rather than being a narrow line from one chemical environment. Magic angle spinning (MAS) is a technique to

3
average out some of the variability, but there are conditions in which it is not sufficient to average out all the microenvironments.
Solvent can be added to the sample to redissolve the analyte and restore the narrow liquid-phase peaks. In some cases, the agent has reacted and the peaks correspond to products. However, cases have been observed in which the agent is still present even if the peaks were broadened. This can happen on absorptive carbon substrate, for example. We conclude that if the peaks broaden or the signal disappears, it is still possible that undetectable agent is present on the material. The highest confidence for determination of reactivity of the material requires that the reaction product peaks are observed. Kinetic information from only the decrease of reagent signal can be measured, but this type of result must be clearly described in the data interpretation, so it is clear that products were not observed directly.
This information is provided as guidance only, since such effects are matrix dependent. Unknown materials may have unexpected characteristics when studied with the method.
Method procedures are written based on the assumption that they will be performed by analysts who are formally trained in at least the basic principles of chemical analysis and in the use of the subject NMR technology. In addition, guidance about general information on how to perform an analytical procedure or technique should be distinguished from detailed Standard Operating Procedure (SOP) for a specific project application or analysis reports that have generated specific performance data. The performance data included in a method are for guidance purposes only, and are not necessarily acceptable for absolute QC acceptance criteria. 1.2 General Information on NMR
NMR spectrometers operate by placing a sample in a strong magnetic field. For high-end instruments, the magnetic field is generated by a superconducting magnet. The sample is irradiated with a radiofrequency (rf) excitation pulse, and the resultant rf signal provides information about the chemical environment of nuclei in the sample. The instrumentation can be complex and expensive. Prior to employing this method, analysts are advised to consult the NMR manufacturer information for each type of procedure that may be employed for additional information on quality control procedures, development of QC acceptance criteria, calculations, and general guidance. Analysts also should consider the type of information that is needed for successful validation of the material for guidance on the intended flexibility in the choice of methods, apparatus, materials, reagents, and supplies, and on the responsibilities of the analyst for demonstrating that the techniques employed are appropriate for the analytes of interest, in the matrix of interest, and at the levels of concern.
This method was developed using Bruker and JEOL NMR equipment. Other manufacturers have different HRMAS rotors and instrument configurations which may require some modification of the method.
Use of this method is restricted to use by, or under supervision of, appropriately experienced and trained personnel. Each analyst must demonstrate the ability to generate acceptable
4
results with this method. Other variations in the method, such as different solvent systems or reagents, may be employed, provided that adequate performance can be demonstrated for the analytes of interest. 2.0 SUMMARY OF METHOD
1. Obtain suitable HRMAS rotors and caps for the NMR and HRMAS probe that are being used.
2. Cut a piece of fabric of about 1 cm2 in area, if the fabric can be rolled into a cylinder that fits inside the rotor, 3-4 mm in diameter. If the material is too stiff or rigid to roll, cut or grind the material into powder or pieces smaller than 1-2 mm in size. Pack the material into the rotor so that it is as symmetrical as possible. Symmetry of the sample affects how fast the rotor can spin in the solids probe, since it will wobble if it is unsymmetrical.
3. Put the filled rotor into the HMRAS probe and spin it to the desired or best possible spin rate, at least 1000 rps but preferably 5000 rps. If necessary, repack the material to get a more uniform mass distribution to spin better. Tune and match the probe for the sample. Acquire a blank NMR spectrum with signal detection for the appropriate nucleus.
4. Spike the CW agent with a micropipette or syringe. Start a timer or note the clock time. The rotor may be allowed to sit for several minutes for the agent to spread and be absorbed under normal conditions. The agent will spread additionally when the rotor spins due to centrifugal force.
5. Place the spiked rotor in the probe and acquire spectra at known times after spiking. Continue to acquire spectra periodically. For fast reactions, the spectra can be acquired automatically, one after another. For slow reactions, the rotor may be removed from the probe and stored between runs.
6. When the spectra are not changing or reaction is complete, remove the cap from the rotor and add enough solvent to saturate the material, using a solvent that dissolves the analyte.
7. Rerun the rotor with the solvent. If desired, the rotor can be run several times, since it may take some time for the analyte to be extracted from the fabric.
8. Process the data to obtain kinetic information. 9. Properly dispose of the sample. The rotor can be cleaned and reused.
3.0 DEFINITIONS
High Resolution Magic Angle Spinning (HRMAS) NMR: Type of NMR method for analysis of solid or semisolid samples. The sample material is packed into a rotor and spun at a high spinning rate at the “magic” angle of 54.74° relative to the direction of the magnetic field. Spinning at this angle is used to average inhomogeneities in the sample to narrow the NMR signal lines. However, for samples that are crystalline or strongly bound, spinning is still not sufficient to remove all inhomogeneity to produce narrow lines. In order to perform the HRMAS measurement, an NMR with a superconducting magnet (300 MHz or greater) and a specialized sample probe are needed, which typically cost >$150K for a new system.
Traditional Chemical Weapons Agent or Chemical Warfare Agent (CWA): The toxic chemicals that were stockpiled either by the U.S., Soviet Union, or other countries. These compounds are often referred to by a one or two letter code, such as GB, GD, HD, or L. These chemicals have been banned by the Chemical Weapons Convention (CWC) Treaty with certain specified exceptions.

5
Nontraditional Chemical Weapon Agent: Any compound that is not one of the traditional
agents that could be used for a weapon or in a terrorist attack. Typically, these compounds are also extremely toxic.
Simulant: A compound with less toxicity than a CWA that is used to simulate the properties of the CWA. Some simulants are used to model dispersal in the environment, so they require toxicity that is so low that they can be released into the environment. For reactivity studies, compounds must be similar enough to the CWA compounds that they typically have some toxicity, but they can be used with lower hazard than CWAs.
Refer to scientific literature and the manufacturer's instructions for other definitions that may be relevant to this procedure. 4.0 INTERFERENCES
An advantage of the NMR method is that there are typically few interferences. This is due to several factors:
1. The NMR method is relatively insensitive, so interference compounds that are not present
in a concentration that is as large as the spiked analyte are not detected. 2. HRMAS NMR is not sensitive to compounds that are strongly bound to the matrix, so
that the components of the fabric or solid material may not be detected. 3. Detection is used for P-31 and C-13 labeled compounds, and there are few compounds
that are present in abundance with these nuclei that could interfere in the detection of the analyte. This factor doesn’t apply to H-1 detection, for which many compounds may be present that give signals.
However, it is possible that some solvents, reagents, glassware, and other sample processing hardware may yield artifacts and/or interferences to sample analysis. All of these materials must be demonstrated to be free from interferences under the conditions of the analysis by analyzing method blanks or unspiked samples of materials. 5.0 SAFETY
The CW agents listed in Table 1 are extremely toxic compounds, and they should be handled only with approved SOPs, protective equipment, fume hoods, and adequate training to avoid hazards. They are regulated under national laws and international treaties and can only be used at approved facilities. The quantities of analyte that are used in these experiments are usually less than the typical lethal dose, but they are a significant fraction of the toxic dose for an adult human. The compounds in Table 2 are significantly less toxic and unregulated, but they are still very hazardous compounds and should be handled with caution and with approved safety procedures.

6
Workers who are uninformed about and unprotected from toxic symptoms should not be in the lab when toxic compounds are in use, since there can be a significant vapor hazard in case of spillage outside of a fume hood or in case of power failure. MSDSs should be consulted for toxicity information and personal protective equipment.
During NMR analysis, the rotors should be tightly capped before removing them from the fume hood. The NMR instrument is typically not installed in a hood or with air exhaust. There is a chance that a rotor can break during spinning, if the rotor is defective or damaged. Therefore, depending on the toxicity of the compound, it may be advisable to wear respiratory protection during the sample analysis if the lab doesn’t have adequate air flow.
This method does not address all safety issues associated with its use. The laboratory is responsible for maintaining a safe work environment and a current awareness file of OSHA regulations regarding the safe handling of the chemicals listed in this method. A reference file of material safety data sheets (MSDSs) should be available to all personnel involved in these analyses. 6.0 EQUIPMENT AND SUPPLIES
The mention of trade names or commercial products in this method is for illustrative purposes only, and does not constitute an endorsement or exclusive recommendation for use. The products and instrument settings represent those used during method development. Equivalent equipment and supplies may be available from other vendors, but an exhaustive list is not included.
NMR equipment: Analyses for method development were done using a Bruker Avance 500 Nuclear Magnetic Resonance Spectrometer (NMR), controlled using Topspin™ software on a PC with a Linux operating system. A High Resolution Magic Angle Spinning (HRMAS) probe was used. The probe configured for either P-31 or C-13 detection. Equivalent equipment that was used for some sample analysis was a JEOL ECS-400 NMR equipped with a Doty Instruments HRMAS probe that was custom made for the instrument. (Equipment from other manufacturers may be available).
Sample Rotors: For the Bruker instrument, rotors were purchased from Wilmad Labglass: Part No. WP-501-4181, 4.0 mm O.D. rotor, -100 to 200 °C temp. range, with rotor body laser marked with a unique serial number and permanent tachometer mark on the base, made from zirconia, Vmax =18 kHz maximum spin rate. NOTE: The rotor is specific to the NMR manufacturer and probe type, so consult manufacturer for
specific rotor type that is needed in the NMR equipment that will be used for the method.
Rotor cap: Wilmad Labglass Part No. WP-601-4181, cap for 4.0 mm O.D. rotor, Ambient temp., made of Kel-F polymer. NOTE: The cap is specific to rotors. Also, the seal to contain the material in the rotor depends on the
type of cap. The Kel-F cap is a “snap cap” that is press fitted onto the rotor. This cap is the most
7
cost effective and has given an adequate seal. However, more expensive caps are available that may provide better seals under some circumstances. For example, caps with O-rings are available. These caps have been found to be more difficult to place on the rotors, and they are more difficult to reuse and subject to O-ring damage. However, if there are safety concerns about sealing the rotors, the alternate caps can be substituted.
For humidifying samples, a variable humidity chamber can be used. For example, a Thunder
Scientific humidity chamber (or equivalent) is used to humidify the fabrics or materials before spiking. See Section 8. 7.0 REAGENTS AND STANDARDS
Fabrics and materials can be engineered for reactions with particular agents. Testing of the agents or simulants depends on the capability and certification of the laboratory for agent testing. The following agents or simulants can be selected as appropriate:
The following CW agents are distributed by the Chemical Agent Standard Analytical Reference Material (CASARM) Program, Edgewood Chemical Biological Center, Aberdeen Proving Ground-Edgewood Area, MD:
GB, Isopropyl methylphosphonofluoridate, CAS RN 107-44-8 (>95% purity), C4H10FO2P.
GD, Pinacolyl methylphosphonofluoridate, CAS RN 96-64-0 (>95% purity), C7H18FO2P. HD*, Bis(2-chloroethyl)sulfide, CAS RN 505-60-2 (>95% purity, >45 atom % C-13),
C4H8Cl2S. Typically the labeled HD molecule is synthesized so each ethyl group contains one C-13 atom, randomly positioned relative to the S atom. More than one C-13 in each ethyl group (>50 atom% C-13) does not improve sensitivity, since the adjacent C-13 atoms are coupled to each other and the NMR lines are split into multiplets, decreasing the signal in each line.
VX, O-ethyl S-[2-diisopropylaminoethyl] methylphosphonothioate, CAS RN 50782-69-9 (>90% purity), C11H26NO2PS.
CAUTION: The CW agents are extremely toxic compounds, and they should be handled only with
approved SOPs, protective equipment, hoods, and adequate training to avoid hazards. They are regulated under national laws and international treaties and can only be used at approved facilities.
The following simulants are purchased commercially:
8
DFP, (simulant for GB or GD), Diisopropyl fluorophosphate, CAS RN 55-91-4 (>95% purity), C6H14PO3F.
CEES, (simulant for HD), Chloroethyl ethyl sulfide, CAS RN 693-07-2 (>95% purity), C4H9ClS. A commercial source for C-13 labeled CEES has not been identified.
Demeton-S, (simulant for VX), S-[2-(Ethylthio)ethyl] O,O-diethyl phosphorothioate, CAS RN 126-75-0 (>95% purity), C8H19O3PS2.
CAUTION: These compounds are significantly less toxic than the CW agents and they are
unregulated, but they are hazardous compounds and should be handled with caution.
All reagents can be spiked on the fabric or materials as neat compounds. They should be stored under refrigeration in double containment. Agents must be secured in locked storage under inventory control. Reagent-grade chemicals must be used in all tests. Unless otherwise indicated, it is intended that all reagents conform to the specifications of the Committee on Analytical Reagents of the American Chemical Society, where such specifications are available. Other grades may be used, provided it is first ascertained that the reagent is of sufficiently high purity to permit its use without lessening the accuracy of the determination. Reagents should be stored in glass to prevent the leaching of contaminants from plastic containers. 8.0 SAMPLE COLLECTION, PRESERVATION, AND STORAGE
Some fabrics or materials must be treated to specifications before reaction. For example, humidity conditions within a protective suit can be high when the wearer is sealed inside, so tests for reactivity of the suit material are done at high humidity for comparison. Nerve agents typically undergo hydrolysis, so the reactivity can be higher at high humidity. The fabric or material producer and project manager must be consulted for the appropriate testing conditions to meet the requirements of the customer.
To condition the fabric or material to a specified humidity, the sample can be humidified for at least 3 days in a variable humidity chamber, for example Thunder Scientific.
Alternately, the fabric or material can be placed in a humidifying bottle. A bottle containing distilled, deionized water has a humidity of 100% relative humidity (RH). A bottle containing a saturated solution of sodium bromide produces humidity inside the bottle of 50-70% RH. Test material should be exposed only to humidified air in the bottle, not to the liquid water or solution.
For best results, a fan should be in the bottle to circulate the air. A humidity meter should be used to monitor the humidity inside the bottle. For example, a Fisher Scientific traceable remote alarm RH/temperature monitor, part number 14-649-84 (or equivalent), can be used to measure humidity inside a bottle.
9
9.0 QUALITY CONTROL
NMR instruments are generally exceptionally stable and require minimal quality control. For measurement of kinetics, a QC measurement can be done at the beginning and ending of the analysis to determine that the signal response is stable.
References can be consulted for guidance on quality assurance (QA) and quality control (QC) protocols. When inconsistencies exist between QC guidelines, method-specific QC criteria take precedence over both technique-specific criteria. Any effort involving the collection of analytical data should include development of a structured and systematic planning document, such as a Quality Assurance Project Plan (QAPP) or a Sampling and Analysis Plan (SAP), which translates project objectives and specifications into directions for those that will implement the project and assess the results. The laboratory should maintain records to document the quality of the data generated. 9.1 Routine Stability Testing
The QC measurement is done by preparing a rotor with a standard quantity of a reagent or standard compound that can be detected by the same nucleus as the reagent of interest. For example, triethyl phosphate (CAS No 78-40-0, C6H15O4P) can be used as an unreactive standard to check signal response for P-31 detection. If signal response is not stable, instrument manuals or service representatives can be consulted, but in particular magnet shimming and probe tuning and matching should be optimized. 9.2 Purity of Standard Reagents
QC testing is done periodically on the neat reagent standards to check the purity. A quantity of the standard (approximately 1 mg) can be placed in a rotor and analyzed to check for degradation and impurities (see Section 11). Since CW compounds can be reactive with water vapor, the purity must be checked periodically to determine that any reaction is due to reaction with the test material and not reaction prior to spiking. The purity can also be measured to determine a weight percent by using an internal standard.2 It is also acceptable to use a dilute solution from the reagent stock that is used for the experiment, in order to determine that the purity of the stock is acceptable. This is particularly important if the kinetics is determined by the decrease in absolute signal of a peak when product peaks cannot be detected. 9.3 Initial Demonstration of Proficiency
Each laboratory must demonstrate initial proficiency with a method analysis by generating data of acceptable accuracy and precision for target analytes in a clean matrix. Proficiency testing includes a demonstration of knowledge of the operator and proper operation of the instrument. The laboratory must also repeat the demonstration of proficiency whenever new staff are trained or significant changes in instrumentation are made.

10
9.4 Check for Interferences
Before processing any samples, the analyst should demonstrate that the sample and reagents are interference-free. This is accomplished through the analysis of a method blank. Each time samples are extracted, cleaned up, and analyzed, and when there is a change in reagents, a method blank should be prepared and analyzed for the compounds of interest as a safeguard against chronic laboratory contamination. If a peak is observed that would prevent the determination of an analyte, determine the source and eliminate it, if possible, before processing the samples. The blanks should be carried through all stages of sample preparation and analysis.
Another type of interference problem arises from overlapping NMR peaks, for example
from product peaks that are not resolved from reagent peaks. The reactant and product peaks can be identified in kinetic experiments from the changing peak sizes, as the reagent peaks get smaller and products grow. Time dependence can be valuable for identifying peaks. But if the peaks are not spectrally resolved, it can be difficult to integrate the areas accurately to obtain quantitative kinetic information. In this case, extra data processing such as curve fitting may be necessary on an as-needed basis to determine the areas corresponding to reactants vs. the areas of the products.
Problems can also be observed from peak shifts during the reaction. A common problem
is due to changing pH as the reaction proceeds. In some cases, the NMR peaks can shift as a result of the changing pH. The peaks may be resolved during parts of the reaction, but not resolved during other parts as the peaks shift and overlap. This type of interference must also be approached with caution to determine when the data is valid and can be interpreted, and when it must be rejected. It is difficult to develop general rules for effects like this, since they only happen in the course of some particular types of reactions. 9.5 Sample Quality Control for Preparation and Analysis
The laboratory must have procedures for documenting the effect of the matrix on method performance (precision, accuracy, method sensitivity). If a sample of the unreactive fabric or material is available for use, the unreactive equivalent material can be used as a blank or control material. In this case, the comparison between the control and the reactive material is used to show the extra reactivity of the reactive material. The control samples show the baseline reactivity which may be due to ambient humidity and air.
The decision on whether to prepare and analyze duplicate or triplicate samples or a matrix spike/matrix spike duplicate must be based on knowledge of the samples in the sample batch and the project requirements. 10.0 CALIBRATION AND STANDARDIZATION
Quantitative NMR results do not require calibration curves. Since NMR is inherently linear and quantitative, a single internal standard providing one data point can be used to determine the quantitative amount of a unknown amount of analyte. The single point calibration can be done using a
11
different compound from the analyte, as long as it contains the same nucleus of interest. It is necessary to use a sufficiently long relaxation delay for the nuclei to relax to equilibrium between pulses to obtain quantitative results. Typically, the delay must be 5-10 times the T1 relaxation delay, which can be measured using the NMR software procedures. However, shorter delay times can be used for kinetic experiments in order to obtain data at a fast enough sampling time. Acquisition with shorter delay times produces some systematic errors, but they are usually acceptable for kinetic measurements.
Isotopically labeled standards of the analyte are not needed for quantitation, as they are in some mass spectrometry techniques. Isotopic enrichment, for example of C-13 atoms in a compound, may be used to increase the sensitivity to detection with that isotope. See Sec. 11 for more information on calibration and standardization. 11.0 PROCEDURE
1. Obtain HRMAS rotors and caps that are suitable for the particular NMR brand and HRMAS probe.
2. Receive the material to be tested, and examine the physical properties. If required,
condition the material at the necessary humidity or other preparation conditions. If the material is a flexible fabric, determine whether it can be rolled into a cylinder 3 mm in diameter. Cut a piece of fabric of about 1 cm2 in area and roll it into a cylinder of 3 mm diameter. The cylinder of fabric should be only one ply thick around the inside of the rotor for best results. The outside surface of the fabric (the side that is spiked with reagent) is on the inside of the roll. If the material is too stiff or rigid to roll, cut or grind the material into powder or pieces smaller than 3 mm in size. Pack 5-50 mg of material in the rotor (depending on density and rotor size). Weigh the amount of material by difference.
3. Calculate the amount of agent or simulant that will be spiked on the material, based on
the spike amount per unit area or per weight that is specified by the customer and testing requirements. Obtain the agent or simulant that will be tested on the material. Determine which nucleus will be used for the NMR analysis.
4. Place 1 mg of the agent or simulant (or other target test amount) into an empty HRMAS rotor and cap it. Place the rotor in the HRMAS probe. NOTE: For spike amounts of less than 1 mg (about 1 µL of volume), a solution of agent or simulant can
be used for spiking. A volatile solvent is used for diluting the neat compound. For HD and CEES, pentane (CAS No. 109-66-0) or chloroform (CAS No. 67-66-3) is used. For the other compounds, acetonitrile (CAS No. 75-05-8), methanol (CAS No. 67-56-1), or isopropanol (CAS No. 67-63-0) is used. A volume of the solution is spiked to provide the target amount of compound. The solvent should be allowed to dry before capping the rotor.
5. Tune and match the probe with the sample in the probe. Load an appropriate magnet
shim file for the probe. Analyze the rotor using the instrument conditions in Table 3. The conditions may be modified if needed for acquiring acceptable signal for the analyte peak(s). Instrument parameters may
12
depend somewhat on the instrument brand. No frequency locking is used, since there is no lock solvent. Proton decoupling is used. The recycle delay may not be long enough for complete relaxation between runs, probably causing a little distortion of the relative peak areas, but these errors are about the same as or less than the spectral signal to noise ratio for short runs. For fast kinetic determinations, it is necessary to trade off the precision with the acquisition speed in order to obtain fast data collection.
6. Examine the spectrum to make sure that the reagent peaks are at the expected chemical shift(s). Agent or simulant compounds may have several distinct NMR lines, depending on the compound. HD has two C-13 lines from the two different C atom types. GB has two lines in P-31 spectrum due to splitting of the P atom from the F atom. GD has four lines, and VX has one line. Make sure that no interference or degradation peaks are present from the rotor or the standard. If the reagent is not acceptable purity, acquire new standard. Determine whether the signal to noise ratio for the spectrum is appropriate for the measurement. If it isn’t, the number of scans can be increased.
7. Place the rotor filled with material (from step 2) into the HRMAS probe. Spin the rotor
to the desired spin rate, at least 1000 rps but preferably 5000 rps. If the rotor is unbalanced in the mass distribution, it may not spin well. If necessary, the material may be removed and repacked to get a more uniform mass distribution. Tune and match the probe for the sample.
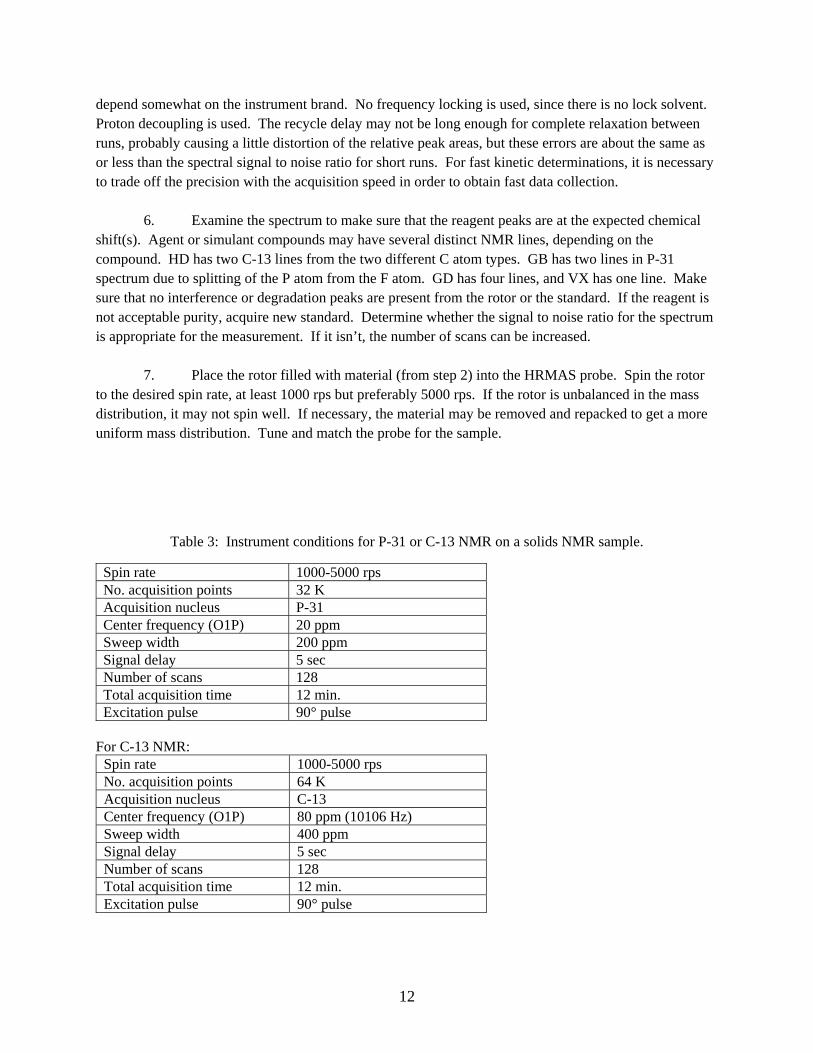
Table 3: Instrument conditions for P-31 or C-13 NMR on a solids NMR sample.
Spin rate 1000-5000 rps No. acquisition points 32 K Acquisition nucleus P-31 Center frequency (O1P) 20 ppm Sweep width 200 ppm Signal delay 5 sec Number of scans 128 Total acquisition time 12 min. Excitation pulse 90° pulse
For C-13 NMR:
Spin rate 1000-5000 rps No. acquisition points 64 K Acquisition nucleus C-13 Center frequency (O1P) 80 ppm (10106 Hz) Sweep width 400 ppm Signal delay 5 sec Number of scans 128 Total acquisition time 12 min. Excitation pulse 90° pulse
13
8. Acquire a blank spectrum with the same conditions as step 5. Examine the spectrum and
insure that there are no interferences to the detection of the agent or simulant peak. 9. Remove the rotor from the probe. Spike the test amount of reactant compound with a
micropipette or syringe. Start a timer or note the clock time. The rotor may be allowed to sit for several minutes for the agent to spread and be absorbed under normal conditions. The agent will spread additionally when the rotor is spun. If a solution is used for spiking, allow time for the solvent to dry. Put the cap on the rotor.
10. Place the rotor in the probe and acquire multiple spectra at known times after spiking.
Continue to acquire spectra periodically. For fast reactions, the spectra can be acquired automatically one after the other. For slow reactions, the rotor may be removed from the probe and stored between runs. Typically, reactions are studied at room temperature, so the rotor is not refrigerated between runs. It is also not uncapped. It may be stored in a labeled glass vial.
11. When the spectra show no further reaction is taking place or the reaction is completed,
remove the cap from the rotor and add enough solvent to saturate the material, using a solvent that dissolves the reactant.
12. Rerun the rotor with the solvent. If desired, the rotor can be run several times over a few
hours, since it may take some time for the analyte to be extracted from the fabric. Note whether the reactant is observed that was not observed without the solvent.
13. Process the data to obtain kinetic information. 14. Properly dispose of the sample. The rotor and cap can be cleaned by rinsing with solvent
or decontamination solution and reused.
12.0 DATA ANALYSIS AND CALCULATIONS 12.1. Qualitative Information Qualitative information can be obtained by comparing spectra from reactive material to spectra for an unreactive control material at the same times after spiking. Faster reaction on the reactive material indicates that the reactive material removes the agent or simulant faster. However, the spectra that are taken after addition of solvent must also be compared. For purposes of data reporting, plot a spectrum from the reactive material next to a spectrum for the unreactive material taken at about the same time after spiking. 12.2 Quantitative Analysis
Quantitative analysis can be calculated from the spectra in several ways.

14
12.2.1 Rate data from decrease of reactant peaks and increase of product peaks.
1. From the NMR spectra for the runs from each sample, identify the reactant peaks and product peaks. Reactant peaks decrease over time, and product peaks usually increase. There may be secondary reactions that can cause primary products to stop increasing and then decrease, forming other new secondary product peaks.
2. Starting with a spectrum that was acquired at a particular time, use the NMR data processing software, apodize with a suitable line broadening factor (usually 1-3 sec), Fourier transform the data, and integrate all the reactant and product peaks. Peak areas are given relative to each other and have arbitrary units.
3. Time value for the spectrum can be recorded in two ways, and the most convenient can be used. For the first method, a timer can be started at the time of the spike, and the time from the timer is recorded at the start of each run, ttimer. To get the accurate kinetic run time, tkinetic, the start time of the run is added to half of the run time, trun,
tkinetic = ttimer + trun/2 For the second method, the computer clock time must be recorded when the sample is spiked, tspike. When the NMR run is completed and the data file is saved, the computer automatically saves the time that the file is created (“time stamp”), which is the time that the NMR acquisition is completed, tfid. The kinetic time can be obtained from the time stamp on the file under the NMR file directory, using the formula,
tkinetic = (tfid - tspike) - trun/2
4. Process and review all the spectra for the sample using the same parameters, and
integrate the peaks.
5. For each spectrum, sum of the areas of the reactant peaks, ΣAreact, and sum the reactant, primary, and secondary product peaks, ΣApeaks.
6. Calculate ln(ΣAreact/ΣApeaks)
7. Plot the log vs. tkinetic. Fit a line to the data points and calculate a correlation coefficient
and slope. The slope is the pseudo-first order rate constant, in units of time-1
8. The reaction half life, in minutes, is calculated from
t1/2 = -ln(2)/slope = -0.693/slope
15
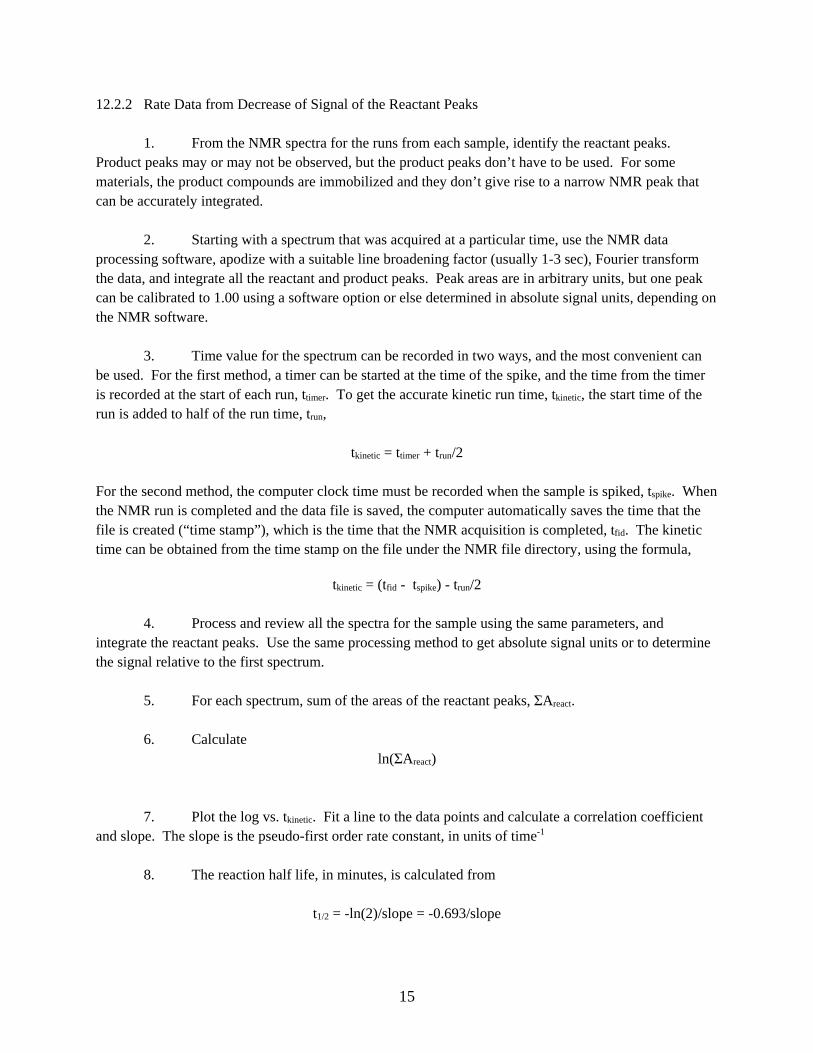
12.2.2 Rate Data from Decrease of Signal of the Reactant Peaks
1. From the NMR spectra for the runs from each sample, identify the reactant peaks. Product peaks may or may not be observed, but the product peaks don’t have to be used. For some materials, the product compounds are immobilized and they don’t give rise to a narrow NMR peak that can be accurately integrated.
2. Starting with a spectrum that was acquired at a particular time, use the NMR data processing software, apodize with a suitable line broadening factor (usually 1-3 sec), Fourier transform the data, and integrate all the reactant and product peaks. Peak areas are in arbitrary units, but one peak can be calibrated to 1.00 using a software option or else determined in absolute signal units, depending on the NMR software.
3. Time value for the spectrum can be recorded in two ways, and the most convenient can be used. For the first method, a timer can be started at the time of the spike, and the time from the timer is recorded at the start of each run, ttimer. To get the accurate kinetic run time, tkinetic, the start time of the run is added to half of the run time, trun,
tkinetic = ttimer + trun/2 For the second method, the computer clock time must be recorded when the sample is spiked, tspike. When the NMR run is completed and the data file is saved, the computer automatically saves the time that the file is created (“time stamp”), which is the time that the NMR acquisition is completed, tfid. The kinetic time can be obtained from the time stamp on the file under the NMR file directory, using the formula,
tkinetic = (tfid - tspike) - trun/2
4. Process and review all the spectra for the sample using the same parameters, and integrate the reactant peaks. Use the same processing method to get absolute signal units or to determine the signal relative to the first spectrum.
5. For each spectrum, sum of the areas of the reactant peaks, ΣAreact.
6. Calculate ln(ΣAreact)
7. Plot the log vs. tkinetic. Fit a line to the data points and calculate a correlation coefficient and slope. The slope is the pseudo-first order rate constant, in units of time-1
8. The reaction half life, in minutes, is calculated from
t1/2 = -ln(2)/slope = -0.693/slope

16
12.2.3 Data Linearity vs. Nonlinearity
Kinetic information is obtained by plotting the data on a semilog plot (natural log of signal vs time). If the plot is linear, a meaningful rate constant and half life of the reaction can be determined. However, a plot of the data and correlation coefficient should be included in the report to demonstrate the linearity. Determination of linearity can be a matter of judgment by the analyst, since a strict criterion for linearity is difficult to establish for all possible cases.
If the plot is not linear, a qualitative measure of the amount of time that the reactant is present can be given. An analyst who is trained in chemical kinetics may try to find an acceptable rate equation for the data. The quantitative rate calculations from a poor fit should not be reported, although the plot can be included in the report. (If the plot is not linear or an acceptable kinetic rate law does not fit the data, then the reporting of kinetic data that is taken from a regression fit of a nonlinear plot can give a seriously distorted view of the way that the reaction proceeds. Short time or long time behavior can be misinterpreted.)
For the kinetic data to be linear on a semilog plot is theoretically rigorous only for liquid or gas phase (homogeneous) reactions that are first-order reactions or pseudo-first-order reactions (when one reagent is present in large excess to the rest).
Several conditions should be applicable for the plot to be linear when the reaction occurs on a solid material: 1) The rate must be pseudo-first-order, so that the reaction capacity of the solid material is much greater than the liquid reactant requires for complete reaction; 2) The rate must not be limited by diffusion of the reactant compound from the location at which it was deposited to reactive sites on the solid material; 3) The reaction must not be autocatalytic, so that a change of pH or a production of a product compound does not affect the rate of reaction. If these conditions are not met, the semilog plot may not appear to be linear. 13.0 METHOD PERFORMANCE 13.1 Example of Well-Characterized Kinetic Data for PANOx and PHA Reactions
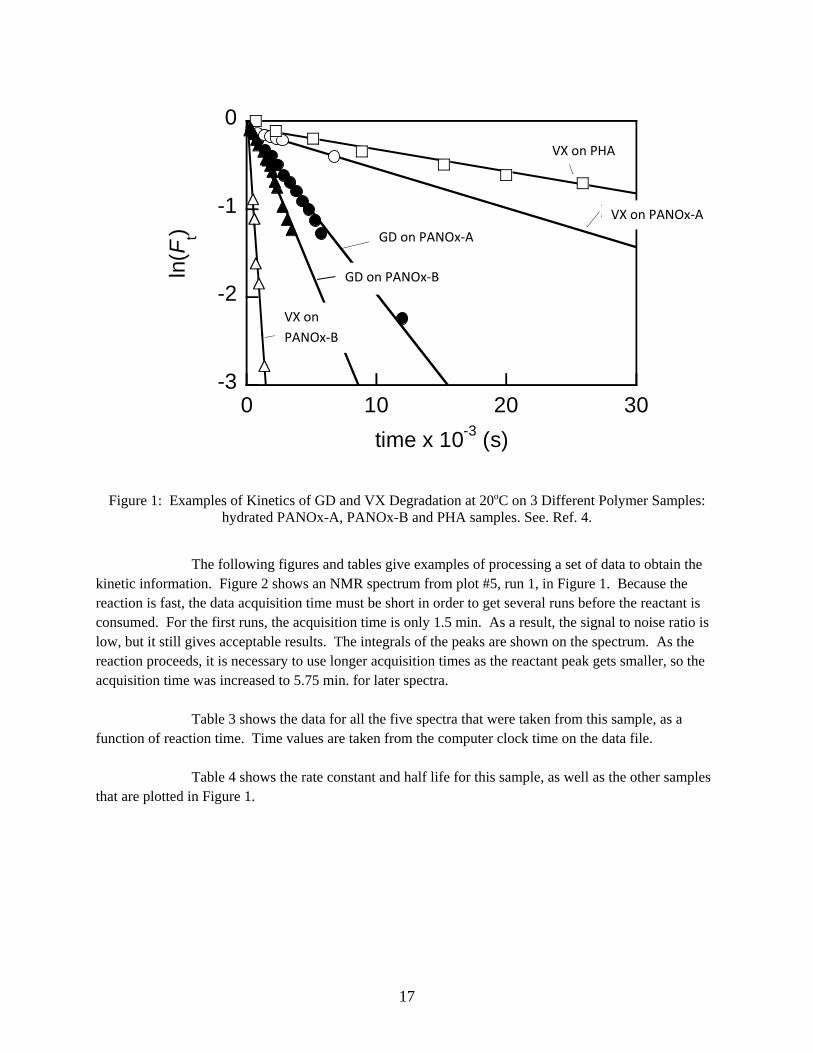
Performance data is shown in Figure 1 for five different reactions. As indicated in the caption, the reactions are between the CWAs GD and VX with the solid polymers polyacrylamidoxime (PANOx) and poly(N-hydroxyacrylamide) (PHA). The data is shown as an example only. More information about the polymers and reaction conditions can be found in a reference.4 The plot shows the linearity of the kinetic plot over a wide range of rates.
17
Figure 1: Examples of Kinetics of GD and VX Degradation at 20oC on 3 Different Polymer Samples: hydrated PANOx-A, PANOx-B and PHA samples. See. Ref. 4.
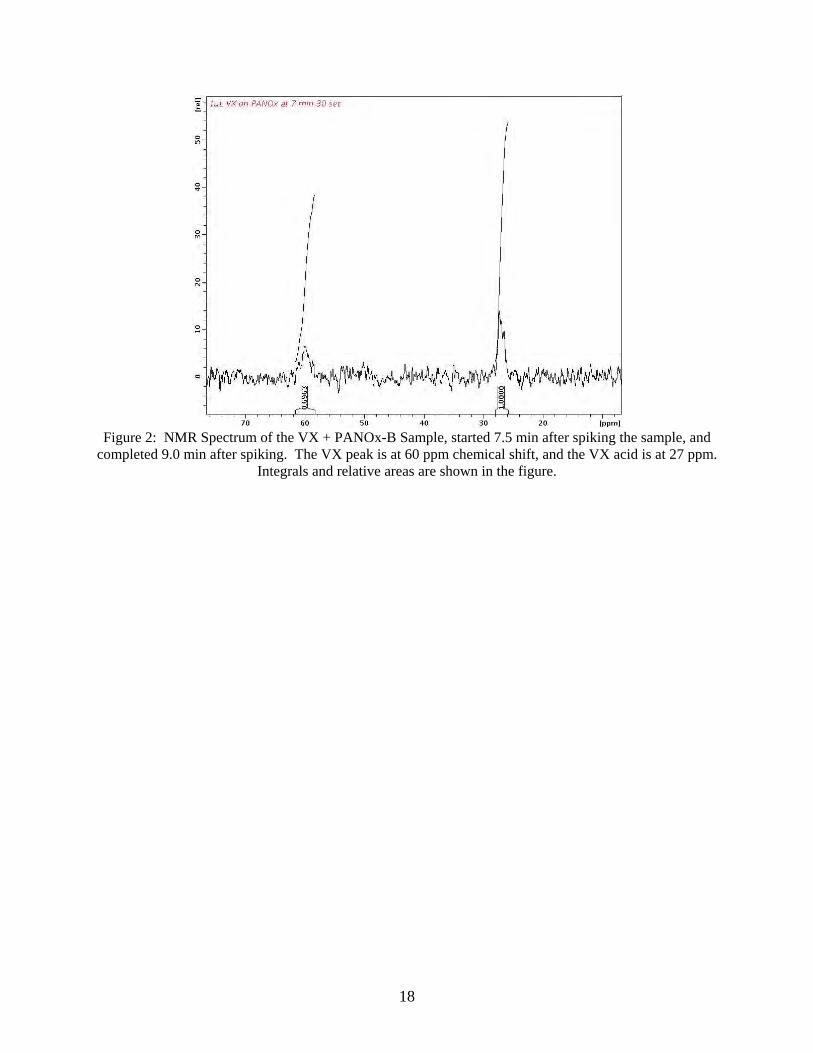
The following figures and tables give examples of processing a set of data to obtain the
kinetic information. Figure 2 shows an NMR spectrum from plot #5, run 1, in Figure 1. Because the reaction is fast, the data acquisition time must be short in order to get several runs before the reactant is consumed. For the first runs, the acquisition time is only 1.5 min. As a result, the signal to noise ratio is low, but it still gives acceptable results. The integrals of the peaks are shown on the spectrum. As the reaction proceeds, it is necessary to use longer acquisition times as the reactant peak gets smaller, so the acquisition time was increased to 5.75 min. for later spectra.
Table 3 shows the data for all the five spectra that were taken from this sample, as a function of reaction time. Time values are taken from the computer clock time on the data file.
Table 4 shows the rate constant and half life for this sample, as well as the other samples
that are plotted in Figure 1.
-3
-2
-1
0
0 10 20 30
time x 10-3 (s)
ln(F
t)1
2
3
45
VX on PHA
VX on PANOx‐A
GD on PANOx‐A
GD on PANOx‐B
VX on
PANOx‐B
18
Figure 2: NMR Spectrum of the VX + PANOx-B Sample, started 7.5 min after spiking the sample, and
completed 9.0 min after spiking. The VX peak is at 60 ppm chemical shift, and the VX acid is at 27 ppm. Integrals and relative areas are shown in the figure.

19
Table 4: Data from 5 Spectra Runs that are Used in Plot #5, VX + PANOx-B in Figure 1. Start time: Computer filename:
05/01/08 02:01 PM 080501-PANOxVX_DOTY
run no. clock end time run
length time (min) VX
VX acid VX/total ln(VX/total)
/1 05/01/08 02:10 PM 1.5 8.25 0.69 1 0.410482 -0.89042 /2 05/01/08 02:12 PM 1.5 10.15 0.49 1 0.328859 -1.11213 /3 05/01/08 02:13 PM 1.5 12.00 0.25 1 0.198461 -1.61716 /4 05/01/08 02:20 PM 5.75 16.12 0.19 1 0.157611 -1.84763 /5 05/01/08 02:27 PM 5.75 23.13 0.07 1 0.061914 -2.78201
Slope of ln(VX/total) vs. time: -0.1236 min-1 = -2.06 × 10⁻³ sec-1 Half life = -0.693/slope = 5.61 min = 0.093 hr Correlation coefficient: 0.9744
Figure 3 shows a kinetic plot for GD + PHA, for which the rate calculation based on the absolute reagent signal, discussed in Sec. 12.2.2, was used. For this system, the reactant GD was observed to decrease, but there wasn’t a corresponding increase in a product peak. Since a product wasn’t observed, the disappearance of reactants could be due to strong absorption on the solid without chemical reaction. This reaction was slower than the other reactions in Figure 1.
Figure 3: Kinetic Plot for the Reaction System GD + PHA. For this reaction, the decrease in reactant
signal was used, and there was no corresponding increase in a product peak.
y = -0.0003x + 0.6792R² = 0.9868
-0.4000
-0.2000
0.0000
0.2000
0.4000
0.6000
0.8000
0 500 1000 1500 2000 2500 3000 3500
ln(a
mt.
GD
)
time (min)
20
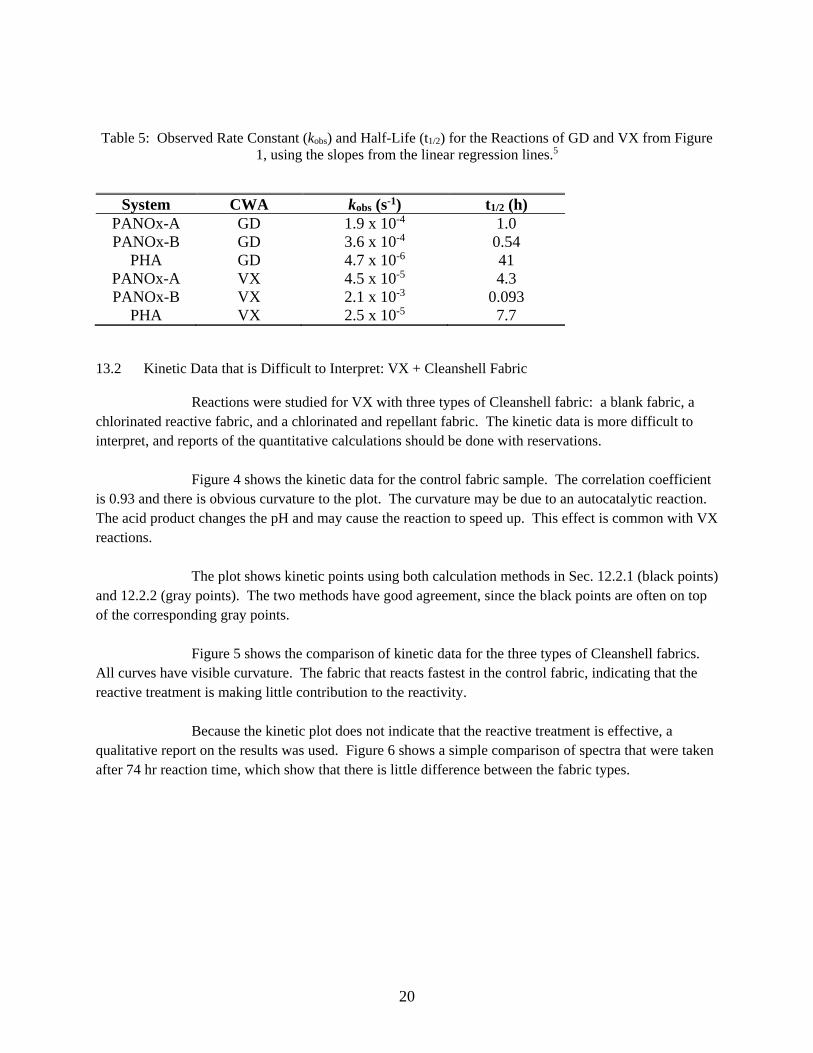
Table 5: Observed Rate Constant (kobs) and Half-Life (t1/2) for the Reactions of GD and VX from Figure
1, using the slopes from the linear regression lines.5
System CWA kobs (s-1) t1/2 (h)
PANOx-A GD 1.9 x 10⁻⁴ 1.0 PANOx-B GD 3.6 x 10⁻⁴ 0.54
PHA GD 4.7 x 10⁻⁶ 41 PANOx-A VX 4.5 x 10⁻⁵ 4.3 PANOx-B VX 2.1 x 10⁻³ 0.093
PHA VX 2.5 x 10⁻⁵ 7.7
13.2 Kinetic Data that is Difficult to Interpret: VX + Cleanshell Fabric
Reactions were studied for VX with three types of Cleanshell fabric: a blank fabric, a chlorinated reactive fabric, and a chlorinated and repellant fabric. The kinetic data is more difficult to interpret, and reports of the quantitative calculations should be done with reservations.
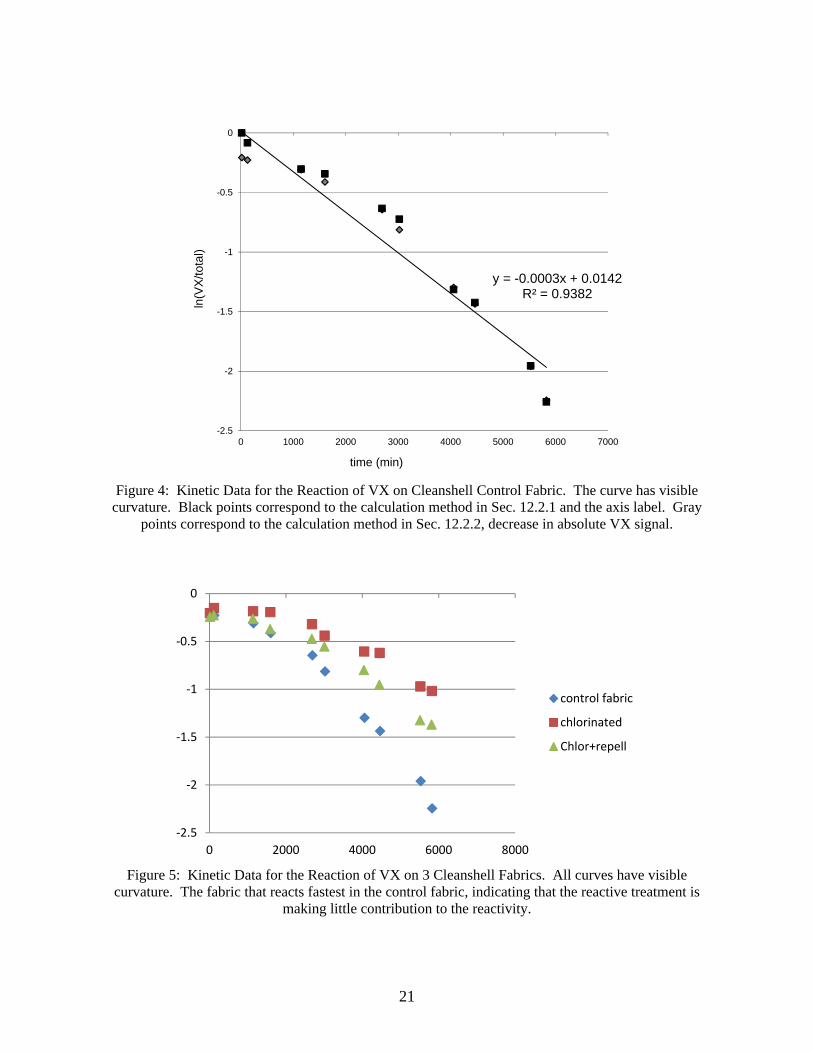
Figure 4 shows the kinetic data for the control fabric sample. The correlation coefficient is 0.93 and there is obvious curvature to the plot. The curvature may be due to an autocatalytic reaction. The acid product changes the pH and may cause the reaction to speed up. This effect is common with VX reactions.
The plot shows kinetic points using both calculation methods in Sec. 12.2.1 (black points) and 12.2.2 (gray points). The two methods have good agreement, since the black points are often on top of the corresponding gray points.
Figure 5 shows the comparison of kinetic data for the three types of Cleanshell fabrics. All curves have visible curvature. The fabric that reacts fastest in the control fabric, indicating that the reactive treatment is making little contribution to the reactivity.
Because the kinetic plot does not indicate that the reactive treatment is effective, a qualitative report on the results was used. Figure 6 shows a simple comparison of spectra that were taken after 74 hr reaction time, which show that there is little difference between the fabric types.
21
Figure 4: Kinetic Data for the Reaction of VX on Cleanshell Control Fabric. The curve has visible
curvature. Black points correspond to the calculation method in Sec. 12.2.1 and the axis label. Gray points correspond to the calculation method in Sec. 12.2.2, decrease in absolute VX signal.
Figure 5: Kinetic Data for the Reaction of VX on 3 Cleanshell Fabrics. All curves have visible
curvature. The fabric that reacts fastest in the control fabric, indicating that the reactive treatment is making little contribution to the reactivity.
y = -0.0003x + 0.0142R² = 0.9382
-2.5
-2
-1.5
-1
-0.5
0
0 1000 2000 3000 4000 5000 6000 7000
ln(V
X/to
tal)
time (min)
‐2.5
‐2
‐1.5
‐1
‐0.5
0
0 2000 4000 6000 8000
control fabric
chlorinated
Chlor+repell

22
Figure 6: VX Spiked on Fabric Samples after 67 hrs of Reaction Time. Top panel: control fabric; middle panel: Cleanshell chloramide fabric; bottom panel: cleanshell chloramide treated with repellant.
13.3 Kinetic Data that is Unprocessable: HD on Carbon
This example indicates spectral data for which kinetic interpretation is not possible. HD was added to a carbon solid material. The powdered carbon/graphite material is obtained from a solid phase extraction cartridge sold by Alltech (ChromTech Part NumberOC-159801G). Figure 7 shows the stacked NMR spectra for this material after addition of 1 µl HD (C-13 labeled). The HD peaks are at 43 and 34 ppm, and are largely gone even immediately after spiking (bottom trace). The peaks are undistinguishable from the baseline after only 1.5 hrs. But after addition of chloroform, the HD peaks reappear, in the top trace. No product peaks are observed.
This example illustrates that in some cases, a spiked analyte compound can be adsorbed or immobilized on a solid so that the HRMAS NMR peaks are not observed. This effect occurs because different molecules of the analyte are in different magnetic environments cause by the solid material. The NMR signal is still produced by the nuclei, but the peak is so broad due to the range of environments that
VX VX acid
product

23
there is not a distinct peak that is above the spectral noise level. After addition of the solvent, the molecules are mobile and the peak reappears. VX shows a similar effect on some types of materials.
After addition of solvent, the reactant peaks are still observed, and no product peaks are observed, so it is necessary to make the qualitative conclusion that no reaction is occurring.
Figure 7: Stacked Plot of C-13 NMR Spectra for HD Spiked on Carbon. Bottom trace: Spectrum from 6 min. after spiking; Second trace: 1.5 hrs after spike; Third trace: 25 hrs after spike and 1 hr after addition
of solvent; Top Trace: 12 days after spike and 11 days after addition of 50 µl chloroform.
Performance data and related information are provided in the method only as examples and guidance. The data do not represent required performance criteria for users of the methods. Instead, performance criteria should be developed on a project-specific basis, and the laboratory should establish in-house QC performance criteria for the application of this method. These performance data are not intended to be and must not be used as absolute QC acceptance criteria for purposes of laboratory accreditation.
24
REFERENCES
1 R. J. O’Connor, M. D. Brickhouse, D. McGarvey, H. D. Durst, W. R. Creasy, and J. L. Ruth, NMR Method for the Quantitative Purity Analysis of Neat Feed Stock Samples, ECBC Technical Report ECBC-TR-253, Edgewood Chemical Biological Center, Aberdeen Proving Ground, MD, Aug. 2002. 2 R. J. O’Connor, M. D. Brickhouse, J. R. Rice, H. D. Durst, D. J. McGarvey, W. R. Creasy, J. Pence, J. L. Mongomery, “NMR Method for the Quantitative Analysis of Liquid Samples,” ECBC Technical Report #ECBC-TR-416, January 2005. 3 C. A. S. Brevett, K. B. Sumpter, G. W. Wagner, “Degradation of Mustard on Concrete: GC/MSD and SSMAS,” ECBC Technical Report ECBC-TR-482, Edgewood Chemical Biological Center, Aberdeen Proving Ground, MD, March 2006. 4 L. Bromberg, H. Schreuder-Gibson, W. R. Creasy, D. J. McGarvey, R. A. Fry, and T. A. Hatton, "Degradation of Chemical Warfare Agents by Reactive Polymers," Ind. Eng. Chem. Res., 2009, 48 (3), 1650-1659. 5 C. A. S. Brevett and K. Sumpter, “Degradation of the chemical warfare agents GD, thickened GD, HD, and VX on ambient and moist environmentally relevant substrates,” Sensing and Destroying Chemical Weapons and Pesticides Based on the Symposium at the 238th American Chemical Society Meeting, Washington DC, USA, August 18–19, 2009, Main Group Chemistry, 2010, 9, 205-219. 6 C. A. S. Brevett and K. B. Sumpter, “Sulfur Mustard Degradation on Ambient and Moist Concrete”, ECBC Technical Report ECBC-TR-641, Edgewood Chemical Biological Center, Aberdeen Proving Ground, MD, August 2008. 7 G. W. Wagner, R. J. O’Connor, J. L. Edwards, and C. A. S. Brevett, “Effect of Drop Size on the Degradation of VX in Concrete” Langmuir, 2004, 20, 7146-7150.
DISTRIBUTION LIST The following individuals and organizations were provided with one Adobe portable document format (pdf) electronic version of this report: U.S. Army Edgewood Chemical Biological Center (ECBC) RDCB-DRT-T ATTN: McGarvey, D. Evans, R. Leidos, Inc. Gunpowder, MD ATTN: Creasy, W.R. Defense Threat Reduction Agency DTRA/RD-CBD T ATTN: Ward, T. J9-CBS ATTN: Moore, E. Department of Homeland Security DHS ORD CSAC ATTN: Famini, G.
ECBC Technical Library RDCB-DRB-BL ATTN: Foppiano, S. Stein, J. G-3 History Office U.S. Army RDECOM ATTN: Smart, J. Office of the Chief Counsel AMSRD-CC ATTN: Upchurch, V. Defense Technical Information Center ATTN: DTIC OA ECBC Rock Island RDCB-DES ATTN: Lee, K.
