hierarchical parallelization of gene differential association analysis
TRANSCRIPT
SOFTWARE Open Access
Hierarchical Parallelization of Gene DifferentialAssociation AnalysisMark Needham1, Rui Hu2*, Sandhya Dwarkadas1 and Xing Qiu2
Abstract
Background: Microarray gene differential expression analysis is a widely used technique that deals with highdimensional data and is computationally intensive for permutation-based procedures. Microarray gene differentialassociation analysis is even more computationally demanding and must take advantage of multicore computingtechnology, which is the driving force behind increasing compute power in recent years. In this paper, we presenta two-layer hierarchical parallel implementation of gene differential association analysis. It takes advantage of bothfine- and coarse-grain (with granularity defined by the frequency of communication) parallelism in order toeffectively leverage the non-uniform nature of parallel processing available in the cutting-edge systems of today.
Results: Our results show that this hierarchical strategy matches data sharing behavior to the properties of theunderlying hardware, thereby reducing the memory and bandwidth needs of the application. The resultingimproved efficiency reduces computation time and allows the gene differential association analysis code to scaleits execution with the number of processors. The code and biological data used in this study are downloadablefrom http://www.urmc.rochester.edu/biostat/people/faculty/hu.cfm.
Conclusions: The performance sweet spot occurs when using a number of threads per MPI process that allowsthe working sets of the corresponding MPI processes running on the multicore to fit within the machine cache.Hence, we suggest that practitioners follow this principle in selecting the appropriate number of MPI processesand threads within each MPI process for their cluster configurations. We believe that the principles of thishierarchical approach to parallelization can be utilized in the parallelization of other computationally demandingkernels.
BackgroundMicroarray gene differential expression analysis has beenwidely used to uncover the underlying biologicalmechanism. Researchers utilize this technology to iden-tify potentially “interesting” genes. More specifically, astatistical test is applied to each individual gene todetect whether the mean expression level of this gene isthe same or not across different biological conditions orphenotypes studied in an experiment. A chosen multipletesting procedure (MTP) is then employed to controlcertain per-family Type I errors. Genes work together tofulfill certain biological functions and they are known tobe strongly correlated [1,2]. The structure of inter-genecorrelation contains rich information that cannot be
extracted from mean expression levels. Recent yearshave seen more and more research focusing on genedependence structures. For example, some procedures,such as gene set enrichment analysis [3,4], incorporateexisting biological gene sets information into statisticalprocedures. Gene cluster analysis uses gene dependenceand similarity to group genes [5-11]. Gene network ana-lysis, such as method based on Gaussian or Bayesiannetworks, employs gene dependence to study genedynamics and reasoning [12-14]. Another approach is todirectly select genes based on the phenotypic differencesof their dependence structure [15-20]. In this paper, weconsider the very last approach and focus on a gene dif-ferential association analysis (henceforth denoted asGDAA) procedure proposed in [19]. Unlike traditionaldifferential gene expression analysis, GDAA is designedto select genes that have different dependence structureswith other genes in two phenotypes. It complements the
* Correspondence: [email protected] of Biostatistics and Computational Biology, University ofRochester, 601 Elmwood Avenue Box 630, Rochester, New York 14642, USAFull list of author information is available at the end of the article
Needham et al. BMC Bioinformatics 2011, 12:374http://www.biomedcentral.com/1471-2105/12/374
© 2011 Needham et al; licensee BioMed Central Ltd. This is an Open Access article distributed under the terms of the CreativeCommons Attribution License (http://creativecommons.org/licenses/by/2.0), which permits unrestricted use, distribution, andreproduction in any medium, provided the original work is properly cited.
analysis of differentially expressed genes. Combiningboth gene differential association analysis and gene dif-ferential expression analysis provides a more compre-hensive functional interpretation of the experimentalresults. As an example, GDAA was applied in [20] totwo sets of Childhood Leukemia data (HYPERDIP andTEL) [21] and selected differentially associated (DA)genes that could not be detected by differential geneexpression analysis. Furthermore, the TEL group is dif-ferentiated from other leukemia subtypes by the pre-sence of t(12;21)(p13;q22) translocation,generating the TEL-AML1 fusion gene. Through theover-representation of DA genes, the chromosomalband 21q22.3 containing the TEL-AML1 fusion genewas identified. This chromosomal band was not identi-fied by differential gene expression analysis.A typical microarray data set reports expression levels
for tens of thousands of genes. For example, both sets ofChildhood Leukemia data HYPERDIP and TEL [21] haveexpression levels for m = 7, 084 genes updated from theoriginal expression levels by using a custom CDF file toproduce values of gene expressions. The CDF files can befound at http://brainarray.mbni.med.umich.edu. Pleasesee [19] for more details. Each slide is then representedby an array reporting the logarithm (base 2) of expressionlevel on the set of 7,084 genes. For convenience, thewords “gene” and “gene expression” are used inter-changeably to refer to these gene expressions in thispaper. Due to such a high dimensionality, the computa-tion of traditional gene differential expression analysis isconsidered to be more time consuming than many tradi-tional statistical analyses in medical research. A geneselection procedure based on gene dependence structureshas to be even more computationally intensive. This isbecause the dependence structure is typically measuredby a pertinent association score, such as the Pearson cor-relation coefficient for all gene pairs, of which the multi-
plicity (dimensionality) is m(m−1)2
instead of m. It is
therefore more computationally intensive to detect thedifferences hidden in the correlation matrix. In particular,for the procedure proposed in [19], the length of thecomputation is O(m × m × n × K), where m = 7, 084 isthe number of genes, n = 79 is the number of subjects ineach phenotypic group, and K = 10, 000 is the number ofpermutations for approximating the statistical null distri-bution. Such large number of permutations is necessarybecause statistical inference for microarray analysis isbased on multiple testing adjusted p-values, whichdemands much finer estimation of unadjusted p-valuescompared to regular permutation tests. With a largenumber of genes and a medium sample size, runningGDAA can take several days or even a month. For exam-ple, a sequential implementation of the procedure in [19]
took nearly two months to complete the calculation on acomputer with a 2 GHz AMD Opteron processor and2GB SDRAM. Until about 2003, processor designerswere able to leverage technology advances that allowedincreasing numbers of smaller and faster transistors on asingle chip in order to improve the performance ofsequential computation. Hence, it was possible for com-putational scientists who wanted their codes to run fasterto simply wait for the next generation of machines. How-ever, the reality is that around 2003, chipmakers discov-ered that they were no longer able to sustain fastersequential execution due to the inability to dissipate theheat generated by the computation [22]. Consequently,designers turned to using the increasing transistor countsto add more processors, each of which execute indepen-dent sequential computation. The processors typicallyshare access to the memory subsystem and off-chipbandwidth. These multicore chips now dominate thedesktop market and are used to put together multipro-cessor servers consisting of multiple processor chips, aswell as networked clusters of such servers for high-endcomputation. Parallel computing (utilizing multiple com-pute resources simultaneously for the same application)that effectively leverages these increasingly multicoreclusters of multiprocessors is thus even more criticalthan in the past in order to obtain results in a timelymanner.In this paper, we propose a new parallel design for the
gene differential association analysis procedure in [19].The key to our parallelization strategy is that it takesadvantage of both fine and coarse-grain parallelism (thegranularity representing the frequency of sharing/com-munication in the concurrent computation). The hard-ware-based memory sharing within a multicore isutilized for the fine-grain parallelism (with higher needfor sharing/communication). Sharing memory in hard-ware avoids the need for data replication. Since GDAAutilizes a multivariate nonparametric test, it has morememory needs than a comparable gene differentialexpression analysis. Therefore, the memory sharing fea-ture in our strategy is also critical to reducing the band-width demands of the GDAA procedure. The resultsshow that our strategy leverages GDAA’s characteristicsto reduce the memory and bandwidth needs of theapplication, thereby improving computational efficiency.
ImplementationGene Differential Association Analysis ProcedureWe outline the related GDAA procedure below. Moredetails can be found in [19].Statistical Hypothesis TestingAssume there are two biological conditions or pheno-types A and B. Under each condition n subjects are
Needham et al. BMC Bioinformatics 2011, 12:374http://www.biomedcentral.com/1471-2105/12/374
Page 2 of 12

sampled, each measured with m gene expressionlevels.We denote these gene expressions by {xij}, 1 ≤ i ≤ m
and 1 ≤ j ≤ n. For the ith gene, we first compute an (m- 1)-dimensional random vector ri = (ri1, ..., ri,i-1, ri,i+1,..., rim). Here rik is the Pearson correlation coefficientbetween the ith and the kth gene, i.e.,
rik =n
∑nl=1 xilxkl −
∑nl=1 xil
∑nl=1 xkl√
n∑n
l=1 x2il − (
∑nl=1 xil)
2√
n∑n
l=1 x2kl − (
∑nl=1 xkl)
2.
Fisher transformation is then applied to these correla-tion coefficients:
wik =12
log1 + rik
1− rik,
where k = 1, ..., i - 1, i + 1, ..., m. We denote the cor-relation vectors (wi1, ..., wi,i-1, wi,i+1, ..., wim) by wi. Thisvector represents the relationship between the ith geneand all other genes.For the ith gene, its correlation vectors under condi-
tions A and B are denoted by wi(A) and wi(B), respec-tively. We test the null hypotheses
Hi : Fwi(A)(x) = Fwi(B)(x), 1 ≤ i ≤ m.
where Fwi(A)(x) and Fwi(B)(x) are the joint distributionfunctions of wi(A) and wi(B), respectively. If Hi isrejected, we declare the ith gene to be a differentiallyassociated gene.The N-statisticIn order to test Hi, we need to create samples of corre-lation vectors to mimic the joint distributions Fwi(A)(x)and Fwi(B)(x), respectively. We divide the dataset undercondition A intoG(1 ≤ G ≤ n
2 ) subgroups, each sub-group containing n
G subjects. In order to compute corre-lation coefficients, every subgroup must contain at leasttwo subjects. Sample sizes of subgroups do not have tobe equal. When G does not divide n, the last few sub-groups can have a slightly larger or smaller sample size.That being said, an approximately even partition of sub-groups is still desirable because it leads to better statisti-cal power than unbalanced partitions.From these subgroups, we compute a sample of size G
correlation vectors for the ith gene, denoted by wi(A, k),1 ≤ k ≤ G. Similarly, we have a sample of size G correla-tion vectors for the ith gene under condition B, denotedby wi(B, k), 1 ≤ k ≤ G.Next, Hi is tested by a multivariate nonparametric test
based on the N-statistic. This statistic has been success-fully used to select differentially expressed genes andgene combinations in microarray data analysis [23-26].The N-statistic is defined as follows:
Ni =2
G2
G∑k=1
G∑l=1
L(wi(A, k), wi(B, l))
− 1G2
G∑k=1
G∑l=1
L(wi(A, k), wi(A, l))
− 1G2
G∑k=1
G∑l=1
L(wi(B, k), wi(B, l)),
(1)
where L is the kernel defined by Euclidean distance, i.e.,
L(wi(·, k), wi(·, l)) =‖ wi(·, k)− wi(·, l) ‖
=√ ∑
1≤j≤m,j�=i
(wij(·, k) − wij(·, l))2.
The N-statistic can serve as a measurement of howmuch the inter-gene correlation structure of the ithgene has changed from condition A to condition B.Permutation-based Null Distribution and p-valueDenote N∗
i as the N-statistic associated with the ithgene. To determine the statistical significance of N∗
i ,which is represented by a p-value, we need to model thenull distribution of this statistic. This can be done bythe following resampling method. First, we combine thegene expression data under both conditions and ran-domly permute subjects. Then we divide them into twogroups of equal size, mimicking two biological condi-tions without differentially associated genes. By applyingformula (1), we get a permutation based N-statistic forthe ith gene, which can be considered as an observationfrom the null distribution of Ni, i.e., the distribution ofNi when Hi holds. Repeating this permutation process Ktimes produces K permutation based N-statistics for theith gene, denoted by Nik, 1 ≤ k ≤ K.pi, the permutation based p-value for testing Hi, is
computed as the proportion of Nik that is greater thanor equal to N∗
i :
pi =#(Nik ≥ N∗
i )
K. (2)
To control per-family error rate (PFER), we apply theextended Bonferroni adjustment [27] to the above p-values to obtain the adjusted p-values
p̃i = pi ×m. (3)
The smaller p̃i is, the more likely wi(A) is differentfrom wi(B), i.e., the ith gene changes its relationshipwith all other genes across conditions A and B. If p̃i isless than a pre-defined threshold, we reject Hi anddeclare the ith gene to be a differentially associatedgene.
Needham et al. BMC Bioinformatics 2011, 12:374http://www.biomedcentral.com/1471-2105/12/374
Page 3 of 12
Summary of the GDAA ProcedureThe above GDAA procedure can be summarized as fol-lows:
1. Divide the subjects (slides) under each condition(A or B) into G subgroups such that there areapproximately n
G subjects for each subgroup.2. For each gene, compute its correlation vectorsfrom all subgroups. This step produces G correlationvectors for one gene in each condition.3. Compute the N-statistic for the ith gene fromthese 2 × G samples using Equation(1) and record itas N∗
i .4. Pool the subjects in both conditions together.Randomly shuffle the subjects, and then split theminto two groups of equal size.5. Divide the subjects in each group into G sub-groups and compute G correlation vectors in eachsubgroup for each gene.6. Compute the N-statistics for each gene based onthese 2 × G correlation vectors.7. Repeat steps 4 to 6 K times and record the permuta-tion-based N-statistics as Nik, i = 1, ..., m, k = 1, ..., K.8. Obtain the permutation-based p-value, pi, usingEquation(2).9. Adjust p-value by using Equation(3). Select differ-entially associated genes based on the adjusted p-values and a pre-specified PFER level.
ComputationOur parallel design is implemented using Python and C++.Python is in charge of initializing data and all communica-tion between the master process and any slave processes –sending out computation jobs and collecting results. C++is used to perform the actual computation within eachindependent process. A high-level language such asPython provides ease of use and flexibility, especially fordata initialization and coordination, but at the cost of per-formance. By limiting the use of Python to the initializa-tion and coordination with the slaves (where the programspends a very small percentage of its overall time) andusing C++ for the computationally intensive portions ofthe program, we get the best of both worlds: the flexibilityof Python and the performance of C++. The use of otherlanguages such as R instead of Python is also possible. Theexecution proceeds as follows:
1. Read in and initialize data (performed in Pythonon the master process).2. Calculate N∗
i , 1 ≤ i ≤ m, for the unpermuted data-set using a single core (C++ code) on the masterprocess.
3. Create K permutations of the original dataset; dis-tribute the permutations k (1 ≤ k ≤ K) to indepen-dent slave processes (performed in Python) usingMPI [28]. Work is distributed at the granularity of asingle permutation – when a process completes thecomputation for one permutation, it requests thenext permutation.4. Each worker/slave receives a permutation (usingPython), permutes its local copy of the data, andthen computes the vector of N-statistics using C++,parallelized using the Pthreads [29] package. Atotal number of P threads are created and the per-gene computation is distributed among threads sothat each thread performs the N-statistic computa-tion for m
P genes. When m is not divisible by P,each thread receives a slightly different number ofgenes.5. Once an MPI process has determined that itsthreads have computed all N-statistics (Nik, 1 ≤ i ≤m) for the kth permutation it was assigned, it thenreturns them to the master MPI process.6. The master MPI process collects all the Nik to cal-culate p-values pi (performed in Python).
Steps 1 and 2 of the algorithm are performed sequen-tially. To parallelize the remaining steps, we use a two-tiered approach. At the first level, we distribute thework by spawning processes from Python using MPI.One MPI process, the “master” process, is responsiblefor distributing different permutations to the other“slave” processes. Each slave independently permutesthe gene data according to the permutation indicesreceived from the master process and computes the N-statistics for the permuted data (this code is optimizedC++ code). The computed values (the vector of N-statis-tics) are then returned to the master using an MPI mes-sage, where the Python code calculates the p-value. Thekey to this implementation is that the core computationis performed in optimized C++ code.The second level of parallelization occurs within the
slaves. When computing the N-statistics, each slave(MPI process) forks off a specified number of threads,each of which computes the permutation’s N-statisticsfor a subset of genes. This allows us to vary the paralle-lization between MPI processes (which split the work bypermutations) and threads (which divide the work bygenes). For example, with one quad-core processor on ashared memory architecture, we can run one slave MPIprocess with four threads, 2 MPI processes each withtwo threads, or four MPI processes each running a sin-gle thread. Splitting the work between MPI processesversus threads has implications for performance andmemory usage, which we will highlight in the evaluation
Needham et al. BMC Bioinformatics 2011, 12:374http://www.biomedcentral.com/1471-2105/12/374
Page 4 of 12

section. This hierarchical design is also illustrated in theflowchart of Figure 1.
Data SharingGene expression level data in each biological conditionis represented using a dynamically allocated (m × n)-dimensional array, where n is the number of subjectsand m is the number of genes. This two-dimensionalarray is read-shared within each MPI process and itssize grows as a product of m and n. There are twoother dynamically allocated two-dimensional arrays cre-ated for each MPI process. These two arrays with sizesproportional to (m × G) are used for temporary storageof the correlation computation. One stores the sums of
the expression levels within subgroups so that its entry
in row i and column j is∑
l∈Subgroup j x(k)il . Here x(k)
ilis
the expression level for gene i and subject l in the kthpermutation. The other stores the sums of squares ofthe expression levels within subgroups so that its entry
in row i and column j is∑
l∈Subgroup j (x(k)il )2. They are
also read shared within the MPI process. Another two-dimensional dynamically allocated array with size pro-portional to O(m × G) is created for each thread, storingthe correlation vectors for each gene. This array is bothread and written by the thread. The N-statistic, which isa vector with the size of the number of genes m, is alsoshared across all threads within each MPI process. Each
Begin
Data read in
and initializations
Calculate unpermuted N-statistic
Send permutations
to idle slave MPI processes
Within each slave MPI process,
distribute genes to p-threads
Within each slave MPI process,
collect N-statistics from all threads
Return N-statistics
from slave MPI processes
to master MPI process
Finish K permutations?
Calculate p-values
End
Yes
No
Figure 1 Flowchart of hierarchical parallelization design.
Needham et al. BMC Bioinformatics 2011, 12:374http://www.biomedcentral.com/1471-2105/12/374
Page 5 of 12

thread writes to independent regions of this vectorbased on the genes allocated to it.
ResultsOur evaluation is conducted on a cluster of five machines,each with 16 GBytes of memory and two 3.0 GHz quad-core Intel Xeon 5450 processors, for a total of 40 proces-sors. The machines are interconnected using Gigabitethernet. Each quad-core processor chip has 6 MBytes oflast-level cache per pair of cores. Each machine runsLinux version 2.6.16.60-0.21-smp. The application wascompiled using Python version 2.4.2, Pypar version 2.1.0,and gcc version 4.1.2 at the -O2 optimization level.
Simulation DataTo gain better insight into the effects of different config-urations on performance, we simulate several sets of
data. Each set has two groups of n = 100 slides repre-senting 100 subjects in each biological conditions.Each array has m genes, where m takes on values in
{1000, 2000, 3000, 4000, 5000, 6000, 7000, 8000, 9000,10000}. The slides in each group are divided into G =10 subgroups to calculate correlation vector samples. K= 100 permutations of the subjects in the two groupsare created in order to generate the null distributions ofN-statistics.
Performance AnalysisFigures 2 and 3 present the execution time (measuredfrom the time after calculation of the unpermuted statis-tic) as a function of the number of genes in the dataset,with the operating system default scheduling (Figure 2)and with each thread/process pinned (more detailedexplanation to follow) so it executes only on one specific
●●
●
●
●
●
●
●
●
●
050
010
0015
0020
00
1000 2000 3000 4000 5000 6000 7000 8000 9000
Number of genes
Com
putin
g tim
e (s
econ
ds)
●●
●
●
●
●
●
●
●
●
●●
●
●
●
●
●
●
●
●
●●
●
●
●
●
●
●
●
●
● 1 thread2 threads4 threads8 threads
Figure 2 Execution time with default OS scheduling. Number of slides in each condition: 100. Number of permutations: 100. Numbers of MPIprocesses × threads: 32 × 1 (solid), 16 × 2 (dash), 8 × 4 (dot), and 4 × 8 (dash-dot).
Needham et al. BMC Bioinformatics 2011, 12:374http://www.biomedcentral.com/1471-2105/12/374
Page 6 of 12
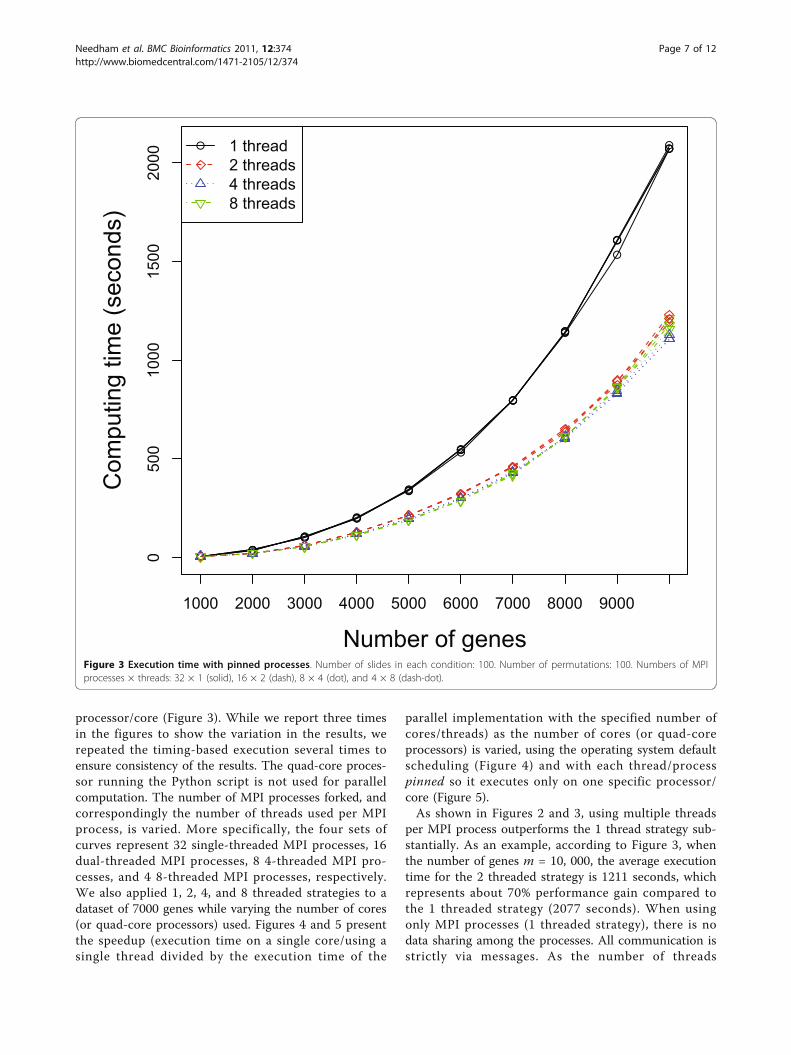
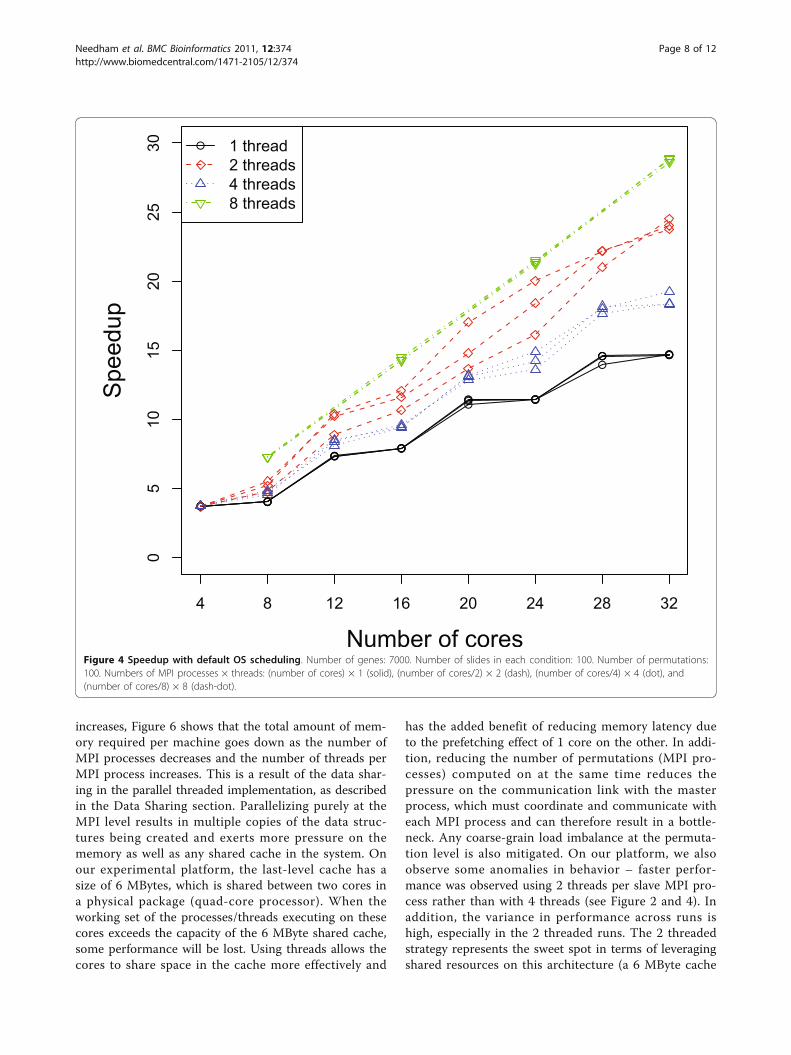
processor/core (Figure 3). While we report three timesin the figures to show the variation in the results, werepeated the timing-based execution several times toensure consistency of the results. The quad-core proces-sor running the Python script is not used for parallelcomputation. The number of MPI processes forked, andcorrespondingly the number of threads used per MPIprocess, is varied. More specifically, the four sets ofcurves represent 32 single-threaded MPI processes, 16dual-threaded MPI processes, 8 4-threaded MPI pro-cesses, and 4 8-threaded MPI processes, respectively.We also applied 1, 2, 4, and 8 threaded strategies to adataset of 7000 genes while varying the number of cores(or quad-core processors) used. Figures 4 and 5 presentthe speedup (execution time on a single core/using asingle thread divided by the execution time of the
parallel implementation with the specified number ofcores/threads) as the number of cores (or quad-coreprocessors) is varied, using the operating system defaultscheduling (Figure 4) and with each thread/processpinned so it executes only on one specific processor/core (Figure 5).As shown in Figures 2 and 3, using multiple threads
per MPI process outperforms the 1 thread strategy sub-stantially. As an example, according to Figure 3, whenthe number of genes m = 10, 000, the average executiontime for the 2 threaded strategy is 1211 seconds, whichrepresents about 70% performance gain compared tothe 1 threaded strategy (2077 seconds). When usingonly MPI processes (1 threaded strategy), there is nodata sharing among the processes. All communication isstrictly via messages. As the number of threads
●●
●
●
●
●
●
●
●
●0
500
1000
1500
2000
1000 2000 3000 4000 5000 6000 7000 8000 9000
Number of genes
Com
putin
g tim
e (s
econ
ds)
●●
●
●
●
●
●
●
●
●
●●
●
●
●
●
●
●
●
●
●●
●
●
●
●
●
●
●
●● 1 thread2 threads4 threads8 threads
Figure 3 Execution time with pinned processes. Number of slides in each condition: 100. Number of permutations: 100. Numbers of MPIprocesses × threads: 32 × 1 (solid), 16 × 2 (dash), 8 × 4 (dot), and 4 × 8 (dash-dot).
Needham et al. BMC Bioinformatics 2011, 12:374http://www.biomedcentral.com/1471-2105/12/374
Page 7 of 12
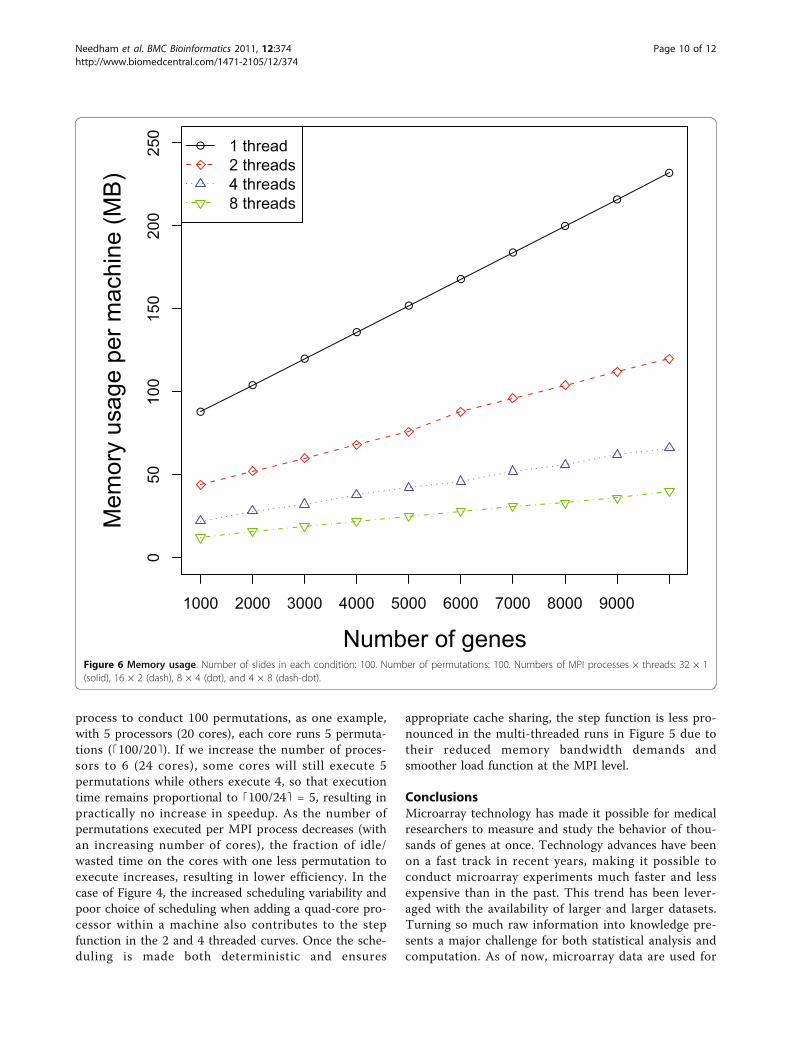
increases, Figure 6 shows that the total amount of mem-ory required per machine goes down as the number ofMPI processes decreases and the number of threads perMPI process increases. This is a result of the data shar-ing in the parallel threaded implementation, as describedin the Data Sharing section. Parallelizing purely at theMPI level results in multiple copies of the data struc-tures being created and exerts more pressure on thememory as well as any shared cache in the system. Onour experimental platform, the last-level cache has asize of 6 MBytes, which is shared between two cores ina physical package (quad-core processor). When theworking set of the processes/threads executing on thesecores exceeds the capacity of the 6 MByte shared cache,some performance will be lost. Using threads allows thecores to share space in the cache more effectively and
has the added benefit of reducing memory latency dueto the prefetching effect of 1 core on the other. In addi-tion, reducing the number of permutations (MPI pro-cesses) computed on at the same time reduces thepressure on the communication link with the masterprocess, which must coordinate and communicate witheach MPI process and can therefore result in a bottle-neck. Any coarse-grain load imbalance at the permuta-tion level is also mitigated. On our platform, we alsoobserve some anomalies in behavior – faster perfor-mance was observed using 2 threads per slave MPI pro-cess rather than with 4 threads (see Figure 2 and 4). Inaddition, the variance in performance across runs ishigh, especially in the 2 threaded runs. The 2 threadedstrategy represents the sweet spot in terms of leveragingshared resources on this architecture (a 6 MByte cache
● ●
●●
● ●
● ●
05
1015
2025
30
4 8 12 16 20 24 28 32
Number of cores
Spe
edup
● ●
●●
● ●
● ●
● ●
●●
● ●
● ●
● ●
●●
● ●
●●
● 1 thread2 threads4 threads8 threads
Figure 4 Speedup with default OS scheduling. Number of genes: 7000. Number of slides in each condition: 100. Number of permutations:100. Numbers of MPI processes × threads: (number of cores) × 1 (solid), (number of cores/2) × 2 (dash), (number of cores/4) × 4 (dot), and(number of cores/8) × 8 (dash-dot).
Needham et al. BMC Bioinformatics 2011, 12:374http://www.biomedcentral.com/1471-2105/12/374
Page 8 of 12

shared by 2 cores), presuming that the 2 threads strat-egy execute on cores that share a cache. Our hypothesisis that the default operating system scheduling of thethreads does not ensure this affinity. To confirm ourhypothesis, we add code to force thread affinity – eachthread is pinned to a particular core while ensuring thatthreads within a process share a cache and remainwithin a single chip when possible. The resulting perfor-mance, shown in Figure 3 and 5, corroborates ourhypothesis. The variance in performance is no longerobserved. Most of the efficiency gains from sharingacross threads is observed when using 2 threads, i.e.,when the parallelization matches the underlying physicalcharacteristics of the machine and leverages the sharedcache between 2 cores. Additional performance benefits
beyond 2 threads are small. More specifically, the 2, 4,and 8 threaded strategies show only small differences inperformance once the threads are pinned to ensurecache sharing. In Figure 3, the 8 threaded strategy is alittle better if the number of genes is between 3000 and7000. Otherwise, the 4 threaded strategy shows slightlybetter performance. These variations across differentnumbers of threads come from differences in load bal-ance at the Pthread and MPI parallelization levels.In Figures 4 and 5, we notice that the speedup curves
are not very smooth. This step function can be attribu-ted to several causes. The first is load imbalance due tothe granularity of workload distribution – permutationsat the MPI parallelization level and genes at the Pthreadparallelization level. When using 1 thread per MPI
●
●
●
●
●●
●
●
05
1015
2025
30
1 2 3 4 5 6 7 8
Number of quad core processors
Spe
edup
●
●
●
●
●●
●
●
●
●
●
●
●
●
●
●
●
●
●
●
●
●
●
●
● 1 thread2 threads4 threads8 threads
Figure 5 Speedup with pinned processes. Number of genes: 7000. Number of slides in each condition: 100. Number of permutations: 100.Numbers of MPI processes × threads: (number of cores) × 1 (solid), (number of cores/2) × 2 (dash), (number of cores/4) × 4 (dot), and (numberof cores/8) × 8 (dash-dot).
Needham et al. BMC Bioinformatics 2011, 12:374http://www.biomedcentral.com/1471-2105/12/374
Page 9 of 12
process to conduct 100 permutations, as one example,with 5 processors (20 cores), each core runs 5 permuta-tions (⌈100/20⌉). If we increase the number of proces-sors to 6 (24 cores), some cores will still execute 5permutations while others execute 4, so that executiontime remains proportional to ⌈100/24⌉ = 5, resulting inpractically no increase in speedup. As the number ofpermutations executed per MPI process decreases (withan increasing number of cores), the fraction of idle/wasted time on the cores with one less permutation toexecute increases, resulting in lower efficiency. In thecase of Figure 4, the increased scheduling variability andpoor choice of scheduling when adding a quad-core pro-cessor within a machine also contributes to the stepfunction in the 2 and 4 threaded curves. Once the sche-duling is made both deterministic and ensures
appropriate cache sharing, the step function is less pro-nounced in the multi-threaded runs in Figure 5 due totheir reduced memory bandwidth demands andsmoother load function at the MPI level.
ConclusionsMicroarray technology has made it possible for medicalresearchers to measure and study the behavior of thou-sands of genes at once. Technology advances have beenon a fast track in recent years, making it possible toconduct microarray experiments much faster and lessexpensive than in the past. This trend has been lever-aged with the availability of larger and larger datasets.Turning so much raw information into knowledge pre-sents a major challenge for both statistical analysis andcomputation. As of now, microarray data are used for
●
●
●
●
●
●
●
●
●
●
050
100
150
200
250
1000 2000 3000 4000 5000 6000 7000 8000 9000
Number of genes
Mem
ory
usag
e pe
r mac
hine
(MB
)● 1 thread
2 threads4 threads8 threads
Figure 6 Memory usage. Number of slides in each condition: 100. Number of permutations: 100. Numbers of MPI processes × threads: 32 × 1(solid), 16 × 2 (dash), 8 × 4 (dot), and 4 × 8 (dash-dot).
Needham et al. BMC Bioinformatics 2011, 12:374http://www.biomedcentral.com/1471-2105/12/374
Page 10 of 12
crude screening of differentially expressed genes.Exploiting the rich information contained in the inter-gene dependence structure has not become a routine,despite the availability of several gene association analy-sis procedures. This is largely due to the computingbottleneck.In this paper, we present a parallelized implementa-
tion of gene differential association analysis that isdesigned to leverage the features of today’s multicoreplatforms in which resources are shared among proces-sors at a much finer granularity than in the past. Weapply the conventional wisdom of parallelizing at thecoarsest granularity to distribute permutations amongthe nodes in a cluster, using MPI for communication. Inaddition, we parallelize at the finer granularity of per-gene computation within a single dual quad-coremachine using shared memory (Pthreads). Sharingmemory across threads helps reduce demand for theshared last-level cache capacity on the chip by allowingindependent threads to share a single copy of the geneexpression data. Our results show that this strategy uti-lizes the multicore cluster platform much more effec-tively. In general, the performance sweet spot occurswhen using a number of threads that allows the workingsets of the corresponding MPI processes to fit withinthe machine’s shared cache. We suggest that practi-tioners follow the principle of determining whatresources are shared when making decisions on how toallocate compute resources among MPI processes andthreads for their cluster machines. We believe that theprinciples of this hierarchical approach to parallelizationcan be utilized in the parallelization of other computa-tionally demanding kernels.
Availability and Requirements• Project name: Hierarchical Parallelization of GeneDifferential Association Analysis;• Project home page: http://www.urmc.rochester.edu/biostat/people/faculty/hu.cfm;• Operating system: Linux;• Programming language: Python and C++;• Other requirements: MPI (MPICH2 or Open MPI),Python, C++ Compilation tools, SWIG, Numpy,Pypar;• Licence: GNU GENERAL PUBLIC LICENSE, Ver-sion 2, June 1991;• No restrictions to use by non-academics.
AbbreviationsGDAA: Gene Differential Association Analysis; MTP: Multiple TestingProcedure; MPI: Message Passing Interface; Pthreads: POSIX Threads.
AcknowledgementsThis work was supported in part by NSF grants CCF-0702505, CNS-0411127,CNS-0615139, CNS-0834451, CNS-0509270, and CCF-1016902; and NIH grants
5 R21 GM079259-02, 1 R21 HG004648-01, and NCRR UL1 RR024160. Anyopinions, findings, and conclusions or recommendations expressed in thismaterial are those of the author(s) and do not necessarily reflect the viewsof the above-named organizations. In addition, we would like to thank Ms.Christine Brower for her technical assistance with computing and Ms. MaloraZavaglia for her proofreading effort. Finally we are grateful to the associatededitor and two anonymous reviewers for their constructive comments whichhelped us improve the manuscript.
Author details1Department of Computer Science, University of Rochester, PO Box 270226,Rochester, New York 14627, USA. 2Department of Biostatistics andComputational Biology, University of Rochester, 601 Elmwood Avenue Box630, Rochester, New York 14642, USA.
Authors’ contributionsThe basic idea was first proposed by RH, SD, and XQ. The detailed studydesign was developed by all members of the research team. MN carried outthe needed computations and simulations and the majority of the softwaredevelopment. All authors have read and approved the final manuscript.
Received: 28 January 2011 Accepted: 21 September 2011Published: 21 September 2011
References1. Klebanov L, Jordan C, Yakovlev A: A new type of stochastic dependence
revealed in gene expression data. Stat Appl Genet Mol Biol 2006, 5:Article7[http://dx.doi.org/10.2202/1544-6115.1189].
2. Bhardwaj N, Lu H: Correlation between gene expression profiles andprotein-protein interactions within and across genomes. Bioinformatics2005, 21(11):2730-2738[http://dx.doi.org/10.1093/bioinformatics/bti398].
3. Mootha V, Lindgren C, Eriksson K, Subramanian A, Sihag S, Lehar J,Puigserver P, Carlsson E, Ridderstråle M, Laurila E, et al: PGC-1 α-responsivegenes involved in oxidative phosphorylation are coordinatelydownregulated in human diabetes. Nature genetics 2003, 34(3):267-273.
4. Subramanian A, Tamayo P, Mootha V, Mukherjee S, Ebert B, Gillette M,Paulovich A, Pomeroy S, Golub T, Lander E, et al: Gene set enrichmentanalysis: a knowledge-based approach for interpreting genome-wideexpression profiles. Proceedings of the National Academy of Sciences 2005,102(43):15545-15550.
5. Raychaudhuri S, Stuart J, Altman R: Principal components analysis tosummarize microarray experiments: application to sporulation timeseries. Pac Symp Biocomput 2000, 5:455-466.
6. Liu A, Zhang Y, Gehan E, Clarke R: Block principal component analysiswith application to gene microarray data classification. Statistics inmedicine 2002, 21(22).
7. Wang A, Gehan E: Gene selection for microarray data analysis usingprincipal component analysis. Statistics in medicine 2005, 24(13).
8. Eisen M, Spellman P, Brown P, Botstein D: Cluster analysis and display ofgenome-wide expression patterns. Proceedings of the National Academy ofSciences 1998, 95(25):14863-14868.
9. Törönen P, Kolehmainen M, Wong G, Castrén E: Analysis of geneexpression data using self-organizing maps. FEBS letters 1999,451(2):142-146.
10. Furey T, Cristianini N, Duffy N, Bednarski D, Schummer M, Haussler D:Support vector machine classification and validation of cancer tissuesamples using microarray expression data. 2000.
11. Brown M, Grundy W, Lin D, Cristianini N, Sugnet C, Furey T, Ares M,Haussler D: Knowledge-based analysis of microarray gene expressiondata by using support vector machines. Proceedings of the NationalAcademy of Sciences 2000, 97:262-267.
12. Bahar I, Atilgan AR, Erman B: Direct evaluation of thermal fluctuations inproteins using a single-parameter harmonic potential. Fold Des 1997,2(3):173-181.
13. Friedman N: Inferring cellular networks using probabilistic graphicalmodels. Science 2004, 303(5659):799-805[http://dx.doi.org/10.1126/science.1094068].
14. Opgen-Rhein R, Strimmer K: From correlation to causation networks: asimple approximate learning algorithm and its application to high-dimensional plant gene expression data. BMC Syst Biol 2007, 1:37[http://dx.doi.org/10.1186/1752-0509-1-37].
Needham et al. BMC Bioinformatics 2011, 12:374http://www.biomedcentral.com/1471-2105/12/374
Page 11 of 12
15. Li K: Genome-wide coexpression dynamics: theory and application.Proceedings of the National Academy of Sciences 2002, 99(26):16875-16880.
16. Lai Y, Wu B, Chen L, Zhao H: A statistical method for identifyingdifferential gene-gene co-expression patterns. Bioinformatics 2004,20(17):3146-3155[http://dx.doi.org/10.1093/bioinformatics/bth379].
17. Shedden K, Taylor J: Differential correlation detects complex associationsbetween gene expression and clinical outcomes in lungadenocarcinomas. Methods of Microarray Data Analysis IV 2005, 121-131.
18. Choi J, Yu U, Yoo O, Kim S: Differential coexpression analysis usingmicroarray data and its application to human cancer. Bioinformatics 2005,21(24):4348-4355.
19. Hu R, Qiu X, Glazko G, Klebanov L, Yakovlev A: Detecting intergenecorrelation changes in microarray analysis: a new approach to geneselection. BMC Bioinformatics 2009, 10:20[http://dx.doi.org/10.1186/1471-2105-10-20].
20. Hu R, Qiu X, Glazko G: A new gene selection procedure based on thecovariance distance. Bioinformatics 2010, 26(3):348-354[http://dx.doi.org/10.1093/bioinformatics/btp672].
21. Yeoh EJ, Ross ME, Shurtleff SA, Williams WK, Patel D, Mahfouz R, Behm FG,Raimondi SC, Relling MV, Patel A, Cheng C, Campana D, Wilkins D, Zhou X,Li J, Liu H, Pui CH, Evans WE, Naeve C, Wong L, Downing JR: Classification,subtype discovery, and prediction of outcome in pediatric acutelymphoblastic leukemia by gene expression profiling. Cancer Cell 2002,1(2):133-143.
22. Patterson D: The Trouble with Multicore Microprocessors. IEEE Spectrum2010, 28-32.
23. Szabo A, Boucher K, Carroll W, Klebanov L, Tsodikov A, Yakovlev A: Variableselection and pattern recognition with gene expression data generatedby the microarray technology. Mathematical Biosciences 2002, 176:71-98.
24. Szabo A, Boucher K, Jones D, Tsodikov AD, Klebanov LB, Yakovlev AY:Multivariate exploratory tools for microarray data analysis. Biostatistics2003, 4(4):555-567[http://dx.doi.org/10.1093/biostatistics/4.4.555].
25. Xiao Y, Frisina R, Gordon A, Klebanov L, Yakovlev A: Multivariate search fordifferentially expressed gene combinations. BMC Bioinformatics 2004,5:164[http://dx.doi.org/10.1186/1471-2105-5-164].
26. Klebanov L, Gordon A, Xiao Y, Land H, Yakovlev A: A permutation testmotivated by microarray data analysis. Computational Statistics and DataAnalysis 2005.
27. Gordon A, Glazko G, Qiu X, Yakovlev A: Control of the Mean Number ofFalse Discoveries, Bonferroni, and Stability of Multiple Testing. TheAnnals of Applied Statistics 2007, 1:179-190[http://projecteuclid.org/euclid.aoas/1183143734].
28. Message Passing Interface Forum: MPI: A Message-Passing InterfaceStandard, Version 2.2. 2009 [http://www.mpi-forum.org/docs/].
29. Barney B: POSIX Threads Programming. 2011 [https://computing.llnl.gov/tutorials/pthreads/].
doi:10.1186/1471-2105-12-374Cite this article as: Needham et al.: Hierarchical Parallelization of GeneDifferential Association Analysis. BMC Bioinformatics 2011 12:374.
Submit your next manuscript to BioMed Centraland take full advantage of:
• Convenient online submission
• Thorough peer review
• No space constraints or color figure charges
• Immediate publication on acceptance
• Inclusion in PubMed, CAS, Scopus and Google Scholar
• Research which is freely available for redistribution
Submit your manuscript at www.biomedcentral.com/submit
Needham et al. BMC Bioinformatics 2011, 12:374http://www.biomedcentral.com/1471-2105/12/374
Page 12 of 12