hidden violence: how covid-19 school closures reduced the
TRANSCRIPT

Hidden Violence:
How COVID-19 School Closures Reduced
the Reporting of Child Maltreatment
Francisco Cabrera-Hernandez and Maria Padilla-Romo
July 2020
WORKING PAPER #2020-02
WORKING PAPER SERIES
DEPARTMENT OF ECONOMICS
HASLAM COLLEGE OF BUSINESS
http://econ.bus.utk.edu

Hidden Violence:How COVID-19 School Closures
Reduced the Reporting of Child Maltreatment
Francisco Cabrera-HernandezMarıa Padilla-Romo∗
July 2020
Abstract
This study examines how school closures during the COVID-19 pandemic affectedthe reporting of child maltreatment in Mexico City. We use a rich panel dataset onincident-level crime reports and victim characteristics and exploit the differential effectsbetween school-age children and older individuals. While financial and mental distressdue to the COVID-19 pandemic may result in additional cases of child maltreatment,synthetic control and difference-in-differences estimations document an average reduc-tion in child maltreatment reports of 21% and 30%, respectively, with larger reductionsamong females and in higher-poverty municipalities. These results highlight the im-portant role education professionals in school settings play in the early detection andreporting of domestic violence against school-age children.
Keywords: Child maltreatment; Domestic Violence; COVID-19; School closures.
JEL classification: I29, I31, J12
∗Cabrera-Hernandez is an Assistant Professor at University of Monterrey, Department of Economics, anda Research Fellow at the Center for Institutional Studies, Higher School of Economics, Russian Federation;and Padilla-Romo is an Assistant Professor at The University of Tennessee, Department of Economics.Contact at: [email protected], [email protected]. We thank Emily Pratt and colleagues at the Center forInstitutional Studies for helpful feedback on earlier versions of this paper.

1 Introduction
The proportion of children who report being victims of physical, sexual, or psychological
violence is large. According to data from the Mexican Survey on Households’ Dynamics
(ENDIREH, 2016), 26% of teenagers ages 15-18 reported having been victims of maltreat-
ment during childhood: 20.4% physical, 10.5% psychological, and 5.5% sexual violence.
Moreover, according to the National Survey on Children and Women (ENIM, 2015), 63% of
children between the ages of 1 and 14 were subjected to at least one form of psychological
or physical punishment by members of their household, among whom 11% were subjected
to severe physical punishment.
In addition to having short-term detrimental effects on children’s health and well-being
and, more broadly, the societal costs of law enforcement and providing care for its victims,
violence on children has been shown to have long-lasting consequences. Child maltreatment
victims are more likely to commit a crime, be unemployed, and be welfare-dependent during
adulthood (Zielinski, 2009; Currie and Tekin, 2012).1 Evidence also shows that child mal-
treatment reduces victims’ education level and lifetime earnings (Currie and Spatz Widom,
2010) in addition to exerting other negative spillovers. For example, Carrell, Hoekstra, and
Kuka (2018) show that being exposed to one peer victim of domestic violence in a class of
25 students during elementary school, reduces earnings at ages 24-28 by 3 percent.
As such, early detection is essential to mitigating the negative consequences of child
maltreatment on both child development and on future economic outcomes. Yet, factors
1Child maltreatment is also associated with increased underage drinking and drug use (Vandermindenet al., 2019).
2

that drive abuse detection and reporting remain understudied. Recent evidence suggests
that educators in school settings may play an important role in detecting and reporting
cases of child maltreatment, since most children spend a large part of their day at school.
For example, Fitzpatrick, Benson, and Bondurant (2020) provide evidence that education
professionals in the U.S. report cases that would have been otherwise missed, and thus,
school closures may have caused under-detection and under-reporting of domestic violence.
In this paper, we contribute to the literature on domestic violence by estimating the ef-
fects of COVID-19 related school closures on the reporting of child maltreatment. We argue
that the absence of educational professionals had a detrimental effect on its detection and
reporting. We do so by exploiting a rich panel of incident-level crime data—in particular on
domestic violence and child maltreatment—that comes from the reports of the Mexico City
Attorney General’s Office (Fiscalıa General de Justicia, FGJ). The data comprise informa-
tion regarding the crime’s location and date, and victim’s gender and age, between January
2019 and June 2020. With this information, we build a weekly municipality-gender-age group
panel of data which also includes information on people’s mobility from Googles’ Global Po-
sition System (GPS) reports and information on municipalities’ socioeconomic development
in order to explore heterogeneous effects for relatively poorer and richer municipalities.
We leverage these data and exploit the March 23, 2020 Mexico City school shutdown
in response to the COVID-19 pandemic as a natural experiment to estimate the impact of
school closures on the reporting of school-age child maltreatment using synthetic control
methods and a difference-in-differences research design. We first perform a synthetic control
3

estimation of the average effect of school closures on reports of domestic violence perpetrated
against school-age children (aged 3 to 15). For this, we use the number of reports during the
pre-treatment period for younger and older individuals to build a synthetic control group.2
Second, in order to consider seasonal changes, municipality-level and gender-level differ-
ences and to disentangle different heterogeneous effects, we conduct a difference-in-differences
strategy comparing weekly reports of domestic violence against school-age children within
a given municipality before and after school closures, with respect to a comparison group
comprised of individuals aged 16 to 21.3 Finally, we also estimate weekly event-study models
to examine the plausibility of the parallel trends assumption and to explore treatment effect
heterogeneity across time.
Most of the literature on reported crimes in developed and developing countries during
the COVID-19 stay-at-home policies has focused on the effects on Intimate Partner Violence
(IPV) and more specifically on reports of violence against women (Peterman et al., 2020). For
example, findings for the U.S. suggest an increase between 10% and 27% on domestic violence
reports (Boserup et al., 2020; Leslie and Wilson, 2020), while, in developing countries, the
literature suggests even larger impacts. Aguero et al. (2020) uses data from the helpline for
domestic violence in Peru and uses a differences-in-differences strategy. He finds that a one
standard deviation decrease in a Google-based mobility index doubles the number of calls.
2The donor pool contains younger and older individuals who are grouped as follows: 0-2 years old, andin five year gaps from 16 to 21 years old, 22 to 27 years old, up to the group aged 58-63. This way we haveenough cases and variation per age group-gender, and by week-municipality.
3We chose individuals 16 to 21 years old as a comparison group for three reasons: a) their potential tocontinue enrolled in formal education (approximately 50% of them), while being more likely to fill a reporton domestic violence themselves (i.e. 76% of the reports are filled by the victims vs. 1% in the case of schoolage children); b) the cumulative trend of domestic violence before school closures for this age group is similarto that for school-age children and c) after applying the synthetic controls strategy, the group of age 16-21receives 80.7% of the weight among the other eight age groups in the donor pool.
4

Similarly, Silverio-Murillo and de la Miyar (2020) exploits the bans on alcohol consumption
and the COVID-19 lockdowns across Mexico City to conduct an event-study analysis and
explore their effects on the number of calls to “Lınea Mujeres.”4 While the authors do not
find an overall effect on emergency calls, they report a 100% increase in calls looking for
psychological assistance.5
However, child maltreatment in most of the cases can only be formally reported by an
adult and not directly by the victim6 and in many cases, parents are the main perpetrators.
Therefore, the potential effects of the pandemic on the detection and reporting of child
maltreatment are not straight forward. On the one hand, the COVID-19 pandemic has
the potential to increase violence against children because of the increased time at home
and possible financial and psychological distress faced by parents. Indeed, previous research
suggests that increases in domestic violence could be explained by increased exposure to
perpetrators, and because of families’ worsened overall economic conditions related to lower
households’ income, increases in unemployment, and mass-layoffs (Cunradi et al., 2011;
Stephens-Davidowitz, 2013; Lindo et al., 2018).
On the other hand, the pandemic forced schools to close and so the reporting of child
maltreatment by education professionals may have decreased or ceased. In this regard,
Fitzpatrick, Benson, and Bondurant (2020) using variation in discontinuities in school-entry
laws and school calendars, provide evidence of an increase of 33 to 41 percent in the number
of child maltreatment reports by education professionals. This is observed at the beginning
4Lınea Mujeres is a call service operated by Mexico City’s government for reports of domestic violence.5Ravindran and Shah (2020) applies a similar strategy on emergency calls in India and find an increase
of 131% in domestic violence complaints in districts that faced the strictest lockdown measures.6In our data this is the case in 99% of child maltreatment reports.
5

and end of the academic year, as compared to the end and the beginning of summer-time,
when children are typically not in school. A natural question, then, is whether any potential
increase in child maltreatment due to the pandemic may have been dampened by decreased
reporting.
Our results from both synthetic control methods and difference-in-differences show an
average reduction of 21% and 30% on the reporting of child maltreatment, or a reduction of
7 to 10 cases from the average of 33 per week. Further difference-in-differences estimations
show that these effects are higher for females (a reduction of 66%, or 22 cases per week
from an average of 33) and in poorer municipalities (reduction of 40% or 14 cases less a
week, from an average of 34) with no discernible effects on male children or in wealthier
municipalities. The effects obtained with all methods are robust to different specifications
and placebo estimations and our event-study design offers evidence of similar pre-trends. In
sum, these effects suggest that 220 incidents of child maltreatment for school-age females
were not reported to the authorities in the 10 weeks after school closures. Moreover, this
likely represents a lower bound as child maltreatment potentially increased during this period
where abusers had more face-time with victims.
These findings contribute to the recent discussion regarding the effects of the COVID-
19 pandemic on domestic violence in developing countries, generally suggesting that the
inability to meet financial obligations and maintaining social ties has significantly increased
reported family stress and domestic violence Beland et al. (2020). However, we differentiate
from existing work by focusing on the less explored topic of child maltreatment after stay-at-
6

home policies were implemented. Moreover, we contribute to the debate on the importance
of education professionals reporting this shadowed violence by exploiting the timing of school
closures and by providing evidence from a broad set of models commonly used to examine
natural shocks. We also differentiate from the previous literature by exploiting the year-to-
year across groups of age comparison on reports classified by a judge as child maltreatment,
rather than on calls to helplines that may involve a broader and more heterogeneous type of
reports. Our contribution is important because while adult women in developing countries
are deeply vulnerable, violence against children could be hard to detect given that they need
of third-party adults to report.
Furthermore, our results of an overall reduction on the reporting of child maltreatment
in Mexico City are supported by previous findings for the U.S. suggesting that poor eco-
nomic conditions are associated to lower child maltreatment reports. For example, Stephens-
Davidowitz (2013) shows that observed reductions during the 2008 Great recession were not
due to actual decreases in maltreatment rates but rather large decreases in the reporting
rates caused by the economic downturn. By providing evidence on alternative proxies for
actual maltreatment rates, less likely to be affected by reporting rates, such as rates of child
mortality from neglect and Google searches related to maltreatment, the author suggests
that doubling unemployment increases child maltreatment from 10% to 24%, but decreases
reported child maltreatment incidents by 12.7%. Therefore, our findings are more likely a
proxy of a larger under-reporting for school-age children given school closures, rather than
an actual fall in child maltreatment cases. In this regard, in section 2, we also present de-
7

scriptive evidence showing that emergency calls to report child maltreatment in Mexico City
did not fall after school closures with respect to same weeks in 2019.
This paper directly complements research by Fitzpatrick et al. (2020) who exploit the
school-entry laws and school calendars discontinuities to show education professionals are
reporting cases that would have been missed otherwise. Our estimations are also in line
with recent work by Baron, Goldstein, and Wallace (2020) who test whether the number of
child maltreatment allegations in March and April 2020 in Florida, are uncharacteristically
high or low, relative to the number of allegations in the same months in other years of their
sample considering seasonal and secular trends. The authors show that the actual number
of reported allegations was approximately 27% lower than expected for these two months.
However, we strengthen this evidence with the inclusion of a control group, and a richer set
of fixed effects as controls that allow us to control for weekly seasonal effects and to exploit
variations across municipalities and for different subgroups of the population in a developing
country with high inequality.
The rest of the paper proceeds as follows. Section 2 presents the data we use as well as
some descriptive figures. Section 3 explains our identification strategy. Section 4 presents
the results. Section 5 draws conclusions.
2 Data
We use information on domestic violence victims reported to the Mexico City Attorney Gen-
eral’s Office (Fiscalıa General de Justicia, FGJ) from January 2019 to June 2020. These data
8

contain information on victim and crime characteristics. Specifically, they have information
on gender, age, type of crime, and location and date of occurrence. We keep information on
domestic violence reports and when they are reported and then aggregate these data weekly
at the municipality-age group-gender level.7
We define child maltreatment as domestic violence against school-age children (3 to 15
years). While we do not have information on the specific type of maltreatment, it is important
to note that civil judges are the ones in charge of classifying the crime reports as domestic
violence, based on legal criteria, and so making the overall group of crimes considered as
domestic violence on children, rather homogeneous. We also create 9 age groups, one for those
younger than school-age children (0 to 2 years) and group older individuals by 5-year gaps
in age: 16-21, 22-27 and so forth up to group 58-63 years old. This way we maintain enough
data and sufficient variation across time and within age groups. We combine these data with
population counts by municipality-age group-gender from Mexico’s 2015 Intercensal Survey.
We also use GPS (Global Position System) data reported by Google for Mexico City,
showing changes in mobility compared to a baseline of 10, set by Google in February 15,
2020. These data include mobility changes in retail, pharmacy and grocery shopping, public
transportation, recreation and visits to public spaces, as well as mobility in workplaces. For
presentation purposes, we build a mobility index averaging all categories, ranging from zero
(low mobility) to 10 (high mobility).
Additionally, we use the Social Development Index (SDI) calculated by Mexico City’s
7Mexico City has 16 local councils or “Alcaldıas” that act as local sub-regional governments with theirown socioeconomic and political characteristics. Formally, they act similarly to municipal governments.
9

Council for the Evaluation of Social Development (Evalua, in Spanish) to identify the mu-
nicipalities with the highest socioeconomic development or in the top quartile.8 This index
gathers information on households’ infrastructure conditions, access to the dwelling, access
to education, sanitation infrastructure, and access to electricity.9 In our panel, 24% of re-
ports of child maltreatment are concentrated in counties with a high SDI while 75% of the
victims across all age groups are females.10
Figure 1 shows the 7-day moving average trends of daily domestic violence reports, 30
days before and 70 days after the COVID-19 pandemic related preschool, primary, and
secondary school closures on March 23, 2020, when the state-mandated stay-at-home order
began, and for the same period in 2019.11 We show trends for (a) school-age children (3-15)
and for the three age groups immediately following school-age (b) individuals aged 16-21
(c) 22-27 and (d) 28-33. While reports of domestic violence decreased for all groups of age,
with respect to 2019, Panel (a) shows that the weekly average reports for school-age children
sharply decreased after schools closed, in comparison with their own tendency in 2019 and
respect to older individuals in panels (b)-(d).
Note that, trends in domestic violence reports for older groups tend to fall at a lower
rate than for school-age victims, closely related to the overall change in mobility across the
city, which started to fall on March 13, 2020, when GPS tracking suggests people started to
8This index is published in Mexico City’s official gazette on March 4, 2016 and can be found in:https://evalua.cdmx.gob.mx.
9The top quartile identifies four municipalities as the most advantaged: Cuauhtemoc, Miguel Hidalgo,Coyoacan, and Benito Juarez. These municipalities have historically been known for having good livingstandards, good access to services and lower crime rates.
10Proportions by age group can be consulted in the Annex Table A1.11The 7-day moving average is (3,1,3) or 3 days before the date, the actual date, and three days after.
10

spend more time at home. That is, 10-days before school closures and state-mandated social
distancing along with the closure of non-essential economic sectors. The fall in reports of
domestic violence comes despite the criminal justice system being deemed an essential sector
to continue operating during the COVID-19 related closures. Importantly, the reports of
domestic violence during this period never returned to their pre-social distancing/school
closures levels, nor to the trends observed in 2019, suggesting that general under-reporting
of domestic violence will potentially last while social distancing prevails.
Finally, Figure 2 shows the number of emergency calls made by women, to report child
maltreatment (against individuals younger than 18 years old).12 This includes the 911 emer-
gency line and “Lınea Mujeres,” a domestic violence hotline operated by Mexico City’s
government. Note that after school closures, call volume does not fall with respect to the
previous year, suggesting that the violence reported from home, as opposed to through school
teachers or officials, remained constant. This contrasts with the fall for school-age children
in cases reported to the authorities.
3 Empirical Strategy
We exploit the March 23, 2020 Mexico City school shutdown as a natural experiment and
estimate the impact of school closures on the reporting of child maltreatment using synthetic
control methods and a difference-in-differences research design.
Note that if we compare reports of child maltreatment before and after school closures,
12The dataset only contains information regarding the age of the caller but it does not contain details onthe age of the victim, for which we cannot separate by age of the victim.
11

we would not consider seasonal changes and teachers’ potential involvement. To account for
this possibility and for municipality level differences within Mexico City, in our differences-
in-differences setting, we compare weekly reports of domestic violence perpetrated against
school-age children (age 3 to 15) within a given municipality before and after schools closed,
relative to the same measure in the previous year (2019), and with respect to a comparison
group comprised of individuals aged 16 to 21 years.
We chose individuals aged 16 to 21 years as a comparison group for three reasons. First,
like their treatment group counterparts, they are likely to attend school but are less likely
to dependent on third parties to file domestic violence reports on their behalf.13 Second, the
16-21 year old group saw similar trends in reporting prior to the school closure date. Third,
the 16-21 year-old age group made up just over 80 percent of the synthetic counterfactual.
Hence, we first use the synthetic control method introduced by Abadie, Diamond, and
Hainmueller (2010) to estimate the effects of school closures on child maltreatment reports.
This method uses pre-intervention data to create a [synthetic] control group similar in out-
comes to the treatment group. We use all nine age groups as potential donors and estimate
the average effect on the treated group of school-age children. That is, the estimate for the
[synthetic] counterfactual for child maltreatment reports is ΣjωjYjwy, where ωj is the weight
assigned to the donor age group j and is calculated by minimizing the distance between
the observed number of child maltreatment reports (Yi) and ΣjωjYjwy for all pre-treatment
13In our data, 98.8% of the domestic violence reports for school-age children are filled by a third party,while for the group of age 16 to 21, 76% of the reports are filled by the victim and 24% by a third party.
12

periods. We also present placebo graphical evidence assigning all control age groups as
“treated.”
We then focus on the difference-in-differences setup comparing school-age children to the
group of individuals aged 16-21 years. We define weeks as Monday to Sunday such that school
closures relate to the same week (13) in both years, 2019 and 2020, to be able to control
for seasonal changes. Additionally, to consider the count nature of our child maltreatment
data and the large number of zeroes, we estimate a fixed effects Poisson regression model by
Pseudo Maximum Likelihood (PPML).14 Specifically, we rely on Correia, Guimaraes, and
Zylkin (2020)’s addition of the ppmlhdfe command to Stata, which allows the inclusion of
multiple high-dimensional fixed effects. Our Poisson regression model is given by:
Maltreatmentmgwy = exp[αm + γwy + θSchoolAgea + δSchoolAgea ×Closurewy]umgwy (1)
where Maltreatmentmgwy is the number of domestic violence reports in municipality m, for
age group g, in week-of-the-year w in year y; αm are municipality fixed effects that allow us
to control for time-invariant differences between municipalities; γyw are week-by-year fixed
effects that control for secular trends of domestic violence. SchoolAgea is an indicator vari-
able that equals one for school-age children (3-15 years); Closurewy is an indicator variable
that equals one after schools closed in week 13 of year 2020, and zero otherwise; and umgwy
is an error term which we allow to be correlated within municipalities-by-gender. We also
14On average, 41% of the municipality-week-age group-gender combinations have zero reports of domesticviolence.
13

include an exposure variable in our model—the population in each municipality-age group-
gender combination—to allow the counts of domestic violence reports to be comparable. The
coefficient of interest is δ and it measures the effects of school closures on child maltreatment
reports.
Additionally, in order to consider potential variation across municipalities and week-
years which could result in different levels of domestic violence and seasonal trends, in our
preferred specification we include a set of fixed effects as controls, including sex of the
victim and municipality-specific year and week-of-the-year fixed effects. Municipality-by-
year fixed effects aim to control for within-municipality differences in reports of domestic
violence from one year to the other; municipality-by-week fixed effects would control for
municipality-specific seasonal trends. Finally, to capture first-order trends in the number of
reports within each municipality and within each gender, in some specifications, we include
municipality-specific and gender-specific linear time trends.
For δ to have a causal interpretation, we must assume that reporting trends would not
differ between school-age children and older victims of domestic violence absent school clo-
sures. We provide graphical and empirical evidence supporting this assumption. In Figure
3, we show the cumulative number of reports across days in 2020 for school-age children and
for age group 16 to 21. The reporting gap between school-age children and older individuals
remains stable before schools closed. The trends for all groups begin to diverge after school
closures, but the reduction in growth seems stronger for school-age children compared to
individuals aged 16 to 21, suggesting that school closures affected more the reporting of
14

violence for school-age children. We also provide evidence of no differences in pre-treatment
trends in an event-study setting. However, we note that it is possible that maltreatment
increased after schools shutdown and thus, and regardless of the method, our estimates can
be considered as a lower bound of the true effects.
Finally, we estimate weekly event-study models to examine the plausibility of the parallel
trends assumption and to explore treatment effect heterogeneity across time. The estimated
effects are relative to the differences in maltreatment reported seven or more weeks before
school closed. The models also include the set of dummies in Equation 1 that include
municipality seasonal and secular trends, making this specification a within-municipality
comparison of weekly reports in 2020 relative to 2019 and to the age group 16-21 years.
4 Results
To motivate the use of our difference-in-differences research design, we begin the analysis
by showing the estimated effects of school closures on child maltreatment reports using a
synthetic control method, which allows us to identify a data-driven control group and to shed
light on the size and robustness of our results. We then use age group 16-21 as a control
group in a difference-in-differences framework and explore treatment effect heterogeneity
across time, gender, and municipalities’ social development.
15

4.1 Synthetic Control Method
Panel (a) in Figure 4 shows the trends of weekly domestic violence reports for school-age
children and its synthetic counterpart. The matching was based on pre-treatment outcomes
(before week 65, where week 1 is January 1, 2019). The predictors are the observed number
of domestic violence reports for all age groups before school closures. The synthetic control
group is comprised of age groups 16-21 (80.7%) and 40-45 years (19.3%). The differences
presented in Panel (b) imply a weekly reduction of 8.36 reports from an average of 39.6
reports per week or an average reduction of 21%. We also calculated a permutation based p-
value (< 0.001) that uses the ranking of school-age children’s reports relative to the placebo
age groups after school closures.15
To support the main findings from the synthetic control approach, Figure 5 shows a series
of estimated effects as if all age groups in the donor pool were treated or affected by school
closures. The gray lines show the difference in domestic violence reports between each age
group in the donor pool and its respective synthetic counterpart while the blue line shows
the difference between school age children and its synthetic version. The results indicate that
during the first few weeks after school closed, the estimated effect for school-age children
is unusually large relative to the distribution of changes after treatment for the other age
groups in the donor pool.
15That is, after assigning treatment to all the other (control) groups of age and comparing these to anestimated synthetic control for each case, no other comparison showed a reduction in reports at least as bigas the one presented for school-age children.
16
4.2 Difference-in-Differences
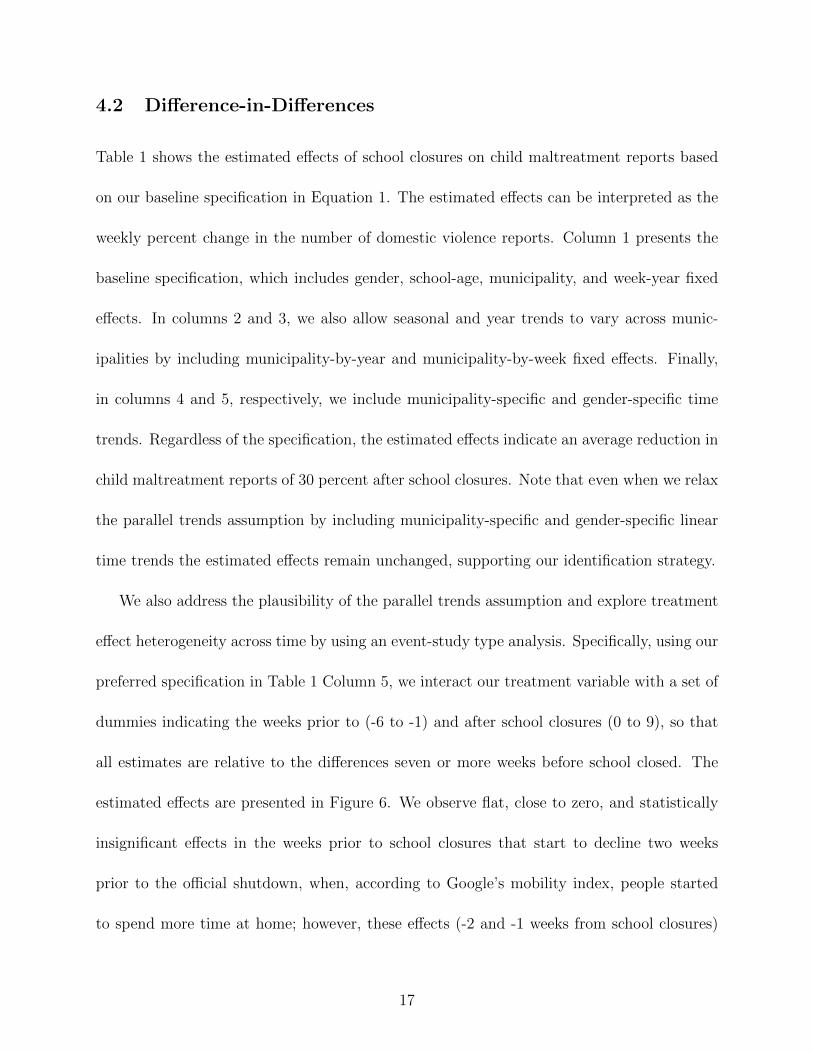
Table 1 shows the estimated effects of school closures on child maltreatment reports based
on our baseline specification in Equation 1. The estimated effects can be interpreted as the
weekly percent change in the number of domestic violence reports. Column 1 presents the
baseline specification, which includes gender, school-age, municipality, and week-year fixed
effects. In columns 2 and 3, we also allow seasonal and year trends to vary across munic-
ipalities by including municipality-by-year and municipality-by-week fixed effects. Finally,
in columns 4 and 5, respectively, we include municipality-specific and gender-specific time
trends. Regardless of the specification, the estimated effects indicate an average reduction in
child maltreatment reports of 30 percent after school closures. Note that even when we relax
the parallel trends assumption by including municipality-specific and gender-specific linear
time trends the estimated effects remain unchanged, supporting our identification strategy.
We also address the plausibility of the parallel trends assumption and explore treatment
effect heterogeneity across time by using an event-study type analysis. Specifically, using our
preferred specification in Table 1 Column 5, we interact our treatment variable with a set of
dummies indicating the weeks prior to (-6 to -1) and after school closures (0 to 9), so that
all estimates are relative to the differences seven or more weeks before school closed. The
estimated effects are presented in Figure 6. We observe flat, close to zero, and statistically
insignificant effects in the weeks prior to school closures that start to decline two weeks
prior to the official shutdown, when, according to Google’s mobility index, people started
to spend more time at home; however, these effects (-2 and -1 weeks from school closures)
17

are not statistically significant at conventional levels. The estimated effects on the weeks
after schools closed are mostly negative and statistically significant, especially in the first
few weeks after schools closed. Together, these results support our difference-in-differences
identification strategy and show heterogeneous effects across time.
We provide further evidence favoring the validity of our difference-in-differences findings
by conducting the same set of regressions on older individuals that should not be affected
by school closures. In other words, if the reduction on the reports of domestic violence for
school-age children is not related to teachers and school officials’ actions, and relates instead
to other unobserved factors not captured by our model, the same reductions could potentially
be observed for other age groups. Panel A in Table 2 show the same specifications presented
in Table 1 but the treatment is assigned to the group aged 22 to 27 (compared to the same
control group 16 to 21). Note that, regardless of the specification, all the coefficients are
close to zero and non-significant. Panel B shows the same for the group of age 28 to 33
showing an effect with the opposite sign, closer to zero and significant only at the 10% level,
offering support to our main findings.
4.3 Treatment Effect Heterogeneity
In recent years, Mexico has seen a surge in female violence to the extent that, according to
the UN-Women, 10 females are murdered every day across the country. Systemic violence
against women may well have its roots at home and from early ages and this could have
been exacerbated by stay-at-home policies. Similarly, one can think that lower socioeco-
18

nomic sectors, with higher levels of informality and less access to social protection, could be
more vulnerable to the economic shocks caused by the COVID-19 pandemic. Consequently,
economically disadvantaged people could suffer higher psychological and economic distress
that could increase general levels of violence, including child maltreatment.
In this section, we explore treatment effect heterogeneity by victims’ gender and by mu-
nicipalities’ socioeconomic conditions. In particular, we estimate the effects of school closures
on child maltreatment reports separately for males and for females and for individuals in
poorer (bottom three quartiles of the Social Development Index) and richer municipalities
(top quartile), using our preferred specification in Table 1 Column 5 and interacting the
variable of interest with a set of dummies that allow for different slopes for males and fe-
males and for relatively richer and poorer municipalities. The estimated effects are shown
in Table 3. Column 1 presents the overall effect. In columns 2 and 3, we show the estimated
effects, respectively, for females and for males. Finally, in columns 4 and 5, we present the
estimated effects for poorer and richer municipalities, respectively. The results indicate a
significantly larger reduction on the reporting of domestic violence for school-age females of
67 percent and of 42 percent in poorer environments with no discernible effects on males nor
on relatively richer municipalities.
5 Discussion of Results
This paper provides early evidence on the effects of COVID-19 school closures on the re-
porting of child maltreatment. Estimates from synthetic control and difference-in-differences
19

methods, respectively, show that child maltreatment reports decreased by 21 and 30 percent
after schools closed on March 23, 2020. We argue that this decline is due to a reduction in
reports by education professionals. The estimated decline in maltreatment reports is larger
for women and in poorer municipalities.
This results are in line with recent evidence suggesting that poor economic conditions and
COVID-19 school closures are related to lower reported violence against children (Stephens-
Davidowitz, 2013; Baron et al., 2020), and contribute to the scarce evidence highlighting the
importance of education professionals on detecting and reporting violence on children that
otherwise would have been missed (Fitzpatrick et al., 2020). Our results in a highly unequal
setting, also shed light on the importance of third party adults on the reporting of child
maltreatment to the authorities, the problem of under-detection, and how education profes-
sionals could be key on reporting maltreatment in more vulnerable settings and for female
children. Finally, our heterogeneous effects showing that under-reporting in the context of
school closures is higher for females suggest a normalization of violence towards women in a
home environment since early ages, and the need of policies for identifying and reporting of
such crimes.
20

References
Abadie, A., A. Diamond, and J. Hainmueller (2010): “Synthetic control methods for compar-
ative case studies: Estimating the effect of california’s tobacco control program,” Journal
of the American statistical Association, 105, 493–505.
Aguero, J. M. et al. (2020): “Covid-19 and the rise of intimate partner violence,” Technical
report.
Baron, E. J., E. G. Goldstein, and C. T. Wallace (2020): “Suffering in silence: How covid-19
school closures inhibit the reporting of child maltreatment,” Available at SSRN 3601399.
Beland, L.-P., A. Brodeur, and T. Wright (2020): “Covid-19, stay-at-home orders and em-
ployment: Evidence from cps data,” .
Boserup, B., M. McKenney, and A. Elkbuli (2020): “Alarming trends in us domestic violence
during the covid-19 pandemic,” The American Journal of Emergency Medicine.
Carrell, S. E., M. Hoekstra, and E. Kuka (2018): “The long-run effects of disruptive peers,”
American Economic Review, 108, 3377–3415.
Correia, S., P. Guimaraes, and T. Zylkin (2020): “Fast poisson estimation with high-
dimensional fixed effects,” The Stata Journal, 20, 95–115.
Cunradi, C. B., C. Mair, W. Ponicki, and L. Remer (2011): “Alcohol outlets, neighborhood
characteristics, and intimate partner violence: ecological analysis of a california city,”
Journal of Urban Health, 88, 191–200.
21

Currie, J. and C. Spatz Widom (2010): “Long-term consequences of child abuse and neglect
on adult economic well-being,” Child maltreatment, 15, 111–120.
Currie, J. and E. Tekin (2012): “Understanding the cycle childhood maltreatment and future
crime,” Journal of Human Resources, 47, 509–549.
Fitzpatrick, M. D., C. Benson, and S. R. Bondurant (2020): “Beyond reading, writing, and
arithmetic: The role of teachers and schools in reporting child maltreatment,” Technical
report, National Bureau of Economic Research.
Leslie, E. and R. Wilson (2020): “Sheltering in place and domestic violence: Evidence from
calls for service during covid-19,” Available at SSRN 3600646.
Lindo, J. M., J. Schaller, and B. Hansen (2018): “Caution! men not at work: Gender-
specific labor market conditions and child maltreatment,” Journal of Public Economics,
163, 77–98.
Peterman, A., A. Potts, M. O’Donnell, K. Thompson, N. Shah, S. Oertelt-Prigione, and
N. van Gelder (2020): “Pandemics and violence against women and children,” Center for
Global Development working paper, 528.
Ravindran, S. and M. Shah (2020): “Unintended consequences of lockdowns: Covid-19 and
the shadow pandemic,” Technical report, National Bureau of Economic Research.
Silverio-Murillo, A. and J. R. B. de la Miyar (2020): “Families under confinement: Covid-19,
domestic violence, and alcohol consumption,” .
22

Stephens-Davidowitz, S. (2013): “Unreported victims of an economic downturn,”
Retrieved from Seth Stephens-Davidowitz website: https://static. squarespace.
com/static/51d894bee4 b01caf88ccb4f3, 51, 13731493.
Vanderminden, J., S. Hamby, C. David-Ferdon, A. Kacha-Ochana, M. Merrick, T. R. Simon,
D. Finkelhor, and H. Turner (2019): “Rates of neglect in a national sample: Child and
family characteristics and psychological impact,” Child abuse & neglect, 88, 256–265.
Zielinski, D. S. (2009): “Child maltreatment and adult socioeconomic well-being,” Child
abuse & neglect, 33, 666–678.
23

Figure 1: Domestic Violence Reports by Age Group: 2019-2020
(a) School-Age (3-15) Children
05
1015
Num
ber o
f Rep
orts
-30 -20 -10 0 10 20 30 40 50 60 70Days from School Closure
2019 2020Mobility Index 0-10
(b) Age 16-21
05
1015
Num
ber o
f Rep
orts
-30 -20 -10 0 10 20 30 40 50 60 70Days from School Closure
2019 2020Mobility Index 0-10
(c) Age 22-27
05
1015
Num
ber o
f Rep
orts
-30 -20 -10 0 10 20 30 40 50 60 70Days from School Closure
2019 2020Mobility Index 0-10
(d) Age 28-33
05
1015
Num
ber o
f Rep
orts
-30 -20 -10 0 10 20 30 40 50 60 70Days from School Closure
2019 2020Mobility Index 0-10
Notes: Each panel shows the 7-day moving average (3,1,3) of domestic violence reports for each age group and for the mobility index, with a base of
10 that is set on February 15, 2020.
24
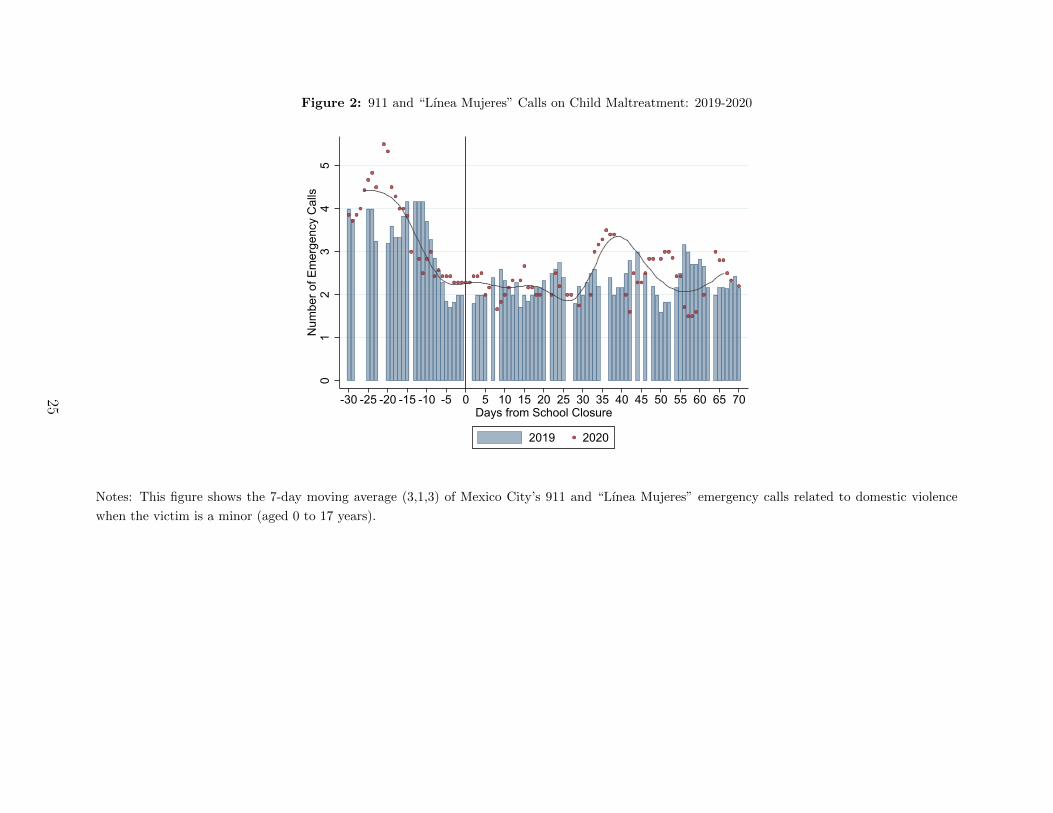
Figure 2: 911 and “Lınea Mujeres” Calls on Child Maltreatment: 2019-2020
01
23
45
Num
ber o
f Em
erge
ncy
Cal
ls
-30 -25 -20 -15 -10 -5 0 5 10 15 20 25 30 35 40 45 50 55 60 65 70Days from School Closure
2019 2020
Notes: This figure shows the 7-day moving average (3,1,3) of Mexico City’s 911 and “Lınea Mujeres” emergency calls related to domestic violence
when the victim is a minor (aged 0 to 17 years).
25

Figure 3: Cumulative Number of Domestic Violence Reports by Age Group
250
350
450
550
650
750
Rep
orts
of D
omes
tic V
iole
nce
-30 -25 -20 -15 -10 -5 0 5 10 15 20 25 30 35 40 45 50 55 60 65 70Days from School Closure
School-Age Children Age 16-21
Notes: This figure shows the cumulative number of domestic violence reports 30 days before and 70 dasy after schools closed separately for school-age
children and for individuals aged 16-21 years.
26

Figure 4: Estimated Effects of School Closures on Child Maltreatment Reports
(a) Synthetic Control Trends
010
2030
4050
6070
80R
epor
ts p
er W
eek
-40 -35 -30 -25 -20 -15 -10 -5 0 5 10Weeks from School Closure
School Age Children Synthetic Control
(b) Synthetic Control Differences
-20
-10
010
20Ef
fect
per
Wee
k
-40 -35 -30 -25 -20 -15 -10 -5 0 5 10Weeks from School Closure
Difference Treated vs. Synthetic Average
Notes: Estimated effects are generated using synthetic control methods. The matching is based on pre-
treatment outcomes (before week 65, where week 1 is set in January 1, 2019). The predictors are domestic
violence reports for all age groups. The synthetic control group is comprised of age groups 16-21 (80.7%)
and 40-45 years (19.3%). Permutation based p-value=0. The differences presented in Panel (b) imply an
average reduction of 8.36 reports per week (21%) from a baseline of 39.6 reports per week.
27

Figure 5: Placebo Synthetic Controls
-30
-20
-10
010
2030
Effe
ct p
er W
eek
-40 -35 -30 -25 -20 -15 -10 -5 0 5 10Weeks from School Closure
Notes: Estimated effects are generated using synthetic control methods. The matching is based on pre-
treatment outcomes (before week 65, where week 1 is set in January 1, 2019). The predictors are domestic
violence reports for all age groups. The synthetic control group for school-age children is comprised of age
groups 16-21 (80.7%) and 40-45 years (19.3%).
28

Figure 6: Event-Study Estimated Effects of School Closures on Child Maltreatment Reports
-2
-1.5
-1
-.5
0
.5
1
Estim
ated
Effe
cts
on R
epor
ts
-6 -5 -4 -3 -2 -1 0 1 2 3 4 5 6 7 8 9
Weeks from School Closure
Notes: All coefficients and their 95% confidence intervals come from an event-study specification that includes municipality, week-year, school age,
gender, municipality-year, and municipality-week fixed effects as well as municipality-specific and gender-specific time trends. All estimates are relative
to the difference in the number of reports seven or more weeks prior to school closures. Standard errors are clustered at the municipality-by-gender
level.
29
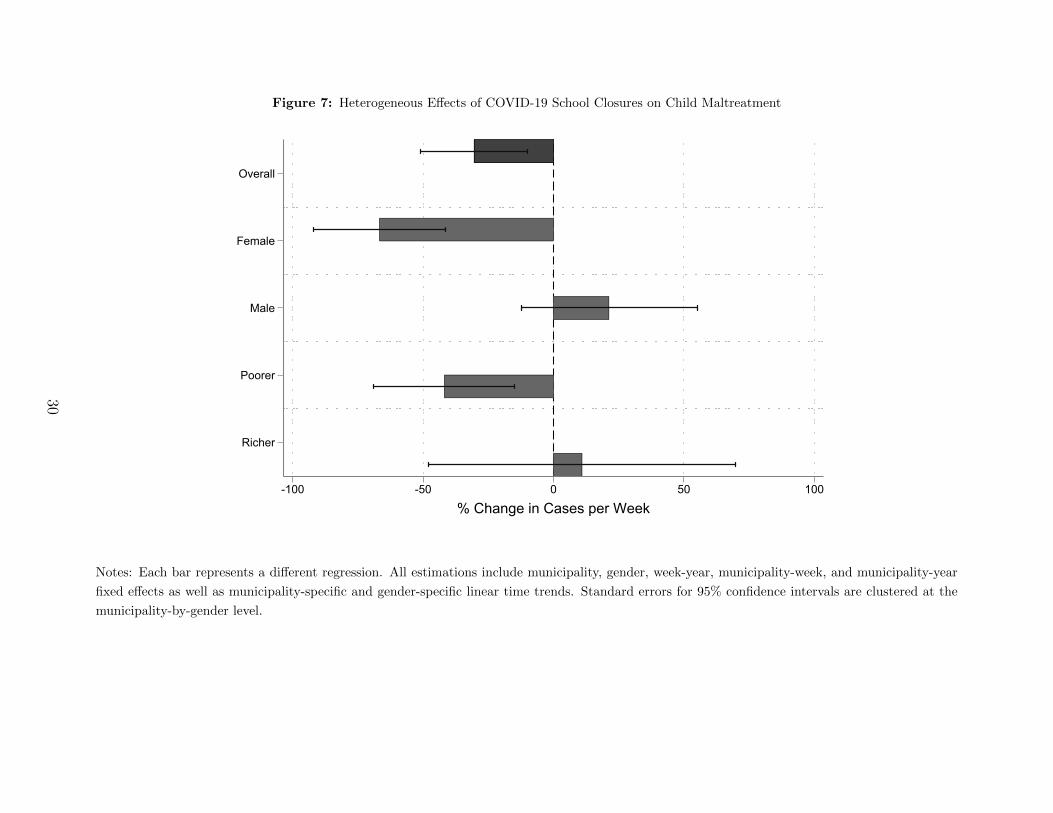
Figure 7: Heterogeneous Effects of COVID-19 School Closures on Child Maltreatment
Overall
Female
Male
Poorer
Richer
-100 -50 0 50 100
% Change in Cases per Week
Notes: Each bar represents a different regression. All estimations include municipality, gender, week-year, municipality-week, and municipality-year
fixed effects as well as municipality-specific and gender-specific linear time trends. Standard errors for 95% confidence intervals are clustered at the
municipality-by-gender level.
30

Table 1: Estimated Effects on Weekly Reports of Domestic Violence on School Age Children
(1) (2) (3) (4) (5)
School Age X Closure -0.301*** -0.303*** -0.305*** -0.305*** -0.305***(0.106) (0.105) (0.105) (0.105) (0.105)
R-squaredN 4736 4736 4612 4612 4612
Municipality-by-year No Yes Yes Yes YesMunicipality-by-week No No Yes Yes YesMunicipality-specific time trends No No No Yes YesGender-specific time trends No No No No Yes
Notes: Each column represents a different regression. All estimations include municipality, school
age, gender and week-year fixed effects. Standard errors in parentheses are clustered at the
municipality-by-gender level. Estimates are relative to age group 16-21.
*, **, *** Significant at the 10%, 5%, and 1% levels, respectively.
31

Table 2: Estimated Effects on Weekly Reports of Domestic Violence on Older Individuals
(1) (2) (3) (4) (5)
Panel A. Effects on Group of Age 22-27
Age 22-27 X Closure 0.096 0.099 0.103 0.103 0.103(0.065) (0.066) (0.067) (0.067) (0.067)
N 4736 4736 4676 4676 4676
Panel B. Effects on Group of Age 28-33
Age 28-33 X Closure 0.151* 0.153* 0.151* 0.151* 0.151*(0.088) (0.089) (0.090) (0.090) (0.090)
N 4736 4736 4700 4700 4700
Municipality-by-year No Yes Yes Yes YesMunicipality-by-week No No Yes Yes YesMunicipality-specific time trends No No No Yes YesGender-specific time trends No No No No Yes
Notes: Each column in each panel represents a different regression. All estimations include mu-
nicipality, sex and week-year fixed effects. Standard errors in parentheses are clustered at the
municipality-by-gender level. Estimates are relative to age group 16-21.
*, **, *** Significant at the 10%, 5%, and 1% levels, respectively.
32
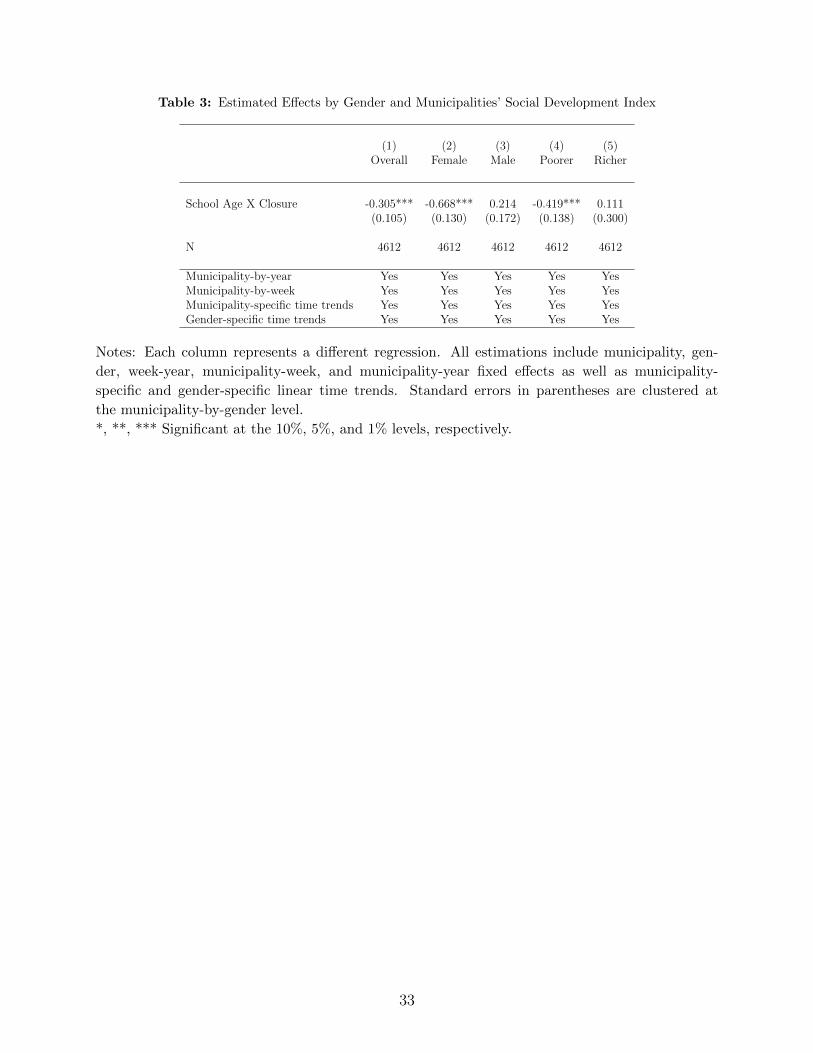
Table 3: Estimated Effects by Gender and Municipalities’ Social Development Index
(1) (2) (3) (4) (5)Overall Female Male Poorer Richer
School Age X Closure -0.305*** -0.668*** 0.214 -0.419*** 0.111(0.105) (0.130) (0.172) (0.138) (0.300)
N 4612 4612 4612 4612 4612
Municipality-by-year Yes Yes Yes Yes YesMunicipality-by-week Yes Yes Yes Yes YesMunicipality-specific time trends Yes Yes Yes Yes YesGender-specific time trends Yes Yes Yes Yes Yes
Notes: Each column represents a different regression. All estimations include municipality, gen-
der, week-year, municipality-week, and municipality-year fixed effects as well as municipality-
specific and gender-specific linear time trends. Standard errors in parentheses are clustered at
the municipality-by-gender level.
*, **, *** Significant at the 10%, 5%, and 1% levels, respectively.
33
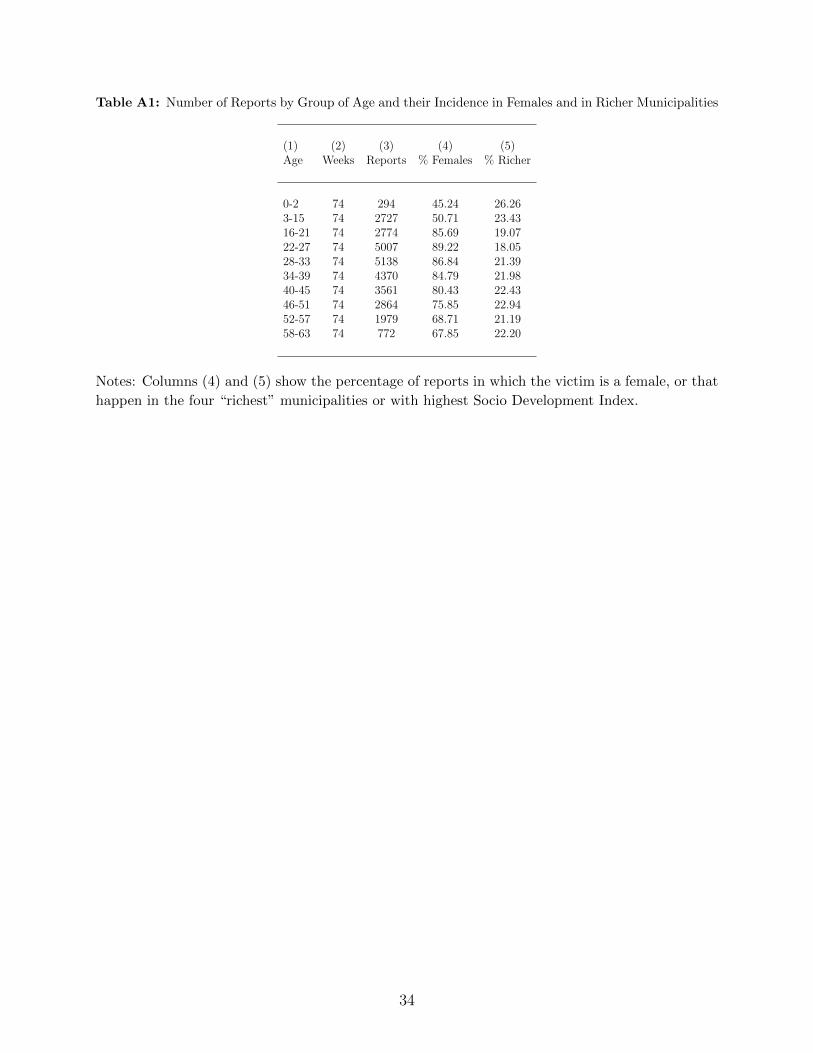
Table A1: Number of Reports by Group of Age and their Incidence in Females and in Richer Municipalities
(1) (2) (3) (4) (5)Age Weeks Reports % Females % Richer
0-2 74 294 45.24 26.263-15 74 2727 50.71 23.4316-21 74 2774 85.69 19.0722-27 74 5007 89.22 18.0528-33 74 5138 86.84 21.3934-39 74 4370 84.79 21.9840-45 74 3561 80.43 22.4346-51 74 2864 75.85 22.9452-57 74 1979 68.71 21.1958-63 74 772 67.85 22.20
Notes: Columns (4) and (5) show the percentage of reports in which the victim is a female, or that
happen in the four “richest” municipalities or with highest Socio Development Index.
34