hidden value in net operating losses (nols tax credits, and capitalized research and development...
TRANSCRIPT

Chris Senyek, CFA, CPA (646) 845-0759
Adam Calingasan, CFA, CPA (646) 845-0757
Clinton Chang, CFA, CPA (646) 845-0756
[email protected] This report is limited solely for the use of clients of Wolfe Research. Please refer to the DISCLOSURE SECTION located at the end of this report for Analyst Certifications and Other Disclosures. For important disclosures, please go to www.WolfeResearch.com/Disclosures or write to us at Wolfe Research, 420 Lexington Ave., Suite 648, New York, NY 10170.
WolfeResearch.com Page 1 of 23 Accounting & Tax Policy
ACCOUNTING & TAX POLICY CORPORATE ACTIONS / TAXES
May 7, 2013
HIDDEN VALUE IN NET OPERATING LOSSES (NOLS)
• One recurring theme we search for when reading through 10-Ks is hidden asset value on companies’ balance sheets. To that end, tax net operating loss carryforwards (“NOLs”) may be an overlooked balance sheet asset and have real economic value to either the standalone company or an acquiror. The existence of NOLs may also serve as a sign of a turnaround/restructuring company (e.g., post-bankruptcy companies) on which the stock market may place a higher value over time as consistent profitability returns/occurs. That is, the stock market may be ascribing a low current value to a company’s NOLs but as the company demonstrates its ability to monetize them, the NOLs will be afforded a higher value. In this report, we identify companies with material tax NOLs/credits as a means to find new investment ideas.
• Recent Stock Price Outperformance Expected to Continue: Among the 32 market themes we track, cos with large NOLs has been the best performing strategy in 2012 and 2013 year-to-date.
• NOL Research Findings: We analyzed over 700 NOL companies and found 194 with NOLs and tax credits at least 15% of their market capitalization. We manually accumulated this NOL information from 10-K’s, company-by-company.
• Top Tax NOL Stock Ideas: We find the most interesting NOL ideas at General Motors, KB Home, E*Trade, Rovi, and LSI Corp. This is based on using our company knowledge to find going concern businesses, a high NOL deferred tax asset balance, and an attractive stock valuation.
• Sector Information: The financial, consumer discretionary, and technology sectors comprise approximately 65% of the NOL companies analyzed. This isn’t surprising to us given the aftermath of the financial crisis and large start-up losses from products under development. Some companies are burning cash and likely value traps as we’ve noticed a number of repeat “offenders” in analyzing the data over the years.
• High NOL Companies by Sector: A detailed listing of all companies with NOLs and tax credits to market capitalization of 15% or greater is included, beginning on page 11.
• Large Capitalization NOL Companies: Larger cap companies ($5+ billion) with NOLs at least 20% of their current market capitalization include: General Motors, Delta Air Lines, AIG, Hewlett-Packard, United Continental, Calpine, CIT Group, Charter Communications, CMS Energy, MGM Resorts International, and Citigroup.

WolfeResearch.com Page 2 of 23 Accounting & Tax Policy May 7, 2013
WWHHAATT AARREE OOUURR TTOOPP TTAAXX NNEETT OOPPEERRAATTIINNGG LLOOSSSS IIDDEEAASS??
In discussing net operating losses (“NOLs”), we are often asked for our top NOL ideas on which investors may choose to do more fundamental work. Below is a narrowed list of NOL companies that we believe are the most interesting from an investment point of view where there are material tax NOL carryforwards along with a going concern, cash generative business, and reasonable stock valuation. This narrowed list is meant to be a supplement to the larger group of companies herein. NOL Companies: Interesting Ideas
Company Ticker Industry
Market Cap. ($ in
millions)
Debt(2) / Total
CapitalLTM FCF
Yield 2013E
P/E
NOLs & Tax Credits ($ in millions) (1)
NOLs & Tax Credits(1) /
Market Cap.Net Cash(2) / Market Cap.
General Motors GM Automobiles and Components 39,852 48% 4% 7.6x 26,326 66% NAKB Home KBH Consumer Durables and Apparel 1,708 53% -1% NM 612 36% NAE*TRADE Financial Corp. ETFC Diversified Financials 2,819 NA NA 17.3x 810 29% NMRovi Corp. ROVI Software and Serv. 2,228 40% 8% 7.7x 555 25% NALSI Corp. LSI Semis and Semi Eq. 3,355 0% 9% 11.1x 1,382 41% 20%
(1) Amount includes federal, state, and foreign NOLs, tax credit carryforwards, and capitalized R&D from companies’ 10-Ks and may have changed since last disclosure. (2) Adjusts net cash for “high risk” pension companies [companies with a score of 3 in our pension analyses] by adding the tax effected unfunded pension liability amounts to total debt. Note: Annual use of NOLs may be limited by IRC Section 382. 2013E P/E multiples based on consensus estimates. LTM FCF Yield calculated as cash from operations – capital expenditures + tax-adjusted interest expense / enterprise value. Market data as of 4/22/2013. Source: Wolfe Research Accounting & Tax Policy Research; Company filings; Bloomberg; Standard & Poor’s; FactSet. Throughout the remainder of this report, we discuss the following:
1. NOL sector overview [page 4]; 2. Companies with (NOLs + tax credits) to market capitalization > 15% [page 6]; 3. High tax NOL and net cash companies [page 10]; 4. Financial companies with large NOLs [page 11]; and 5. High tax NOL companies by sector [page 12].

WolfeResearch.com Page 3 of 23 Accounting & Tax Policy May 7, 2013
HHIIGGHH NNOOLL (($$11BB++ MMAARRKKEETT CCAAPP..)) CCOOMMPPAANNIIEESS OOUUTTPPEERRFFOORRMMEEDD IINN AAPPRRIILL AANNDD YYTTDD
In our monthly Key Themes: Chart Book report, we track the year-to-date share price performance of a basket of stocks relative to a sector neutral index return for our important themes. After being the best performing strategy that we tracked throughout 2012, high NOL companies are again materially outperforming their sector 2013 YTD. We continue to like this strategy for the remainder of 2013 as the market continues to ascribe more value to such companies’ tax assets. However, we would also caution investors to take into consideration their economic view, as this basket contains many cyclical stocks. YTD Relative Performance of the Top 50 Net Operating Loss Companies
-10%
-8%
-6%
-4%
-2%
0%
2%
4%
6%
8%
10%
1/1/13 1/15/13 1/29/13 2/12/13 2/26/13 3/12/13 3/26/13 4/9/13 4/23/13
Alph
a
Highest NOL CompaniesYTD Relative Return: 8.7%Apr. Relative Return: 2.6%
YTD Total Return: 21.3%Apr. Total Return: 5.1%
Note: This portfolio represents the highest 50 (NOL + Net Cash) / Market Cap. companies over $1B, measured against a sector neutral S&P 1500 benchmark. See May 1, 2013 Key Themes: Chart Book report for full list of constituent cos. Market data through 4/30/2013. Source: Wolfe Research Quantitative Research; Company filings; Bloomberg; Standard & Poor’s; FactSet.

WolfeResearch.com Page 4 of 23 Accounting & Tax Policy May 7, 2013
NNOOLLSS HHIIGGHHEESSTT IINN FFIINNAANNCCIIAALLSS,, CCOONNSSUUMMEERR DDIISSCCRREETTIIOONNAARRYY,, AANNDD TTEECCHHNNOOLLOOGGYY SSEECCTTOORRSS
Below is a chart depicting the sector breakout of high NOL companies. The top three sectors comprising the majority of NOL companies are financials (29%), consumer discretionary (21%), and technology (14%). NOL Breakout by Sector
Cons. Disc., 21%
Cons. Staples, 2%
Energy, 5%
Financials, 29%
Healthcare, 7%
Industrials, 9%
Info. Tech., 14%
Materials, 5%
Telecom., 4%Utilities, 4%
Note: Market data through 4/22/2013. Source: Wolfe Research Accounting & Tax Policy Research; Company filings; Bloomberg; Standard & Poor’s; FactSet.

WolfeResearch.com Page 5 of 23 Accounting & Tax Policy May 7, 2013
CCOOMMPPAANNIIEESS WWIITTHH LLAARRGGEE TTAAXX NNOOLLSS
On the following four pages, we list companies with NOLs and tax credit balances of 15% or greater than the company’s current market capitalization (last column on each page). We split our main list by market capitalization, the first list comprising companies with market capitalizations over $1 billion and the second list including companies with a market capitalization less than $1 billion. We manually accumulated each company’s NOL and tax credit amounts from the most recent 10-K tax footnote. Importantly, these amounts are the deferred tax asset amounts that would be used to reduce taxes (and not the tax deduction amount used to offset pre-tax income). The NOL tax deduction numbers used to offset pre-tax income would be higher, calculated as the NOL we’ve detailed, divided by the applicable corporate tax rate (35% in the U.S.). Points to Keep in Mind When Reviewing NOLs:
1. The NOL deferred tax asset amounts listed are not in present value terms. NOLs’ actual value is predicated on if, when, and how much is used by the existing (or another) company.
2. The NOL/tax credit amounts listed within this report are each company’s deferred tax asset amount from the 10-K footnote. It consists of the tax-effected combined federal, state, and foreign NOLs, tax credits, and capitalized research and development costs. It’s important to distinguish that $1 of tax loss carryforward NOL may be used to offset $1 of pre-tax income. The deferred tax asset amounts listed are the $1 tax loss NOL carryforward multiplied by the U.S. federal (or foreign/state income tax rates) statutory income tax rate of 35%, or $0.35. Excluding an acquisition scenario (discussed below), an NOL deferred tax asset value is usually lower than indicated (and listed in this report) since the deferred tax asset table amounts are not “present valued” based on expected utilization.
3. NOL deferred tax asset amounts may be very high relative to the company’s market cap., but
never fully utilizable/monetizable if:
a. Company is not a going concern, burning cash, and/or not expected to be profitable in the foreseeable future: If the company’s profitability never returns or profits aren’t high enough to fully utilize the accumulated NOL balance, it may expire due to a 20 year carryforward period allowed for U.S. NOLs. Furthermore, the significant use of NOLs in 15+ year future periods has a significantly lower net present value.
b. M&A scenario: The Internal Revenue Code (“IRC”) Section 382 NOL limitation rules (“anti-trafficking rules”) along with the 20 year carryforward period can substantially lower a company’s NOL value. The annual amount of acquired NOLs usable to offset pre-tax income is formulaic, equal to the company’s market capitalization (equity plus straight preferred) at the acquisition date multiplied by the monthly published long-term tax exempt rate (currently 2.70%). In certain cases, this explains why NOL amounts are very high relative to a company’s market capitalization. IRC Section 382 may stand in the way of allowing the acquiror to fully monetize them. Later in the Appendix of this report, we discuss advanced issues that arise in an acquisition of a company with NOLs.

WolfeResearch.com Page 6 of 23 Accounting & Tax Policy May 7, 2013
$$11++ BBIILLLLIIOONN MMAARRKKEETT CCAAPPIITTAALLIIZZAATTIIOONN CCOOMMPPAANNIIEESS WWIITTHH LLAARRGGEE TTAAXX NNOOLLSS
On the next several pages are companies with a NOL to market capitalization of at least 15% (below and on the next page are $1 billion+ market cap. companies). We also separately list if the company is currently in a net cash position (net cash to market cap.). $1 Billion+ Market Capitalization Companies with Large Amounts of NOLs/Tax Credits
Company Ticker Industry
Market Cap. ($ in
millions)
Debt(2) / Total
CapitalLTM FCF
Yield 2013E
P/E
NOLs & Tax Credits ($ in millions) (1)
NOLs & Tax Credits(1) /
Market Cap.Net Cash(2) / Market Cap.
Advanced Micro Devices, Inc. AMD Semis and Semi Eq. 1,764 54% -13% NM 2,202 125% NALevel 3 Communications Inc. LVLT Telecommunication Services 4,459 66% 3% 65.9x 4,611 103% NAResolute Forest Products RFP Materials 1,330 52% 9% 15.0x 1,229 92% NAJDS Uniphase Corp. JDSU Technology Hardware and Eq. 3,004 7% 4% 22.7x 2,436 81% 16%CIENA Corp. CIEN Technology Hardware and Eq. 1,485 49% 1% 90.0x 1,143 77% NAHarbinger Group Inc. HRG Household and Personal Products 1,218 76% 13% NM 914 75% NARite Aid Corp. RAD Food and Staples Retailing 2,223 73% 8% NM 1,656 74% NAGeneral Motors GM Automobiles and Components 39,852 48% 4% 7.6x 26,326 66% NAAOL, Inc. AOL Software and Services 2,912 4% 12% 21.2x 1,816 62% 12%MannKind Corp. MNKD Pharma & Biotech 1,160 22% -7% NM 706 61% NAGoodyear Tire & Rubber Co. GT Automobiles and Components 2,981 70% 2% 6.1x 1,792 60% NADynegy Inc. DYN Utilities 2,339 38% -3% NM 1,369 59% NACNO Financial Group, Inc. CNO Insurance 2,397 NA NM 9.5x 1,386 58% NMDelta Air Lines Inc. DAL Transportation 12,913 62% 5% 5.0x 6,816 53% NAMGIC Investment Corp. MTG Banks 1,685 NA NM NM 867 51% NMAvis Budget Group, Inc. CAR Transportation 3,013 76% 2% 8.5x 1,516 50% NAAlpha Natural Resources, Inc. ANR Energy 1,556 69% 6% NM 779 50% NAVisteon Corp. VC Automobiles and Components 2,847 17% 1% 14.5x 1,350 47% 10%Nabors Industries Ltd. NBR Energy 4,316 50% 3% 10.9x 1,937 45% NAPopular Inc. BPOP Banks 2,815 NA NA 9.4x 1,204 43% NMLSI Corp. LSI Semis and Semi Eq. 3,355 0% 9% 11.1x 1,382 41% 20%SandRidge Energy, Inc. SD Energy 2,199 66% -15% NM 902 41% NAUSG Corp. USG Capital Goods 2,663 46% 3% 57.5x 1,066 40% NANII Holdings Inc. NIHD Telecommunication Services 1,330 79% -11% NM 531 40% NARadian Group Inc. RDN Banks 1,848 NA NM NM 725 39% NMGenworth Financial Inc. GNW Insurance 4,620 NA NM 6.5x 1,735 38% NMKB Home KBH Consumer Durables and Apparel 1,708 53% -1% NM 612 36% NAAmerican Int'l Group, Inc. AIG Insurance 57,400 NA NM 10.4x 20,369 35% NMNavistar Int'l Corp. NAV Capital Goods 2,455 70% 6% NM 850 35% NAOffice Depot, Inc. ODP Retailing 1,086 38% 7% 36.0x 375 35% 1%Hewlett-Packard Co. HPQ Technology Hardware and Eq. 38,025 43% 17% 4.6x 13,042 34% NANektar Therapeutics NKTR Pharma & Biotech 1,268 10% -11% NM 411 32% 11%United Continental Holdings, Inc. UAL Transportation 10,179 56% -3% 6.4x 3,276 32% NACalpine Corp. CPN Utilities 9,601 53% 3% 25.8x 3,073 32% NASynovus Financial Corp. SNV Banks 1,992 NA NA 18.4x 636 32% NMCIT Group Inc. CIT Banks 8,413 NA NA 11.2x 2,567 31% NMKaiser Aluminum Corp. KALU Materials 1,125 25% 11% 14.4x 342 30% NACharter Communications Inc. CHTR Media 10,425 55% 3% NM 3,145 30% NAON Semiconductor Corp. ONNN Semis and Semi Eq. 3,274 24% 2% 14.3x 952 29% NAE*TRADE Financial Corp. ETFC Diversified Financials 2,819 NA NA 17.3x 810 29% NMLexicon Pharmaceuticals, Inc. LXRX Pharma & Biotech 1,123 2% -10% NM 320 29% 18%Cogent Communications Group Inc. CCOI Telecommunication Services 1,272 24% 4% 78.3x 348 27% NASears Holdings Corp. SHLD Retailing 4,913 49% -6% NM 1,327 27% NAChemtura CHMT Materials 1,936 31% 5% 12.4x 488 25% NA
(1) Amount includes federal, state, and foreign NOLs, tax credit carryforwards, and capitalized R&D from companies’ 10-Ks and may have changed since last disclosure. (2) Adjusts net cash for “high risk” pension companies [companies with a score of 3 in our pension analyses] by adding the tax effected unfunded pension liability amounts to total debt. Note: Annual use of NOLs may be limited by IRC Section 382. 2013E P/E multiples based on consensus estimates. LTM FCF Yield calculated as cash from operations – capital expenditures + tax-adjusted interest expense / enterprise value. Market data as of 4/22/2013. Source: Wolfe Research Accounting & Tax Policy Research; Company filings; Bloomberg; Standard & Poor’s; FactSet.
WolfeResearch.com Page 7 of 23 Accounting & Tax Policy May 7, 2013
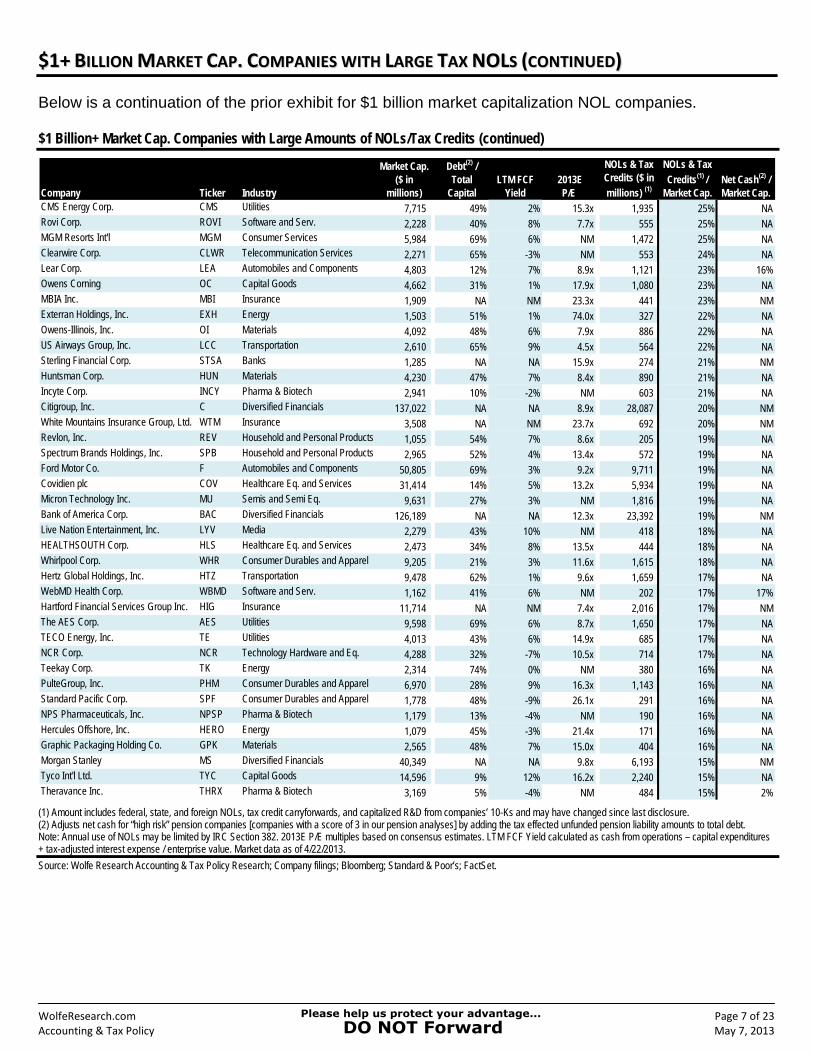
$$11++ BBIILLLLIIOONN MMAARRKKEETT CCAAPP.. CCOOMMPPAANNIIEESS WWIITTHH LLAARRGGEE TTAAXX NNOOLLSS ((CCOONNTTIINNUUEEDD))
Below is a continuation of the prior exhibit for $1 billion market capitalization NOL companies. $1 Billion+ Market Cap. Companies with Large Amounts of NOLs/Tax Credits (continued)
Company Ticker Industry
Market Cap. ($ in
millions)
Debt(2) / Total
CapitalLTM FCF
Yield 2013E
P/E
NOLs & Tax Credits ($ in millions) (1)
NOLs & Tax Credits(1) /
Market Cap.Net Cash(2) / Market Cap.
CMS Energy Corp. CMS Utilities 7,715 49% 2% 15.3x 1,935 25% NARovi Corp. ROVI Software and Serv. 2,228 40% 8% 7.7x 555 25% NAMGM Resorts Int'l MGM Consumer Services 5,984 69% 6% NM 1,472 25% NAClearwire Corp. CLWR Telecommunication Services 2,271 65% -3% NM 553 24% NALear Corp. LEA Automobiles and Components 4,803 12% 7% 8.9x 1,121 23% 16%Owens Corning OC Capital Goods 4,662 31% 1% 17.9x 1,080 23% NAMBIA Inc. MBI Insurance 1,909 NA NM 23.3x 441 23% NMExterran Holdings, Inc. EXH Energy 1,503 51% 1% 74.0x 327 22% NAOwens-Illinois, Inc. OI Materials 4,092 48% 6% 7.9x 886 22% NAUS Airways Group, Inc. LCC Transportation 2,610 65% 9% 4.5x 564 22% NASterling Financial Corp. STSA Banks 1,285 NA NA 15.9x 274 21% NMHuntsman Corp. HUN Materials 4,230 47% 7% 8.4x 890 21% NAIncyte Corp. INCY Pharma & Biotech 2,941 10% -2% NM 603 21% NACitigroup, Inc. C Diversified Financials 137,022 NA NA 8.9x 28,087 20% NMWhite Mountains Insurance Group, Ltd. WTM Insurance 3,508 NA NM 23.7x 692 20% NMRevlon, Inc. REV Household and Personal Products 1,055 54% 7% 8.6x 205 19% NASpectrum Brands Holdings, Inc. SPB Household and Personal Products 2,965 52% 4% 13.4x 572 19% NAFord Motor Co. F Automobiles and Components 50,805 69% 3% 9.2x 9,711 19% NACovidien plc COV Healthcare Eq. and Services 31,414 14% 5% 13.2x 5,934 19% NAMicron Technology Inc. MU Semis and Semi Eq. 9,631 27% 3% NM 1,816 19% NABank of America Corp. BAC Diversified Financials 126,189 NA NA 12.3x 23,392 19% NMLive Nation Entertainment, Inc. LYV Media 2,279 43% 10% NM 418 18% NAHEALTHSOUTH Corp. HLS Healthcare Eq. and Services 2,473 34% 8% 13.5x 444 18% NAWhirlpool Corp. WHR Consumer Durables and Apparel 9,205 21% 3% 11.6x 1,615 18% NAHertz Global Holdings, Inc. HTZ Transportation 9,478 62% 1% 9.6x 1,659 17% NAWebMD Health Corp. WBMD Software and Serv. 1,162 41% 6% NM 202 17% 17%Hartford Financial Services Group Inc. HIG Insurance 11,714 NA NM 7.4x 2,016 17% NMThe AES Corp. AES Utilities 9,598 69% 6% 8.7x 1,650 17% NATECO Energy, Inc. TE Utilities 4,013 43% 6% 14.9x 685 17% NANCR Corp. NCR Technology Hardware and Eq. 4,288 32% -7% 10.5x 714 17% NATeekay Corp. TK Energy 2,314 74% 0% NM 380 16% NAPulteGroup, Inc. PHM Consumer Durables and Apparel 6,970 28% 9% 16.3x 1,143 16% NAStandard Pacific Corp. SPF Consumer Durables and Apparel 1,778 48% -9% 26.1x 291 16% NANPS Pharmaceuticals, Inc. NPSP Pharma & Biotech 1,179 13% -4% NM 190 16% NAHercules Offshore, Inc. HERO Energy 1,079 45% -3% 21.4x 171 16% NAGraphic Packaging Holding Co. GPK Materials 2,565 48% 7% 15.0x 404 16% NAMorgan Stanley MS Diversified Financials 40,349 NA NA 9.8x 6,193 15% NMTyco Int'l Ltd. TYC Capital Goods 14,596 9% 12% 16.2x 2,240 15% NATheravance Inc. THRX Pharma & Biotech 3,169 5% -4% NM 484 15% 2%
(1) Amount includes federal, state, and foreign NOLs, tax credit carryforwards, and capitalized R&D from companies’ 10-Ks and may have changed since last disclosure. (2) Adjusts net cash for “high risk” pension companies [companies with a score of 3 in our pension analyses] by adding the tax effected unfunded pension liability amounts to total debt. Note: Annual use of NOLs may be limited by IRC Section 382. 2013E P/E multiples based on consensus estimates. LTM FCF Yield calculated as cash from operations – capital expenditures + tax-adjusted interest expense / enterprise value. Market data as of 4/22/2013. Source: Wolfe Research Accounting & Tax Policy Research; Company filings; Bloomberg; Standard & Poor’s; FactSet.

WolfeResearch.com Page 8 of 23 Accounting & Tax Policy May 7, 2013
LLEESSSS TTHHAANN $$11 BBIILLLLIIOONN MMAARRKKEETT CCAAPP.. CCOOMMPPAANNIIEESS WWIITTHH LLAARRGGEE TTAAXX NNOOLLSS
Below and on the next page are less than $1 billion market capitalization companies with a minimum NOL deferred tax asset of at least 15% of the company’s current market capitalization. <$1 Billion Market Capitalization Companies with Large Amounts of NOLs/Tax Credits
Company Ticker Industry
Market Cap. ($ in
millions)
Debt(2) / Total
CapitalLTM FCF
Yield 2013E
P/E
NOLs & Tax Credits ($ in millions) (1)
NOLs & Tax Credits(1) /
Market Cap.Net Cash(2) / Market Cap.
Leap Wireless Int'l Inc. LEAP Telecommunication Services 463 88% -3% NM 1,008 218% NAUnisys Corp. UIS Software and Serv. 872 65% 35% 5.3x 1,746 200% NAPendrell Corporation PCO Commercial and Professional Servi 427 0% -14% NM 833 195% 50%Federal-Mogul Corp. FDML Automobiles and Components 504 87% -12% 8.6x 903 179% NAMeritor, Inc. MTOR Capital Goods 428 77% -2% 9.8x 754 176% NAAK Steel Holding Corp. AKS Materials 391 85% -14% 30.8x 625 160% NAViasystems Group Inc. VIAS Technology Hardware and Eq. 257 69% 0% 11.2x 370 144% NABeazer Homes USA Inc. BZH Consumer Durables and Apparel 360 80% 0% NM 365 101% NAHovnanian Enterprises Inc. HOV Consumer Durables and Apparel 699 71% 3% NM 708 101% NAQuantum Corp. QTM Technology Hardware and Eq. 294 41% -1% 33.0x 276 94% NACapmark Financial Group Inc. CPMK Diversified Financials 840 NA NA NM 752 90% NMCentury Aluminum Co. CENX Materials 582 31% 2% 57.2x 510 88% NAMove, Inc. MOVE Software and Serv. 426 0% 5% 21.4x 367 86% 6%Capstone Turbine Corp. CPST Capital Goods 270 5% -4% NM 233 86% 11%Applied Micro Circuits Corp. AMCC Semis and Semi Eq. 462 0% -13% 85.5x 371 80% 18%Dendreon Corp. DNDN Pharma, Biotech and Life Sciences 721 45% -20% NM 548 76% NAAchillion Pharmaceuticals, Inc. ACHN Pharma, Biotech and Life Sciences 715 0% -7% NM 540 76% 9%Sanmina-SCI Corp. SANM Technology Hardware and Eq. 882 51% 22% 7.6x 649 74% NAChiquita Brands Int'l Inc. CQB Food, Beverage and Tobacco 337 64% 1% 10.8x 234 70% NARigel Pharmaceuticals, Inc. RIGL Pharma & Biotech 412 0% NM NM 252 61% 72%LTX-Credence Corp. LTXC Semis and Semi Eq. 270 0% 0% 66.1x 163 60% 47%Cincinnati Bell Inc. CBB Telecommunication Services 706 79% 0% 21.0x 411 58% NAUSA Mobility, Inc. USMO Telecommunication Services 284 0% 0% NM 160 56% 0%Calix Inc. CALX Technology Hardware and Eq. 400 0% 5% 19.1x 200 50% 12%Exelixis, Inc. EXEL Pharma & Biotech 890 27% -13% NM 439 49% 9%Spansion Inc. CODE Semis and Semi Eq. 642 39% 12% 8.7x 311 48% NACowen Group, Inc. COWN Diversified Financials 283 NA NA 7.3x 137 48% NMMoneygram Int'l Inc. MGI Software and Serv. 942 46% -3% 10.9x 443 47% NAAffymetrix Inc. AFFX Pharma & Biotech 271 40% 0% NM 127 47% NAMerge Healthcare Inc.. MRGE Healthcare Eq. and Serv. 285 47% 4% 17.5x 132 46% NASilicon Graphics Int'l Corp. SGI Technology Hardware and Eq. 389 0% 11% 79.4x 177 45% 32%Kratos Defense & Security Solutions, Inc KTOS Capital Goods 283 70% 9% NM 129 45% NAVonage Holdings Corp. VG Telecommunication Services 629 8% 19% 8.1x 285 45% 6%Curis Inc. CRIS Pharma & Biotech 258 10% -7% NM 106 41% 10%Blucora (f/k/a InfoSpace, Inc.) BCOR Software and Services 594 11% 9% 16.3x 235 40% 15%Crown Media Holdings Inc. CRWN Media 719 41% 5% NM 275 38% NAAtlas Air Worldwide Holdings Inc. AAWW Transportation 996 57% -14% 8.4x 378 38% NAQuicksilver Resources Inc. KWK Energy 445 82% -6% NM 165 37% NAInterMune Inc. ITMN Pharma & Biotech 752 24% -25% NM 272 36% 9%Central European Media Enterprises CETV Media 302 80% 1% NM 109 36% NAAlliance One Int'l, Inc. AOI Food, Beverage and Tobacco 316 81% 9% NM 114 36% NAAvanir Pharmaceuticals AVNR Pharma & Biotech 412 7% -14% NM 147 36% 7%Goodrich Petroleum Corp. GDP Energy 476 54% -4% NM 169 35% NANeurocrine Biosciences Inc. NBIX Pharma & Biotech 799 0% -6% NM 283 35% 22%Quiksilver Inc. ZQK Consumer Durables and Apparel 969 45% -1% 23.8x 343 35% NA
(1) Amount includes federal, state, and foreign NOLs, tax credit carryforwards, and capitalized R&D from companies’ 10-Ks and may have changed since last disclosure. (2) Adjusts net cash for “high risk” pension companies [companies with a score of 3 in our pension analyses] by adding the tax effected unfunded pension liability amounts to total debt. Note: Annual use of NOLs may be limited by IRC Section 382. 2013E P/E multiples based on consensus estimates. LTM FCF Yield calculated as cash from operations – capital expenditures + tax-adjusted interest expense / enterprise value. Market data as of 4/22/2013. Source: Wolfe Research Accounting & Tax Policy Research; Company filings; Bloomberg; Standard & Poor’s; FactSet.

WolfeResearch.com Page 9 of 23 Accounting & Tax Policy May 7, 2013
LLEESSSS TTHHAANN $$11 BBIILLLLIIOONN MMAARRKKEETT CCAAPP.. CCOOMMPPAANNIIEESS WWIITTHH LLAARRGGEE TTAAXX NNOOLLSS ((CCOONNTTIINNUUEEDD))
Below is a continuation of the prior exhibit. <$1B Market Cap. Companies with Large Amounts of NOLs/Tax Credits (continued)
Company Ticker Industry
Market Cap. ($ in
millions)
Debt(2) / Total
CapitalLTM FCF
Yield 2013E
P/E
NOLs & Tax Credits ($ in millions) (1)
NOLs & Tax Credits(1) /
Market Cap.Net Cash(2) / Market Cap.
EarthLink Inc. ELNK Software and Serv. 563 52% 9% NM 196 35% NANovavax, Inc. NVAX Pharma & Biotech 370 0% -7% NM 128 35% 12%Extreme Networks Inc. EXTR Technology Hardware and Eq. 286 0% 7% 18.7x 96 34% 44%Dynavax Technologies Corp. DVAX Pharma & Biotech 437 0% -14% NM 146 33% 29%Amkor Technology, Inc. AMKR Semis and Semi Eq. 561 73% -5% 7.3x 187 33% NAExar Corp. EXAR Semis and Semi Eq. 493 1% -1% 20.9x 163 33% 40%General Communication Inc. GNCMA Telecommunication Services 370 72% 4% 29.4x 122 33% NATellabs Inc. TLAB Technology Hardware and Eq. 701 22% 14% NM 230 33% 86%Entercom Communications Corp. ETM Media 289 68% 12% 9.7x 93 32% NAInternet Capital Group Inc. ICGE Diversified Financials 420 NA NM NM 134 32% NMScientific Games Corp. SGMS Consumer Services 669 69% 8% 30.6x 199 30% NAAMAG Pharmaceuticals, Inc. AMAG Pharma & Biotech 450 0% -1% NM 133 30% 51%Lattice Semiconductor Corp. LSCC Semis and Semi Eq. 554 0% -2% 34.3x 160 29% 33%AVEO Pharmaceuticals, Inc. AVEO Pharma & Biotech 383 6% -46% NM 107 28% 35%American Axle & Manufacturing Holdings AXL Automobiles and Components 929 64% -14% 6.0x 256 28% NAIntermec, Inc. IN Technology Hardware and Eq. 591 20% -2% 24.6x 147 25% NAModine Manufacturing Co. MOD Automobiles and Components 420 35% 4% 11.7x 97 23% NAStel Excel SXCL Technology Hardware and Eq. 338 4% 9% NM 78 23% 76%Pep Boys - Manny, Moe & Jack PBY Retailing 564 26% 10% 16.7x 128 23% NASafeguard Scientifics, Inc. SFE Diversified Financials 335 NA NM NM 75 23% NMOrbitz Worldwide, Inc. OWW Retailing 654 40% 9% 12.0x 145 22% NADole Food Co. Inc. DOLE Food, Beverage and Tobacco 923 65% -2% 8.3x 201 22% NABrooks Automation Inc. BRKS Semis and Semi Eq. 567 0% 6% NM 121 21% 18%Builders FirstSource, Inc. BLDR Capital Goods 503 42% -7% NM 107 21% NAInfinera Corp. INFN Technology Hardware and Eq. 724 0% -14% NM 149 21% 25%Power-One Inc. PWER Technology Hardware and Eq. 493 0% 23% 10.8x 101 21% 54%Ferro Corp. FOE Materials 590 44% -2% 18.8x 121 20% NACooper Standard Holdings COSH Automobiles and Components 709 41% -1% NM 144 20% NAACCO Brands Corp. ACCO Commercial and Prof. Serv. 776 58% 1% 7.5x 156 20% NAM/I Homes, Inc. MHO Consumer Durables and Apparel 516 36% -5% 18.7x 10² 20% NACheckpoint Systems Inc. CKP Technology Hardware and Eq. 444 20% 13% 14.7x 87 20% 1%Ormat Technologies Inc. ORA Utilities 900 53% -6% 27.2x 175 19% NAThreshold Pharmaceuticals Inc. THLD Pharma, Biotech and Life Sciences 261 0% 16% NM 48 19% 27%OMNOVA Solutions Inc. OMN Materials 317 59% 3% 8.9x 59 18% NABon-Ton Stores Inc. BONT Retailing 257 78% 7% 11.0x 47 18% NASkyWest Inc. SKYW Transportation 741 69% 16% 10.0x 134 18% NAFelCor Lodging Trust Inc. FCH Real Estate 709 NA NM 16.1x 124 18% NMQuad/Graphics, Inc. QUAD Commercial and Prof. Services 991 58% 13% 11.6x 172 17% NANxstage Medical, Inc. NXTM Healthcare Eq. and Serv. 644 2% 0% NM 111 17% 15%Exact Sciences Corp. EXAS Pharma & Biotech 591 0% -9% NM 99 17% 18%Federal Signal Corp. FSS Capital Goods 468 25% 4% 15.7x 75 16% NAInternap Network Services Corp. INAP Software and Serv. 420 26% -5% 87.5x 67 16% NAHalozyme Therapeutics, Inc. HALO Pharma & Biotech 683 4% -11% NM 107 16% 10%Sangamo Biosciences Inc. SGMO Pharma & Biotech 530 0% -2% NM 80 15% 12%Kraton Performance Polymers Inc. KRA Materials 702 39% 11% 10.1x 10⁶ 15% NA
(1) Amount includes federal, state, and foreign NOLs, tax credit carryforwards, and capitalized R&D from companies’ 10-Ks and may have changed since last disclosure. (2) Adjusts net cash for “high risk” pension companies [companies with a score of 3 in our pension analyses] by adding the tax effected unfunded pension liability amounts to total debt. Note: Annual use of NOLs may be limited by IRC Section 382. 2013E P/E multiples based on consensus estimates. LTM FCF Yield calculated as cash from operations – capital expenditures + tax-adjusted interest expense / enterprise value. Market data as of 4/22/2013. Source: Wolfe Research Accounting & Tax Policy Research; Company filings; Bloomberg; Standard & Poor’s; FactSet.

WolfeResearch.com Page 10 of 23 Accounting & Tax Policy May 7, 2013
HHIIGGHH NNOOLLSS AANNDD NNEETT CCAASSHH
Below are 33 companies with high NOLs, tax credits, and net cash to market capitalization. Companies with NOLs and Tax Credits to Market Cap. >15% and Net Cash to Market Cap. >10%
Company Ticker Industry
Market Cap. ($ in
millions)
Debt(2) / Total
CapitalLTM FCF
Yield 2013E
P/E
NOLs & Tax Credits ($ in millions) (1)
NOLs & Tax Credits(1) /
Market Cap.Net Cash(2) / Market Cap.
Pendrell Corporation PCO Commercial and Professional Servi 427 0% -14% NM 833 195% 50%Capstone Turbine Corp. CPST Capital Goods 270 5% -4% NM 233 86% 11%JDS Uniphase Corp. JDSU Technology Hardware and Eq. 3,004 7% 4% 22.7x 2,436 81% 16%Applied Micro Circuits Corp. AMCC Semis and Semi Eq. 462 0% -13% 85.5x 371 80% 18%AOL, Inc. AOL Software and Services 2,912 4% 12% 21.2x 1,816 62% 12%Rigel Pharmaceuticals, Inc. RIGL Pharma & Biotech 412 0% NM NM 252 61% 72%LTX-Credence Corp. LTXC Semis and Semi Eq. 270 0% 0% 66.1x 163 60% 47%Calix Inc. CALX Technology Hardware and Eq. 400 0% 5% 19.1x 200 50% 12%Silicon Graphics Int'l Corp. SGI Technology Hardware and Eq. 389 0% 11% 79.4x 177 45% 32%LSI Corp. LSI Semis and Semi Eq. 3,355 0% 9% 11.1x 1,382 41% 20%Blucora (f/k/a InfoSpace, Inc.) BCOR Software and Services 594 11% 9% 16.3x 235 40% 15%Neurocrine Biosciences Inc. NBIX Pharma & Biotech 799 0% -6% NM 283 35% 22%Novavax, Inc. NVAX Pharma & Biotech 370 0% -7% NM 128 35% 12%Extreme Networks Inc. EXTR Technology Hardware and Eq. 286 0% 7% 18.7x 96 34% 44%Dynavax Technologies Corp. DVAX Pharma & Biotech 437 0% -14% NM 146 33% 29%Exar Corp. EXAR Semis and Semi Eq. 493 1% -1% 20.9x 163 33% 40%Tellabs Inc. TLAB Technology Hardware and Eq. 701 22% 14% NM 230 33% 86%Nektar Therapeutics NKTR Pharma & Biotech 1,268 10% -11% NM 411 32% 11%AMAG Pharmaceuticals, Inc. AMAG Pharma & Biotech 450 0% -1% NM 133 30% 51%Lattice Semiconductor Corp. LSCC Semis and Semi Eq. 554 0% -2% 34.3x 160 29% 33%Lexicon Pharmaceuticals, Inc. LXRX Pharma & Biotech 1,123 2% -10% NM 320 29% 18%AVEO Pharmaceuticals, Inc. AVEO Pharma & Biotech 383 6% -46% NM 107 28% 35%Lear Corp. LEA Automobiles and Components 4,803 12% 7% 8.9x 1,121 23% 16%Stel Excel SXCL Technology Hardware and Eq. 338 4% 9% NM 78 23% 76%Brooks Automation Inc. BRKS Semis and Semi Eq. 567 0% 6% NM 121 21% 18%Infinera Corp. INFN Technology Hardware and Eq. 724 0% -14% NM 149 21% 25%Power-One Inc. PWER Technology Hardware and Eq. 493 0% 23% 10.8x 101 21% 54%Threshold Pharmaceuticals Inc. THLD Pharma, Biotech and Life Sciences 261 0% 16% NM 48 19% 27%WebMD Health Corp. WBMD Software and Serv. 1,162 41% 6% NM 202 17% 17%Nxstage Medical, Inc. NXTM Healthcare Eq. and Serv. 644 2% 0% NM 111 17% 15%Exact Sciences Corp. EXAS Pharma & Biotech 591 0% -9% NM 99 17% 18%Halozyme Therapeutics, Inc. HALO Pharma & Biotech 683 4% -11% NM 107 16% 10%Sangamo Biosciences Inc. SGMO Pharma & Biotech 530 0% -2% NM 80 15% 12%
(1) Amount includes federal, state, and foreign NOLs, tax credit carryforwards, and capitalized R&D from companies’ 10-Ks and may have changed since last disclosure. (2) Adjusts net cash for “high risk” pension companies [companies with a score of 3 in our pension analyses] by adding the tax effected unfunded pension liability amounts to total debt. Note: Annual use of NOLs may be limited by IRC Section 382. 2013E P/E multiples based on consensus estimates. LTM FCF Yield calculated as cash from operations – capital expenditures + tax-adjusted interest expense / enterprise value. Market data as of 4/22/2013. Source: Wolfe Research Accounting & Tax Policy Research; Company filings; Bloomberg; Standard & Poor’s; FactSet.

WolfeResearch.com Page 11 of 23 Accounting & Tax Policy May 7, 2013
FFIINNAANNCCIIAALL CCOOMMPPAANNIIEESS WWIITTHH LLAARRGGEE NNOOLLSS AANNDD TTAAXX CCRREEDDIITTSS
We find financial service companies with large NOL and tax credit deferred tax assets stemming from the financial crisis, among other reasons. Given the significant amount of leverage in these entities, balance sheet asset quality and liquidity issues may trump hidden value from NOLs. For this reason, we believe the market takes longer to reward such companies for their NOL value (i.e., consistent profitability must return). Below are financial service companies with high NOLs and tax credits relative to their current market capitalization. Financial Companies with High NOLs and Tax Credits to Market Capitalization Ratios
Company Ticker Industry
Market Cap. ($ in
millions)
NOLs & Tax Credits ($ in millions) (1)
NOLs & Tax Credits(1) /
Market Cap.Net Cash(2) / Market Cap.
Capmark Financial Group Inc. CPMK Diversified Financials 840 752 90% NMCNO Financial Group, Inc. CNO Insurance 2,397 1,386 58% NMMGIC Investment Corp. MTG Banks 1,685 867 51% NMCowen Group, Inc. COWN Diversified Financials 283 137 48% NMPopular Inc. BPOP Banks 2,815 1,204 43% NMRadian Group Inc. RDN Banks 1,848 725 39% NMGenworth Financial Inc. GNW Insurance 4,620 1,735 38% NMAmerican Int'l Group, Inc. AIG Insurance 57,400 20,369 35% NMInternet Capital Group Inc. ICGE Diversified Financials 420 134 32% NMSynovus Financial Corp. SNV Banks 1,992 636 32% NMCIT Group Inc. CIT Banks 8,413 2,567 31% NME*TRADE Financial Corp. ETFC Diversified Financials 2,819 810 29% NMMBIA Inc. MBI Insurance 1,909 441 23% NMSafeguard Scientifics, Inc. SFE Diversified Financials 335 75 23% NMSterling Financial Corp. STSA Banks 1,285 274 21% NMCitigroup, Inc. C Diversified Financials 137,022 28,087 20% NMWhite Mountains Insurance Group, Ltd. WTM Insurance 3,508 692 20% NMBank of America Corp. BAC Diversified Financials 126,189 23,392 19% NMFelCor Lodging Trust Inc. FCH Real Estate 709 124 18% NMHartford Financial Services Group Inc. HIG Insurance 11,714 2,016 17% NMMorgan Stanley MS Diversified Financials 40,349 6,193 15% NMGFI Group Inc. GFIG Diversified Financials 423 63 15% NM
(1) Amount includes federal, state, and foreign NOLs, tax credit carryforwards, and capitalized R&D from companies’ 10-Ks and may have changed since last disclosure. Note: Annual use of NOLs may be limited by IRC Section 382. Market data as of 4/22/2013. Source: Wolfe Research Accounting & Tax Policy Research; Company filings; Bloomberg; Standard & Poor’s; FactSet.
WolfeResearch.com Page 12 of 23 Accounting & Tax Policy May 7, 2013
High NOL Companies by Sector

WolfeResearch.com Page 13 of 23 Accounting & Tax Policy May 7, 2013
CCOONNSSUUMMEERR DDIISSCCRREETTIIOONNAARRYY
Consumer Discretionary Companies: (NOLs + Tax Credits) to Market Cap. > 15%
Company Ticker Industry
Market Cap. ($ in
millions)
Debt(2) / Total
CapitalLTM FCF
Yield 2013E
P/E
NOLs & Tax Credits ($ in millions) (1)
NOLs & Tax Credits(1) /
Market Cap.Net Cash(2) / Market Cap.
Federal-Mogul Corp. FDML Automobiles and Components 504 87% -12% 8.6x 903 179% NABeazer Homes USA Inc. BZH Consumer Durables and Apparel 360 80% 0% NM 365 101% NAHovnanian Enterprises Inc. HOV Consumer Durables and Apparel 699 71% 3% NM 708 101% NAGeneral Motors GM Automobiles and Components 39,852 48% 4% 7.6x 26,326 66% NAGoodyear Tire & Rubber Co. GT Automobiles and Components 2,981 70% 2% 6.1x 1,792 60% NAVisteon Corp. VC Automobiles and Components 2,847 17% 1% 14.5x 1,350 47% 10%Crown Media Holdings Inc. CRWN Media 719 41% 5% NM 275 38% NACentral European Media Enterprises CETV Media 302 80% 1% NM 109 36% NAKB Home KBH Consumer Durables and Apparel 1,708 53% -1% NM 612 36% NAQuiksilver Inc. ZQK Consumer Durables and Apparel 969 45% -1% 23.8x 343 35% NAOffice Depot, Inc. ODP Retailing 1,086 38% 7% 36.0x 375 35% 1%Entercom Communications Corp. ETM Media 289 68% 12% 9.7x 93 32% NACharter Communications Inc. CHTR Media 10,425 55% 3% NM 3,145 30% NAScientific Games Corp. SGMS Consumer Services 669 69% 8% 30.6x 199 30% NAAmerican Axle & Manufacturing Holdings AXL Automobiles and Components 929 64% -14% 6.0x 256 28% NASears Holdings Corp. SHLD Retailing 4,913 49% -6% NM 1,327 27% NAMGM Resorts Int'l MGM Consumer Services 5,984 69% 6% NM 1,472 25% NALear Corp. LEA Automobiles and Components 4,803 12% 7% 8.9x 1,121 23% 16%Modine Manufacturing Co. MOD Automobiles and Components 420 35% 4% 11.7x 97 23% NAPep Boys - Manny, Moe & Jack PBY Retailing 564 26% 10% 16.7x 128 23% NAOrbitz Worldwide, Inc. OWW Retailing 654 40% 9% 12.0x 145 22% NACooper Standard Holdings COSH Automobiles and Components 709 41% -1% NM 144 20% NAM/I Homes, Inc. MHO Consumer Durables and Apparel 516 36% -5% 18.7x 10² 20% NAFord Motor Co. F Automobiles and Components 50,805 69% 3% 9.2x 9,711 19% NABon-Ton Stores Inc. BONT Retailing 257 78% 7% 11.0x 47 18% NALive Nation Entertainment, Inc. LYV Media 2,279 43% 10% NM 418 18% NAWhirlpool Corp. WHR Consumer Durables and Apparel 9,205 21% 3% 11.6x 1,615 18% NAPulteGroup, Inc. PHM Consumer Durables and Apparel 6,970 28% 9% 16.3x 1,143 16% NAStandard Pacific Corp. SPF Consumer Durables and Apparel 1,778 48% -9% 26.1x 291 16% NACablevision Systems Corp. CVC Media 3,813 74% 6% 18.6x 560 15% NALibbey Inc. LBY Consumer Durables and Apparel 378 55% 0% 11.0x 55 15% NA
(1) Amount includes federal, state, and foreign NOLs, tax credit carryforwards, and capitalized R&D from companies’ 10-Ks and may have changed since last disclosure. (2) Adjusts net cash for “high risk” pension companies [companies with a score of 3 in our pension analyses] by adding the tax effected unfunded pension liability amounts to total debt. Note: Annual use of NOLs may be limited by IRC Section 382. 2013E P/E multiples based on consensus estimates. LTM FCF Yield calculated as cash from operations – capital expenditures + tax-adjusted interest expense / enterprise value. Market data as of 4/22/2013. Source: Wolfe Research Accounting & Tax Policy Research; Company filings; Bloomberg; Standard & Poor’s; FactSet.

WolfeResearch.com Page 14 of 23 Accounting & Tax Policy May 7, 2013
CCOONNSSUUMMEERR SSTTAAPPLLEESS
Consumer Staple Companies: (NOLs + Tax Credits) to Market Cap. > 15%
Company Ticker Industry
Market Cap. ($ in
millions)
Debt(2) / Total
CapitalLTM FCF
Yield 2013E
P/E
NOLs & Tax Credits ($ in millions) (1)
NOLs & Tax Credits(1) /
Market Cap.Net Cash(2) / Market Cap.
Harbinger Group Inc. HRG Household and Personal Products 1,218 76% 13% NM 914 75% NARite Aid Corp. RAD Food and Staples Retailing 2,223 73% 8% NM 1,656 74% NAChiquita Brands Int'l Inc. CQB Food, Beverage and Tobacco 337 64% 1% 10.8x 234 70% NAAlliance One Int'l, Inc. AOI Food, Beverage and Tobacco 316 81% 9% NM 114 36% NADole Food Co. Inc. DOLE Food, Beverage and Tobacco 923 65% -2% 8.3x 201 22% NARevlon, Inc. REV Household and Personal Products 1,055 54% 7% 8.6x 205 19% NASpectrum Brands Holdings, Inc. SPB Household and Personal Products 2,965 52% 4% 13.4x 572 19% NA
(1) Amount includes federal, state, and foreign NOLs, tax credit carryforwards, and capitalized R&D from companies’ 10-Ks and may have changed since last disclosure. (2) Adjusts net cash for “high risk” pension companies [companies with a score of 3 in our pension analyses] by adding the tax effected unfunded pension liability amounts to total debt. Note: Annual use of NOLs may be limited by IRC Section 382. 2013E P/E multiples based on consensus estimates. LTM FCF Yield calculated as cash from operations – capital expenditures + tax-adjusted interest expense / enterprise value. Market data as of 4/22/2013. Source: Wolfe Research Accounting & Tax Policy Research; Company filings; Bloomberg; Standard & Poor’s; FactSet. EENNEERRGGYY
Energy Companies: (NOLs + Tax Credits) to Market Cap. > 15%
Company Ticker Industry
Market Cap. ($ in
millions)
Debt(2) / Total
CapitalLTM FCF
Yield 2013E
P/E
NOLs & Tax Credits ($ in millions) (1)
NOLs & Tax Credits(1) /
Market Cap.Net Cash(2) / Market Cap.
Alpha Natural Resources, Inc. ANR Energy 1,556 69% 6% NM 779 50% NANabors Industries Ltd. NBR Energy 4,316 50% 3% 10.9x 1,937 45% NASandRidge Energy, Inc. SD Energy 2,199 66% -15% NM 902 41% NAQuicksilver Resources Inc. KWK Energy 445 82% -6% NM 165 37% NAGoodrich Petroleum Corp. GDP Energy 476 54% -4% NM 169 35% NAExterran Holdings, Inc. EXH Energy 1,503 51% 1% 74.0x 327 22% NATeekay Corp. TK Energy 2,314 74% 0% NM 380 16% NAHercules Offshore, Inc. HERO Energy 1,079 45% -3% 21.4x 171 16% NAComstock Resources Inc. CRK Energy 777 63% -14% 23.0x 114 15% NAHornbeck Offshore Services, Inc. HOS Energy 1,435 43% -4% 16.0x 209 15% NA
(1) Amount includes federal, state, and foreign NOLs, tax credit carryforwards, and capitalized R&D from companies’ 10-Ks and may have changed since last disclosure. (2) Adjusts net cash for “high risk” pension companies [companies with a score of 3 in our pension analyses] by adding the tax effected unfunded pension liability amounts to total debt. Note: Annual use of NOLs may be limited by IRC Section 382. 2013E P/E multiples based on consensus estimates. LTM FCF Yield calculated as cash from operations – capital expenditures + tax-adjusted interest expense / enterprise value. Market data as of 4/22/2013. Source: Wolfe Research Accounting & Tax Policy Research; Company filings; Bloomberg; Standard & Poor’s; FactSet.

WolfeResearch.com Page 15 of 23 Accounting & Tax Policy May 7, 2013
FFIINNAANNCCIIAALLSS
Financial Companies: (NOLs + Tax Credits) to Market Cap. > 15%
Company Ticker Industry
Market Cap. ($ in
millions)
Debt(2) / Total
CapitalLTM FCF
Yield 2013E
P/E
NOLs & Tax Credits ($ in millions) (1)
NOLs & Tax Credits(1) /
Market Cap.Net Cash(2) / Market Cap.
Capmark Financial Group Inc. CPMK Diversified Financials 840 NA NA NM 752 90% NMCNO Financial Group, Inc. CNO Insurance 2,397 NA NM 9.5x 1,386 58% NMMGIC Investment Corp. MTG Banks 1,685 NA NM NM 867 51% NMCowen Group, Inc. COWN Diversified Financials 283 NA NA 7.3x 137 48% NMPopular Inc. BPOP Banks 2,815 NA NA 9.4x 1,204 43% NMRadian Group Inc. RDN Banks 1,848 NA NM NM 725 39% NMGenworth Financial Inc. GNW Insurance 4,620 NA NM 6.5x 1,735 38% NMAmerican Int'l Group, Inc. AIG Insurance 57,400 NA NM 10.4x 20,369 35% NMInternet Capital Group Inc. ICGE Diversified Financials 420 NA NM NM 134 32% NMSynovus Financial Corp. SNV Banks 1,992 NA NA 18.4x 636 32% NMCIT Group Inc. CIT Banks 8,413 NA NA 11.2x 2,567 31% NME*TRADE Financial Corp. ETFC Diversified Financials 2,819 NA NA 17.3x 810 29% NMMBIA Inc. MBI Insurance 1,909 NA NM 23.3x 441 23% NMSafeguard Scientifics, Inc. SFE Diversified Financials 335 NA NM NM 75 23% NMSterling Financial Corp. STSA Banks 1,285 NA NA 15.9x 274 21% NMCitigroup, Inc. C Diversified Financials 137,022 NA NA 8.9x 28,087 20% NMWhite Mountains Insurance Group, Ltd. WTM Insurance 3,508 NA NM 23.7x 692 20% NMBank of America Corp. BAC Diversified Financials 126,189 NA NA 12.3x 23,392 19% NMFelCor Lodging Trust Inc. FCH Real Estate 709 NA NM 16.1x 124 18% NMHartford Financial Services Group Inc. HIG Insurance 11,714 NA NM 7.4x 2,016 17% NMMorgan Stanley MS Diversified Financials 40,349 NA NA 9.8x 6,193 15% NMGFI Group Inc. GFIG Diversified Financials 423 NA NA 12.2x 63 15% NM
(1) Amount includes federal, state, and foreign NOLs, tax credit carryforwards, and capitalized R&D from companies’ 10-Ks and may have changed since last disclosure. (2) Adjusts net cash for “high risk” pension companies [companies with a score of 3 in our pension analyses] by adding the tax effected unfunded pension liability amounts to total debt. Note: Annual use of NOLs may be limited by IRC Section 382. 2013E P/E multiples based on consensus estimates. LTM FCF Yield calculated as cash from operations – capital expenditures + tax-adjusted interest expense / enterprise value. Market data as of 4/22/2013. Source: Wolfe Research Accounting & Tax Policy Research; Company filings; Bloomberg; Standard & Poor’s; FactSet.

WolfeResearch.com Page 16 of 23 Accounting & Tax Policy May 7, 2013
HHEEAALLTTHHCCAARREE
Healthcare Companies: (NOLs + Tax Credits) to Market Cap. > 15%
Company Ticker Industry
Market Cap. ($ in
millions)
Debt(2) / Total
CapitalLTM FCF
Yield 2013E
P/E
NOLs & Tax Credits ($ in millions) (1)
NOLs & Tax Credits(1) /
Market Cap.Net Cash(2) / Market Cap.
Dendreon Corp. DNDN Pharma, Biotech and Life Sciences 721 45% -20% NM 548 76% NAAchillion Pharmaceuticals, Inc. ACHN Pharma, Biotech and Life Sciences 715 0% -7% NM 540 76% 9%Rigel Pharmaceuticals, Inc. RIGL Pharma & Biotech 412 0% NM NM 252 61% 72%MannKind Corp. MNKD Pharma & Biotech 1,160 22% -7% NM 706 61% NAExelixis, Inc. EXEL Pharma & Biotech 890 27% -13% NM 439 49% 9%Affymetrix Inc. AFFX Pharma & Biotech 271 40% 0% NM 127 47% NAMerge Healthcare Inc.. MRGE Healthcare Eq. and Serv. 285 47% 4% 17.5x 132 46% NACuris Inc. CRIS Pharma & Biotech 258 10% -7% NM 106 41% 10%InterMune Inc. ITMN Pharma & Biotech 752 24% -25% NM 272 36% 9%Avanir Pharmaceuticals AVNR Pharma & Biotech 412 7% -14% NM 147 36% 7%Neurocrine Biosciences Inc. NBIX Pharma & Biotech 799 0% -6% NM 283 35% 22%Novavax, Inc. NVAX Pharma & Biotech 370 0% -7% NM 128 35% 12%Dynavax Technologies Corp. DVAX Pharma & Biotech 437 0% -14% NM 146 33% 29%Nektar Therapeutics NKTR Pharma & Biotech 1,268 10% -11% NM 411 32% 11%AMAG Pharmaceuticals, Inc. AMAG Pharma & Biotech 450 0% -1% NM 133 30% 51%Lexicon Pharmaceuticals, Inc. LXRX Pharma & Biotech 1,123 2% -10% NM 320 29% 18%AVEO Pharmaceuticals, Inc. AVEO Pharma & Biotech 383 6% -46% NM 107 28% 35%Incyte Corp. INCY Pharma & Biotech 2,941 10% -2% NM 603 21% NACovidien plc COV Healthcare Eq. and Services 31,414 14% 5% 13.2x 5,934 19% NAThreshold Pharmaceuticals Inc. THLD Pharma, Biotech and Life Sciences 261 0% 16% NM 48 19% 27%HEALTHSOUTH Corp. HLS Healthcare Eq. and Services 2,473 34% 8% 13.5x 444 18% NANxstage Medical, Inc. NXTM Healthcare Eq. and Serv. 644 2% 0% NM 111 17% 15%Exact Sciences Corp. EXAS Pharma & Biotech 591 0% -9% NM 99 17% 18%NPS Pharmaceuticals, Inc. NPSP Pharma & Biotech 1,179 13% -4% NM 190 16% NAHalozyme Therapeutics, Inc. HALO Pharma & Biotech 683 4% -11% NM 107 16% 10%Theravance Inc. THRX Pharma & Biotech 3,169 5% -4% NM 484 15% 2%Sangamo Biosciences Inc. SGMO Pharma & Biotech 530 0% -2% NM 80 15% 12%AngioDynamics Inc. ANGO Healthcare Eq. and Serv. 336 30% 2% 20.3x 50 15% NAIsis Pharmaceuticals, Inc. ISIS Pharma & Biotech 2,149 10% 1% NM 314 15% 9%Abiomed Inc. ABMD Healthcare Eq. and Serv. 675 0% 4% 34.5x 98 15% 13%
(1) Amount includes federal, state, and foreign NOLs, tax credit carryforwards, and capitalized R&D from companies’ 10-Ks and may have changed since last disclosure. (2) Adjusts net cash for “high risk” pension companies [companies with a score of 3 in our pension analyses] by adding the tax effected unfunded pension liability amounts to total debt. Note: Annual use of NOLs may be limited by IRC Section 382. 2013E P/E multiples based on consensus estimates. LTM FCF Yield calculated as cash from operations – capital expenditures + tax-adjusted interest expense / enterprise value. Market data as of 4/22/2013. Source: Wolfe Research Accounting & Tax Policy Research; Company filings; Bloomberg; Standard & Poor’s; FactSet.

WolfeResearch.com Page 17 of 23 Accounting & Tax Policy May 7, 2013
IINNDDUUSSTTRRIIAALLSS
Industrial Companies: (NOLs + Tax Credits) to Market Cap. > 15%
Company Ticker Industry
Market Cap. ($ in
millions)
Debt(2) / Total
CapitalLTM FCF
Yield 2013E
P/E
NOLs & Tax Credits ($ in millions) (1)
NOLs & Tax Credits(1) /
Market Cap.Net Cash(2) / Market Cap.
Pendrell Corporation PCO Commercial and Professional Servi 433 0% -14% NM 833 193% 49%Meritor, Inc. MTOR Capital Goods 428 77% -2% 9.8x 754 176% NACapstone Turbine Corp. CPST Capital Goods 270 5% -4% NM 233 86% 11%Delta Air Lines Inc. DAL Transportation 12,913 62% 5% 5.0x 6,816 53% NAAvis Budget Group, Inc. CAR Transportation 3,013 76% 2% 8.5x 1,516 50% NAKratos Defense & Security Solutions, Inc KTOS Capital Goods 283 70% 9% NM 129 45% NAUSG Corp. USG Capital Goods 2,663 46% 3% 57.5x 1,066 40% NAAtlas Air Worldwide Holdings Inc. AAWW Transportation 996 57% -14% 8.4x 378 38% NANavistar Int'l Corp. NAV Capital Goods 2,455 70% 6% NM 850 35% NAUnited Continental Holdings, Inc. UAL Transportation 10,179 56% -3% 6.4x 3,276 32% NAOwens Corning OC Capital Goods 4,662 31% 1% 17.9x 1,080 23% NAUS Airways Group, Inc. LCC Transportation 2,610 65% 9% 4.5x 564 22% NABuilders FirstSource, Inc. BLDR Capital Goods 503 42% -7% NM 107 21% NAACCO Brands Corp. ACCO Commercial and Prof. Serv. 776 58% 1% 7.5x 156 20% NASkyWest Inc. SKYW Transportation 741 69% 16% 10.0x 134 18% NAHertz Global Holdings, Inc. HTZ Transportation 9,478 62% 1% 9.6x 1,659 17% NAQuad/Graphics, Inc. QUAD Commercial and Prof. Services 991 58% 13% 11.6x 172 17% NAFederal Signal Corp. FSS Capital Goods 468 25% 4% 15.7x 75 16% NATyco Int'l Ltd. TYC Capital Goods 14,596 9% 12% 16.2x 2,240 15% NA
(1) Amount includes federal, state, and foreign NOLs, tax credit carryforwards, and capitalized R&D from companies’ 10-Ks and may have changed since last disclosure. (2) Adjusts net cash for “high risk” pension companies [companies with a score of 3 in our pension analyses] by adding the tax effected unfunded pension liability amounts to total debt. Note: Annual use of NOLs may be limited by IRC Section 382. 2013E P/E multiples based on consensus estimates. LTM FCF Yield calculated as cash from operations – capital expenditures + tax-adjusted interest expense / enterprise value. Market data as of 4/22/2013. Source: Wolfe Research Accounting & Tax Policy Research; Company filings; Bloomberg; Standard & Poor’s; FactSet.

WolfeResearch.com Page 18 of 23 Accounting & Tax Policy May 7, 2013
IINNFFOORRMMAATTIIOONN TTEECCHHNNOOLLOOGGYY
Information Technology Companies: (NOLs + Tax Credits) to Market Cap. > 15%
Company Ticker Industry
Market Cap. ($ in
millions)
Debt(2) / Total
CapitalLTM FCF
Yield 2013E
P/E
NOLs & Tax Credits ($ in millions) (1)
NOLs & Tax Credits(1) /
Market Cap.Net Cash(2) / Market Cap.
Unisys Corp. UIS Software and Serv. 872 65% 35% 5.3x 1,746 200% NAViasystems Group Inc. VIAS Technology Hardware and Eq. 257 69% 0% 11.2x 370 144% NAAdvanced Micro Devices, Inc. AMD Semis and Semi Eq. 1,764 54% -13% NM 2,202 125% NAQuantum Corp. QTM Technology Hardware and Eq. 294 41% -1% 33.0x 276 94% NAMove, Inc. MOVE Software and Serv. 426 0% 5% 21.4x 367 86% 6%JDS Uniphase Corp. JDSU Technology Hardware and Eq. 3,004 7% 4% 22.7x 2,436 81% 16%Applied Micro Circuits Corp. AMCC Semis and Semi Eq. 462 0% -13% 85.5x 371 80% 18%CIENA Corp. CIEN Technology Hardware and Eq. 1,485 49% 1% 90.0x 1,143 77% NASanmina-SCI Corp. SANM Technology Hardware and Eq. 882 51% 22% 7.6x 649 74% NAAOL, Inc. AOL Software and Services 2,912 4% 12% 21.2x 1,816 62% 12%LTX-Credence Corp. LTXC Semis and Semi Eq. 270 0% 0% 66.1x 163 60% 47%Calix Inc. CALX Technology Hardware and Eq. 400 0% 5% 19.1x 200 50% 12%Spansion Inc. CODE Semis and Semi Eq. 642 39% 12% 8.7x 311 48% NAMoneygram Int'l Inc. MGI Software and Serv. 942 46% -3% 10.9x 443 47% NASilicon Graphics Int'l Corp. SGI Technology Hardware and Eq. 389 0% 11% 79.4x 177 45% 32%LSI Corp. LSI Semis and Semi Eq. 3,355 0% 9% 11.1x 1,382 41% 20%Blucora (f/k/a InfoSpace, Inc.) BCOR Software and Services 594 11% 9% 16.3x 235 40% 15%EarthLink Inc. ELNK Software and Serv. 563 52% 9% NM 196 35% NAHewlett-Packard Co. HPQ Technology Hardware and Eq. 38,025 43% 17% 4.6x 13,042 34% NAExtreme Networks Inc. EXTR Technology Hardware and Eq. 286 0% 7% 18.7x 96 34% 44%Amkor Technology, Inc. AMKR Semis and Semi Eq. 561 73% -5% 7.3x 187 33% NAExar Corp. EXAR Semis and Semi Eq. 493 1% -1% 20.9x 163 33% 40%Tellabs Inc. TLAB Technology Hardware and Eq. 701 22% 14% NM 230 33% 86%ON Semiconductor Corp. ONNN Semis and Semi Eq. 3,274 24% 2% 14.3x 952 29% NALattice Semiconductor Corp. LSCC Semis and Semi Eq. 554 0% -2% 34.3x 160 29% 33%Intermec, Inc. IN Technology Hardware and Eq. 591 20% -2% 24.6x 147 25% NARovi Corp. ROVI Software and Serv. 2,228 40% 8% 7.7x 555 25% NAStel Excel SXCL Technology Hardware and Eq. 338 4% 9% NM 78 23% 76%Brooks Automation Inc. BRKS Semis and Semi Eq. 567 0% 6% NM 121 21% 18%Infinera Corp. INFN Technology Hardware and Eq. 724 0% -14% NM 149 21% 25%Power-One Inc. PWER Technology Hardware and Eq. 493 0% 23% 10.8x 101 21% 54%Checkpoint Systems Inc. CKP Technology Hardware and Eq. 444 20% 13% 14.7x 87 20% 1%Micron Technology Inc. MU Semis and Semi Eq. 9,631 27% 3% NM 1,816 19% NAWebMD Health Corp. WBMD Software and Serv. 1,162 41% 6% NM 202 17% 17%NCR Corp. NCR Technology Hardware and Eq. 4,288 32% -7% 10.5x 714 17% NAInternap Network Services Corp. INAP Software and Serv. 420 26% -5% 87.5x 67 16% NAPhotronics Inc. PLAB Semis and Semi Eq. 432 29% 7% 14.9x 64 15% 10%Take-Two Interactive Software Inc. TTWO Software and Serv. 1,362 20% 1% 66.0x 197 15% 9%
(1) Amount includes federal, state, and foreign NOLs, tax credit carryforwards, and capitalized R&D from companies’ 10-Ks and may have changed since last disclosure. (2) Adjusts net cash for “high risk” pension companies [companies with a score of 3 in our pension analyses] by adding the tax effected unfunded pension liability amounts to total debt. Note: Annual use of NOLs may be limited by IRC Section 382. 2013E P/E multiples based on consensus estimates. LTM FCF Yield calculated as cash from operations – capital expenditures + tax-adjusted interest expense / enterprise value. Market data as of 4/22/2013. Source: Wolfe Research Accounting & Tax Policy Research; Company filings; Bloomberg; Standard & Poor’s; FactSet.

WolfeResearch.com Page 19 of 23 Accounting & Tax Policy May 7, 2013
MMAATTEERRIIAALLSS
Material Companies: (NOLs + Tax Credits) to Market Cap. > 15%
Company Ticker Industry
Market Cap. ($ in
millions)
Debt(2) / Total
CapitalLTM FCF
Yield 2013E
P/E
NOLs & Tax Credits ($ in millions) (1)
NOLs & Tax Credits(1) /
Market Cap.Net Cash(2) / Market Cap.
AK Steel Holding Corp. AKS Materials 391 85% -14% 30.8x 625 160% NAResolute Forest Products RFP Materials 1,330 52% 9% 15.0x 1,229 92% NACentury Aluminum Co. CENX Materials 582 31% 2% 57.2x 510 88% NAKaiser Aluminum Corp. KALU Materials 1,125 25% 11% 14.4x 342 30% NAChemtura CHMT Materials 1,936 31% 5% 12.4x 488 25% NAOwens-Illinois, Inc. OI Materials 4,092 48% 6% 7.9x 886 22% NAHuntsman Corp. HUN Materials 4,230 47% 7% 8.4x 890 21% NAFerro Corp. FOE Materials 590 44% -2% 18.8x 121 20% NAOMNOVA Solutions Inc. OMN Materials 317 59% 3% 8.9x 59 18% NAGraphic Packaging Holding Co. GPK Materials 2,565 48% 7% 15.0x 404 16% NAKraton Performance Polymers Inc. KRA Materials 702 39% 11% 10.1x 10⁶ 15% NA
(1) Amount includes federal, state, and foreign NOLs, tax credit carryforwards, and capitalized R&D from companies’ 10-Ks and may have changed since last disclosure. (2) Adjusts net cash for “high risk” pension companies [companies with a score of 3 in our pension analyses] by adding the tax effected unfunded pension liability amounts to total debt. Note: Annual use of NOLs may be limited by IRC Section 382. 2013E P/E multiples based on consensus estimates. LTM FCF Yield calculated as cash from operations – capital expenditures + tax-adjusted interest expense / enterprise value. Market data as of 4/22/2013. Source: Wolfe Research Accounting & Tax Policy Research; Company filings; Bloomberg; Standard & Poor’s; FactSet. TTEELLEECCOOMMMMUUNNIICCAATTIIOONN SSEERRVVIICCEESS
Telecom. Companies: (NOLs + Tax Credits) to Market Cap. > 15%
Company Ticker Industry
Market Cap. ($ in
millions)
Debt(2) / Total
CapitalLTM FCF
Yield 2013E
P/E
NOLs & Tax Credits ($ in millions) (1)
NOLs & Tax Credits(1) /
Market Cap.Net Cash(2) / Market Cap.
Leap Wireless Int'l Inc. LEAP Telecommunication Services 463 88% -3% NM 1,008 218% NALevel 3 Communications Inc. LVLT Telecommunication Services 4,459 66% 3% 65.9x 4,611 103% NACincinnati Bell Inc. CBB Telecommunication Services 706 79% 0% 21.0x 411 58% NAUSA Mobility, Inc. USMO Telecommunication Services 284 0% 0% NM 160 56% 0%Vonage Holdings Corp. VG Telecommunication Services 629 8% 19% 8.1x 285 45% 6%NII Holdings Inc. NIHD Telecommunication Services 1,330 79% -11% NM 531 40% NAGeneral Communication Inc. GNCMA Telecommunication Services 370 72% 4% 29.4x 122 33% NACogent Communications Group Inc. CCOI Telecommunication Services 1,272 24% 4% 78.3x 348 27% NAClearwire Corp. CLWR Telecommunication Services 2,271 65% -3% NM 553 24% NA
(1) Amount includes federal, state, and foreign NOLs, tax credit carryforwards, and capitalized R&D from companies’ 10-Ks and may have changed since last disclosure. (2) Adjusts net cash for “high risk” pension companies [companies with a score of 3 in our pension analyses] by adding the tax effected unfunded pension liability amounts to total debt. Note: Annual use of NOLs may be limited by IRC Section 382. 2013E P/E multiples based on consensus estimates. LTM FCF Yield calculated as cash from operations – capital expenditures + tax-adjusted interest expense / enterprise value. Market data as of 4/22/2013. Source: Wolfe Research Accounting & Tax Policy Research; Company filings; Bloomberg; Standard & Poor’s; FactSet.

WolfeResearch.com Page 20 of 23 Accounting & Tax Policy May 7, 2013
UUTTIILLIITTIIEESS
Utility Companies: (NOLs + Tax Credits) to Market Cap. > 15%
Company Ticker Industry
Market Cap. ($ in
millions)
Debt(2) / Total
CapitalLTM FCF
Yield 2013E
P/E
NOLs & Tax Credits ($ in millions) (1)
NOLs & Tax Credits(1) /
Market Cap.Net Cash(2) / Market Cap.
Dynegy Inc. DYN Utilities 2,339 38% -3% NM 1,369 59% NACalpine Corp. CPN Utilities 9,601 53% 3% 25.8x 3,073 32% NACMS Energy Corp. CMS Utilities 7,715 49% 2% 15.3x 1,935 25% NAOrmat Technologies Inc. ORA Utilities 900 53% -6% 27.2x 175 19% NAThe AES Corp. AES Utilities 9,598 69% 6% 8.7x 1,650 17% NATECO Energy, Inc. TE Utilities 4,013 43% 6% 14.9x 685 17% NA
(1) Amount includes federal, state, and foreign NOLs, tax credit carryforwards, and capitalized R&D from companies’ 10-Ks and may have changed since last disclosure. (2) Adjusts net cash for “high risk” pension companies [companies with a score of 3 in our pension analyses] by adding the tax effected unfunded pension liability amounts to total debt. Note: Annual use of NOLs may be limited by IRC Section 382. 2013E P/E multiples based on consensus estimates. LTM FCF Yield calculated as cash from operations – capital expenditures + tax-adjusted interest expense / enterprise value. Market data as of 4/22/2013. Source: Wolfe Research Accounting & Tax Policy Research; Company filings; Bloomberg; Standard & Poor’s; FactSet.

WolfeResearch.com Page 21 of 23 Accounting & Tax Policy May 7, 2013
AACCCCOOUUNNTTIINNGG && TTAAXX PPOOLLIICCYY RREESSEEAARRCCHH LLIIBBRRAARRYY
# Report Title Topic Date 1. European Financial Crisis: Mark to Market Maneuvers Financial Institutions 9/23/2011 2. CIT Deep Dive Corporate Actions / Financials [CIT] 9/28/2011 3. Spin-Offs, Post Bankruptcy Equity & Value Opportunities Corporate Actions 10/7/2011 4. Pension Funding Deteriorates $250 Billion Pensions 10/12/2011 5. Synovus Financial: DTA Valued at $500 Million Financial Institutions [SNV] 10/24/2011 6. Companies Initiating Dividends Outperform Corporate Actions 10/31/2011 7. Shareholder Value Creation Stock Ideas: TREE Analysis Capital Allocation 11/8/2011 8. Yahoo! Possible Avenues to Unlock Tax Value Corporate Actions [YHOO] 11/15/2011 9. Banks: Earnings Quality Analysis Earnings Quality / Fin. Institutions 11/21/2011 10. Large Share Repurchases and Deep Value Capital Allocation 11/30/2011 11. Earnings Quality: Ideas and a Guide to Avoid Accounting Pitfalls Earnings Quality 12/6/2011 12. A Dive Into Banks' Off-Balance Sheet Vehicles Financial Institutions 12/16/2011 13. Audio Update: Pension Underfunding with Chris Senyek Pensions 12/20/2011 14. 2012 Pension Outlook Pensions 1/3/2012 15. Verizon Cash Flow Deep Dive: Taxes & Wireless Support Dividend Telecom [VZ] 1/5/2012 16. 2012 Stock Picking Ideas: Capital Creation and Earnings Quality Capital Allocation / Earnings Quality 1/9/2012 17. Audio Update: Key Themes in Financials with Chris Senyek Financial Institutions 1/12/2012 18. Spin-offs, Post Bankruptcy Equity & Value Opportunities Corporate Actions 1/13/2012 19. Dividend Increases Signal Stock Price Outperformance Corporate Actions 1/30/2012 20. Weekly Spin-off Update (Including Post Holdings Analysis) Corporate Actions [POST] 2/3/2012 21. Key Themes: Chart Book Chart Book 2/4/2012 22. Reincorporating: Will Others Follow Aon's Move? Corporate Actions / Taxes [AON] 2/15/2012 23. Audio Update: Corporate Tax Reform Unveiled with Chris Senyek Taxes 2/23/2012 24. 10-K Navigation Guide Primers 2/28/2012 25. Key Themes: Chart Book Chart Book 3/3/2012 26. Banks: Earnings Quality Analysis Earnings Quality / Fin. Institutions 3/5/2012 27. Apple's Dividend Initiation and Buyback Corporate Actions [AAPL] 3/19/2012 28. Pensions: Restructuring & Mark to Market Adoption Pensions 3/21/2012 29. Audio Update: Pension Restructurings and MTM with Chris Senyek Pensions 3/22/2012 30. New Contrarian Ideas Based on TREE & Earnings Quality Capital Allocation / Earnings Quality 3/23/2012 31. Earnings Quality: Identifying Underperformers Earnings Quality 3/30/2012 32. Key Themes: Chart Book Chart Book 3/31/2012 33. Financial Institutions' Accounting Themes Financial Institutions 4/9/2012 34. CIT Deep Dive: Lowering Economic Book Value by $5 Corporate Actions / Fin. Institutions [CIT] 4/18/2012 35. Tax Changes in 2013 Likely to Compel Special Dividends in 2012 Corporate Actions / Taxes 4/23/2012 36. Hidden Value in Net Operating Losses (NOLs) Corporate Actions / Taxes 5/2/2012 37. Key Themes: Chart Book Chart Book 5/5/2012 38. Pro Forma Earnings Earnings Quality 5/9/2012 39. Pensions: State of the Union Pensions 5/11/2012 40. Banks: 'Q1 Earnings/Asset Quality Analysis Earnings Quality / Fin. Institutions 5/16/2012 41. Returning Cash to Shareholders: Who's Next? Capital Allocation 5/21/2012 42. Spin-offs, Post Bankruptcy Equity & Value Opportunities Corporate Actions [ADT, LMCA, VC] 5/31/2012 43. Key Themes: Chart Book Chart Book 6/3/2012 44. Capital Allocation: Buyback and Dividend Analysis Capital Allocation 6/7/2012 45. Earnings Quality: Identifying Underperformers Earnings Quality 6/22/2012 46. Winners From Pension Funding Relief Pensions 6/26/2012 47. Audio Update: Pension Relief with Chris Senyek Pensions 6/29/2012 48. Key Themes: Chart Book Chart Book 6/30/2012 49. Pension Funding Relief Signed Into Law Pensions 7/9/2012 50. Financial Institutions' Accounting Themes Financial Institutions 7/10/2012 51. Senyek's Stock Idea Spreadsheet Capital Allocation / Database 7/17/2012 52. Repatriation Transactions and Bills to Extend Bush-Era Tax Cuts Taxes 7/25/2012 53. Key Themes: Chart Book Chart Book 7/28/2012 54. Banks: 'Q2 Earnings/Asset Quality Analysis Earnings Quality / Fin. Institutions 8/14/2012

WolfeResearch.com Page 22 of 23 Accounting & Tax Policy May 7, 2013
AACCCCOOUUNNTTIINNGG && TTAAXX PPOOLLIICCYY RREESSEEAARRCCHH LLIIBBRRAARRYY ((CCOONNTTIINNUUEEDD))
# Report Title Topic Date 55. Earnings Quality: Identifying Underperformers Earnings Quality 8/23/2012 56. Key Themes: Chart Book Chart Book 9/1/2012 57. Capital Allocation: Buyback and Dividend Analysis Capital Allocation 9/5/2012 58. Financial Institutions' Accounting Themes Financial Institutions 9/7/2012 59. Audio Update: Avoiding Underperforming Stocks with Chris Senyek Earnings Quality 9/7/2012 60. European Stock Ideas: Shareholder Value Creation TREE Analysis Capital Allocation / Europe 9/20/2012 61. Tyco: ADT Deep Dive Corporate Actions [ADT, TYC] 9/26/2012 62. Key Themes: Chart Book Chart Book 9/29/2012 63. CIT: Four Possible Catalysts in 2013 Financials [CIT] 10/3/2012 64. Pensions: Year-End Outlook Pensions 10/11/2012 65. Spin-offs, Post Bankruptcy Equity & Value Opportunities Corporate Actions [VC, YHOO, LMCA, CPMK] 10/19/2012 66. Earnings Quality: STOXX Europe 600 Earnings Quality / Europe 10/24/2012 67. Key Themes: Chart Book Chart Book 11/3/2012 68. Post-Election Tax Policy Outlook Taxes 11/9/2012 69. Special Dividend Announcements Set Weekly Record Taxes / Capital Allocation 11/19/2012 70. Banks: 'Q3 Earnings/Asset Quality Analysis Earnings Quality / Fin. Institutions 11/20/2012 71. Earnings Quality: Identifying Underperformers Earnings Quality 11/28/2012 72. Key Themes: Chart Book Chart Book 12/2/2012 73. Special Dividend Announcements Set Another Weekly Record Taxes / Capital Allocation 12/3/2012 74. Stock Ideas From Buyback and Dividend Analysis Capital Allocation 12/13/2012 75. Audio Update: Tax Policy Update and Special Dividends Taxes / Capital Allocation 12/14/2012 76. Key Themes in Dividend Investing Capital Allocation 12/19/2012 77. Key Themes: Chart Book Chart Book 1/2/2013 78. 2013 Pension Outlook Pensions 1/3/2013 79. American Taxpayer Relief Act: The Truth Hurts Taxes 1/4/2013 80. Financial Institutions: 13 Themes for 2013 Financial Institutions 1/10/2013 81. Spin-offs, Post Bankruptcy Equity & Value Opportunities Corporate Actions [ETFC, VIV.PA, VC, ADT] 1/18/2013 82. CIT: Post-Quarter Update Financials [CIT] 1/29/2013 83. Key Themes: Chart Book Chart Book 2/4/2013 84. Conference Call: Dividend Strategies: Beyond Value Investing Capital Allocation 2/15/2013 85. 10-K Navigation Guide: A Primer on Reading Annual Reports Primers 2/27/2013 86. Key Themes: Chart Book Chart Book 3/4/2013 87. Dividends in the Tech Sector: Searching for the Sweet Spot Dividends [QCOM] 3/18/2013 88. Earnings Quality (EQ): Identifying Underperforming Stocks Earnings Quality 3/22/2013 89. Stock Ideas from Buyback Analysis Capital Allocation 3/27/2013 90. Key Themes: Chart Book Chart Book 4/1/2013 91. Financial Institutions Key Themes Financial Institutions [CIT, ETFC, PNC] 4/10/2013 92. Earnings Quality: STOXX Europe 600 Earnings Quality / Europe 4/17/2013 93. Audio Update: Avoiding Underperforming Stocks with Chris Senyek Earnings Quality 4/18/2013 94. Pensions: State of the Union Pensions 4/30/2013 95. Key Themes: Chart Book Chart Book 5/1/2013 * Every Friday, we send out “Senyek’s Weekly Spin-off Update”, a brief look at new announcements, updates, and activities in spin-off and post-bankruptcy equities. Monthly, we send out "Senyek's Stock Ideas Spreadsheet" based on three important areas of our investment analysis and research: capital creation/allocation, earnings quality, and valuation. It may also be used as a simple screening tool for other factors. We maintain a separate distribution list for these reports. If you would like to be added, please contact [email protected] or your Wolfe Research salesperson.
WolfeResearch.com Page 23 of 23 Accounting & Tax Policy May 7, 2013
DDIISSCCLLOOSSUURREE SSEECCTTIIOONN
Analyst Certification: The analyst of Wolfe Research primarily responsible for this research report whose name appears first on the front page of this research report hereby certifies that (i) the recommendations and opinions expressed in this research report accurately reflect the research analysts’ personal views about the subject securities or issuers and (ii) no part of the research analysts’ compensation was, is or will be directly or indirectly related to the specific recommendations or views contained in this report. Other Disclosures: Wolfe Research, LLC does not assign ratings of Buy, Hold or Sell to the stocks it covers. Outperform, Peer Perform and Underperform are not the respective equivalents of Buy, Hold and Sell but represent relative weightings as defined above. To satisfy regulatory requirements, Outperform has been designated to correspond with Buy, Peer Perform has been designated to correspond with Hold and Underperform has been designated to correspond with Sell. Wolfe Research Securities and Wolfe Research, LLC have adopted the use of Wolfe Research as brand names. Wolfe Research Securities (pending FINRA approval), a member of FINRA (www.finra.org) is the broker-dealer affiliate of Wolfe Research, LLC and is responsible for the contents of this material. Any analysts publishing these reports are dually employed by Wolfe Research, LLC and Wolfe Research Securities. The content of this report is to be used solely for informational purposes and should not be regarded as an offer, or a solicitation of an offer, to buy or sell a security, financial instrument or service discussed herein. Opinions in this communication constitute the current judgment of the author as of the date and time of this report and are subject to change without notice. Information herein is believed to be reliable but Wolfe Research and its affiliates, including but not limited to Wolfe Research Securities, makes no representation that it is complete or accurate. The information provided in this communication is not designed to replace a recipient's own decision-making processes for assessing a proposed transaction or investment involving a financial instrument discussed herein. Recipients are encouraged to seek financial advice from their financial advisor regarding the appropriateness of investing in a security or financial instrument referred to in this report and should understand that statements regarding the future performance of the financial instruments or the securities referenced herein may not be realized. Past performance is not indicative of future results. This report is not intended for distribution to, or use by, any person or entity in any location where such distribution or use would be contrary to applicable law, or which would subject Wolfe Research, LLC or any affiliate to any registration requirement within such location. For additional important disclosures, please see www.WolfeResearch.com/Disclosures. The views expressed in Wolfe Research, LLC research reports with regards to sectors and/or specific companies may from time to time be inconsistent with the views implied by inclusion of those sectors and companies in other Wolfe Research, LLC analysts’ research reports and modeling screens. Wolfe Research communicates with clients across a variety of mediums of the clients’ choosing including emails, voice blasts and electronic publication to our proprietary website. Copyright © Wolfe Research, LLC 2013. All rights reserved. All material presented in this document, unless specifically indicated otherwise, is under copyright to Wolfe Research, LLC. None of the material, nor its content, nor any copy of it, may be altered in any way, or transmitted to or distributed to any other party, without the prior express written permission of Wolfe Research, LLC. This report is limited for the sole use of clients of Wolfe Research. Authorized users have received an encryption decoder which legislates and monitors the access to Wolfe Research, LLC content. Any distribution of the content produced by Wolfe Research, LLC will violate the understanding of the terms of our relationship.