hiatal hernia prevalence and natural history on non
TRANSCRIPT

1Kim J, et al. BMJ Open Gastro 2021;8:e000565. doi:10.1136/bmjgast-2020-000565
Hiatal hernia prevalence and natural history on non- contrast CT in the Multi- Ethnic Study of Atherosclerosis (MESA)
Jinhye Kim,1 Grant T Hiura,2 Elizabeth C Oelsner,2,3 Xiaorui Yin,1 R Graham Barr,2,3 Benjamin M Smith,2,4 Martin R Prince 1,5
To cite: Kim J, Hiura GT, Oelsner EC, et al. Hiatal hernia prevalence and natural history on non- contrast CT in the Multi- Ethnic Study of Atherosclerosis (MESA). BMJ Open Gastro 2021;8:e000565. doi:10.1136/bmjgast-2020-000565
Received 5 November 2020Revised 11 December 2020Accepted 30 December 2020
1Department of Radiology, Weill Cornell Medicine, New York, NY, USA2Department of Medicine, Columbia University Irving Medical Center, New York, NY, USA3Department of Epidemiology, Mailman School of Pubilc Health, Columbia University, New York, NY, USA4Department of Medicine, McGill University, Montreal, QC, Canada5Department of Radiology, Columbia University Irving Medical Center, New York, NY, USA
Correspondence toDr Martin R Prince; map2008@ med. cornell. edu
Imaging
© Author(s) (or their employer(s)) 2021. Re- use permitted under CC BY. Published by BMJ.
ABSTRACTObjective To determine the prevalence, risk factors and natural history of hiatal hernia (HH) on CT in the general population.Materials and methods The Multi- Ethnic Study of Atherosclerosis (MESA) acquired full- lung CT on 3200 subjects, aged 53–94 years. Three blinded observers independently determined presence/absence and type (I–IV) of HH. Associations between HH and participant characteristics were assessed via unadjusted and multivariable- adjusted relative risk regression. HH natural history was assessed compared with prior MESA CT.Results Excellent interobserver agreement was found for presence (κ =0.86) and type of HH (κ =0.97). Among 316 HH identified (prevalence=9.9%), 223 (71%) were type I and 93 (29%) were type III. HH prevalence increased with age, from 2.4% in 6th decade to 16.6% in 9th decade (unadjusted prevalence ratio (PR)=1.1 (95% CI 1.04 to 1.1)). HH prevalence was greater in women (12.7%) than men (7.0%) (unadjusted PR=1.8 (95% CI 1.5 to 2.3)) and associated with proton pump inhibitor use (p<0.001). In 75 participants with HH with 10- year follow- up, median HH area increased from 9.9 cm2 to 17.9 cm2 (p=0.02) with a higher mean body mass index (BMI) in subjects with increasing HH size compared with HH decreasing in size: mean BMI=30.2±6.2 vs 26.8±7.2 (p=0.02).Conclusion HH on non- contrast CT is prevalent in the general population, increasing with age, female gender and BMI. Its association with proton pump inhibitor use confirms a role in gastro- oesophageal reflux disease and HH progression is associated with increased BMI.Trial registration number NCT00005487.
INTRODUCTIONHiatal hernia (HH) is a common incidental finding on radiological and endoscopic studies.1–5 Both the anatomical (HH) and the physiological (lower oesophageal sphincter) features of the gastro- oesophageal (GE) junction are considered to be important in the pathogenesis of gastro- oesophageal reflux disease (GERD).3 6 GERD may also contribute to HH development when acid exposure causes oesophageal mucosal injury,
which may lead to oesophageal shortening, thus ‘pulling’ the GE junction into the chest.7
Prior literature has identified potential risk factors for HH, including older age, pregnancy and obesity.5 8–15 However, these studies have been limited to specific symp-tomatic patient populations (eg, undergoing endoscopy) or with pulmonary conditions exacerbated by reflux, including idiopathic pulmonary fibrosis, chronic obstructive pulmonary disease and asthma.3 6 8 16–21 Studies establishing the prevalence and correlates of HH in a general, population- based sample are lacking.
In this study, we used CT scans from the Multi- Ethnic Study of Atherosclerosis (MESA) to assess the general population- based preva-lence, risk factors and natural history of HH over 10- year follow- up.
Key messages
What is already known about this subject? ► Hiatal hernia (HH) prevalence and risk factors have been studied extensively in the population of pa-tients undergoing endoscopy, but the prevalence of HH in the general population is unknown.
What are the new findings? ► Non- contrast CT on 3200 Multi- Ethnic Study of Atherosclerosis subjects followed up over 10 years shows HH prevalence in the general population (aged 53–94 years) increases with ageing from 2.4% in the sixth decade of life to 7.0%, 14.0% and 16.6% in seventh, eighth and ninth decades, re-spectively and is more common in women (PR=1.8) and in those with obesity (PR=1.1).
► HH on CT scans is associated with proton pump in-hibitor use and is more likely to progress in subjects with high body mass index (BMI).
How might it impact on clinical practice in the foreseeable future?
► Finding HH on chest CT raises the likelihood of gastro- oesophageal reflux disease and patients with high BMI have an association with HH progression.
copyright. on M
arch 18, 2022 by guest. Protected by
http://bmjopengastro.bm
j.com/
BM
J Open G
astroenterol: first published as 10.1136/bmjgast-2020-000565 on 17 M
arch 2021. Dow
nloaded from

2 Kim J, et al. BMJ Open Gastro 2021;8:e000565. doi:10.1136/bmjgast-2020-000565
Open access
MATERIALS AND METHODSStudy populationMESA is a prospective multisite cohort study investigating the prevalence, correlates and progression of subclinical cardiovascular disease.22 In 2000–02, MESA recruited 6814 participants aged 45–84 years from six US commu-nities. Exclusion criteria included clinical cardiovascular disease (physician diagnosis of heart attack, stroke, tran-sient ischaemic attack, heart failure, angina, current atrial fibrillation, any cardiovascular procedure), weight over 136 kg, pregnancy or any impediment to long- term participation.22 At MESA Exam 1, 6813 participants underwent cardiac CT. During 2010–12, MESA Exam 5 acquired full- lung CT scans from 3200 participants, including 67 participants who were additionally recruited for the MESA Air Study in 2005–07 (figure 1).23
CT scanningMESA Exam 5 acquired full- lung CT scans at full inspi-ration. The centres used four models of 64- slice multi-detector row CT scanners from two manufacturers (Siemens Medical Solutions, Erlangen, Germany and GE Healthcare, Waukesha, Wisconsin, USA). The protocol for scanning was based on Subpopulations and Interme-diate Outcome Measures in COPD Study/MESA Lung CT protocol.23 Images were reconstructed at 0.625 mm slice thickness.23
MESA Exam 1 scans used cardiac- gated electron- beam CT scanners (Imatron C-150) or a prospectively electrocardiogram- triggered multidetector CT acquisi-tion at 50% R- R interval acquiring a block of four axial 2.5 mm slices during each cardiac cycle sequentially (GE Lightspeed or Volume Zoom Siemens) using parameters reported previously.22
Image analysisSince MESA Exam 5 full- lung CT scans had thinner scan slice thickness compared with MESA Exam 1 cardiac CT scans and more consistently covered down to the GE junction, our study mainly used Exam 5 data. MESA Exam 1 cardiac CT scans were also analysed and used as supplementary data. CT scans were analysed using Horos (https:// horosproject. org/, open source medical image viewer). A subset of MESA Exam 1 cardiac CT scans (n=393) and MESA Exam 5 full- lung CT scans (n=1031) were reviewed independently by three observers (JK, XY, MRP) blinded to the participants’ information to calculate interobserver agreement. The remainder of the CT scans were reviewed by a single observer (JK). CT scans were evaluated for presence of HH, defined as gastric folds extending >2 cm above the diaphragm on axial images and/or reformations measured using elec-tronic callipers (figure 2). Each HH identified was clas-sified as type I–IV, as previously described,20 by the three
Figure 1 Subject recruitment flow chart. GE, gastro- oesophageal; MESA, Multi- Ethnic Study of Atherosclerosis.
Figure 2 Non- contrast chest CT of a woman aged 84 years. (A) Axial image showing type I hiatal hernia (white arrows). (B) Coronal oblique reformation shows gastric folds extending 2.9 cm (dashed line) above the diaphragm. (C) Axial image shows maximum hiatal hernia cross- sectional area measurement (dotted line, 7.6 cm2). A, aorta; E, oesophagus; L, liver; S, stomach.
copyright. on M
arch 18, 2022 by guest. Protected by
http://bmjopengastro.bm
j.com/
BM
J Open G
astroenterol: first published as 10.1136/bmjgast-2020-000565 on 17 M
arch 2021. Dow
nloaded from
3Kim J, et al. BMJ Open Gastro 2021;8:e000565. doi:10.1136/bmjgast-2020-000565
Open access
independent observers (figure 3). Discrepancies among reviewers in evaluating for the presence of HH and final type of HH were resolved by majority opinion. The largest cross- sectional HH area (cm2) on axial images was measured using the closed polygon tool. Location of the hernia relative to aorta (left, right or midline) was noted. To ensure that only CT scans with an adequate coverage of the diaphragmatic hiatus were included, any CT scans for which any of the three observers noted inadequate coverage of the diaphragmatic hiatus were excluded from further analyses. Participants with HH at both MESA Exams 1 and 5 were additionally evaluated for changes in HH type and maximum hernia cross- sectional area.
Data collectionCharacteristics of MESA participants including demo-graphics (eg, age, gender, race/ethnicity), anthropom-etry (eg, height, weight, body mass index (BMI), waist and hip circumference), smoking behaviours, alcohol use, comorbidities, medication use and parity were collected. Age was treated as both continuous and cate-gorical by decade. Education was re- categorised into five groups (<high school, high school graduate, some college, college graduate, >bachelor’s degree). Central obesity was defined as waist- to- hip ratio >0.9 for males
and >0.85 for females.24 As in prior studies, number of live births was categorised as 0, 1–2, 3–4 and >5.25
Statistical analysisFleiss’ kappa was used to assess reproducibility of HH pres-ence, type and determination of diaphragmatic coverage on Exam 1 cardiac CT scans. The intraclass correlation coefficient (ICC) was used to assess reproducibility of HH measurements (largest cross- sectional HH area and length of gastric folds above the diaphragm). Kappa and ICC values closer to 1 represent stronger reproducibility. The consensus types (ie, at least two raters agreed) and mean area measurements (ie, across all three raters) were used for all subsequent analyses.
Bivariate associations between predictor variables and HH presence were assessed using relative risk regression. Prevalence ratios were calculated using Poisson regres-sion with robust error variance. Elastic net regression was used for model selection and variables above the optimal value of the criterion threshold were considered for multi-variable analyses. For participants with HH at both Exams 1 and 5, per cent change of HH maximal cross- sectional area was calculated, as
Exam 5 area−Exam 1 areaExam 1 area × 100 .
Cox proportional hazards regression was used to model HH incidence from Exams 1 to 5 among participants free
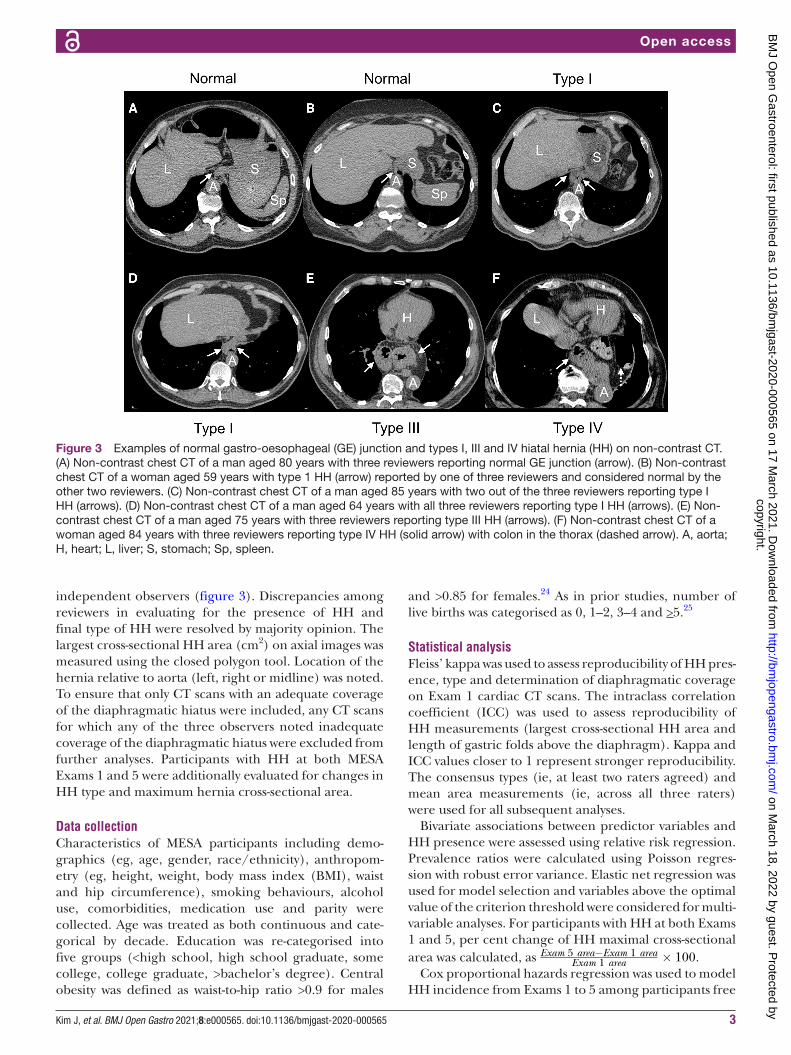
Figure 3 Examples of normal gastro- oesophageal (GE) junction and types I, III and IV hiatal hernia (HH) on non- contrast CT. (A) Non- contrast chest CT of a man aged 80 years with three reviewers reporting normal GE junction (arrow). (B) Non- contrast chest CT of a woman aged 59 years with type 1 HH (arrow) reported by one of three reviewers and considered normal by the other two reviewers. (C) Non- contrast chest CT of a man aged 85 years with two out of the three reviewers reporting type I HH (arrows). (D) Non- contrast chest CT of a man aged 64 years with all three reviewers reporting type I HH (arrows). (E) Non- contrast chest CT of a man aged 75 years with three reviewers reporting type III HH (arrows). (F) Non- contrast chest CT of a woman aged 84 years with three reviewers reporting type IV HH (solid arrow) with colon in the thorax (dashed arrow). A, aorta; H, heart; L, liver; S, stomach; Sp, spleen.
copyright. on M
arch 18, 2022 by guest. Protected by
http://bmjopengastro.bm
j.com/
BM
J Open G
astroenterol: first published as 10.1136/bmjgast-2020-000565 on 17 M
arch 2021. Dow
nloaded from

4 Kim J, et al. BMJ Open Gastro 2021;8:e000565. doi:10.1136/bmjgast-2020-000565
Open access
of HH at baseline. These models were adjusted for the potential confounders (age, sex, race/ethnicity, height and weight). The effect of intervertebral disc and verte-bral body compression on the incidence of HH was measured by modelling the loss of height from Exam 1 to Exam 5, as a continuous variable, in a logistic regres-sion model with incident HH at Exam 5 as the outcome. All analyses were performed in SAS V.9.4 (SAS Institute, Cary, North Carolina, USA). Full MESA study protocol can be accessed at https:// clinicaltrials. gov. There is no overlap with other MESA publications, https://www. mesa- nhlbi. org/ Publications. aspx.
Patient and public involvementGiven the retrospective analysis of existing data, it was not appropriate or possible to involve patients or the public in the design, or conduct, or reporting, or dissemination plans of our research.
RESULTSDemographic dataThe characteristics of study participants are summarised in table 1. In MESA Exam 5, participants (n=3200) completed full- lung CT scans. Twenty- one scans were excluded: 6 scans did not extend sufficiently inferiorly to completely image the diaphragmatic hiatus, and 15 scans had evidence of surgery (eg, surgical clips) near the GE junction (figure 1).
Of the 6813 study participants with MESA Exam 1 cardiac CT scans, 3444 (51%) had scans that did not cover the diaphragmatic hiatus, 26 of which showed stomach herniated up into the thorax. However, we decided a priori to only include scans that covered the diaphrag-matic hiatus. Four participants who received gastric pull- through surgery were also excluded.
Interobserver agreementIn Exam 5 full- lung CT scans, interobserver agreement was high for determining HH presence (κ =0.86 (95% CI 0.8 to 0.9) and HH type (κ =0.97 (95% CI 0.9 to 0.99)). Interobserver agreement was also high for the quantita-tive HH measures: for the length of gastric folds above the diaphragm, the ICC was 0.94, and for the maximum hernia cross- sectional area, the ICC was 0.99.
In Exam 1 cardiac CT scans, interobserver agreement was high for identifying cardiac CT scans with adequate coverage of the diaphragmatic hiatus (κ =0.88 (95% CI 0.8 to 0.9)), and determining the type of HH (κ =0.85 (95% CI 0.8 to 0.9)). For the maximum hernia cross- sectional area, the ICC was 0.99.
Prevalence and characteristics of hiatal herniaAmong 3179 participants with Exam 5 full- lung CT scans, 316 HHs were identified (prevalence=9.9%), including 223 type I and 93 type III (figure 2). The median HH size in the axial plane (ie, maximum cross- sectional area) was 7.1 cm2 (IQR 5.6–16.0). The median length of gastric folds above the diaphragm of the type I HH was 2.4 cm
(IQR 2.1–2.8) and 6.1 cm (IQR 5.0–7.5) for type III HH. The locations of HHs relative to aorta were midline for 307 (97%) with 9 (3%) on the left.
In bivariate analyses, HH prevalence increased with age, from 2.4% in the sixth decade of life to 7.0%, 14.0% and 16.6% in seventh, eighth and ninth decades, respectively (table 1). The prevalence of HH was 10.7% for participants 90 years of age or older. Participants with HH were significantly older than the participants without HH (p<0.001). HH presence was greater in women (12.7%) than in men (7.0%) (prevalence ratio (PR)=1.8 (95% CI 1.5 to 2.3)). HH prevalence varied by race/ethnicity, showing higher prevalence in non- Hispanic whites (12.1%), African- Americans (9.4%) and Hispanic/Latinos (11.0%) and lower prevalence in Asian- Americans (2.9%) (p<0.001). Other associations were found for markers related to obesity (BMI, waist circumference, hip circumference, central obesity), height, educational attainment, current smoking status and proton pump inhibitor use.
The top predictors from elastic net selection were age, gender, race/ethnicity and BMI. After adjusting for these variables, HH remained associated with proton pump inhibitor use (PR=1.6 (95% CI 1.2 to 2.0)), but was not significantly associated with cigarette smoking status (p=0.19), number of pregnancies (p=0.42) or number of live births (p=0.99) (table 2).
We also assessed the prevalence and characteristics of HH in Exam 1 cardiac CT scans. Among the 3365 partic-ipants with scans including the diaphragmatic hiatus, 239 HHs were identified (prevalence=7.1%), including 145 type I, 93 type III and 1 type IV HH (figure 3). The median maximal HH cross- sectional area was 9.0 cm2 in the axial plane. The locations of HH relative to aorta were mostly midline (97.0%) with more to the left (2.5%) than to the right (0.4%) of the aorta.
Bivariate analyses of HH presence in Exam 1 cardiac CT scans showed similar results to those in Exam 5 full- lung CT scans. However, in Exam 1, self- reported bron-chitis (within past 2 weeks), H2 blocker use and current use of hormone replacement therapy were additionally associated with HH presence. In Exam 1, the top predic-tors from elastic net selection were the same as in Exam 5, and after adjustment for these variables, HH remained associated with proton pump inhibitor use (p<0.001) and waist- to- hip ratio (p=0.049). There were no significant associations between HH and cigarette smoking status (p=0.28), alcohol use (p=0.69), number of pregnancies (p=0.43) or number of live births (p=0.29).
Incidence of hiatal hernia over 10-year follow-upAmong 1464 participants free of HH on baseline Exam 1 cardiac CT, the incidence rate of HH was 9 per 1000 person- years. In adjusted models, the risk of developing HH increased with weight (HR=1.01 (95% CI 1.01 to 1.02)), and was lower among Asian- Americans compared with non- Hispanic whites (HR=0.4 (95% CI 0.2 to 0.9)). For age, the incidence was always positive, consistent with
copyright. on M
arch 18, 2022 by guest. Protected by
http://bmjopengastro.bm
j.com/
BM
J Open G
astroenterol: first published as 10.1136/bmjgast-2020-000565 on 17 M
arch 2021. Dow
nloaded from

5Kim J, et al. BMJ Open Gastro 2021;8:e000565. doi:10.1136/bmjgast-2020-000565
Open access
Table 1 Characteristics of study participants at MESA Exam 5 (n=3179)
Variable
Non- contrast chest CT scans (MESA Exam 5)
HH(n=316)
No HH(n=2863)
HH prevalence ratio*(95% CI) P value
Age (years), mean±SD 73.9±8.2 68.8±9.2 1.05 (1.04 to 1.06) <0.001*
<50, n (%) 0 (0%) 0 (0%)
50–59 13/316 (4%) 522/2863 (18%) Ref Ref
60–69 79/316 (25%) 1048/2863 (37%) 2.88 (1.62 to 5.14) <0.001*
70–79 143/316 (45%) 876/2863 (31%) 5.78 (3.31 to 10.1) <0.001*
80–89 78/316 (25%) 392/2863 (14%) 6.83 (3.85 to 12.1) <0.001*
>90 3/316 (1%) 25/2863 (1%) 4.41 (1.33 to 14.6) 0.02*
Gender
Male 106/316 (34%) 1413/2863 (49%) Ref Ref
Female 210/316 (66%) 1450/2863 (51%) 1.81 (1.45 to 2.27) <0.001*
Race/Ethnicity <0.001*
White 149/316 (47%) 1084/2863 (38%) Ref Ref
African- Americans 81/316 (26%) 780/2863 (27%) 0.78 (0.60 to 1.01) 0.06
Hispanic 74/316 (23%) 597/2863 (21%) 0.91 (0.70 to 1.19) 0.49
Asian- Americans 12/316 (4%) 402/2863 (14%) 0.24 (0.13 to 0.43) <0.001*
Height (cm) 162.2±9.7 165.8±9.9 0.97 (0.96 to 0.98) <0.001*
Weight (lb) 174.3±34.7 172.4±39.1 1.00 (1.00 to 1.00) 0.37
BMI (kg/m2) 30.0±5.5 28.3±5.5 1.05 (1.03 to 1.06) <0.001*
Circumference (cm)
Waist 103±14.3 98.9±14.3 1.02 (1.01 to 1.02) <0.001*
Hip 109.0±12.9 105.2±12.0 1.02 (1.01 to 1.03) <0.001*
Waist- to- hip ratio 94.7±8.7 93.9±8.0 1.01 (1.00 to 1.02) 0.10
Central obesity† 278/316 (88%) 2380/2858 (83%) 1.42 (1.03 to 1.97) 0.03*
Body surface area 1.84±0.20 1.85±0.23 0.72 (0.47 to 1.09) 0.12
Education 0.09
<High school 51/316 (16%) 386/2859 (13%) Ref Ref
High school graduate 65/316 (21%) 497/2859 (17%) 0.99 (0.70 to 1.40) 0.96
Some college 96/316 (30%) 819/2859 (29%) 0.90 (0.65 to 1.24) 0.51
College graduate 46/316 (15%) 542/2859 (19%) 0.67 (0.46 to 0.98) 0.04*
>Bachelor’s degree 58/316 (18%) 615/2859 (21%) 0.74 (0.52 to 1.05) 0.10
Cigarette smoking 0.004*
Never smoker 151/315 (48%) 1297/2861 (45%) Ref Ref
Former smoker 147/315 (47%) 1276/2861 (45%) 0.99 (0.80 to 1.23) 0.93
Current smoker 17/315 (5%) 288/2861 (10%) 0.53 (0.33 to 0.87) 0.01*
Pack- years 24.4±26.5 22.2±25.8 1.00 (1.00 to 1.01) 0.10
Diabetes 0.81
No diabetes 188/315 (60%) 1666/2842 (59%) Ref Ref
Impaired fasting glucose 68/315 (21%) 601/2842 (21%) 1.00 (0.77 to 1.30) 0.99
Diabetes 59/315 (19%) 575/2842 (20%) 0.92 (0.69 to 1.21) 0.55
Self- reported symptoms
Emphysema/COPD 6/314 (2%) 53/2849 (2%) 1.02 (0.48 to 2.20) 0.95
Asthma 15/315 (5%) 93/2856 (3%) 1.42 (0.88 to 2.30) 0.16
Bronchitis, past 2 weeks 4/315 (1%) 37/2850 (1%) 0.98 (0.38 to 2.50) 0.97
Continued
copyright. on M
arch 18, 2022 by guest. Protected by
http://bmjopengastro.bm
j.com/
BM
J Open G
astroenterol: first published as 10.1136/bmjgast-2020-000565 on 17 M
arch 2021. Dow
nloaded from

6 Kim J, et al. BMJ Open Gastro 2021;8:e000565. doi:10.1136/bmjgast-2020-000565
Open access
increasing HH prevalence with ageing, but was less posi-tive with increasing age (HR=0.3 (95% CI 0.3 to 0.4)). HH also occurred more frequently in patients with loss of height between Exams 1 and 5 (p=0.0005) (table 3).
Natural history of hiatal herniaEighty- one of the 239 subjects with HH at Exam 1 had 10- year follow- up CT scans, 6 of whom no longer had HH on follow- up imaging, including one participant whose HH was surgically repaired and 5 participants (6.3%) whose HH spontaneously resolved. Among 75 partici-pants with HH at Exams 1 and 5, HH type was unchanged for 26 participants with type I HH and 34 participants with type III HH. Progression from type I to type III was
observed in 12 participants. The median maximal cross- sectional area of HH increased from 9.9 cm2 to 17.9 cm2 (p=0.02, figure 4). For those subjects whose HH sponta-neously resolved (n=5) or became >10% smaller in area (n=10), the mean weight loss from Exam 1 to Exam 5 was 6.9±6.5 kg compared with 2.6+7.5 kg for the other 65 subjects with HH at both exams (p=0.05).
For per cent change, the median was 36.4% (IQR 2.1–110.8). After excluding the one subject who had HH repaired, we categorised our 80 subjects with 10- year follow- up CT scans into three groups according to per cent change: ‘area increased by >10%’ (n=19), ‘area decreased by >10% or HH spontaneously resolved’
Variable
Non- contrast chest CT scans (MESA Exam 5)
HH(n=316)
No HH(n=2863)
HH prevalence ratio*(95% CI) P value
Medications
Proton pump inhibitors 74/316 (23%) 344/2863 (12%) 2.02 (1.59 to 2.57) <0.001*
H2 blockers 14/316 (4%) 84/2863 (3%) 1.46 (0.89 to 2.39) 0.14
Insulin or oral hypoglycaemics 48/315 (15%) 464/2846 (16%) 0.93 (0.69 to 1.25) 0.63
Ever been pregnant (women) 177/201 (88%) 1235/1425 (87%) 1.12 (0.75 to 1.67) 0.59
# of pregnancies 3.5±1.9 3.4±2.1 1.01 (0.96 to 1.07) 0.67
Age at first live birth 23±4.7 24±5.4 0.98 (0.96, 1.01) 0.14
*HH prevalence ratio=the prevalence of HH for the group defined by the variable in column 1.†Central obesity is defined as a waist- to- hip ratio >0.90 for males and >0.85 for females.BMI, body mass index; COPD, chronic obstructive pulmonary disease; HH, hiatal hernia; MESA, Multi- Ethnic Study of Atherosclerosis.
Table 1 Continued
Table 2 Multivariable models for presence of hiatal hernias at MESA Exam 5
Variable NPrevalence ratio(95% CI) P value
Waist- to- hip ratio 3171 1.01 (1.00 to 1.02) 0.12
Central obesity 3171 1.27 (0.91 to 1.76) 0.16
Cigarette smoking status 3176 0.19
Never smoker Ref Ref
Former smoker 0.91 (0.74 to 1.13) 0.39
Current smoker 0.68 (0.42 to 1.10) 0.11
Medications
Proton pump inhibitor 3176 1.57 (1.24 to 2.00) <0.001*
H2 blockers 3176 1.16 (0.70 to 1.93) 0.57
Bronchitis, last 2 weeks 3162 0.93 (0.36 to 2.42) 0.89
Women only
# of pregnancies 1415 0.98 (0.92 to 1.03) 0.42
# of live births 1415 0.99
0 Ref Ref
1–2 1.06 (0.56 to 1.98) 0.87
3–4 1.05 (0.55 to 2.00) 0.88
>5 1.11 (0.55 to 2.22) 0.77
Adjusted for age, gender, race/ethnicity and BMI.BMI, body mass index; MESA, Multi- Ethnic Study of Atherosclerosis.
copyright. on M
arch 18, 2022 by guest. Protected by
http://bmjopengastro.bm
j.com/
BM
J Open G
astroenterol: first published as 10.1136/bmjgast-2020-000565 on 17 M
arch 2021. Dow
nloaded from

7Kim J, et al. BMJ Open Gastro 2021;8:e000565. doi:10.1136/bmjgast-2020-000565
Open access
(n=15) and ‘area change was within 10%’ (n=46). The BMI of the subjects who showed decrease in HH area >10% or spontaneous resolution of HH (mean±SD: 26.8±7.2) was significantly lower compared with that of the subjects who showed >10% increase of HH area (mean+SD: 30.2+6.2) (p=0.02).
DISCUSSIONIn spite of the clinical significance of HH—its role in GERD,3 6 its association with aspiration and lung disease,16–21 26 27 and the potential for reducing quality of life28–30—little is known about HH prevalence, risk factors and natural history in the general population. This is due, at least in part, to the fact that traditional measures of HH, such as endoscopy, manometry or barium swallow radiography, are rarely performed in asymptomatic subjects. This MESA study involving 3179 subjects free of cardiovascular disease shows non- contrast chest CT is highly reproducible for detecting and typing HH and confirms that HH on CT is common in the general popu-lation increasing in prevalence with age, female gender and BMI. High BMI is further associated with increasing HH size over a 10- year follow- up.
Our observation of an age- dependent relationship of HH detected by CT is consistent with a meta- analysis of endoscopy studies,5 which showed a similar significant association of HH prevalence with age above 50 years.
This adds to the confidence in these CT results. This age dependence may reflect decreasing elasticity of the phreno- oesophageal ligament, which normally anchors the oesophagus to the diaphragm but progressively weakens with ageing, increasing HH risk. One aberra-tion from this age dependence was a lower prevalence of HH among participants in their 90s, 10.7% (Exam 5), compared with their 80s, 22.7% (Exam 1). This finding suggests a survival bias and could relate to previously established associations between HH and aspiration.16
Our study also showed significant associations between BMI and HH prevalence, which is in agreement with find-ings from the prior literature.5 The significant difference in BMI between the groups of participants with progres-sion of HH (ie, HH area increased >10% over 10 years) and improvement of HH (ie, HH area decreased >10% or HH spontaneously resolved) raises the possibility that obesity, which increases intra- abdominal pressure, may play a role in the development and progression of HH. Another mechanism that could contribute to observed associations of HH with both increasing age and female sex is osteoporosis, with loss of vertebral body and inter-vertebral disc space height reducing space available in the abdomen to accommodate intra- abdominal organs.31 Our data here showing incidence of HH over a 10- year interval correlating with loss of height over the same time interval supports this hypothesis. Observing HH to
Table 3 Association between amount of change in height from MESA Exam 1–5 and incidence of HH (n=1464)
Loss of height from Exam 1–5
Number without HH at Exam 1
Number developing HH between Exams 1 and 5 % with HH P trend
All 1464 133 9.1 0.0005*
<1 cm 547 38 7.0
1–2 cm 507 42 8.3
2–3 cm 255 29 11.4
3–4 cm 96 14 14.6
4–5 cm 34 6 17.7
>5 cm 25 4 16.0
P trend was measured by modelling the ordinal predictor, loss of height from Exam 1–5, as a continuous variable in a logistic regression model, with incident HH at Exam 5 as the outcome.HH, hiatal hernia; MESA, Multi- Ethnic Study of Atherosclerosis.
Figure 4 Non- contrast chest CT of a woman aged 70 years showing natural history of hiatal hernia (HH) over 10 years from Multi- Ethnic Study of Atherosclerosis (MESA) Exam 1 (2000–02) to MESA Exam 5 (2010–12). (A) Axial image of type III HH (arrows) at MESA Exam 1 (2001). (B) Increased size of type III HH (arrows) at MESA Exam 5 (2011). (C) Coronal reformation at MESA Exam 5 showing most of stomach herniated into thorax (arrows). A, aorta; H, heart; L, liver; S, stomach.
copyright. on M
arch 18, 2022 by guest. Protected by
http://bmjopengastro.bm
j.com/
BM
J Open G
astroenterol: first published as 10.1136/bmjgast-2020-000565 on 17 M
arch 2021. Dow
nloaded from

8 Kim J, et al. BMJ Open Gastro 2021;8:e000565. doi:10.1136/bmjgast-2020-000565
Open access
resolve over time is contrary to its pathophysiology and thus may reflect the threshold for detection being met on the initial exam but not subsequently, especially since these patients had weight loss between Exams 1 and 5 which might allow a sliding hiatal hernia to reduce in size.
Although our observation of higher HH prevalence females contrasts with the prior meta- analysis,5 in that endoscopy study only 38.8% of subjects were male indi-cating a bias towards undersampling males. Less symp-tomatic males (with lower likelihood of HH) refusing invasive endoscopy may explain those meta- analysis data which also had high heterogeneity (I2=90%). Also contrary to some prior studies,32 33 we did not identify significant associations between HH and parity (number of pregnancies, p=0.42; number of live births, p=0.99). This may relate to the advanced age of our population, since pregnancy- induced HH could resolve sponta-neously over time.
HH on CT was less common in Asian- Americans compared with other race/ethnic groups consistent with GERD being uncommon in Asian countries compared with the western world.34 Kang and Ho35 showed that reflux oesophagitis and HH are more common in English dyspeptic patients compared with Singaporeans. Consid-ering that obesity has been recognised as an important HH risk factor,5 one theory to explain this finding is that Asian- Americans have lower BMI compared with that of Whites, African- Americans and Hispanics/Latinos. In our study population, Asian- Americans did have lower BMI compared with other race/ethnic groups. However, even after re- categorising into ‘Asian- Americans’ and ‘not Asian- Americans’ (ie, Whites/African- Americans/Hispanics), Asian- Americans had a significantly lower prevalence of HH (PR=0.4 (95% CI 0.2 to 0.6)), after adjusting for age, sex and BMI indicating that lower BMI among Asian- Americans does not fully account for their lower prevalence of HH.
From a clinical standpoint, HH was strongly associ-ated with proton pump inhibitor use, which is among the most common therapies for GERD.3 This supports HH detected on CT as an important structural cause of GERD. Interestingly, only one participant with HH at Exam 1 underwent surgical repair. This may reflect a substantial prevalence of asymptomatic or minimally symptomatic HH, the efficacy of medical management of GERD and also reticence to pursue surgical repair. Also of note, although alcohol use is an important risk factor for GERD,1 alcohol use showed no association with HH. In addition, HH was not associated with cigarette smoking status.
Strengths of our study include the highly reproducible quantitative and qualitative measures of HH on non- contrast full- lung and cardiac CT scans, and application within a large, highly characterised, multiethnic, US general population- based sample with 10- year follow- up. The major limitation of our study is the lack of a gold standard against which our HH observations could be
validated. Similarities to prevalence measures from endoscopy- based studies are reassuring and probably all type III HH are accurately identified by CT. But CT may be insensitive to small, sliding HH as defined by surgery or high- resolution manometry.36 Assessment of Exam 1 cardiac CT scans was additionally limited by the lower resolution of multiplanar reformations, although type III and type IV HHs were readily identified on axial images and the prevalence results were similar between Exam 1 and the higher- resolution MESA Exam 5 CT. One advan-tage of CT was the high reproducibility of typing and quantifying HH size.
In conclusion, HH is detected on non- contrast CT with high reproducibility. It is prevalent in the general popula-tion, increasing with age, female gender and BMI similar to results from endoscopy studies of HH. Increasing inci-dence of HH with loss of height is consistent with the known association of HH with vertebral compression fractures. Association of detecting HH on CT with proton pump inhibitor use confirms a role in GERD and the association of CT- detected HH progression with BMI is important prognostically.
Acknowledgements The authors would like to thank the other investigators, the staff and the participants of the MESA study for their valuable contributions. A full list of participating MESA investigators and institutions can be found at http://www. mesa- nhlbi. org.
Contributors MRP, RGB, BMS and ECO planned the study. JK, XY and MRP independently reviewed CT scans to collect data. GTH performed statistical analyses. All authors critically reviewed and analysed the data, contributed to manuscript writing and approved the final draft.
Funding This research was supported by grants R01- HL077612, R01- HL093081, R01- HL121270, and R01- HL130506 from the National Institutes of Health. MESA was supported by contracts 75N92020D00001, HHSN268201500003I, N01- HC-95159, 75N92020D00005, N01- HC-95160, 75N92020D00002, N01- HC-95161, 75N92020D00003, N01- HC-95162, 75N92020D00006, N01- HC-95163, 75N92020D00004, N01- HC-95164, 75N92020D00007, N01- HC-95165, N01- HC-95166, N01- HC-95167, N01- HC-95168 and N01- HC-95169 from the National Heart, Lung, and Blood Institute, and by grants UL1- TR-000040, UL1- TR-001079 and UL1- TR-001420 from the National Center for Advancing Translational Sciences (NCATS). This publication was developed under the Science to Achieve Results (STAR) research assistance agreements, No. RD831697 (MESA Air) and RD-83830001 (MESA Air Next Stage), awarded by the US Environmental Protection Agency. It has not been formally reviewed by the EPA
Disclaimer The views expressed in this document are solely those of the authors and the EPA does not endorse any products or commercial services mentioned in this publication.
Competing interests None declared.
Patient consent for publication Not required.
Ethics approval The Multi- Ethnic Study of Atherosclerosis (MESA) was approved by local institutional review boards. All subjects signed written informed consent and this post hoc analysis was approved by the MESA steering committee.
Provenance and peer review Not commissioned; externally peer reviewed.
Data availability statement Data relevant to the study are available as a limited access dataset via the Multi- Ethnic Study of Atherosclerosis www. mesa- nhlbi. org.
Open access This is an open access article distributed in accordance with the Creative Commons Attribution 4.0 Unported (CC BY 4.0) license, which permits others to copy, redistribute, remix, transform and build upon this work for any purpose, provided the original work is properly cited, a link to the licence is given, and indication of whether changes were made. See: https:// creativecommons. org/ licenses/ by/ 4. 0/.
copyright. on M
arch 18, 2022 by guest. Protected by
http://bmjopengastro.bm
j.com/
BM
J Open G
astroenterol: first published as 10.1136/bmjgast-2020-000565 on 17 M
arch 2021. Dow
nloaded from

9Kim J, et al. BMJ Open Gastro 2021;8:e000565. doi:10.1136/bmjgast-2020-000565
Open access
ORCID iDMartin R Prince http:// orcid. org/ 0000- 0002- 9883- 0584
REFERENCES 1 Kellerman R, Kintanar T. Gastroesophageal reflux disease. Prim Care
2017;44:561–73. 2 Locke GR, Talley NJ, Fett SL, et al. Prevalence and clinical spectrum
of gastroesophageal reflux: a population- based study in Olmsted County, Minnesota. Gastroenterology 1997;112:1448–56.
3 Hyun JJ, Bak Y- T. Clinical significance of hiatal hernia. Gut Liver 2011;5:267–77.
4 Kahrilas PJ, Kim HC, Pandolfino JE. Approaches to the diagnosis and grading of hiatal hernia. Best Pract Res Clin Gastroenterol 2008;22:601–16.
5 Menon S, Trudgill N. Risk factors in the aetiology of hiatus hernia: a meta- analysis. Eur J Gastroenterol Hepatol 2011;23:133–8.
6 Kahrilas PJ. The role of hiatus hernia in GERD. Yale J Biol Med 1999;72:101–11.
7 Paterson WG, Kolyn DM. Esophageal shortening induced by short- term intraluminal acid perfusion in opossum: a cause for hiatus hernia? Gastroenterology 1994;107:1736–40.
8 Amano K, Adachi K, Katsube T, et al. Role of hiatus hernia and gastric mucosal atrophy in the development of reflux esophagitis in the elderly. J Gastroenterol Hepatol 2001;16:132–6.
9 Becher A, Dent J. Systematic review: ageing and gastro- oesophageal reflux disease symptoms, oesophageal function and reflux oesophagitis. Aliment Pharmacol Ther 2011;33:442–54.
10 Furukawa N, Iwakiri R, Koyama T, et al. Proportion of reflux esophagitis in 6010 Japanese adults: prospective evaluation by endoscopy. J Gastroenterol 1999;34:441–4.
11 Kim JH, Hwang JK, Kim J, et al. Endoscopic findings around the gastroesophageal junction: an experience from a tertiary hospital in Korea. Korean J Intern Med 2008;23:127–33.
12 Li W, Zhang S- T, Yu Z- L. Clinical and endoscopic features of Chinese reflux esophagitis patients. World J Gastroenterol 2008;14:1866–71.
13 Loffeld RJLF, van der Putten ABMM. Newly developing hiatus hernia: a survey in patients undergoing upper gastrointestinal endoscopy. J Gastroenterol Hepatol 2002;17:542–4.
14 Rezailashkajani M, Roshandel D, Shafaee S, et al. High prevalence of reflux oesophagitis among upper endoscopies of Iranian patients. Eur J Gastroenterol Hepatol 2007;19:499–506.
15 Zagari RM, Fuccio L, Wallander M- A, et al. Gastro- Oesophageal reflux symptoms, oesophagitis and Barrett's oesophagus in the general population: the Loiano- Monghidoro study. Gut 2008;57:1354–9.
16 Allaix ME, Fisichella PM, Noth I, et al. The pulmonary side of reflux disease: from heartburn to lung fibrosis. J Gastrointest Surg 2013;17:1526–35.
17 Mays EE, Dubois JJ, Hamilton GB. Pulmonary fibrosis associated with tracheobronchial aspiration. A study of the frequency of hiatal hernia and gastroesophageal reflux in interstitial pulmonary fibrosis of obscure etiology. Chest 1976;69:512–5.
18 Noth I, Zangan SM, Soares RV, et al. Prevalence of hiatal hernia by blinded multidetector CT in patients with idiopathic pulmonary fibrosis. Eur Respir J 2012;39:344–51.
19 Raghu G, Meyer KC. Silent gastro- oesophageal reflux and microaspiration in IPF: mounting evidence for anti- reflux therapy? Eur Respir J 2012;39:242–5.
20 Tossier C, Dupin C, Plantier L, et al. Hiatal hernia on thoracic computed tomography in pulmonary fibrosis. Eur Respir J 2016;48:833–42.
21 Yelisetti R, Awad A, Kaji A. Diffuse parenchymal lung disease with micro aspirations in presence of hiatal hernia. Respir Med Case Rep 2017;22:212–4.
22 Bild DE, Bluemke DA, Burke GL, et al. Multi- Ethnic study of atherosclerosis: objectives and design. Am J Epidemiol 2002;156:871–81.
23 Hoffman EA, Ahmed FS, Baumhauer H, et al. Variation in the percent of emphysema- like lung in a healthy, nonsmoking multiethnic sample. The MESA lung study. Ann Am Thorac Soc 2014;11:898–907.
24 Sahakyan KR, Somers VK, Rodriguez- Escudero JP, et al. Normal- Weight central obesity: implications for total and cardiovascular mortality. Ann Intern Med 2015;163:827–35.
25 Ogunmoroti O, Osibogun O, Kolade OB, et al. Multiparity is associated with poorer cardiovascular health among women from the multi- ethnic study of atherosclerosis. Am J Obstet Gynecol 2019;221:631.e1–631.e16.
26 Oldham JM, Collard HR. Comorbid conditions in idiopathic pulmonary fibrosis: recognition and management. Front Med 2017;4:123.
27 Kim C, Ouyang W, Dass C, et al. Hiatal hernia on chest high- resolution computed tomography and exacerbation rates in COPD individuals. Chronic Obstr Pulm Dis 2016;3:570–9.
28 Scheffer RCH, Bredenoord AJ, Hebbard GS, et al. Effect of proximal gastric volume on hiatal hernia. Neurogastroenterol Motil 2010;22:e120:552–6.
29 Perdikis G, Hinder RA, Filipi CJ, et al. Laparoscopic paraesophageal hernia repair. Arch Surg 1997;132:586–9.
30 El Khoury R, Ramirez M, Hungness ES, et al. Symptom relief after laparoscopic paraesophageal hernia repair without mesh. J Gastrointest Surg 2015;19:1938–42.
31 Yamaguchi T, Sugimoto T, Yamada H, et al. The presence and severity of vertebral fractures is associated with the presence of esophageal hiatal hernia in postmenopausal women. Osteoporos Int 2002;13:331–6.
32 Schwentner L, Wulff C, Kreienberg R, et al. Exacerbation of a maternal hiatus hernia in early pregnancy presenting with symptoms of hyperemesis gravidarum: case report and review of the literature. Arch Gynecol Obstet 2011;283:409–14.
33 Eglinton T, Coulter GN, Bagshaw P, et al. Diaphragmatic hernias complicating pregnancy. ANZ J Surg 2006;76:553–7.
34 Kang JY. Systematic review: geographical and ethnic differences in gastro- oesophageal reflux disease. Aliment Pharmacol Ther 2004;20:705–17.
35 Kang JY, Ho KY. Different prevalences of reflux oesophagitis and hiatus hernia among dyspeptic patients in England and Singapore. Eur J Gastroenterol Hepatol 1999;11:845–50.
36 Tolone S, Savarino E, Zaninotto G, et al. High- resolution manometry is superior to endoscopy and radiology in assessing and grading sliding hiatal hernia: A comparison with surgical in vivo evaluation. United European Gastroenterol J 2018;6:981–9.
copyright. on M
arch 18, 2022 by guest. Protected by
http://bmjopengastro.bm
j.com/
BM
J Open G
astroenterol: first published as 10.1136/bmjgast-2020-000565 on 17 M
arch 2021. Dow
nloaded from