hhs public access krishna somandepalli, ms philip t. reiss
TRANSCRIPT

Mode of Anisotropy Reveals Global Diffusion Alterations in Attention-Deficit/Hyperactivity Disorder
Yuliya N. Yoncheva, PhD, Krishna Somandepalli, MS, Philip T. Reiss, PhD, Clare Kelly, PhD, Adriana Di Martino, MD, Mariana Lazar, PhD, Juan Zhou, PhD, Michael P. Milham, MD, PhD, and F. Xavier Castellanos, MDDrs. Yoncheva, Reiss, Kelly, Di Martino, Lazar, and Castellanos and Mr. Somandepalli are with New York University, New York. Drs. Reiss, Kelly, Milham, and Castellanos are with the Nathan Kline Institute for Psychiatric Research, Orangeburg, NY. Dr. Kelly is with the Institute of Neuroscience, Trinity College Dublin, Ireland. Dr. Zhuo is with the Center for Cognitive Neuroscience, Duke-National University of Singapore Graduate Medical School, Singapore. Dr. Milham is with the Child Mind Institute, New York
Abstract
Objective—Diffusion tensor imaging (DTI) can identify structural connectivity alterations in
attention-deficit/hyperactivity disorder (ADHD). Most ADHD DTI studies have concentrated on
regional differences in fractional anisotropy (FA) despite its limited sensitivity to complex white
matter architecture and increasing evidence of global brain differences in ADHD. Here, we
examine multiple DTI metrics in separate samples of children and adults with and without ADHD
with a principal focus on global between-group differences.
Method—Two samples: adults with ADHD (n = 42) and without (n = 65) and children with
ADHD (n = 82) and without (n = 80) were separately group matched for age, sex, and head
motion. Five DTI metrics (FA, axial diffusivity, radial diffusivity, mean diffusivity, and mode of
anisotropy) were analyzed via tract-based spatial statistics. Group analyses tested for diagnostic
differences at the global (averaged across the entire white matter skeleton) and regional level for
each metric.
Results—Robust global group differences in diffusion indices were found in adults, with the
largest effect size for mode of anisotropy (MA; Cohen’s d = 1.45). Global MA also differed
significantly between groups in the pediatric sample (d = 0.68). In both samples, global MA
increased classification accuracy compared to the model with clinical Conners’ ADHD ratings
alone. Regional diagnostic differences did not survive familywise correction for multiple
comparisons.
Conclusion—Global DTI metrics, particularly the mode of anisotropy, which is sensitive to
crossing fibers, capture connectivity abnormalities in ADHD across both pediatric and adult
Correspondence to Francisco Xavier Castellanos, MD, Center for Neuro-developmental Disorders, NYU Langone Medical Center, Department of Child and Adolescent Psychiatry, 1 Park Ave, Rm 7th floor, New York, NY 10016; [email protected].
Dr. Reiss served as the statistical expert for this research.
Disclosure: Drs. Yoncheva, Reiss, Kelly, Di Martino, Lazar, Zhuo, Milham, Castellanos, and Mr. Somandepalli report no biomedical financial interests or potential conflicts of interest.
HHS Public AccessAuthor manuscriptJ Am Acad Child Adolesc Psychiatry. Author manuscript; available in PMC 2017 February 01.
Published in final edited form as:J Am Acad Child Adolesc Psychiatry. 2016 February ; 55(2): 137–145. doi:10.1016/j.jaac.2015.11.011.
Author M
anuscriptA
uthor Manuscript
Author M
anuscriptA
uthor Manuscript

samples. These findings highlight potential diffuse white matter microarchitecture differences in
ADHD.
Keywords
ADHD; DTI; fractional anisotropy; adults; biomarkers
Models of the pathophysiology of attention-deficit/hyperactivity disorder (ADHD), a
childhood-onset psychiatric disorder, have evolved from concentrating on fronto-striatal-
cerebellar circuits to encompassing large-scale distributed networks.1–3 Diffusion tensor
imaging (DTI), which allows quantification of white matter microstructure, can inform the
whole-brain substrates of pathologic alterations in structural connectivity. Most DTI studies
of ADHD have limited their scope to tracts selected a priori or are pending definitive
replication with rigorous control for multiple comparisons4; consequently, the localization
and significance of particular regional white matter abnormalities in ADHD remain
tentative.
In considering the heterogeneity of DTI findings, we note the global structural alterations in
ADHD that other imaging modalities have consistently detected. Reliable overall reductions
in total brain volume5–7 and global cortical thickness8–10 led us to reason that white matter
connectivity might also be globally altered in ADHD. Furthermore, although delineating
regional DTI differences can isolate particular loci of ADHD-related abnormalities,11–14
global measures reduce neuroimaging data dimensionality, which is statistically
advantageous,15 providing impetus for a systematic examination of global diffusion indices.
The most ubiquitously reported diffusion parameter is fractional anisotropy (FA).16
Although FA is often interpreted as indexing white matter “integrity,” Jones et al.17
compellingly argued that this is an oversimplification. Moreover, interpreting FA is
particularly problematic in areas with complex white matter architecture, e.g., crossing
fibers, the proportion of which ranges from 63% to 90% in typical-resolution white matter
voxels.18 As the precise nature of white matter pathology in ADHD is unclear,
complementary indices of diffusion tensor geometry warrant investigation.
One candidate tensor shape metric is the mode of anisotropy (MA),19 not to be confused
with the statistical term mode denoting the most frequent item in a set. MA is
mathematically orthogonal to FA and quantifies second-order geometric properties,19,20
notably resolving whether anisotropy is more planar (e.g., due to predominant crossing
fibers within a voxel) or more linear (see Figure S1, available online). Investigators have
begun to examine MA in brain disorders.21–23 MA has contributed unique information
relevant to clinical neurodegenerative progression,24 but it has yet to be examined in
ADHD.
The current study investigated global white matter microstructure in individuals with
ADHD, assessing a gamut of DTI indices (including MA and conventional FA). Primary
analyses were conducted in an adult sample and, to assess generalizability, repeated in a
separate, pediatric sample with data acquired using the same scanner and imaging protocol.
Within each of the 2 samples, the ADHD group was contrasted with an age-matched
Yoncheva et al. Page 2
J Am Acad Child Adolesc Psychiatry. Author manuscript; available in PMC 2017 February 01.
Author M
anuscriptA
uthor Manuscript
Author M
anuscriptA
uthor Manuscript
neurotypical (NT) comparison group. Tract-based spatial statistics (TBSS)25 was used to
create a white matter skeleton common to all individuals in each sample. First, all global
measures, aggregated across all white matter voxels in the TBSS skeleton, were contrasted
between ADHD and NT groups. Second, we explored separately in each sample the
prediction of ADHD diagnosis by combining global diffusion, demographic measures, and
clinical ratings. Finally, to facilitate comparison with prior regional difference reports, we
conducted supplementary whole-brain contrasts26 of ADHD and NT participants within
each sample.
METHOD
Participants
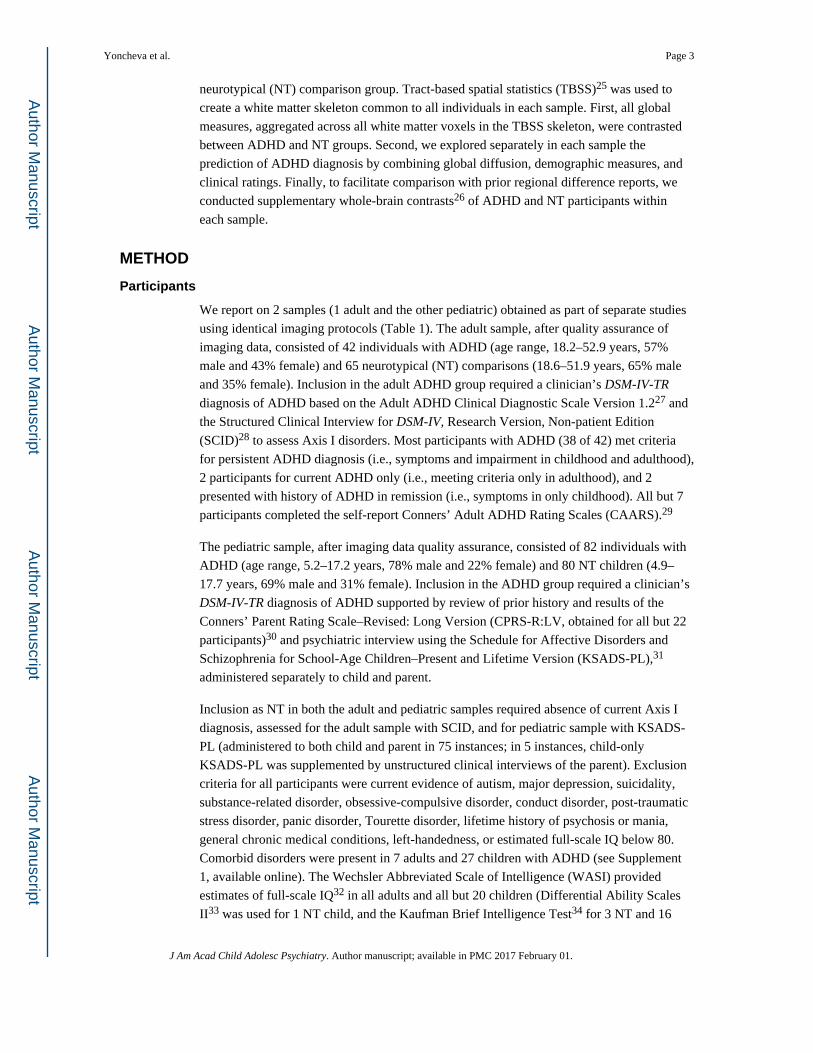
We report on 2 samples (1 adult and the other pediatric) obtained as part of separate studies
using identical imaging protocols (Table 1). The adult sample, after quality assurance of
imaging data, consisted of 42 individuals with ADHD (age range, 18.2–52.9 years, 57%
male and 43% female) and 65 neurotypical (NT) comparisons (18.6–51.9 years, 65% male
and 35% female). Inclusion in the adult ADHD group required a clinician’s DSM-IV-TR
diagnosis of ADHD based on the Adult ADHD Clinical Diagnostic Scale Version 1.227 and
the Structured Clinical Interview for DSM-IV, Research Version, Non-patient Edition
(SCID)28 to assess Axis I disorders. Most participants with ADHD (38 of 42) met criteria
for persistent ADHD diagnosis (i.e., symptoms and impairment in childhood and adulthood),
2 participants for current ADHD only (i.e., meeting criteria only in adulthood), and 2
presented with history of ADHD in remission (i.e., symptoms in only childhood). All but 7
participants completed the self-report Conners’ Adult ADHD Rating Scales (CAARS).29
The pediatric sample, after imaging data quality assurance, consisted of 82 individuals with
ADHD (age range, 5.2–17.2 years, 78% male and 22% female) and 80 NT children (4.9–
17.7 years, 69% male and 31% female). Inclusion in the ADHD group required a clinician’s
DSM-IV-TR diagnosis of ADHD supported by review of prior history and results of the
Conners’ Parent Rating Scale–Revised: Long Version (CPRS-R:LV, obtained for all but 22
participants)30 and psychiatric interview using the Schedule for Affective Disorders and
Schizophrenia for School-Age Children–Present and Lifetime Version (KSADS-PL),31
administered separately to child and parent.
Inclusion as NT in both the adult and pediatric samples required absence of current Axis I
diagnosis, assessed for the adult sample with SCID, and for pediatric sample with KSADS-
PL (administered to both child and parent in 75 instances; in 5 instances, child-only
KSADS-PL was supplemented by unstructured clinical interviews of the parent). Exclusion
criteria for all participants were current evidence of autism, major depression, suicidality,
substance-related disorder, obsessive-compulsive disorder, conduct disorder, post-traumatic
stress disorder, panic disorder, Tourette disorder, lifetime history of psychosis or mania,
general chronic medical conditions, left-handedness, or estimated full-scale IQ below 80.
Comorbid disorders were present in 7 adults and 27 children with ADHD (see Supplement
1, available online). The Wechsler Abbreviated Scale of Intelligence (WASI) provided
estimates of full-scale IQ32 in all adults and all but 20 children (Differential Ability Scales
II33 was used for 1 NT child, and the Kaufman Brief Intelligence Test34 for 3 NT and 16
Yoncheva et al. Page 3
J Am Acad Child Adolesc Psychiatry. Author manuscript; available in PMC 2017 February 01.
Author M
anuscriptA
uthor Manuscript
Author M
anuscriptA
uthor Manuscript

children with ADHD). The institutional review boards of the New York University (NYU)
School of Medicine and NYU granted ethical approval. All participants provided written
informed consent and, for minors, assent.
Data Acquisition
Magnetic resonance imaging (MRI) data were obtained at the NYU Center for Brain
Imaging using a 3T Siemens Allegra scanner with a single-channel Nova head coil.
Anatomical T1-weighted images were obtained using 3D Magnetization Prepared Rapid
Acquisition Gradient Echo sequence (TR = 2,530 milliseconds; TE = 3.25 milliseconds; TI
= 1,100 milliseconds; flip angle = 7°). Two DTI scans were acquired using a twice-
refocused diffusion-weighted echo-planar image sequence with parameters TR = 5,200
milliseconds; TE = 78 milliseconds; 50 slices; acquisition matrix 64 × 64; field of view = 92
mm; acquisition voxel size = 3 × 3 × 3 mm; 64 non-collinear diffusion directions, uniformly
distributed around a unit sphere with a b-value of 1000 s/mm2; 1 image with no diffusion
weighting. A gradient echo field map was collected (TR = 834 milliseconds; TEs = 5.23 and
7.69 milliseconds) with slice position and resolution identical to those of the diffusion-
weighted images.
DTI Preprocessing and Quality Assurance
Diffusion-weighted data were pre-processed using FMRIB Software Library version 5.35
Motion correction (linear registration) was followed by correction of image distortions from
eddy currents and B0-field inhomogeneities. Absolute intervolume displacement36 of each
image with respect to the first image in the run was computed. For participants with
maximum displacement within 1.5 × voxel size (grand total = 410 participants), individual
maps were visually inspected for signal dropout, brain coverage, artifacts, and additional
motion. Based on quality control criteria, data from 5 ADHD (11% of initial sample of
adults with ADHD) and 12 NT (13%) adults, and 67 ADHD (45%) and 57 NT (42%)
children, were discarded. Mean absolute intervolume displacement served as the primary
head motion index for subsequent analyses. Analyses were repeated with mean volume-by-
volume translation and mean volume-by-volume rotation as supplementary motion
indices.36,37 Diffusion gradients were rotated to improve consistency with the motion
parameters, and data for each of the two 64-direction scans were used to fit the tensor
parameters, thus improving signal-to-noise ratio. Following fitting of diffusion tensors at
each voxel, fractional anisotropy (FA), axial diffusivity (AD), radial diffusivity (RD), mean
diffusivity (MD), and mode of anisotropy (MA) values were generated. Three additional
shape measures (linear cL, planar cP, and spherical cS tensor components38) were computed
to characterize post hoc differences in diffusion tensor geometry.19 All analyses detailed
below (global and voxelwise) were performed separately for the pediatric and adult samples,
unless noted otherwise.
Tract-Based Spatial Statistics (TBSS)
Further data processing was performed using tract-based spatial statistics (TBSS),25 which
calculates a white matter “skeleton” to represent the center of each white-matter tract
common to all participants, thus ameliorating the impact of imperfect alignment,
registration, and arbitrarily thresholded spatial smoothing. TBSS is commonly preferred
Yoncheva et al. Page 4
J Am Acad Child Adolesc Psychiatry. Author manuscript; available in PMC 2017 February 01.
Author M
anuscriptA
uthor Manuscript
Author M
anuscriptA
uthor Manuscript

when contrasting patients with NT individuals despite potential drawbacks.39 First,
nonlinear registration aligned every FA image to every other one, identifying the “most
representative” image as the target. This target was then affine-aligned into Montreal
Neurological Institute (MNI) 152 standard space, and each image transformed into 1 × 1 ×
1-mm3 MNI space by combining the nonlinear transform to the target with the affine
transform from that target to MNI152 space. Next, each participant’s images were brought
into the standard space (study-specific template, separate for each of the 2 samples) via
nonlinear transformations. Voxelwise and global analyses were conducted for voxels within
the extent of the mean FA skeleton (FA threshold ≥0.3) with FA, AD, RD, MD, and MA
projected onto it.
Analyses
Group Characteristics—In each sample, the NT and ADHD groups were compared with
respect to demographic, clinical, and head motion measures using χ2 and unpaired 2-tailed t
tests. As motion can elicit spurious between-group differences,36 we also examined whether
global MA and motion were correlated.
Global White Matter Analysis of Diffusion Characteristics—First, we checked for
outliers. The upper and lower thresholds were set at 2.2 × interquartile range (IQR) above
the 75th percentile and below the 25th percentile, respectively.40 In adults, no outliers were
found in FA, AD, RD, or MA. Two NT participants had MD values of 3.1 × IQR and 2.5 ×
IQR below the 25th percentile. Among children, one outlier was found for AD (NT at 2.3 ×
IQR above the 75th percentile). Outliers were excluded from subsequent global diffusion
analyses involving MD or AD.
ADHD Versus NT Contrasts—A global index, that is, values averaged across the entire
skeleton, was calculated separately for FA, AD, RD, MD, and MA, yielding 1 value per DTI
index per individual. Analogously, global cL, cP, and cS were calculated. Global indices
were contrasted between the ADHD and NT groups using 2-tailed t tests and linear models
controlling for the common confounders age, sex, ADHD subtype, IQ, medication history
(stimulant-naive or not), and head motion; effect sizes are given as Cohen’s d.
ADHD Diagnosis Correlates—We investigated the effect of microstructural DTI metrics
and of demographic and clinical rating measures on the probability of an ADHD diagnosis.
To allow direct comparison between measures,41 we used a forward stepwise binary logistic
regression including the global DTI indices (FA, AD, RD, MD, and MA), age, sex, motion,
and the respective Conners’ ADHD total T score (adult sample: CAARS; pediatric sample:
CPRS-R:LV) with default cut-off value of 0.5 and criterion of adding (p < .05) and keeping
only significant correlates (p < .1). All global diffusion indices were linearly scaled by a
factor of 100 to facilitate interpretation of unit change in odds ratio. Secondarily, effects of
predictors were illustrated using receiver operating characteristic (ROC) curves and 10-fold
cross-validated area under the ROC curves.
Confirmatory Analyses in Native Space—Since this is the first study to examine
global MA effects in ADHD, supplementary analyses were carried out to examine the
Yoncheva et al. Page 5
J Am Acad Child Adolesc Psychiatry. Author manuscript; available in PMC 2017 February 01.
Author M
anuscriptA
uthor Manuscript
Author M
anuscriptA
uthor Manuscript

possibility that TBSS registration and normalization procedures39 might affect MA and
inflate effect sizes. Accordingly, to evaluate MA effects independently of the biases inherent
to registration to a common template, global MA for each participant was also computed
within each individual’s native space. We derived white matter native space boundaries
using FA, rather than MA, to provide an independent estimate from a mathematically
orthogonal measure. After assessing 3 potential FA thresholds in the 0.40–0.45 range,
individual FA maps were thresholded at >0.43, a cut-off value that concurrently satisfied 2
conditions: predominant inclusion of white matter, and preservation of a minimal volume
comparable in size to the one derived from TBSS. We first confirmed that the volumes of
the resulting individual masks did not differ between the ADHD and NT groups in either
sample (p > .2). All analyses conducted with TBSS-derived MA were repeated using MA
computed in native space as defined by each individual’s FA mask. Finally, we also
examined the correlation between MA and age across the pediatric and adult samples
combined.
Supplementary Voxelwise Analyses—Supplementary analyses assessed distributed,
voxelwise differences across the white matter skeleton. We examined the effect of diagnosis
(ADHD, NT) in separate models for FA (the most widely used diffusion index) and MA (the
only DTI measure that differed significantly in both samples), adjusting for age, sex, motion,
and its respective global diffusion index (given that global diffusion differed significantly
between groups). To control for multiple comparisons (familywise error rate at α = 0.05),
we applied the threshold-free cluster enhancement algorithm,26 with standard settings for
DTI.
RESULTS
Group Characteristics
Demographic factors (e.g., IQ) were equivalent between the ADHD and NT groups for both
samples (Table 1). Head motion did not differ significantly between NT participants and
those with ADHD in either sample (pmin = 0.21), with mean rotation and translation values
comparable to those in previous reports.36,37 In addition, motion was not significantly
correlated with global MA in either diagnostic group in either of the samples (pmin=0.45; see
Figure S2, available online).
Global White Matter Analysis of Microstructural Characteristics
We first directly contrasted ADHD and NT in each age sample separately for every global
DTI metric. As depicted in Figure 1A, global FA, AD, MD, and MA were significantly
lower for the adult group with ADHD relative to the corresponding NT group, with greatest
effect size for MA (d = 1.45). For the pediatric sample, only MA was significantly lower in
ADHD (d = 0.68) (Figure 1B). Our post hoc analyses of linear, planar, and spherical shape
measures largely supported the effects observed using MA. Planar anisotropy was
significantly greater in individuals with ADHD relative to NT in both samples. Adults with
ADHD also had greater spherical anisotropy and lower linear anisotropy than NT adults
(Table S1, available online). Figure 2 shows the distributions of global MA values for both
samples.
Yoncheva et al. Page 6
J Am Acad Child Adolesc Psychiatry. Author manuscript; available in PMC 2017 February 01.
Author M
anuscriptA
uthor Manuscript
Author M
anuscriptA
uthor Manuscript

Global MA differences in each of the 2 samples suggest that MA is associated with ADHD
diagnosis. Nonetheless, we considered possible confounds. First, we repeated analyses with
age, sex, head motion, ADHD subtype, IQ, and medication history as covariates. The pattern
of results and effect sizes were essentially unchanged (data not shown). Second, to address
possible biases from the transformations inherent to spatial normalization via TBSS, we
repeated analyses in native space using white matter masks based on each individual’s FA.
Lower MA in ADHD in native space was corroborated for adult (t105 = 7.45, p < .001, d =
1.40) and pediatric samples (t160 = 5.13, p < .001, d = 0.62). We also examined the subset of
38 adult participants reporting persistent ADHD and confirmed significantly lower global
MA relative to NT (t101 = 6.70, p < .001, d = 1.37).
By design, our adult and pediatric samples were analyzed separately. Still, as the 2 samples
had nonoverlapping age ranges, we explored the relationship between global MA and age by
aggregating data across samples (see Figure S3, available online). A significant effect of age
was found for the primary global MA measure derived from the TBSS skeleton (t267 = 3.32,
p < .05) and the confirmatory global MA measure derived in native space (t267 = 2.04, p < .
05). As expected, adjusting for age, the main effect of diagnosis was corroborated in the
combined sample (pmax = .005) with no significant interaction between age and diagnosis
(pmin = .16). Further analyses with penalized splines42 did not detect nonlinear age effects or
age-varying ADHD effects (data not shown).
The relation between global MA and Conners’ scores for each sample is illustrated in Figure
S4 (available online). Examined within each group separately, 2-tailed Pearson correlations
between global MA and Conners’ scores did not reach significance (pmin=.22). Across all
individuals within a sample, Conners’ scores were significantly correlated with global MA
(adult sample: r98 = −0.505, p < .001; pediatric sample: r138 = −0.274, p < .001). We found
no evidence of global MA differences between the 2 most predominant ADHD subtypes in
our samples, Combined type and Inattentive type (adult sample: t39 = 1.58, p = .12, pediatric
sample: t74 = 0.62, p = .54). Finally, we corroborated that global MA values were
comparable between medication-naive patients and those with a history of stimulant use
(adult sample: t40 = 0.48, p = .63, pediatric sample: t80 = 0.68, p = .50).
Predictors of ADHD Diagnosis
In line with the long-term goal of developing biomarkers,43 we carried out forward stepwise
binary logistic regression (Table 2), which included all global DTI measures, ADHD rating
scales, age, sex, and motion, to identify the maximally predictive combination of variables
for ADHD separately within each sample. Stepwise logistic regression yielded a model that
contained only Conners’ scales (CAARS or CPRS-R:LV, for adult and pediatric samples,
respectively) and global MA as significant predictors. In the pediatric sample, analyses
using Conners’ Teachers Rating Scale–Revised: Long Version30 scores corroborated results
obtained with CPRS-R:LV, as shown in Supplement 1, available online. The ROC curves
for Conners’ scores, with and without global MA in the model, are depicted in Figure S5,
available online. Sensitivity and specificity and positive and negative predictive values for
the significant predictors of ADHD diagnosis in each step are reported in Table S2, available
online.
Yoncheva et al. Page 7
J Am Acad Child Adolesc Psychiatry. Author manuscript; available in PMC 2017 February 01.
Author M
anuscriptA
uthor Manuscript
Author M
anuscriptA
uthor Manuscript

In addition, in each sample, we plotted ROC curves for the global diffusion indices that
differed between ADHD and NT individuals, used as correlates of ADHD diagnosis (Figure
3), and computed the area under the ROC curve for every global DTI index (see Table S3,
available online). Consistent with its effect sizes, MA had substantially greater predictive
power for diagnosis than any of the other measures in either sample (adult MA area under
the ROC = 0.88, pediatric MA area under the ROC = 0.70).
Voxelwise Whole-Brain Analyses
No main effect of diagnosis (ADHD > NT or ADHD < NT) was found for FA or MA when
controlling type I error for whole-brain multiple comparisons (threshold-free cluster
enhancement–corrected voxelwise, all yielding p >.1) for adults or children. The FA null
effect is consistent with a recent report.44
DISCUSSION
We compared global, whole-brain differences in diffusion-based measures of white matter
between individuals with and without ADHD. Primary analyses were carried out in an adult
sample, and corroboratory analyses in a separate pediatric sample. In both samples, we
found the following: (1) among global diffusion metrics, the mode of anisotropy (MA)19
exhibited the greatest effect size for differences between ADHD and comparison
participants (with lower values for ADHD than NT); and (2) global MA significantly
improved predictive accuracy for ADHD diagnosis, above the substantial predictive utility
of clinical measures. In the adult sample, global FA, AD, and MD were also significantly
lower in patients but with smaller effect sizes. We did not observe significant regional
between-group differences in FA in either sample after correction for multiple comparisons.
Synthesis of the mosaic of regional findings accumulating from ADHD diffusion studies
remains challenging.4 Despite our null voxelwise results, we observed strong global effects.
Global differences in diffusion properties between ADHD and NT groups might arise in
several ways. First, differential diagnostic effects might inhere in large-scale distributed
networks,1 which we were unable to detect because of our limited voxel resolution and
sample sizes. Second, different circuits might be affected to a greater extent in some
individuals than in others, resulting in an apparently global effect at the group level. Third,
small but consistent changes in microstructure may be uniformly distributed throughout
white matter in ADHD, possibly coexisting with regional alterations. Such nuanced
interpretations fit with the widespread deficiency of ADHD connectivity proposed by recent
models.5 We did not find significant global white or gray matter volumetric between-group
differences in either sample (data not shown). One may speculate that, given the positive
correlation between total brain volume and IQ45 and the fact that our diagnostic groups did
not significantly differ in IQ, this is not surprising. The lack of global white matter
volumetric effects is consistent with a recent large-scale study7 and broadly suggests that
MA effects are not reducible to gross morphometric alterations between groups.
The strongest global diffusion effect that we observed was reduced MA in ADHD, which
indicates greater planar anisotropy at the expense of linear anisotropy. This suggests a
preponderance of more complex white matter architecture, for example, crossing fibers,
Yoncheva et al. Page 8
J Am Acad Child Adolesc Psychiatry. Author manuscript; available in PMC 2017 February 01.
Author M
anuscriptA
uthor Manuscript
Author M
anuscriptA
uthor Manuscript

within an average voxel, consistent with a greater disorganization of white matter fibers24,46
in ADHD. Empirically relating changes in MA to underlying white matter properties is in its
infancy. However, robust MA differences across various ages were detected in an animal
model of a neurodegenerative disease46; MA was useful in further characterizing differences
in FA21; and MA significantly improved the ability to prospectively predict which
individuals would develop Alzheimer’s disease.24
Although the effect size and predictive benefit of MA was greater in adults, the confidence
intervals overlapped across samples. Furthermore, we did not observe a significant age-by-
diagnosis interaction between MA and age, and MA was only modestly, albeit significantly,
related to age (R2 = 0.04).
Our results should be considered in light of limitations. First, replication using
independently collected data with smaller voxel sizes is needed to establish generalizability.
Second, residual head motion effects cannot be ruled out; although we corrected for head
motion after data quality assurance, our motion estimates fell within recently published
ranges,36 and motion did not differ between diagnostic groups or correlate with MA. Third,
we confirmed the principal between-group effects for both samples using additional tensor
component indices to characterize ellipsoid shape38; still, MA estimates in areas with low
signal are vulnerable to artifacts and image distortion.19 Fourth, we included patients who
were medication-naive as well as recently medicated, although we found no evidence that
this affected our results. Fifth, unlike most studies in ADHD, our groups did not differ
significantly in IQ, which may have contributed to the lack of between-group volumetric
differences. Finally, although we observed ADHD-related differences in MA with effect
sizes approaching the levels necessary for diagnostic biomarker candidates, at least in
adults,43 we cannot address their clinical specificity. Future studies should compare global
MA between ADHD and other disorders. Fortunately, such analyses can be readily
performed with already-collected DTI data, as computing MA in standard software is
straightforward.
Following the technological and methodological innovations of the Human Connectome
Project47 (e.g., multiband imaging and increased gradient strength, which improve sampling
of the diffusion space and spatial resolution), diffusion imaging methods are advancing.
Superior data acquisition will enhance the accuracy and precision of DTI metrics and thus
will offer better sensitivity in differentiating between individuals and diagnostic groups. In
the meantime, our results underscore the value of applying novel analytic approaches to
existing data (especially larger aggregated datasets).48 Specifically, we highlight the power
of 2 relatively uncommon strategies—use of global measures and of complementary
diffusion metrics, including MA—to augment conventional DTI analyses and to illuminate
pathophysiology.
Supplementary Material
Refer to Web version on PubMed Central for supplementary material.
Yoncheva et al. Page 9
J Am Acad Child Adolesc Psychiatry. Author manuscript; available in PMC 2017 February 01.
Author M
anuscriptA
uthor Manuscript
Author M
anuscriptA
uthor Manuscript

Acknowledgments
This work was supported by R01MH081218, R01MH083246, R01HD065282, R01MH091140, T32MH067763, and grants from the Stavros Niarchos Foundation.
The authors gratefully acknowledge all the participants and their parents, Pablo Velasco, PhD, and Keith Sanzenbach, R, RT, MR, of the NYU Center for Brain Imaging, for support in developing imaging sequences, Stephen Smith, PhD, and Gwenaëlle Douaud, PhD, of Oxford University, for helpful discussion of the mode of anisotropy, and Amy K. Roy, PhD, of Fordham University, for providing data from an ongoing study of children with ADHD and comparisons (R01MH091140).
References
1. Castellanos FX, Proal E. Large-scale brain systems in ADHD: beyond the prefrontal-striatal model. Trends Cogn Sci. 2012; 16:17–26. [PubMed: 22169776]
2. Liston C, Cohen MM, Teslovich T, Levenson D, Casey BJ. Atypical pre-frontal connectivity in attention-deficit/hyperactivity disorder: pathway to disease or pathological end point? Biol Psychiatry. 2011; 69:1168–1177. [PubMed: 21546000]
3. Konrad K, Eickhoff SB. Is the ADHD brain wired differently? A review on structural and functional connectivity in attention deficit hyperactivity disorder. Hum Brain Mapp. 2010; 31:904–916. [PubMed: 20496381]
4. van Ewijk H, Heslenfeld DJ, Zwiers MP, Buitelaar JK, Oosterlaan J. Diffusion tensor imaging in attention deficit/hyperactivity disorder: a systematic review and meta-analysis. Neurosci Biobehav Rev. 2012; 36:1093–1106. [PubMed: 22305957]
5. Castellanos FX, Proal E. Location, location, and thickness: volumetric neuroimaging of attention-deficit/hyperactivity disorder comes of age. J Am Acad Child Adolesc Psychiatry. 2009; 48:979–981. [PubMed: 20854767]
6. Krain AL, Castellanos FX. Brain development and ADHD. Clin Psychol Rev. 2006; 26:433–444. [PubMed: 16480802]
7. Greven CU, Bralten J, Mennes M, et al. Developmentally stable whole-brain volume reductions and developmentally sensitive caudate and putamen volume alterations in those with attention-deficit/hyperactivity disorder and their unaffected siblings. JAMA Psychiatry. 2015; 72:490–499. [PubMed: 25785435]
8. Makris N, Biederman J, Valera EM, et al. Cortical thinning of the attention and executive function networks in adults with attention-deficit/hyperactivity disorder. Cereb Cortex. 2007; 17:1364–1375. [PubMed: 16920883]
9. Proal E, Reiss PT, Klein RG, et al. Brain gray matter deficits at 33-year follow-up in adults with attention-deficit/hyperactivity disorder established in childhood. Arch Gen Psychiatry. 2011; 68:1122–1134. [PubMed: 22065528]
10. Shaw P, Lerch J, Greenstein D, et al. Longitudinal mapping of cortical thickness and clinical outcome in children and adolescents with attention-deficit/hyperactivity disorder. Arch Gen Psychiatry. 2006; 63:540–549. [PubMed: 16651511]
11. Francx, W.; Zwiers, MP.; Mennes, M., et al. White matter microstructure and developmental improvement of hyperactive/impulsive symptoms in attention-deficit/hyperactivity disorder. J Child Psychol Psychiatry. 2015 Jan 10. http://dx.doi.org/10.1111/jcpp.12379 [Epub ahead of print]
12. van Ewijk H, Heslenfeld DJ, Zwiers MP, et al. Different mechanisms of white matter abnormalities in attention-deficit/hyperactivity disorder: a diffusion tensor imaging study. J Am Acad Child Adolesc Psychiatry. 2014; 53:790–799.e3. [PubMed: 24954828]
13. Onnink AMH, Zwiers MP, Hoogman M, et al. Deviant white matter structure in adults with attention-deficit/hyperactivity disorder points to aberrant myelination and affects neuropsychological performance. Prog Neuropsychopharmacol Biol Psychiatry. 2015; 63:14–22. [PubMed: 25956761]
14. Casey BJ, Epstein JN, Buhle J, et al. Frontostriatal connectivity and its role in cognitive control in parent-child dyads with ADHD. Am J Psychiatry. 2007; 164:1729–1736. [PubMed: 17974939]
Yoncheva et al. Page 10
J Am Acad Child Adolesc Psychiatry. Author manuscript; available in PMC 2017 February 01.
Author M
anuscriptA
uthor Manuscript
Author M
anuscriptA
uthor Manuscript

15. Reiss PT, Schwartzman A, Lu F, Huang L, Proal E. Paradoxical results of adaptive false discovery rate procedures in neuroimaging studies. Neuroimage. 2012; 63:1833–1840. [PubMed: 22842214]
16. Basser PJ, Pierpaoli C. Microstructural and physiological features of tissues elucidated by quantitative-diffusion-tensor MRI. J Magn Reson B. 1996; 111:209–219. [PubMed: 8661285]
17. Jones DK, Knösche TR, Turner R. White matter integrity, fiber count, and other fallacies: the do’s and don’ts of diffusion MRI. Neuroimage. 2013; 73:239–254. [PubMed: 22846632]
18. Jeurissen B, Leemans A, Tournier J-D, Jones DK, Sijbers J. Investigating the prevalence of complex fiber configurations in white matter tissue with diffusion magnetic resonance imaging. Hum Brain Mapp. 2013; 34:2747–2766. [PubMed: 22611035]
19. Ennis DB, Kindlmann G. Orthogonal tensor invariants and the analysis of diffusion tensor magnetic resonance images. Magn Reson Med. 2006; 55:136–146. [PubMed: 16342267]
20. Kindlmann G, Ennis DB, Whitaker RT, Westin CF. Diffusion tensor analysis with invariant gradients and rotation tangents. IEEE Trans Med Imaging. 2007; 26:1483–1499. [PubMed: 18041264]
21. Douaud G, Jbabdi S, Behrens TEJ, et al. DTI measures in crossing-fibre areas: increased diffusion anisotropy reveals early white matter alteration in MCI and mild Alzheimer’s disease. Neuroimage. 2011; 55:880–890. [PubMed: 21182970]
22. Itahashi T, Yamada T, Nakamura M, et al. Linked alterations in gray and white matter morphology in adults with high-functioning autism spectrum disorder: a multimodal brain imaging study. NeuroImage Clin. 2014; 7:155–169. [PubMed: 25610777]
23. Wigand M, Kubicki M, Clemm von Hohenberg C, et al. Auditory verbal hallucinations and the interhemispheric auditory pathway in chronic schizophrenia. World J Biol Psychiatry. 2015; 16:31–44. [PubMed: 25224883]
24. Douaud G, Menke RAL, Gass A, et al. Brain microstructure reveals early abnormalities more than two years prior to clinical progression from mild cognitive impairment to Alzheimer’s disease. J Neurosci. 2013; 33:2147–2155. [PubMed: 23365250]
25. Smith SM, Jenkinson M, Johansen-Berg H, et al. Tract-based spatial statistics: voxelwise analysis of multi-subject diffusion data. Neuroimage. 2006; 31:1487–1505. [PubMed: 16624579]
26. Smith SM, Nichols TE. Threshold-free cluster enhancement: addressing problems of smoothing, threshold dependence and localisation in cluster inference. NeuroImage. 2009; 44:83–98. [PubMed: 18501637]
27. Adler, L.; Spencer, T. The Adult ADHD Clinical Diagnostic Scales (ACDS). New York: New York University, School of Medicine; 2004.
28. First, M.; Spitzer, R.; Gibbon, M.; Williams, J. Structured Clinical Interview for DSM-IV-TR Axis I Disorders, Research Version, Non-Patient Edition. New York: Biometrics Research, New York State Psychiatric Institute; 2002. SCID-I/NP
29. Conners, C.; Erhardt, D.; Sparrow, E. Conners’ Adult ADHD Rating Scales: Technical Manual. Toronto: Multi-Health Systems; 1999.
30. Conners, C. Conners’ Rating Scales–Revised User’s Manual. Tonawanda, NY: Multi-Health Systems; 1997.
31. Kaufman J, Birmaher B, Brent D, et al. Schedule for Affective Disorders and Schizophrenia for School-Age Children–Present and Lifetime Version (K-SADS-PL): initial reliability and validity data. J Am Acad Child Adolesc Psychiatry. 1997; 36:980–988. [PubMed: 9204677]
32. Wechsler, D. Wechsler Abbreviated Scale of Intelligence (WASI). San Antonio, TX: Psychological Corporation; 1999.
33. Elliott, C. Differential Ability Scales®-II. San Antonio, TX: Hartcourt Assessment; 2007.
34. Kaufman, A.; Kaufman, N. Kaufman Brief Intelligence Test. Circle Pines, MN: American Guidance Service; 1990.
35. Smith SM, Jenkinson M, Woolrich MW, et al. Advances in functional and structural MR image analysis and implementation as FSL. Neuroimage. 2004; 23(Suppl 1):S208–S219. [PubMed: 15501092]
36. Yendiki A, Koldewyn K, Kakunoori S, Kanwisher N, Fischl B. Spurious group differences due to head motion in a diffusion MRI study. Neuroimage. 2014; 88:79–90.
Yoncheva et al. Page 11
J Am Acad Child Adolesc Psychiatry. Author manuscript; available in PMC 2017 February 01.
Author M
anuscriptA
uthor Manuscript
Author M
anuscriptA
uthor Manuscript

37. Hong S-B, Zalesky A, Fornito A, et al. Connectomic disturbances in attention-deficit/hyperactivity disorder: a whole-brain tractography analysis. Biol Psychiatry. 2014; 76:656–663. [PubMed: 24503470]
38. Westin CF, Maier SE, Mamata H, Nabavi A, Jolesz FA, Kikinis R. Processing and visualization for diffusion tensor MRI. Med Image Anal. 2002; 6:93–108. [PubMed: 12044998]
39. Bach M, Laun FB, Leemans A, et al. Methodological considerations on tract-based spatial statistics (TBSS). Neuroimage. 2014; 100:358–369. [PubMed: 24945661]
40. Hoaglin DC, Iglewicz B. Fine-tuning some resistant rules for outlier labeling. J Am Stat Assoc. 1987; 82:1147–1149.
41. Pepe MS, Kerr KF, Longton G, Wang Z. Testing for improvement in prediction model performance. Stat Med. 2013; 32:1467–1482. [PubMed: 23296397]
42. Wood, S. Generalized Additive Models: An Introduction with R. Boca Raton, FL: Chapman and Hall; 2006.
43. Castellanos FX, Di Martino A, Craddock RC, Mehta AD, Milham MP. Clinical applications of the functional connectome. Neuroimage. 2013; 80:527–540. [PubMed: 23631991]
44. Cooper M, Thapar A, Jones DK. White matter microstructure predicts autistic traits in attention-deficit/hyperactivity disorder. J Autism Dev Disord. 2014; 44:2742–2754. [PubMed: 24827086]
45. Lefebvre A, Beggiato A, Bourgeron T, Toro R. Neuroanatomical diversity of corpus callosum and brain volume in autism: meta-analysis, analysis of the autism brain imaging data exchange project, and simulation. Biol Psychiatry. 2015; 78:126–134. [PubMed: 25850620]
46. Sahara N, Perez PD, Lin W-L, et al. Age-related decline in white matter integrity in a mouse model of tauopathy: an in vivo diffusion tensor magnetic resonance imaging study. Neurobiol Aging. 2014; 35:1364–1374. [PubMed: 24411290]
47. Van Essen DC, Ugurbil K, Auerbach E, et al. The Human Connectome Project: a data acquisition perspective. Neuroimage. 2012; 62:2222–2231. [PubMed: 22366334]
48. Thompson PM, Stein JL, Medland SE, et al. The ENIGMA Consortium: large-scale collaborative analyses of neuroimaging and genetic data. Brain Imaging Behav. 2014; 8:153–182. [PubMed: 24399358]
Yoncheva et al. Page 12
J Am Acad Child Adolesc Psychiatry. Author manuscript; available in PMC 2017 February 01.
Author M
anuscriptA
uthor Manuscript
Author M
anuscriptA
uthor Manuscript

Clinical Guidance
• Global diffusion measures, particularly the mode of anisotropy, differed
between individuals with and without ADHD in two separate samples, which
suggests a global white matter alteration in ADHD.
• The effect size of global mode of anisotropy reduction in ADHD approaches the
acceptable range for candidate biomarkers.
• Despite these preliminary results, diffusion indices do not provide specific
clinical guidance regarding individual patients and are not yet recommended as
part of standard clinical care.
Yoncheva et al. Page 13
J Am Acad Child Adolesc Psychiatry. Author manuscript; available in PMC 2017 February 01.
Author M
anuscriptA
uthor Manuscript
Author M
anuscriptA
uthor Manuscript
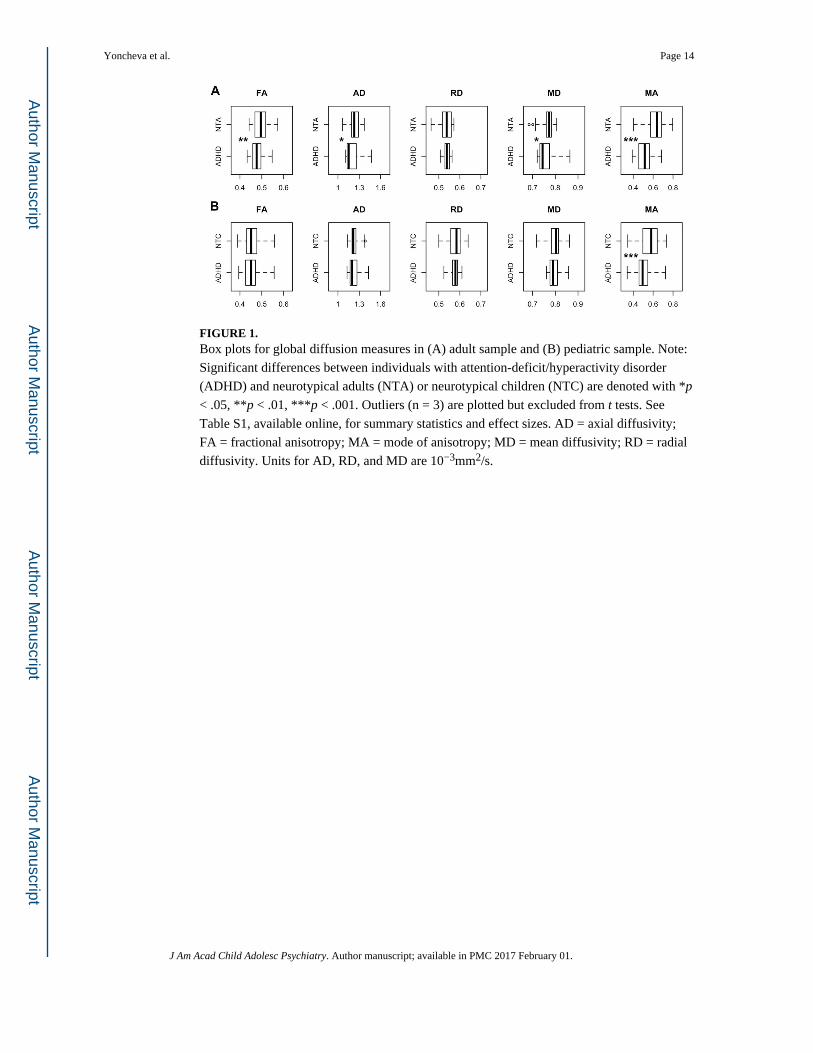
FIGURE 1. Box plots for global diffusion measures in (A) adult sample and (B) pediatric sample. Note:
Significant differences between individuals with attention-deficit/hyperactivity disorder
(ADHD) and neurotypical adults (NTA) or neurotypical children (NTC) are denoted with *p
< .05, **p < .01, ***p < .001. Outliers (n = 3) are plotted but excluded from t tests. See
Table S1, available online, for summary statistics and effect sizes. AD = axial diffusivity;
FA = fractional anisotropy; MA = mode of anisotropy; MD = mean diffusivity; RD = radial
diffusivity. Units for AD, RD, and MD are 10−3mm2/s.
Yoncheva et al. Page 14
J Am Acad Child Adolesc Psychiatry. Author manuscript; available in PMC 2017 February 01.
Author M
anuscriptA
uthor Manuscript
Author M
anuscriptA
uthor Manuscript

FIGURE 2. Histograms of average global mode of anisotropy values in individuals from (A) adult
sample and (B) pediatric sample. Note: ADHD = attention-deficit/hyperactivity disorder;
NTA = neurotypical adults; NTC = neurotypical children.
Yoncheva et al. Page 15
J Am Acad Child Adolesc Psychiatry. Author manuscript; available in PMC 2017 February 01.
Author M
anuscriptA
uthor Manuscript
Author M
anuscriptA
uthor Manuscript

FIGURE 3. Receiver operating characteristic (ROC) curves for the global diffusion indices that differed
between individuals with attention-deficit/hyperactivity disorder (ADHD) and neurotypical
(NT) individuals in (A) adult sample and (B) pediatric sample. Note: The ROC curve plots
the true positive rate versus the false-positive rate as the binary classification threshold
varies. Classification was conducted separately for each diffusion measure. AD = axial
diffusivity; FA = fractional anisotropy; MA = mode of anisotropy; MD = mean diffusivity.
Yoncheva et al. Page 16
J Am Acad Child Adolesc Psychiatry. Author manuscript; available in PMC 2017 February 01.
Author M
anuscriptA
uthor Manuscript
Author M
anuscriptA
uthor Manuscript

Author M
anuscriptA
uthor Manuscript
Author M
anuscriptA
uthor Manuscript
Yoncheva et al. Page 17
TA
BL
E 1
Dem
ogra
phic
and
Clin
ical
Cha
ract
eris
tics
of P
artic
ipan
ts W
ith A
naly
zabl
e D
iffu
sion
Ten
sor
Imag
ing
(DT
I) D
ata
Adu
lt S
ampl
eP
edia
tric
Sam
ple
AD
HD
NT
AD
HD
vs.
NT
AD
HD
NT
AD
HD
vs.
NT
Sex,
n (
mal
e, f
emal
e)24
, 18
42, 2
3χ2
= 0
.61,
p =
.44
64, 1
855
, 25
χ2 =
1.8
0, p
= .1
8
Age
(y)
31.6
5 ±
9.8
31.0
6 ±
9.0
t 105
= 0
.32,
p =
.75
10.6
3 ±
2.8
11.0
4 ±
2.6
t 160
= −
0.96
, p =
.34
Full
IQ11
1.1
± 1
1.8
110.
9 ±
10.
6t 1
05 =
0.1
1, p
= .9
210
5.52
± 1
4.9
108.
98 ±
14.
3t 1
60 =
−1.
51, p
= .1
3
Rac
e/et
hnic
itya
C
auca
sian
23 (
59)
30 (
48)
χ2 =
5.5
2, p
= .0
643
(57
)40
(54
)χ2
= 0
.23,
p =
.89
A
fric
an-A
mer
ican
4 (1
0)19
(30
)17
(22
)19
(26
)
O
ther
b12
(31
)14
(22
)16
(21
)15
(20
)
Med
icat
ion
stat
us: n
(%
)
M
edic
atio
n na
ïve
14 (
33)
——
59 (
72)
——
N
ot n
aïve
, off
med
icat
ion(
s)c
26 (
62)
——
18 (
22)
——
C
urre
nt s
timul
ant m
edic
atio
nd2
(5)
——
4 (5
)—
—
C
urre
nt n
onst
imul
ant m
edic
atio
ne0
(0)
——
1 (1
)—
—
Hea
d m
otio
n in
dice
s
A
bsol
ute
mot
ion
(mm
)2.
82 ±
0.5
82.
75 ±
0.5
8t 1
05 =
0.5
8, p
= .5
61.
98 ±
0.4
02.
07 ±
0.4
1t 1
60 =
−1.
38, p
= .1
7
V
olum
e-by
-vol
ume
tran
slat
ion
(mm
)0.
91 ±
0.2
50.
87 ±
0.2
4t 1
05 =
0.9
1, p
= .3
70.
75 ±
0.2
80.
73 ±
0.1
6t 1
60 =
0.4
7, p
= .6
4
V
olum
e-by
-vol
ume
rota
tion
(deg
rees
)0.
29 ±
0.1
10.
33 ±
0.1
8t 1
05 =
−0.
96, p
= .3
40.
26 ±
0.0
70.
26 ±
0.0
9t 1
60 =
0.1
4, p
= .8
9
CA
AR
S (T
sco
re)
D
SM-I
V I
natte
ntiv
e73
.11
± 1
1.85
41.4
7 ±
9.2
9t 9
8 =
14.
89, p
< .0
01
D
SM-I
V H
yper
activ
e–Im
puls
ive
61.1
6 ±
13.
6138
.87
± 8
.11
t 53.
3 =
10.
28, p
< .0
01
D
SM-I
V T
otal
Sym
ptom
s69
.89
± 1
2.24
38.6
6 ±
9.6
6t 9
8 =
14.
16, p
< .0
01
CPR
S-R
:LV
(T
sco
re)
D
SM-I
V I
natte
ntiv
e72
.41
± 8
.79
45.5
1 ±
6.7
0t 1
20.8
= 2
0.18
, p <
.001
D
SM-I
V H
yper
activ
e–Im
puls
ive
68.8
0 ±
12.
7047
.07
± 6
.46
t 94.
0 =
12.
53, p
< .0
01
D
SM-I
V T
otal
Sym
ptom
s72
.65
± 9
.26
46.0
3 ±
6.3
7t 1
13.5
= 1
9.60
, p <
.001
AD
HD
sub
type
: n (
%)
J Am Acad Child Adolesc Psychiatry. Author manuscript; available in PMC 2017 February 01.

Author M
anuscriptA
uthor Manuscript
Author M
anuscriptA
uthor Manuscript
Yoncheva et al. Page 18
Adu
lt S
ampl
eP
edia
tric
Sam
ple
AD
HD
NT
AD
HD
vs.
NT
AD
HD
NT
AD
HD
vs.
NT
C
ombi
ned
23 (
55)
50 (
61)
Pr
edom
inan
tly I
natte
ntiv
e18
(43
)26
(32
)
Pr
edom
inan
tly H
yper
activ
e–Im
puls
ive
0 (0
)4
(5)
N
ot o
ther
wis
e sp
ecif
ied
1 (2
)2
(2)
Not
e: C
ontin
uous
var
iabl
es a
re p
rese
nted
as
mea
n ±
SD
. AD
HD
= a
ttent
ion-
defi
cit/h
yper
activ
ity d
isor
der;
CA
AR
S =
Con
ners
’ A
dult
AD
HD
Rat
ing
Scal
es; C
PRS-
R:L
V =
Con
ners
’ Pa
rent
Rat
ing
Scal
e–R
evis
ed: L
ong
Ver
sion
; NT
= n
euro
typi
cal.
a Self
(pa
rent
) re
port
ed r
ace/
ethn
icity
was
mis
sing
in 3
adu
lts w
ith A
DH
D, 2
NT
adu
lts, 6
chi
ldre
n w
ith A
DH
D, a
nd 6
NT
chi
ldre
n.
b “Oth
er”
incl
udes
Asi
an, P
acif
ic I
slan
der,
Haw
aiia
n, A
mer
ican
Ind
ian,
Ala
skan
Nat
ive,
oth
er r
aces
, or
mix
ed r
aces
.
c Not
taki
ng p
sych
oact
ive
med
icat
ions
for
per
iods
ran
ging
fro
m 1
wee
k to
1 y
ear
befo
re s
can.
d Cur
rent
ly tr
eate
d w
ith p
sych
ostim
ulan
ts b
ut h
ad d
isco
ntin
ued
med
icat
ion
for
24 h
ours
bef
ore
scan
.
e Sele
ctiv
e se
roto
nin
reup
take
inhi
bito
r.
J Am Acad Child Adolesc Psychiatry. Author manuscript; available in PMC 2017 February 01.

Author M
anuscriptA
uthor Manuscript
Author M
anuscriptA
uthor Manuscript
Yoncheva et al. Page 19
TA
BL
E 2
Bin
ary
Log
istic
Reg
ress
ion
Mod
elin
g A
ttent
ion-
Def
icit/
Hyp
erac
tivity
Dis
orde
r (A
DH
D)
Dia
gnos
is a
s a
Func
tion
of C
onne
rs’
T S
core
s an
d G
loba
l Mod
e
of A
niso
trop
y in
Adu
lt Sa
mpl
e an
d Pe
diat
ric
Sam
ple
Adu
lt s
ampl
eB
SEW
ald
pO
R95
% C
I fo
r O
R
Step
1C
AA
RS
0.23
0.05
19.8
5.0
001.
262
1.13
9–1.
398
Con
stan
t−
12.9
12.
8919
.91
.000
Step
2C
AA
RS
0.29
0.09
11.2
1.0
011.
331.
125–
1.57
1
Mod
e of
ani
sotr
opy
−0.
360.
146.
49.0
110.
7a0.
532–
0.92
1
Con
stan
t4.
545.
600.
66.4
18
Ped
iatr
ic s
ampl
eB
SEW
ald
pO
R95
% C
I fo
r O
R
Step
1C
PRS-
R:L
V0.
340.
0724
.21
.000
1.40
71.
128–
1.61
3
Con
stan
t−
19.9
04.
0624
.03
.000
Step
2C
PRS-
R:L
V0.
410.
1016
.61
.000
1.50
41.
236–
1.83
1
Mod
e of
ani
sotr
opy
−0.
170.
076.
12.0
130.
842b
0.73
4–0.
965
Con
stan
t−
14.6
94.
6310
.08
.002
Not
e: C
AA
RS
= C
onne
rs’
Adu
lt A
DH
D R
atin
g Sc
ales
; CPR
S-R
:LV
= C
onne
rs’
Pare
nt R
atin
g Sc
ale–
Rev
ised
: Lon
g V
ersi
on; O
R =
odd
s ra
tio; S
E =
sta
ndar
d er
ror.
a The
odd
s of
AD
HD
dia
gnos
is in
the
adul
t sam
ple
incr
ease
by
a fa
ctor
of
1.43
for
eac
h 0.
01 u
nit r
educ
tion
in th
e m
ode
of a
niso
trop
y.
b The
odd
s of
AD
HD
dia
gnos
is in
the
pedi
atri
c sa
mpl
e in
crea
se b
y a
fact
or o
f 1.
19 f
or e
ach
0.01
uni
t red
uctio
n in
the
mod
e of
ani
sotr
opy.
J Am Acad Child Adolesc Psychiatry. Author manuscript; available in PMC 2017 February 01.