hhe report no. heta-2007-0284 & 2007-0317-3155, evaluation of
TRANSCRIPT
Evaluation of Eye and Respiratory Symptoms at a Poultry Processing Facility – Oklahoma
Lilia Chen, MS, CIHJudith Eisenberg, MD, MSSrinivas Durgam, MSPH, MSChE, CIHCharles Mueller, MS
Health Hazard Evaluation ReportHETA 2007-0284 & 2007-0317-3155March 2012
DEPARTMENT OF HEALTH AND HUMAN SERVICES Centers for Disease Control and Prevention
WorkplaceSafety and Health
National Institute for Occupational Safety and Health

The employer shall post a copy of this report for a period of 30 calendar days at or near the workplace(s) of affected employees. The employer shall take steps to insure that the posted determinations are not altered, defaced, or covered by other material during such period. [37 FR 23640, November 7, 1972, as amended at 45 FR 2653, January 14, 1980].

Page iHealth Hazard Evaluation Report 2007-0284 & 2007-0317-3155
RepoRt Abbreviations ................................................................................................ ii
Highlights of the NIOSH Health Hazard Evaluation ........................iii
Summary .........................................................................................................v
Introduction ...................................................................................................1
Assessment .....................................................................................................5
Results ..............................................................................................................8
Discussion .................................................................................................... 17
Conclusions ................................................................................................. 25
Recommendations .................................................................................... 26
References .................................................................................................... 28
Contents
ACknowledgments Acknowledgments and Availability of Report ................................ 47
Appendix A Methodology .............................................................................................. 32
Appendix B Occupational Exposure Limits and Health Effects ................. 35
Appendix C Fluorescein Stain Scoring .................................................................. 39
Appendix d Tables ............................................................................................................ 40

Page ii Health Hazard Evaluation Report 2007-0284 & 2007-0317-3155
ABBReviAtions
µg/m3 Micrograms per cubic meterACGIH® American Conference of Governmental Industrial HygienistsAIHA American Industrial Hygiene AssociationASHRAE American Society of Heating, Refrigerating, and Air-Conditioning Engineerscfm Cubic feet per minuteCFR Code of Federal RegulationsFEV1 Forced expiratory volume in 1 secondFVC Forced vital capacityGM Geometric meanHHE Health hazard evaluationHVAC Heating, ventilating, and air-conditioningIQF Individually quick frozenIW Individually wrappedLOD Limit of detectionLOQ Limit of quantitationMDC Minimum detectable concentrationmL MilliliterMQC Minimum quantifiable concentrationNAICS North American Industry Classification SystemND Not detectedNIOSH National Institute for Occupational Safety and HealthOEL Occupational exposure limitOSHA Occupational Safety and Health AdministrationPBZ Personal breathing zonePEL Permissible exposure limitppm Parts per millionREL Recommended exposure limitS&P Scalding and pickingSTEL Short-term exposure limitTLV® Threshold limit valueTWA Time-weighted averageUSDA United States Department of AgricultureWEEL™ Workplace environmental exposure limitWOG Without gizzards

Page iiiHealth Hazard Evaluation Report 2007-0284 & 2007-0317-3155
The National Institute for Occupational Safety and Health (NIOSH) received employer requests from a poultry processing facility and a government agency for a health hazard evaluation at a poultry processing facility in Oklahoma. These requests were submitted because of reported eye and respiratory irritation symptoms among production employees and government food inspectors.
HigHligHts of tHe niosH HeAltH HAzARd evAluAtion
What NIOSH DidWe visited the facility in October 2007, February 2008, and ●October 2008.
We asked employees in two groups to fill out a survey about ●symptoms they had in the previous month. Employees who worked in areas with superchlorinated water made up the exposed group. Employees who worked in areas that did not use superchlorinated water made up the unexposed group.
We performed breathing and eye tests on exposed employees ●before and after their shift. These employees also completed a symptom survey after their shift.
We took air samples in the evisceration area. These ●samples were analyzed for trichloramine, soluble chlorine compounds, chlorine, and chlorine dioxide.
We measured employees’ exposure to trichloramine and ●soluble chlorine in the evisceration area.
We reviewed the company’s records of the chlorinated water ●concentrations.
We looked at the heating, ventilating, and air conditioning ●systems. We used smoke tubes to determine the air flow patterns.
What NIOSH FoundEmployees in the exposed group were more likely to report ●certain work-related symptoms in the previous month than employees in the unexposed group. These symptoms included chest tightness, sneezing, dry eyes, blurry vision, and burning or itchy eyes.
Increased levels of exposures to air trichloramine and soluble ●chlorine were not related to increased symptom reports during their shift.
Of 39 exposed employees, 2 had significant declines in their ●breathing tests over a shift and 37 exposed employees did not.
Most examinations for 38 participants had abnormal preshift ●tear film breakup times and even more were abnormal postshift. This can be a sign of eye irritation, but the cause cannot be definitively determined on the basis of our data.
Most of the air samples we took for trichloramine had ●concentrations below the level that we could accurately measure.

Page iv Health Hazard Evaluation Report 2007-0284 & 2007-0317-3155
We found higher levels of soluble chlorine compounds in the ●air in areas that used superchlorinated water.
The chlorine concentrations in the wash water met the ●requirements of the U.S. Department of Agriculture.
We measured very low concentrations of chlorine dioxide ●and chlorine in the air.
The ventilation in the building follows the guidelines for ●air flowing from clean to dirty areas set by the American Society of Heating, Refrigerating, and Air-Conditioning Engineers. However, this air flow pattern was not done via positive pressure ventilation. Positive pressure ventilation helps minimize product contamination from contaminants in unfiltered air entering the process area.
What Managers Can DoMaintain chlorine and other water chemistry parameters ●within established guidelines. Staff should be properly trained on how to perform these tasks.
Find a more accurate and timely way to monitor and adjust ●the water chemistry parameters for the superchlorinated water.
Use positive pressure ventilation to achieve the air flow ●patterns that meet the American Society of Heating, Refrigerating, and Air-Conditioning Engineers’ guidelines.
Consult with a ventilation engineer to evaluate the effectiveness ●of the air distribution systems in the processing areas.
Minimize wastewater from different areas mixing in the drain ●channels. Also, reduce organic product contamination of the effluent as much as possible. Make sure that effluent can be quickly removed from the processing area.
Periodically look for new cleaning and disinfecting agents ●that are safer to use than current products. Make sure that alternatives are safe to use and can maintain or improve current hygiene standards.
What Employees Can DoReport eye and respiratory irritation to your manager ●immediately. Seek prompt evaluation by a medical professional.
HigHligHts of tHe niosH HeAltH HAzARd evAluAtion
(Continued)

Page vHealth Hazard Evaluation Report 2007-0284 & 2007-0317-3155
NIOSH evaluated work-related symptoms in poultry processing employees and government food inspectors in areas using superchlorinated water (exposed) and in areas not using superchlorinated water (unexposed). Exposed participants were more likely to report work-related symptoms in the previous month than unexposed participants. Of 39 exposed employees, 2 had significant declines in their breathing tests over a shift and 37 exposed employees did not. Most examinations for the exposed group had abnormal preshift tear film breakup times, and even more were abnormal postshift. The levels of chloramines found in the air were low, and the levels of soluble chlorines were higher in areas that used superchlorinated water. We recommend that managers monitor and maintain proper water chemistry parameters in the wash water and use positive pressure ventilation (to help minimize product contamination) to achieve air flow patterns following ASHRAE guidelines.
summARyIn July 2007, NIOSH received employer requests from a poultry processing facility and a government agency for an HHE in Oklahoma. These requests concerned eye and respiratory symptoms reported by poultry processing employees and government food inspectors. On October 16, 2007, we held an opening meeting with employer and union representatives, observed work process and practices, and interviewed employees privately. We found that eye and respiratory irritation were common among employees working in evisceration and paw harvest areas. On February 21–22, 2008, we returned to the facility to measure soluble chlorine and trichloramine levels in the evisceration area. The chloramine concentrations measured during this visit warranted further investigation of employees’ symptoms and exposure to these compounds.
On October 1–10, 2008, we returned to the facility. We asked government food inspectors and poultry processing employees who worked on lines using superchlorinated water (evisceration line, reprocessing, paw harvest, and gizzard harvest areas) and employees working in areas not using superchlorinated water (such as the IW, IQF, and WOG areas) to complete a survey about symptoms experienced at work in the previous month. These employees were designated as exposed and unexposed, respectively. Exposed participants also had eye exams and lung function (spirometry) testing before and after their work shift.
We collected area air samples for soluble chlorine and trichloramine in seven locations throughout evisceration, reprocessing, gizzard harvest, paw harvest, and two locations in the WOG and IQF areas. We collected PBZ air samples from exposed participants. Area air samples for chlorine and chlorine dioxide were taken, and we reviewed the company’s chlorine concentration records for the water used in reprocessing, evisceration, bird wash, and paw harvest areas. We visually inspected the ventilation system and used smoke to observe air movement throughout the evisceration area.
Exposed participants were more likely to report certain work-related symptoms in the previous month than unexposed participants. These symptoms included chest tightness, sneezing, dry eyes, blurry vision, and burning or itchy eyes. Of the 39 exposed participants, 2 had significant declines in their FEV1, a measure of a change in lung function, between the start and the end of their work shift. Some participants’ tear film breakup times
Page vi Health Hazard Evaluation Report 2007-0284 & 2007-0317-3155
Keywords: NAICS 311615 (Poultry Processing), chloramines, trichloramine, poultry processing, eye irritation, respiratory irritation, spirometry, eye examinations, fluorescein stain scoring
summARy
(Continued) worsened over the shift, but most participants started their shift with an abnormal tear film breakup time. Overall, the results of the trichloramine and soluble chlorine air samples were low. We detected higher levels of soluble chlorine compounds in areas that used superchlorinated water compared to areas without superchlorinated water. Increased levels of exposures to air trichloramine and soluble chlorine were not related to increased symptom reports during their shift. All chlorine dioxide and all but one chlorine area air concentrations were very low and well below relevant OELs.
Poultry processing facilities have many potential sources of irritants in addition to the compounds we evaluated, which made identifying the exact causes of employee symptoms difficult. Sampling for these compounds is complicated by the irritant chemicals’ sporadic and unpredictable formation and release into the air. Irritant symptoms can be caused and exacerbated by a variety of factors, including exposure to a combination of chemical and biological compounds, poor water chemistry control, inadequate ventilation, and employee sensitivity to irritants. Establishing positive pressure ventilation, ensuring good air mixing, and maintaining proper water chemistry may help reduce employees’ symptoms.

Page 1Health Hazard Evaluation Report 2007-0284 & 2007-0317-3155
intRoduCtionNIOSH received employer requests from a poultry processing facility and a government agency for an HHE at a poultry processing facility in Oklahoma. These requests concerned eye and respiratory symptoms reported by poultry processing employees and government food inspectors. We conducted investigations in October 2007, February 2008, and October 2008. On October 16, 2007, we toured the facility and interviewed 14 poultry processing employees and all 10 government food inspectors. All of the inspectors and most of the interviewed employees worked in the evisceration and paw harvest areas. Reports of eye irritation and respiratory irritation were common and occurred at unpredictable and irregular intervals among those interviewed, so we returned to determine if chloramine compounds might be responsible for the symptoms. We sampled the air in the evisceration area for chloramines in February 2008 and determined that chloramine concentrations were present at levels that warranted further investigation. This report details our investigation from October 2008. Correspondence summarizing our activities was sent in November 2007, May 2008, and October 2008. Participants were notified of individual test results in July 2009.
Associations of Chloramines and Symptoms in Poultry Processing
Eye and upper respiratory irritation symptoms have been reported at poultry processing facilities, and possible causes have been investigated by NIOSH, OSHA, USDA, and state health departments. These symptoms have usually been reported by employees working in evisceration, inspection, and reprocessing areas where superchlorinated water is used. Workers usually report that symptoms are intermittent, and the intensity of symptoms can vary from being a nuisance to such severity that the worker must leave the workplace. Individual tolerances also play a role. Some workers in the same area can be severely affected, whereas others may be only mildly affected.
In previous evaluations at poultry processing facilities, investigators have postulated that eye, mucosal, and respiratory symptoms were caused by chloramines, specifically trichloramine [NIOSH 1987, 1993, 2000, 2003, 2006, 2007]. Studies have shown an association between trichloramine and eye and respiratory symptoms in indoor pool environments [Barbee 1983; Hery et al. 1995; Massin et al. 1998] where chlorine (used as a disinfectant) mixed in the water with nitrogenous compounds produced by patrons and formed

Page 2 Health Hazard Evaluation Report 2007-0284 & 2007-0317-3155
trichloramine. The trichloramine volatilized from the water into the air. In poultry facilities, this irritant vapor is thought to form when the superchlorinated water mixes with nitrogenous waste from the poultry carcasses. Sampling for other suspected compounds (e.g., chlorine, chlorine dioxide, ammonia) that could cause reported symptoms resulted in levels that were lower than established OELs [NIOSH 1987, 1993, 2000, 2003; Sanderson et al. 1995].
Past NIOSH evaluations have investigated work-related symptoms in poultry facilities by use of questionnaires [NIOSH 1987, 1993, 2000, 2003, 2006, 2007]. The symptoms most frequently reported were burning, stinging eyes; itchy, runny, or stuffy nose; cough; sneezing; sore throat; and asthma symptoms such as wheezing, chest tightness, or shortness of breath.
Evaluations also looked at preshift and postshift lung function [NIOSH 2003; King et al. 2006], evaluated water chemistry [NIOSH 1987, 1993, 2000], and observed ventilation systems and air movement in the facility [NIOSH 1993, 2000, 2003]. Air trichloramine and soluble chlorine levels were higher in areas that used superchlorinated water (i.e., evisceration) than in areas that did not use superchlorinated water. Employee symptoms were associated with working in areas that used superchlorinated water.
Respiratory and eye symptoms had been previously reported at this Oklahoma facility in 1992, and NIOSH was asked to conduct an evaluation [NIOSH 1992]. Symptoms were reported to be episodic and could not be linked to specific events or exposures. At that time, NIOSH found no detectable levels of chlorine, carbon monoxide, or chloramines in the air.
Process Description
This facility processes about 134,000 chickens per shift. Poultry processing occurs during the first and third shifts, and approximately 40 poultry processing employees and 8 government food inspectors work each shift. The government food inspectors work alongside the poultry processing employees on the processing lines and are represented by the American Federation of Government Employees. Poultry processing employees were not represented by a collective bargaining unit during the HHE.
intRoduCtion
(Continued)
Page 3Health Hazard Evaluation Report 2007-0284 & 2007-0317-3155
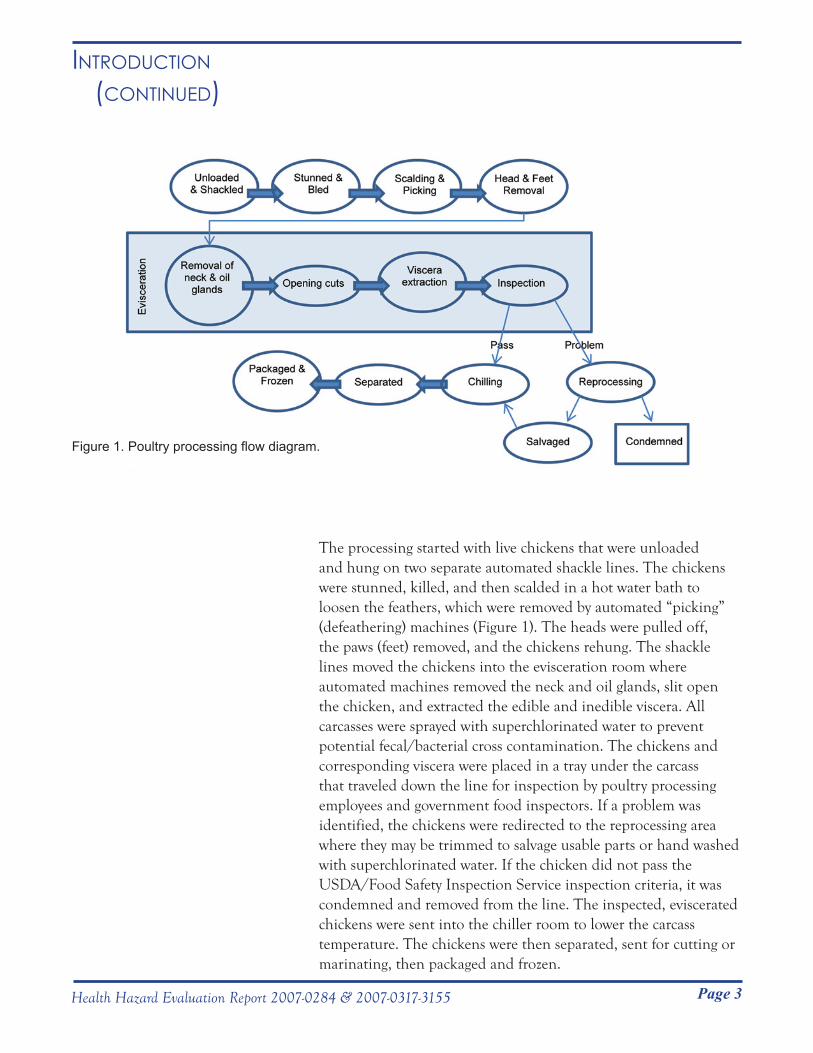
The processing started with live chickens that were unloaded and hung on two separate automated shackle lines. The chickens were stunned, killed, and then scalded in a hot water bath to loosen the feathers, which were removed by automated “picking” (defeathering) machines (Figure 1). The heads were pulled off, the paws (feet) removed, and the chickens rehung. The shackle lines moved the chickens into the evisceration room where automated machines removed the neck and oil glands, slit open the chicken, and extracted the edible and inedible viscera. All carcasses were sprayed with superchlorinated water to prevent potential fecal/bacterial cross contamination. The chickens and corresponding viscera were placed in a tray under the carcass that traveled down the line for inspection by poultry processing employees and government food inspectors. If a problem was identified, the chickens were redirected to the reprocessing area where they may be trimmed to salvage usable parts or hand washed with superchlorinated water. If the chicken did not pass the USDA/Food Safety Inspection Service inspection criteria, it was condemned and removed from the line. The inspected, eviscerated chickens were sent into the chiller room to lower the carcass temperature. The chickens were then separated, sent for cutting or marinating, then packaged and frozen.
Figure 1. Poultry processing flow diagram.
intRoduCtion
(Continued)

Page 4 Health Hazard Evaluation Report 2007-0284 & 2007-0317-3155
The superchlorinated water was stored in a 150-gallon mix tank, where liquid sodium hypochlorite was mixed with water to a target concentration of 20–50 ppm of free available chlorine. Because the USDA requires chlorine levels to be within these parameters, poultry processing technicians tested chlorine concentrations every hour using a titration method. If chlorine concentrations needed adjustment, the technicians contacted building maintenance personnel who manually adjusted the amount of sodium hypochlorite injected into the water. Facility management personnel and government food inspectors also tested the chlorine concentration as needed to ensure that the standard was met.
Sanitation occurred on the second shift. All the machines were prerinsed using a high pressure tap water spray, sprayed with a quaternary ammonium solution, then rinsed with tap water after 10 minutes. Another quaternary ammonium compound was then sprayed on all machines and left until the next shift started. Machines were also rinsed with tap water during the shift, when workers took 30-minute breaks. Foot baths containing a quaternary ammonium compound were placed throughout the processing area in front of doors. These baths were tested three to four times a shift to ensure the disinfectant concentration was maintained. The baths were changed out when needed. Automated devices also sprayed a foam containing quaternary ammonium compounds in front of the exits to disinfect employees’ boots.
Process VentilationTwo roof top air-conditioning units supplied 100% outdoor, filtered, and conditioned air into the evisceration area. Air from the evisceration area was exhausted through the S&P room. The S&P room had five exhaust fans to exhaust air out of the building. Processing areas had interconnecting wall openings that allowed chickens on the automated shackle lines to pass from one area to another. These wall openings also allowed air movement between areas depending on the pressure differential between different areas. The legline had two air-conditioning units and the chiller area had one air-conditioning unit that recirculated air during the two production shifts to maintain the chiller room below 55°F. However, during the sanitation shift, all three air-conditioning units were switched from recirculation mode to the exhaust mode. In addition, wall mounted blowers provided chilled air into the south end of the legline area.
intRoduCtion
(Continued)

Page 5Health Hazard Evaluation Report 2007-0284 & 2007-0317-3155
The IW and IQF areas had eight exhaust fans. The packaging and storage areas had four units for conditioning and recirculating air. The facility’s administrative areas were served by separate air handling units. Inspection stations on evisceration lines had small personal cooling fans that employees could adjust for personal comfort.
intRoduCtion
(Continued)
AssessmentMedical Testing and Questionnaire
Employees and government food inspectors working in areas with superchlorinated water were asked to participate in medical testing that included preshift and postshift eye examinations and spirometry, also known as lung function testing (Appendix A). Medical testing occurred during five consecutive day and night shifts. Participation was voluntary. Employees were asked to participate in testing for as many shifts as they worked for up to five shifts. Informed consent was obtained prior to participation.
The eye examination consisted of several components. An initial examination in front of a slit lamp was used to evaluate the cornea and conjunctiva. Fluorescein dye was then placed in the eye to obtain the fluorescein staining score and measure the tear film breakup time. The fluorescein stain score is based on condition of the cornea. Use of the fluorescein dye allows for better visualization of defects in the cornea. Tear film breakup time is a measure of the stability of the tear film layer that keeps the eye lubricated. It is measured from the time the stain is distributed until disruptions in the tear film layer are seen. When the tear film layer dissolves prematurely, which can be caused by a chemical irritant exposure, the eye is no longer adequately moisturized, and irritation and dryness may develop. However, tear film breakup time is not a specific test to measure irritant exposure; a decreased tear film breakup time can occur as a result of existing eye conditions. We evaluated all eye surface structures to identify other potential causes of injury that would be detected by fluorescein staining. Most changes to the eyes from airborne chemical irritants can take many years to develop, and may include erosion of the corneal surface. Workplace environmental irritants such as chloramines are hypothesized to cause premature breakup of the tear film layer resulting in a decreased tear film breakup time at the end of the work shift.

Page 6 Health Hazard Evaluation Report 2007-0284 & 2007-0317-3155
Assessment
(Continued) Poultry processing employees and government food inspectors working in areas with superchlorinated water (evisceration, paw harvest, gizzard harvest, and reprocessing) and those in areas without superchlorinated water (e.g., WOG, IW, IQF, marination, packing) were asked to complete a questionnaire, and these two groups were classified as exposed to superchlorinated water and unexposed to superchlorinated water. The questionnaire asked participants if they had any of the following symptoms during their work shift in the previous month: unusual shortness of breath, chest tightness, cough, wheezing, dry or gritty eyes, burning or itchy eyes, watery eyes, blurry vision, stuffy nose, runny nose, or sneezing. Symptoms were considered work-related if they improved on days away from work. The questionnaire included eye conditions that may affect tear formation and stability, such as dry eye. Participants in the exposed group who participated in the medical testing also completed a symptom survey after their work shift that inquired whether they experienced eye and respiratory symptoms during that particular shift. On the postshift symptom survey, symptoms were considered work-related if the symptom was not present before starting that shift and developed during that day’s shift. Participants were instructed to answer “no” to a symptom if they associated it with having a cold or respiratory infection.
Air Sampling for Disinfectants and Disinfectant Byproducts
Area and PBZ trichloramine and soluble chlorine (monochloramine, dichloramine, hypochlorous acid, and hypochlorite) air samples were taken on day and night shifts from October 6, 2008, through October 10, 2008. PBZ air samples were taken on all exposed participants who consented to the medical testing and on one participant who completed only the questionnaire. Trichloramine and soluble chlorine concentrations in air were measured over the participants’ full shift (~8 hours). We collected area air samples approximately 4 feet above the ground for trichloramine and soluble chlorine in nine locations. Seven locations were in the processing area and included reprocessing, paw harvest, the gizzard harvester, and the east and west ends of the evisceration lines. After the first sampling shift on the first day of our evaluation, we also took area air samples in the WOG and IQF areas, which were separate from the processing area.

Page 7Health Hazard Evaluation Report 2007-0284 & 2007-0317-3155
Assessment (Continued) Air concentrations of chlorine and chlorine dioxide were measured
using direct reading Dräger tubes® (Luebeck, Germany) in the evisceration, reprocessing, and chilling areas once per shift. We also reviewed the poultry processing facility’s log sheets for chlorine concentration in wash water in the reprocessing, paw harvest, and gizzard harvest areas.
More details on health effects for substances we evaluated and on our sampling methods can be found in Appendices A and B.
Process Ventilation
We interviewed facility managers to obtain information on the HVAC systems serving the processing areas. We used ventilation smoke tubes to observe air flow patterns at doorways and to determine the pressure differential between the evisceration, reprocessing, chiller, and legline areas.
Statistical Analysis
SAS software Version 9.1.3 (SAS Institute, Cary, North Carolina) was used for statistical analysis. We used log-binomial regression models to evaluate associations between exposure groups and work-related symptoms while controlling for smoking status and/or current asthma. Prevalence ratios were reported as a measure of association. We also calculated 95% confidence intervals. If the 95% confidence interval excluded one, then the prevalence ratio was considered statistically significant.
Values for the exposure measurements that were below the MDC were estimated by dividing the LOD by the square root of 2 [Hornung and Reed 1990]. We used generalized estimating equations to examine the relationship between symptom prevalence and levels of trichloramine or soluble chlorine in the air sampling. GMs were used to report exposure concentrations. P-values <0.05 were considered statistically significant.

Page 8 Health Hazard Evaluation Report 2007-0284 & 2007-0317-3155
ResultsDuring the week of October 6, 2008, 81 of 85 employees and 16 of 21 government food inspectors scheduled for work in the areas exposed to superchlorinated water participated in this evaluation. Of the 97 exposed participants, 41 (employees and government food inspectors) completed the questionnaire, wore the air sampling equipment, and participated in the medical testing. One employee completed the questionnaire, wore the air sampling equipment, and completed the postshift symptom survey but did not participate in the eye examinations or spirometry. Fifty-five workers completed the questionnaire only.
Of the approximately 325 day and night shift employees scheduled to work in the areas included in the unexposed group during the testing week, 271 completed the questionnaire. All unexposed employees present during the evaluation were asked to complete the questionnaire. Five unexposed employees declined or were unable to complete the questionnaire because of language barriers. Actual employees working at the time of the site visit varied from the initial roster we were given because of turnover, sick calls, etc.
Questionnaire
Table 1 compares the exposed and unexposed groups by work and personal characteristics. The exposed group was older, had been working longer at the plant, and had a higher percentage of women. Both groups were almost equivalent in prior diagnosis of dry eye and prevalence of asthma.
Table 1. Participant demographics
Exposed to superchlorinated water
Unexposed to superchlorinated water
Total number 97 271
Female 58/89 (65%) 152/271 (56%)
Mean age 43 (n=89) 38 (n=269)
Mean years of employment in current job 9.1 (n=89) 6.3 (n=270)
Current smoker 26/89 (29%) 85/270 (31%)
Former smoker 19/89 (21%) 76/270 (28%)
Never smoker 44/89 (49%) 109/270 (40%)
Current asthma 5/89 (6%) 13/269 (5%)
Prior diagnosis of dry eye 6/89 (7%) 15/270 (6%)

Page 9Health Hazard Evaluation Report 2007-0284 & 2007-0317-3155
Results
(Continued) Although both groups reported work-related symptoms, exposed participants were significantly more likely to have reported work-related symptoms of chest tightness, sneezing, dry eyes, burning or itchy eyes, and blurry vision than unexposed participants (Table 2).
Table 2. Prevalence of work-related symptoms during work shift in the month before the evaluation
Work-related symptom Exposed group Unexposed group Prevalence ratio (95% confidence interval)
Chest tightness 18/89 (20%) 26/270 (10%) 1.83 (1.05, 3.15)*
Cough 37/89 (42%) 105/270 (39%) 1.01 (0.76, 1.30)*
Wheezing 12/89 (13%) 26/270 (10%) 1.33 (0.68, 2.45)*
Unusual shortness of breath 17/89 (19%) 36/270 (13%) 1.29 (0.76, 2.12)*
Dry eyes 36/89 (40%) 30/269 (11%) 3.50 (2.30, 5.40)†
Burning or itchy eyes 49/89 (55%) 57/269 (21%) 2.57 (1.92, 3.46)†
Blurry vision 13/89 (15%) 17/270 (6%) 2.30 (1.14, 4.55)†
Sneezing 46/89 (52%) 104/269 (39%) 1.34 (1.03, 1.71)†
Watery eyes 26/89 (29%) 55/270 (20%) 1.43 (0.94, 2.10)†
Runny nose 55/89 (62%) 140/269 (52%) 1.21 (0.98, 1.47)†
Stuffy nose 32/89 (36%) 88/270 (33%) 1.11 (0.79,1.52)†
* Adjusted for current and former smoking status and for current asthma. † Adjusted for current and former smoking status.
Medical Testing
Over the 5 days of testing, 39 participants contributed 130 sets of preshift and postshift spirometry. Three sets from two participants demonstrated a >10% cross-shift decline in their individual FEV1. FEV1 results for the other 37 participants improved, stayed the same, or declined ≤10% over the shift.

Page 10 Health Hazard Evaluation Report 2007-0284 & 2007-0317-3155
Results
(Continued) More than 90% of 141 preshift and 137 postshift slit lamp examinations of the conjunctiva and cornea of 43 participants were normal. In one corneal examination, the right eye worsened over the shift (see Appendix C for scoring); none of the examinations showed a worsening in the left eye over the shift. Approximately 95% of conjunctival examinations showed no change over the shift, but five examination results changed from normal to abnormal over the shift and nine examination results changed from abnormal to normal over the shift. More than 95% of the 133 preshift and 130 postshift fluorescein staining scores for the 39 participants were normal. For both the left and right eyes, one score changed from normal to abnormal over the shift and four scores changed from abnormal to normal over the shift.
Most examinations for 38 participants had abnormal preshift tear film breakup time and even more were abnormal postshift (Table 3). An abnormal tear film breakup time is defined as less than 10 seconds.
Table 3. Interpretation of tear film breakup time results
EyeAbnormal
preshift tear film breakup time
Abnormal postshift tear film breakup time
Had a normal preshift exam and became abnormal on their
postshift exam
Right 86/133 (65%) 109/129 (85%) 33/129 (26%)
Left 94/133 (71%) 116/129 (90%) 28/129 (22%)
Because so many participants started their shifts with an abnormal tear film breakup time, the abnormal scores were further divided into mild (tear film breakup time = 6 to < 10 seconds), moderate (tear film breakup time = 3 to < 6 seconds), and severe (tear film breakup time < 3 seconds) categories of abnormal tear film breakup times. This analysis was performed using 129 matched preshift and postshift pairs (Table 4). About 45% of participants’ tear film breakup time results decreased enough to move them to a worse category postshift compared to their tear film breakup time category preshift. About 55% either stayed the same or moved to a better category.

Page 11Health Hazard Evaluation Report 2007-0284 & 2007-0317-3155
Trichloramine and Soluble Chlorine Air Sampling Results
For the week of October 6, 2008, 284 PBZ trichloramine and soluble chlorine air samples were taken on exposed participants on either the day or night shifts. In addition, 174 area air samples were taken in seven areas in the processing area and two areas outside the processing area (WOG, IQF). Table 5 indicates the number and percentage of samples that fell below the MDC (analyte was not detected), between the MDC and MQC, and above the MQC (analyte was quantifiable). Most trichloramine air samples were not quantifiable. A higher number of soluble chorine air samples were quantifiable, but overall, concentrations were found to be low.
The LOD is the level at which a compound can be detected and distinguished from the blank response. The LOD is determined by the variability of the responses of blanks and low level standards. The MDC is calculated from the LOD by applying the average volume taken during sampling. The LOQ is the minimum level that can be reported with confidence. The LOQ is determined either as 3.33 times the LOD or the level at which the minimum recovery for media spikes is 75%, whichever is higher. The MQC is calculated from the LOQ by applying the average volume taken during sampling. Values between the LOD and LOQ (or MDC and MQC) indicate samples where the compound was detected; however, levels were so low that they could not be quantified reliably.
Results
(Continued)
Table 4. Tear film breakup time scores
EyeRemained in the same
category for preshift and postshift exams
Moved to a worse category (tear film
breakup time decreased) on their postshift exam
Moved to a better group (tear film breakup time
increased) on their postshift exam
Right 48 (37%) 59 (46%) 22 (17%)
Left 56 (43%) 60 (47%) 13 (10%)

Page 12 Health Hazard Evaluation Report 2007-0284 & 2007-0317-3155
Results
(Continued)
The overall GM for the PBZ soluble chlorine air samples was 30 µg/m3. The geometric mean for soluble chlorine was highest on the first day of sampling (67 µg/m3) and tapered off to levels between the MDC and MQC as the week progressed (Figure 2).
Table 5. Trichloramine and soluble chlorine air sample characteristics
Soluble chlorine Trichloramine
PBZ Area PBZ Area
Total number of samples collected 142* 87 142† 87
Samples below MDC 1 (1%) 17 (20%) 25 (18%) 24 (28%)
Samples between MDC, MQC 70 (49%) 5 (6%) 106 (75%) 59 (68%)
Samples above MQC 65 (46%) 65 (75%) 1 (1%) 4 (5%)
MDC‡ 8 µg/m3 15 µg/m3
MQC‡ 29 µg/m3 48 µg/m3
* Six samples were lost either due to damage to the sampler in the field or a greater than 10% difference in presampling and postsampling flow rates.†Ten samples were lost either due to damage to the sampler in the field or a greater than 10% difference in presampling and postsampling flow rates.‡Calculations based on an air volume of 480 liters.
Figure 2. Geometric means of soluble chlorine concentrations in PBZ air samples by day.

Page 13Health Hazard Evaluation Report 2007-0284 & 2007-0317-3155
Results
(Continued) The soluble chlorine concentration was highest on a participant working in the reprocessing area (220 µg/m3). The GM of the soluble chlorine concentrations for those in the reprocessing area was greater than the GMs for those working in other areas (Figure 3).
Of the 142 PBZ trichloramine air samples, only 1 (1%) had a quantifiable concentration at 45 µg/m3 on the first day of sampling. Of these samples, 131 (92%) had concentrations between the MDC and MQC or were not detected, and 10 (7%) were lost. We used the laboratory’s best estimate for values between the MDC and MQC to calculate a GM of 17.2 µg/m3, which is a value between the MDC and MQC. For detailed PBZ trichloramine and soluble chlorine results, see Tables D1–D4 in Appendix D.
Of the 87 area air samples, 65 (75%) had quantifiable concentrations of soluble chlorine, and the overall GM was 37.8 µg/m3 (Table 6). Concentrations ranged from ND to 280 µg/m3. The highest GM area concentration was in the reprocessing area. Table 6 summarizes trichloramine and soluble chlorine concentrations in area air samples by location.
Concentrations of trichloramine in area air samples ranged from ND to 52 µg/m3. The highest GM area air concentration was found at the east evisceration line, station 1. Although only four (5%) samples were quantifiable, our best estimate for the GM for trichloramine was 22.4 µg/m3, which falls between the MDC and MQC. For detailed area chloramine results, refer to Tables D5 and D6 in Appendix D.
Figure 3. Geometric means of trichloramine and soluble chlorine concentrations in PBZ air samples by work area.

Page 14 Health Hazard Evaluation Report 2007-0284 & 2007-0317-3155
Results
(Continued)
Postshift Symptom Surveys and Personal Breathing Zone Air Sampling Results
Exposed employees who participated in the medical testing and air sampling were asked to complete a postshift symptom survey at the end of each work shift. The analyses indicated that increased levels of exposures to air trichloramine and soluble chlorine were not related to increased symptom reports during their shift.
Process Ventilation
The evisceration area had two roof top air conditioning units that were each designed to provide an air supply flow rate of 16,000 cfm. Air from the evisceration area was exhausted through the S&P room and out of the building by two large ceiling exhaust fans (each exhausting 45,000 cfm of air) and three small ceiling exhaust fans (each exhausting 15,000 cfm of air). On the basis of fan design specifications, this would result in a total of 135,000 cfm of air being exhausted from the S&P room. The employer reported that usually only one large exhaust fan ran constantly, while the second
Table 6. Geometric mean* area air concentrations of soluble chlorine and trichloramine by location
Location Geometric mean (µg/m3)
n Soluble chlorine Trichloramine
Reprocessing 10 84 [22]
Paw harvest 10 56 [26]
East evisceration, Station 4 9 56 [26]
West evisceration, Station 4 10 53 [22]
East evisceration, Station 1 10 48 [27]
West evisceration, Station 1 10 46 [26]
Gizzard harvester 10 45 [23]
IQF† 9 [10] [18]
WOG 9 ND ND
Overall GM 87 37.8 [22.4]
* Samples taken over approximately 8 hours at a flow rate of 1 liter per minute.† Approximately 75% of samples were below the MDC.Concentrations between the MDC and MQC are shown with brackets to acknowledge that there is more uncertainty associated with these values than with concentrations above the MQC.

Page 15Health Hazard Evaluation Report 2007-0284 & 2007-0317-3155
Results (Continued) fan was used only when needed. The smaller fans were manually
turned on and off by the facility manager to help control the temperature and humidity of the air in the evisceration area. Two wall-mounted exhaust fans, each with a 24,000 cfm capacity, pulled air from the evisceration area into the S&P room. The legline had two air-conditioning units, each with a 30,000 cfm capacity, and the chiller area had one air-conditioning unit of 25,000 cfm capacity; these units recirculated air during the two production shifts. The IW and IQF areas had eight exhaust fans, each with an operating capacity of 17,000 cfm.
Wall openings allowed air movement between areas depending on the pressure differential between areas. For example, a covered walkway linked IW to the evisceration area, reprocessing/chiller area, and locker room through doorways. The area above the covered walkway was a large, open space (13 feet by 11.5 feet) with no wall separation between the reprocessing/chiller and evisceration area. This space, which allowed the chickens on the automated shackle lines to pass from evisceration directly to reprocessing and chilling, could also let air move freely between these areas.
Figure 4 shows the air flow patterns in different areas of the facility during our evaluation. We observed that all exhaust fans in the S&P room were operating during our evaluation of the air flow patterns in the evisceration, legline, and reprocessing areas using ventilation smoke tubes. We observed that all openings to the S&P room were under negative pressure in relation to the evisceration area. The doors connecting the pump room and S&P room were closed and were not normally used; therefore, we did not evaluate air flow patterns between these two rooms.
We observed that air flowed into the evisceration area from the doorway connecting to the IW walkway. Air also flowed into the evisceration area from doorways connecting to the employee locker/break room and office areas. The reprocessing area was also under negative pressure; air flowed from the employee locker room and the IW walkway into the reprocessing area. Air flowed into the chiller area from the large cooler.
Employer representatives informed us that when all fans were operational in the S&P room, cold air drawn from the chiller areas can cause condensation and precipitation problems in the form of snow. However, we did not observe this during our evaluation.

Page 16 Health Hazard Evaluation Report 2007-0284 & 2007-0317-3155
Other Measurements and Observations
Of the ten chlorine air samples that were taken in the evisceration and reprocessing areas, one sample measured 0.2 ppm at the gizzard harvester, and the remaining nine measurements were below the LOD. Of the ten chlorine dioxide air samples that were taken, one sample had a concentration of 0.3 ppm; all other samples measured 0.1 ppm or lower. The results from the chlorine and chlorine dioxide samples suggest that neither chlorine nor chlorine dioxide in air were at levels of concern on the day air sampling was performed.
The concentration of chlorine in the wash water for reprocessing, gizzard harvest, paw harvest, and bird wash ranged from 20–50 ppm as recorded in the company records. These concentrations are within the levels required by the USDA for spray water on reprocessing and salvage areas of poultry processing facilities [CFR 1978].
There were no reports of respiratory symptoms in the poultry processing facility’s 2007 OSHA Form 300 Log of Work-related Injuries and Illnesses, and the facility nurse stated that no employees reported these types of symptoms to her office. However, during the same period, there were 17 reports of eye, throat, and respiratory irritation among the government food inspectors with whom these employees work side-by-side.
Results
(Continued)
Figure 4. Direction of air flow in the facility observed using ventilation smoke tubes.

Page 17Health Hazard Evaluation Report 2007-0284 & 2007-0317-3155
disCussionThe United States is the world’s largest producer and second largest exporter of poultry meat, with 8.9 billion broiler birds produced in 2007 [USDA 2009]. Because of the high demand for poultry products, poultry slaughter and processing occur in large-scale facilities that emphasize minimizing pathogen contamination and maximizing production efficiency. A complex combination of disinfectants and antimicrobials is used on the processing lines to maintain sanitary conditions and prevent pathogen transfer to humans. These chemical compounds have the potential of interacting with each other in addition to the biological components of the poultry carcasses, and when combined with inadequate ventilation, can cause employee health symptoms [NIOSH 2003, 2006; Dang et al. 2010].
In the past, it was suspected that chlorine, used as a disinfectant in superchlorinated water, could off-gas into the air, causing eye and respiratory irritation symptoms in employees. However, after repeated testing, very low to no chlorine was detected in the air. This led to the hypothesis that the mixing of superchlorinated water with nitrogenous materials, such as waste from the poultry lines, created chloramines. Exposure to chloramines, especially trichloramine, has been known to cause respiratory and eye irritation symptoms in indoor aquatic facilities [Hery et al. 1995; Massin et al. 1998]. Similar symptom reports have been noted at poultry facilities [NIOSH 2003, 2007; King et al. 2006] and at a green salad processing facility [Hery et al. 1998] where soluble chlorine concentrations were found to be related to symptoms. It was hypothesized that the soluble chlorine compounds are also irritants and are more likely to be aerosolized during food processing than at indoor pools [NIOSH 2003].
Eye Irritation
Employee interviews conducted during the initial site visit revealed that reports of eye irritation had been more prevalent than reports of respiratory irritation. Because eye irritation can be caused by workplace chemical irritants such as chloramines, comprehensive eye examinations were included in this investigation. No studies have examined eye irritation in poultry employees, but a few studies have compared symptom reports with detailed optometric or ophthalmological evaluations of the eye in employees in other industries. One study focused on eye irritation reported by flight attendants in airline cabins that allowed passenger smoking on

Page 18 Health Hazard Evaluation Report 2007-0284 & 2007-0317-3155
disCussion
(Continued) flights between Scandinavia and Japan. Tear film breakup time was measured on these crew members before and after smoking was banned on these flights. Crews with environmental tobacco smoke exposure had more eye irritation symptoms and decreased tear film breakup times [Wieslander et al. 2000]. Eye irritation and decreased tear film breakup time upon exposure to cigarette smoke was also found in a study that compared smokers to nonsmokers [Yoon et al. 2005].
Literature regarding quantitative assessment of the eye with exposure to irritants other than environmental tobacco smoke is scarce, but a great deal of literature addresses dry eye syndrome [Mathers et al. 1996; Lemp 1998; Oden et al. 1998; Nichols et al. 2003; Nichols et al. 2004; DEWS Epidemiology Subcommittee 2007]. Dry eye syndrome occurs when insufficient tears are produced to keep the eye surface lubricated, when there are problems with the tear film component proteins, or from environmental irritants that directly disperse the tear film. Whatever the cause, eyes that are not properly moisturized will exhibit signs and symptoms of irritation such as redness, a feeling of dryness, blurred vision, or even excessive tearing as the eye tries to compensate for the decreased lubrication across its surface.
We cannot fully explain why so many participants had abnormally short tear film breakup times on their preshift examinations. Possible reasons may be that participants have chronic work-related eye irritation that does not resolve before the next shift, or that these findings are a result of the aging process. One study showed that both men and women experience a slow, progressive decline in tear volume and production rates with a concomitant increase in tear osmolarity (a measure of salinity concentration) with age. Symptoms only became apparent after reaching a certain threshold [Mathers et al. 1996]. Dry eye is also more common in women than in men, and hormonal changes may play a role in this. The mean age of the exposed group was 43 and 65% were women; therefore, age and sex-related eye effects may be contributing factors to our findings. Use of decongestants and topical eye medicines, which we did not assess, may also contribute to dry eye symptoms. Although our questionnaires showed nearly equal percentages of participants in both groups reporting a prior diagnosis of dry eye (7% of exposed participants and 6% of unexposed participants), it is possible that additional participants had undiagnosed dry eye or other medical conditions that could have a dry eye component. Epidemiologic studies of dry eye across all age groups in the general

Page 19Health Hazard Evaluation Report 2007-0284 & 2007-0317-3155
disCussion
(Continued) population have reported prevalence rates ranging from 5%–35% [DEWS Epidemiology Subcommittee 2007].
Another source of eye irritation to consider among our participants was tobacco smoke. About 50% of the exposed group were current or former smokers. Tobacco smoke is an eye irritant and can result in decreased tear film breakup time as an immediate effect of exposure. Some studies suggest that chronic exposure may also result in permanent changes to tear film production and tear film composition as well as to the cornea [Yoon et al. 2005]. Another investigator has suggested that exposure to environmental pollution or poor air quality may induce changes in the eye that may be subclinical (able to be measured on a test such as the tear film breakup time but without symptoms). Individuals with subclinical changes could develop symptoms after exposure to a second irritant, such as chloramines or soluble chlorine [Versura et al. 1999].
For employees and government food inspectors working on the evisceration lines, dry eye and eye irritation could also have been caused or exacerbated by the personal cooling fans located at the inspection stations. The fans blow air directly across these employees’ eyes. Employees of another poultry processing facility that NIOSH evaluated reported similar health concerns [NIOSH 2006].
Occupational Asthma
Of 39 participants, 37 had no evidence of occupational asthma. Of the 39 participants exposed to superchlorinated water, 2 were found to have greater than a 10% decrease in their FEV1 measurements when we compared their preshift and postshift pulmonary function tests. These changes are consistent with occupational asthma. Occupational asthma, or asthma symptoms that developed as a result of a workplace exposure to an irritant or sensitizer of the respiratory tract, has been estimated to account for approximately 20% of current diagnoses of adult onset asthma [Burge 2009]. NIOSH investigators previously found workers at a turkey processing facility with similar findings of self-reported symptoms consistent with occupational asthma when working around chloramines [King et al. 2006].
Occupational asthma has also been reported among personnel exposed to chloramines at indoor swimming pools [Thickett et al.
Page 20 Health Hazard Evaluation Report 2007-0284 & 2007-0317-3155
disCussion
(Continued) 2002]. Improper mixing of cleaning products has been identified as a separate risk factor for new onset asthma [Kogevinas et al. 2007] due to inadvertent formation of chloramines when cleaning chemicals that contain bleach (sodium hypochlorite) and ammonia are mixed together.
Because no specific test to diagnose occupational asthma exists, a physician should evaluate employees with symptoms of chest tightness, persistent cough, and shortness of breath to determine appropriate tests (e.g., spirometry, lung function testing, or a methacholine challenge).
Exposure Monitoring
Because no OELs for trichloramine or soluble chlorine compounds exist, we compared our results with those observed in other studies. Trichloramine and soluble chlorine concentrations found at this facility were lower than those in other studies. For example, the GM concentration of evisceration participants’ PBZ soluble chlorine air samples at a turkey processing facility was 64 µg/m3 [King et al. 2006], which was higher than what we measured at this facility (29 µg/m3). In a poultry processing facility in Louisiana, the GM PBZ soluble chlorine air concentration in evisceration workers was 67 µg/m3, and the mean trichloramine air concentration was 119 µg/m3 [NIOSH 2007]. At this facility, the highest trichloramine sample we measured was 45 µg/m3. However, the source water for the Louisiana facility was chloraminated for disinfection, which would mean that the water source by itself provided both the chlorine and ammonia (nitrogen) sources required to form chloramines. The source water in our evaluation was chlorinated, not chloraminated.
Research, mainly at indoor pools, has been done to determine trichloramine levels at which people begin exhibiting symptoms. Hery et al. documented 500 µg/m3 for trichloramine as a level at which people experienced eye and respiratory irritation symptoms [Hery et al. 1995]. Another study showed that teenage swimmers exhibited health symptoms at or above trichloramine concentrations of 370 µg/m3 [Levesque et al. 2006]. The World Health Organization recommends using an air trichloramine concentration of 500 µg/m3 as a provisional value to prevent symptom occurrence [WHO 2006]. However, this guideline was specified for indoor aquatic environments and may not
Page 21Health Hazard Evaluation Report 2007-0284 & 2007-0317-3155
disCussion
(Continued) be applicable to poultry facilities. The highest quantifiable trichloramine concentration we measured was 52 µg/m3, well below the World Health Organization’s provisional guideline. At this poultry facility, we measured soluble chlorine levels that may have been a cause or contributed to employee symptom reports. However, increased levels of exposures to air trichloramine and soluble chlorine were not related to increased symptom reports during their shift. The lack of an observable association may be due to trichloramine and soluble chlorine concentrations that were too low for our method to quantify. Other possible explanations may be that the symptoms are a result of exposures to chemical compounds we did not evaluate, such as quaternary ammonium compounds or byproducts of chemical and biological mixtures, or that symptoms are not related to occupational exposures.
Process Ventilation
HVAC systems in poultry processing facilities should serve dual roles: to control air contaminants to ensure product safety and to ensure employees’ health and comfort. Areas where slaughtering and S&P processes occur are potentially the most contaminated, with high concentrations of bioaerosols and microorganisms that could be harmful to humans and the final product [Heber et al. 1995; Lutgring et al. 1997]. Therefore, the ventilation strategy in poultry processing facilities is to move air from the cleanest part of the facility (i.e., storage and packaging areas) to the highest potentially contaminated area (i.e., slaughtering and S&P areas) [Heber et al. 1995; ASHRAE 2010] where it is exhausted outdoors. This concept is depicted in Figure 5. In addition, ASHRAE recommends achieving this air flow pattern in poultry processing facilities using positive pressure ventilation with the storage and packing areas having the higher static pressure and the S&P room being neutral [ASHRAE 2010]. This can be achieved by supplying filtered outdoor air to the packing room and exhausting air through the S&P room. Using positive pressure ventilation will help minimize product contamination from contamination that could result from unfiltered air entering the process area through infiltration from cracks in the building envelope and door openings.
We evaluated the air flow patterns in the processing areas of the facility to identify if the air flow pattern met ASHRAE guidelines and if it possibly contributed to employees’ symptoms. Our

Page 22 Health Hazard Evaluation Report 2007-0284 & 2007-0317-3155
Figure 5. Recommended air flow pattern in a poultry processing facility [Keener 2000].
disCussion
(Continued)
observations showed that large interconnecting wall openings between the processing areas affected the air distribution. For example, the difference between the air supplied to the evisceration area (32,000 cfm) and the air exhausted out of the S&P room (135,000 cfm), requires additional makeup air. This air will be drawn from around doorways and other openings. At this facility, some of this air was drawn into the chiller/reprocessing area through the doors connecting to the break and locker rooms and the covered walkway. The air was then drawn through the opening above the covered walkway from the chiller/reprocessing area to the evisceration area, as well as through the doors connecting evisceration to the covered walkway and the locker and break rooms. In addition, air flow through the interconnecting wall openings can cause condensation and/or precipitation when cold air from the chiller or product storage areas mixes with warm, moist air.
We observed that the negative pressure in the S&P room created by the exhaust fans caused air to move from the cooler and packing areas, past the chillers/reprocessing area, through the interconnecting opening, and into the evisceration area. The air was exhausted out of the building through the S&P room. This air flow pattern agrees with ASHRAE’s recommended flow pattern for poultry processing facilities. However, this air flow pattern was not achieved via positive pressure ventilation as ASHRAE recommends but by keeping the S&P room at much higher negative pressure compared to the rest of the facility.
Page 23Health Hazard Evaluation Report 2007-0284 & 2007-0317-3155
disCussion
(Continued) Although we did not evaluate the slaughtering area, the negative pressure in the S&P room will result in air being drawn from the slaughtering area, which was open to the outdoor poultry unloading area. This air flow pattern could expose employees working in the slaughtering area to harmful bioaerosols, such as endotoxin.
We also observed that outdoor air was supplied to many of the processing areas by roof top units with supply diffusers near the ceiling (approximately 35 feet from ground). Air was exhausted out of the processing areas either by ceiling fans or roof top units that were also placed at approximately the same height from the floor. Because of the high positioning of the supply and exhaust systems, it is possible that outdoor air is not being adequately mixed at the employees’ breathing zone in the processing areas. This can reduce ventilation effectiveness and lead to pockets of high contaminant concentrations [ASHRAE 2009]. Air supplied to the occupied space should facilitate good mixing with contaminated air at employee locations and without significant interruption [ANSI/AIHA 2007].
Water Chemistry
The USDA allows a range of 20–50 ppm of free chlorine in the wash water. Technicians measured the chlorine concentration three times a shift. At this facility, a technician took a sample of water off the line, took it to the lab and used a titration test to measure the chlorine concentration. If the concentration needed adjusting, the technician contacted facility personnel who then manually adjusted the hypochlorite injection system. The time it took for the detection and adjustment of an abnormal chlorine reading may have allowed periodic spikes in chlorine concentrations in the wash water and greater opportunity for chloramines to form. Because water chemistry control is essential in minimizing the formation of airborne irritant compounds, strict control should be practiced. Observers in other poultry facilities have noted that staff may set the concentration of the chemical agent too high, especially where manual dosing is used [IPPC 2003]. In addition, high pressure sprays could aerosolize the spikes in chlorine concentration when the wash water approached 50 ppm, which could contribute to employees’ reports of sporadic and episodic irritation symptoms.
Page 24 Health Hazard Evaluation Report 2007-0284 & 2007-0317-3155
We observed covered drain channels built into the processing area floors that collected wastewater produced during poultry processing. From our review of the drain schematic provided by the employer, all drains appeared to flow from cleaner (toward the end of processing) to dirtier (toward the start of processing) areas. It was reported that the chiller area drip channels had a gate that separated them from the evisceration drip channels during processing. This prevented mixing of the effluent from each area. The gate could be opened when cleaning so the channels could be flushed. To reduce the possibility of a chemical reaction taking place and releasing irritating compounds into the air, substances should not be allowed to pool in the channels or drains.
Limitations
The intermittent formation and release of irritant compounds into the air that can occur in a poultry facility environment may not have occurred during our sampling period, thus we may have underestimated exposures and missed the peak time for reporting of symptoms. A variety of compounds used in the poultry facility that we did not evaluate could have caused similar irritant symptoms in employees. For example, some participants worked near the pepper marinades, which can be irritating. Also, the draft NIOSH chloramine sampling and analytical method we used does not allow for quantification of chloramines at low concentrations. Additionally, we could not take ventilation air flow measurements because of the complexity and large size of the facility. Instead, we observed air flow movement using smoke tubes, which limited our ability to observe airflow throughout the entire evisceration area and surrounding areas.
disCussion
(Continued)
Page 25Health Hazard Evaluation Report 2007-0284 & 2007-0317-3155
ConClusionsExposed participants reported significantly more work-related chest tightness, sneezing, dry eyes, burning or itchy eyes, and blurry vision in the previous month than unexposed participants. Of 39 exposed participants, 2 had cross-shift declines in FEV1 and needed further evaluation for work-related asthma. The rest of the exposed participants (37) did not have spirometry findings consistent with occupational asthma. Most exposed participants had abnormally short preshift tear film breakup times, which for many shortened even further by the end of their shift. The unexpected finding of so many employees with abnormal preshift tear film breakup times should be further investigated in future studies of eye irritation symptoms at poultry plants. Although abnormal tear film breakup times could be a result of eye irritation from repeated exposure to irritants in the workplace, other causes should be investigated such as undiagnosed medical conditions that cause dry eye. Employees with chronic eye irritation should follow up with their own eye doctor for an individual evaluation.
Areas with superchlorinated water had higher levels of soluble chlorine in the air than areas without superchlorinated water, but we were unable to determine whether soluble chlorine compounds were associated with the irritation symptoms or the reduced tear film breakup times. Increased levels of exposures to air trichloramine and soluble chlorine were not related to increased symptom reports in the postshift symptom survey. Although we did not find high levels of chloramine compounds at the time of our evaluation, the sporadic formation and release of these compounds may be higher at other times, potentially causing irritant symptoms. A variety of factors can affect the formation and release of irritant compounds into the air, including the combination of chemical compounds and organic byproducts, aerosolization potential, and water chemistry control. Maintaining water chemistry (i.e., chlorine concentration, pH) within recommended parameters and ensuring good air mixing in the processing areas may help reduce employee symptoms. Ventilation in this processing facility followed the ASHRAE guideline for air flowing from clean to dirty areas; however, this was not done via positive pressure ventilation which would help minimize product contamination.

Page 26 Health Hazard Evaluation Report 2007-0284 & 2007-0317-3155
ReCommendAtionsOn the basis of our findings, we recommend the actions listed below to create a more healthful workplace. We encourage this poultry processing facility to use a labor-management health and safety committee or working group to discuss the recommendations in this report and develop an action plan. Those involved in the work can best set priorities and assess the feasibility of our recommendations for the specific situation at this poultry processing facility. Our recommendations are based on the hierarchy of controls approach (Appendix B: Occupational Exposure Limits and Health Effects). This approach groups actions by their likely effectiveness in reducing or removing hazards. In most cases, the preferred approach is to eliminate hazardous materials or processes and install engineering controls to reduce exposure or shield employees. Until such controls are in place, or if they are not effective or feasible, administrative measures and/or personal protective equipment may be needed.
Engineering Controls
Engineering controls reduce exposures to employees by removing the hazard from the process or placing a barrier between the hazard and the employee. Engineering controls are very effective at protecting employees without placing primary responsibility of implementation on the employee. Design of ventilation systems in poultry processing facilities is challenging because of the large interconnecting wall openings. To improve the health and safety of employees and prevent contaminant transfer from the outdoors to the product areas, we recommend the following:
Use positive pressure ventilation to achieve the air flow 1. patterns following ASHRAE guidelines [ASHRAE 2010], which will help minimize product contamination. The air should be well mixed at employees’ breathing zone levels. Consult a ventilation engineer to determine the best approach to achieve the recommended air flow pattern using positive pressurization. The office or break room areas connected to the process area should be at relatively higher static pressures to prevent movement of possible contaminants from process areas.
Ensure that exhaust fans are cleaned and maintained 2. regularly. Bird feathers and dust deposited on the fan can severely affect fan performance. Air flow should be directed away from the workers’ faces to reduce inhalation or eye contact with potential allergens and irritants.

Page 27Health Hazard Evaluation Report 2007-0284 & 2007-0317-3155
ReCommendAtions
(Continued) Investigate alternatives for a more accurate and timely way 3. to monitor and adjust chlorine concentration and other water chemistry parameters of the superchlorinated water. For example, an injection pump could be self-regulating if equipped with automatic flow control and fail-safe shut down options. This can prevent the spikes in chlorine levels that may contribute to irritant gas formation.
Minimize the mixing of wastewater containing various 4. chemicals and/or organic byproducts with wastewater from other areas, and remove effluent in the drain channels as quickly as possible [IPPC 2003].
Reduce the aerosolization of chemicals in the wash water 5. by using spray nozzles that produce larger droplets. Another option is to place a barrier around machines that aerosolize superchlorinated water.
Administrative Controls
Administrative controls are management-dictated work practices and policies to reduce or prevent exposures to workplace hazards. The effectiveness of administrative changes in work practices for controlling workplace hazards is dependent on management commitment and employee acceptance. Regular monitoring and reinforcement are necessary to ensure that control policies and procedures are not circumvented in the name of convenience or production.
Continue to ensure that staff are adequately trained to test 1. and control water chemistry parameters.
Periodically review alternative cleaning agent options that 2. are safer to use than current products. Newer or alternative formulations may reduce the amount of chemical required while also improving hygiene standards [IPPC 2003].
Encourage poultry processing employees to report work-3. related symptoms to the facility health office so that the employer can investigate these events and ensure prompt medical care. Government food inspectors working alongside poultry processing employees should report symptoms to their supervisors for similar investigation.
Page 28 Health Hazard Evaluation Report 2007-0284 & 2007-0317-3155
RefeRenCesANSI/AIHA [2007]. Fundamentals governing the design and operation of dilution ventilation systems in industrial occupancies. Fairfax, VA: American Industrial Hygiene Association.
ASHRAE [2009]. Space air diffusion. In American Society of Heating, Refrigerating, and Air-Conditioning Engineers Handbook – Fundamentals. Atlanta, GA: American Society of Heating, Refrigerating, and Air-Conditioning Engineers, Inc., pp. 20.1–20.22.
ASHRAE [2010]. American Society of Heating, Refrigerating, and Air-Conditioning Engineers Handbook – Refrigeration. Atlanta, GA: American Society of Heating, Refrigerating, and Air-Conditioning Engineers, Inc., pp. 31.1–31.11.
Barbee SJ, Thackara JW, Rinehart WE [1983]. Acute inhalation toxicology of nitrogen trichloride. AIHA J 44(2):145–146.
Burge S [2009]. Recent developments in occupational asthma. Swiss Med Weekly 140(9–10):128–132.
CFR. Code of Federal Regulations. Washington, DC: U.S. Government Printing Office, Office of the Federal Register.
Dang B, Chen L, Mueller C, Dunn KH, Almaguer D, Roberts JL, Otto CS [2010]. Ocular and respiratory symptoms among lifeguards at a hotel indoor waterpark resort. J Occup Environ Med 52(2):207–213.
DEWS Epidemiology Subcommittee [2007]. The epidemiology of dry eye: report of the research subcommittee of the International Dry Eye WorkShop (2007). Ocular Surface 5(2):93–107.
Heber AJ, Zimmerman NJ, Linton RH [1995]. Ventilation of poultry slaughtering and processing plants. Building ventilation series. Purdue University Cooperative Extension Service, West Lafayette, IN.
Hery M, Hecht G, Gerber JM, Gendre JC, Hubert G, Rebuffaud J [1995]. Exposure to chloramines in the atmosphere of indoor swimming pools. Ann Occup Hyg 39(4):427–439.
Hery M, Gerber JM, Hecht G, Subra I, Possoz C, Aubert S, Dieudonne M, Andre JC [1998]. Exposure to chloramines in a green salad processing plant. Ann Occup Hyg 42(7):437–451.

Page 29Health Hazard Evaluation Report 2007-0284 & 2007-0317-3155
RefeRenCes
(Continued) Hornung RW, Reed LD [1990]. Estimation of average concentration in the presence of nondetectable values. Appl Occup Hyg 5(1):46–51.
IPPC [2003]. Guidance for the poultry processing sector. Integrated Pollution Prevention and Control (IPPC). Environment Agency. IPPC S6.11 Issue 3. Bristol, UK; pp. 50–57.
Keener KM [2000]. Air quality intervention strategies in the processing plant; a system approach. North Carolina Cooperative Extension Service Publication.
King BS, Page EH, Mueller CA, Dollberg DD, Gomez KE, Warren AM [2006]. Eye and respiratory symptoms in poultry processing workers exposed to chlorine by-products. Am J Indus Med 49(2):119–126.
Kogevinas M, Zock JP, Jarvis D, Kromhout H, Lillienberg L, Plana E, Radon K,Toren K, Alliksoo A, Benke G, Blanc PD, Dahlman-Hoglund A, D’Errico A, Hery M,, Kennedy S, Kunzli N, Leynaert B, Mirabelli MC, Muniozguren N, Norback D, Olivieri M, Payo F, Villani S, van Sprundel M, Urrutia I, Wieslander G, Sunyer J, and Anto JM [2007]. Exposure to substances in the workplace and new-onset asthma: an international prospective population-based study (ECRHS-II). Lancet 370(9584):336–341.
Lemp MA [1998]. Epidemiology and classification of dry eye. Adv Exp Med Biol 438:791–803.
Levesque B, Duchesne JF, Gingras S, Lavoie R, Prud’Homme D, Bernard E, Boulet LP, Ernst P [2006]. The determinants of prevalence of health complaints among young competitive swimmers. Int Arch Occup Environ Health 80(1):32–39.
Lutgring KR, Linton RH, Zimmer NJ, Peugh M, Heber AJ [1997]. Distribution and quantification of bioaerosols in poultry-slaughtering plants. J Food Prod 60(7):804–810.
Massin N, Bohadana AB, Wild P, Hery M, Toamain JP, Hubert G [1998]. Respiratory symptoms and bronchial responsiveness in lifeguards exposed to nitrogen trichloride in indoor swimming pools. Occup Environ Med 55(4):258–263.

Page 30 Health Hazard Evaluation Report 2007-0284 & 2007-0317-3155
Mathers WD, Lane JA, Zimmerman MB [1996]. Tear film changes associated with normal aging. Cornea 15(3): 229–334.
Nichols KK, Nichols JJ, Mitchell GL [2003]. The relation between tear film tests in patients with dry eye disease. Opthal Physiol Opt 23(6):553–560.
Nichols KK, Mitchell GL, Zadnik K [2004]. The repeatability of clinical measurements of dry eye. Cornea 23(3):272–284.
NIOSH [1987]. Hazard evaluation and technical assistance report: Columbia Farms poultry plant, Columbia, SC. By Ferguson R. Cincinnati, OH: U.S. Department of Health and Human Services, Centers for Disease Control and Prevention, National Institute for Occupational Safety and Health, NIOSH HETA Report No. 87-110-1943.
NIOSH [1992]. Hazard evaluation and technical assistance closeout letter at Tyson Foods, Broken Bow, OK. By Echt A and Bresler FT. Cincinnati, OH: U.S. Department of Health and Human Services, Centers for Disease Control and Prevention, National Institute for Occupational Safety and Health, NIOSH HETA 92-098.
NIOSH [1993]. Hazard evaluation and technical assistance report: Tyson Foods, Monett, MO. By Parker M, Weber AM, and Sanderson WT. Cincinnati, OH: U.S. Department of Health and Human Services, Centers for Disease Control and Prevention, National Institute for Occupational Safety and Health, NIOSH HETA Report No. 93-0230-2405.
NIOSH [2000]. Hazard evaluation and technical assistance report: Wampler Foods, Inc. Hinton, VA. By Kiefer M, Sanderson WT, Lenhart SW, and Weber AM. Cincinnati, OH: U.S. Department of Health and Human Services, Centers for Disease Control and Prevention, National Institute for Occupational Safety and Health, NIOSH HETA Report No. 2000-0105-2794.
NIOSH [2003]. Hazard evaluation and technical assistance report: Bil-Mar Foods, Inc., Storm Lake, IA. By King B and Page E. Cincinnati, OH: U.S. Department of Health and Human Services, Centers for Disease Control and Prevention, National Institute for Occupational Safety and Health, NIOSH HETA Report No. 2002-0257-2916.
RefeRenCes
(Continued)
Page 31Health Hazard Evaluation Report 2007-0284 & 2007-0317-3155
NIOSH [2006]. Hazard evaluation and technical assistance report: Sara Lee Foods, Storm Lake, IA. By King B and Page E. Cincinnati, OH: U.S. Department of Health and Human Services, Centers for Disease Control and Prevention, National Institute for Occupational Safety and Health, NIOSH HETA Report No. 2006-0153-3022.
NIOSH [2007]. Hazard evaluation and technical assistance report: U.S. Department of Agriculture, Food Safety and Inspection Service, Natchitoches, LA. By King B, Warren A, Mueller C. Cincinnati, OH: U.S. Department of Health and Human Services, Centers for Disease Control and Prevention, National Institute for Occupational Safety and Health, NIOSH HETA Report No. 2004-0337-3051.
Oden NL, Lilienfeld DE, Lemp MA, Nelson D, Ederer F [1998]. Sensitivity and specificity of a screening questionnaire for dry eye. Adv Exp Med Biol 438:807–820.
Sanderson W, Weber A, Echt A [1995]. Case reports: epidemic eye and upper respiratory irritation in poultry processing plants. Appl Occup Environ Hyg 10(1):43–49.
Thickett KM, McCoach JS, Gerber JM, Sadhra S, Burge PS [2002]. Occupational asthma caused by chloramines in indoor swimming pool air. Eur Respir J 19:827–832.
USDA [2009]. Briefing room: Poultry and eggs. United States Department of Agriculture. [http://www.ers.usda.gov/Briefing/Poultry/]. Date accessed: November 2011.
Versura P, Profazio V, Cellini M, Torreggiani, Caramazza R [1999]. Eye discomfort and air pollution. Ophthalmologica 213:103–109.
WHO [2006]. Guidelines for safe recreational water environments. Volume 2, Swimming pools and similar environments. Geneva, Switzerland: World Health Organization.
Wieslander G, Lindgren T, Norback D, Venge P [2000]. Changes in the ocular and nasal signs and symptoms of aircrews in relation to the ban on smoking on intercontinental flights. Scand J Work Environ Health 26(6):514–522.
Yoon KC, Song BY, Seo MS [2005]. Effects of smoking on tear film and ocular surface. Korean J Ophthalmol 19(1):18–22.
RefeRenCes
(Continued)

Page 32 Health Hazard Evaluation Report 2007-0284 & 2007-0317-3155
Spirometry
Preshift and postshift spirometry was performed on each participant. Spirometry refers to the measurements of exhaled air volume and flow rates from individuals who are coached by trained technicians using either volume-based or flow-based measuring equipment. The standard measurements taken in spirometry are the FVC and FEV1. The FVC is the volume of air exhaled from a maximal inspiration to a complete exhalation. The FEV1 is the volume of air exhaled in the first second of a FVC maneuver. We focused on the FEV1 as previous studies have defined work-related asthma as a decrease of >10% in the FEV1 in the postshift testing as compared to the preshift testing [Moscato 2003]. Irritation of the respiratory tract by environmental compounds can manifest as asthma and is reflected by previously described changes in the spirometry parameters.
Spirometry was performed by NIOSH spirometry technicians using EasyOneTM “worldspirometer” spirometers (ndd Medical Technologies Inc., Zurich, Switzerland). All spirometry data collection procedures conformed to the American Thoracic Society’s standardization of spirometry [American Thoracic Society 1995]. At least three maximal expiratory maneuvers or FVC maneuvers were performed at each session. The selection and interpretation of results also conformed to standard guidelines [American Thoracic Society 1991]. Predicted values were determined from published reference equations [Hankinson et al. 1999].
Eye Examinations
Eye examinations (Figure A1) were performed by a licensed optometrist and consisted of a slit lamp examination of the cornea (the clear membrane that covers the iris and pupil) and conjunctiva (the clear membrane that covers the whites of the eyes and lines the insides of the eyelids). This allows the optometrist to see a magnified view of the eye and determine if the cornea and conjunctiva are quiet (i.e., normal) or abnormal. This initial assessment is followed by applying a fluorescein dye to measure the tear film breakup time and to highlight abnormalities of the cornea. Premature breakup of the tear film may be due to exposure to environmental irritants, inadequate tear production, defects in the protein components of the tear film, or other factors. Once the dye is placed in the eye, the subject is instructed to blink several times to distribute the dye, and then the optometrist measures how long it takes for darkened areas in the tear film to appear, signaling the breakup of the tear film layer containing the dye. The tear film breakup time
Appendix A: metHodology
Figure A1. Optometrist conducting slit lamp examination of a poultry processing employee.

Page 33Health Hazard Evaluation Report 2007-0284 & 2007-0317-3155
in a normal eye is greater than or equal to 10 seconds. The optometrist also uses the dye to give each eye a fluorescein staining score; a fluorescein staining score greater than 4 is considered abnormal. Appendix C provides a full description of the fluorescein staining score scoring system and illustrative photographs. Each component of the eye examination was analyzed separately and for each component, the right and left eyes were tested and scored separately.
Chloramines
Chloramine samplers consist of a sampling train that includes a pump that pulls air through a sorbent tube that traps soluble chlorine compounds (which include monochloramine, dichloramine, hypochlorite, and hypochlorous acid) onto silica gel coated with sulfamic acid. The air then passes through a 37-millimeter polystyrene cassette loaded with two quartz fiber filters coated in sodium carbonate and diarsenic trioxide to capture trichloramine.
The air samples were collected using calibrated Aircheck™ 2000 sampling pumps (SKC, Eighty Four, Pennsylvania) at a flow rate of 1 liter per minute. The sampling pumps were precalibrated and postcalibrated with a DryCal® DC Lite primary air flow meter (Bios International Corp., Butler, New Jersey). Samplers were attached to the employees’ clothing (in the employees’ breathing zones) and checked throughout the day for correct positioning and to ensure that the sampling pumps functioned correctly. Samples were refrigerated in the dark and analyzed within 3 days of collection by the NIOSH contract lab Bureau Veritas (Novi, Michigan) using ion chromatography and by NIOSH using inductively coupled plasma atomic emission spectroscopy.
During analysis, each filter was removed from the cassette and placed in a 20 mL sample vial. After 10 mL of deionized water was added, the samples were periodically agitated for 30 minutes. Samples were refrigerated and filtered prior to analysis by ion chromatography. The LOD and LOQ were determined for each sample set.
For analysis of the sorbent tubes, the samples were desorbed by placing the impregnated silica gel from the tube into a 20 mL vial. Ten mL of a 1 gram per liter sulfamic acid solution was added to each vial, and the samples were periodically agitated for 30 minutes. The sample extracts were decanted into another vial and refrigerated until analysis. Samples were analyzed for chloride by ion chromatography. The LOD and LOQ were determined for each sample set.
Chlorine Dioxide and Chlorine
Chlorine dioxide and chlorine in air were measured using a colorimetric detector tube and bellows pump. Detector tubes have a standard deviation of +/- 10% to 15% and measuring range of 0.2 ppm to 3 ppm for chlorine and 0.025 ppm to 1 ppm for chlorine dioxide.
Appendix A: metHodology (Continued)

Page 34 Health Hazard Evaluation Report 2007-0284 & 2007-0317-3155
References
American Thoracic Society [1991]. Lung function testing: selection of reference values and interpretative strategies. Am Rev Respir Dis 144(5):1202–1218.
American Thoracic Society [1995]. Standardization of spirometry – 1994 Update. Am J Respir Crit Care Med 152(3):1107–1136.
Hankinson JL, Odencrantz JR, Fedan KB [1999]. Spirometric reference values from a sample of the U.S. general population. Am J Respir Crit Care Med 159(1):179–187.
Moscato G, Malo JL, Bernstein D [2003]. Diagnosing occupational asthma: how much, how far? Eur Respir J 21(5):879–885.
Appendix A: metHodology (Continued)

Page 35Health Hazard Evaluation Report 2007-0284 & 2007-0317-3155
Appendix B: oCCupAtionAl exposuRe limits And HeAltH effeCts
In evaluating the hazards posed by workplace exposures, NIOSH investigators use both mandatory (legally enforceable) and recommended OELs for chemical, physical, and biological agents as a guide for making recommendations. OELs have been developed by federal agencies and safety and health organizations to prevent the occurrence of adverse health effects from workplace exposures. Generally, OELs suggest levels of exposure that most employees may be exposed to for up to 10 hours per day, 40 hours per week, for a working lifetime, without experiencing adverse health effects. However, not all employees will be protected from adverse health effects even if their exposures are maintained below these levels. A small percentage may experience adverse health effects because of individual susceptibility, a preexisting medical condition, and/or a hypersensitivity (allergy). In addition, some hazardous substances may act in combination with other workplace exposures, the general environment, or with medications or personal habits of the employee to produce adverse health effects even if the occupational exposures are controlled at the level set by the exposure limit. Also, some substances can be absorbed by direct contact with the skin and mucous membranes in addition to being inhaled, which contributes to the individual’s overall exposure.
Most OELs are expressed as a TWA exposure. A TWA refers to the average exposure during a normal 8- to 10-hour workday. Some chemical substances and physical agents have recommended STEL or ceiling values where adverse health effects are caused by exposures over a short period. Unless otherwise noted, the STEL is a 15-minute TWA exposure that should not be exceeded at any time during a workday, and the ceiling limit is an exposure that should not be exceeded at any time.
In the United States, OELs have been established by federal agencies, professional organizations, state and local governments, and other entities. Some OELs are legally enforceable limits, while others are recommendations. The U.S. Department of Labor OSHA PELs (29 CFR 1910 [general industry]; 29 CFR 1926 [construction industry]; and 29 CFR 1917 [maritime industry]) are legal limits enforceable in workplaces covered under the Occupational Safety and Health Act of 1970. NIOSH RELs are recommendations based on a critical review of the scientific and technical information available on a given hazard and the adequacy of methods to identify and control the hazard. NIOSH RELs can be found in the NIOSH Pocket Guide to Chemical Hazards [NIOSH 2010]. NIOSH also recommends different types of risk management practices (e.g., engineering controls, safe work practices, employee education/training, personal protective equipment, and exposure and medical monitoring) to minimize the risk of exposure and adverse health effects from these hazards. Other OELs that are commonly used and cited in the United States include the TLVs recommended by ACGIH, a professional organization, and the WEELs recommended by the American Industrial Hygiene Association, another professional organization. The TLVs and WEELs are developed by committee members of these associations from a review of the published, peer-reviewed literature. They are not consensus standards. ACGIH TLVs are considered voluntary exposure guidelines for use by industrial hygienists and others trained in this discipline “to assist in the control of health hazards” [ACGIH 2011]. WEELs have been established for some chemicals “when no other legal or authoritative limits exist” [AIHA 2011].
Outside the United States, OELs have been established by various agencies and organizations and include both legal and recommended limits. The Institut für Arbeitsschutz der Deutschen Gesetzlichen Unfallversicherung (IFA, Institute for Occupational Safety and Health of the German Social Accident

Page 36 Health Hazard Evaluation Report 2007-0284 & 2007-0317-3155
Insurance) maintains a database of international OELs from European Union member states, Canada (Québec), Japan, Switzerland, and the United States. The database, available at http://www.dguv.de/ifa/en/gestis/limit_values/index.jsp, contains international limits for over 1,500 hazardous substances and is updated periodically.
Employers should understand that not all hazardous chemicals have specific OSHA PELs, and for some agents the legally enforceable and recommended limits may not reflect current health-based information. However, an employer is still required by OSHA to protect its employees from hazards even in the absence of a specific OSHA PEL. OSHA requires an employer to furnish employees a place of employment free from recognized hazards that cause or are likely to cause death or serious physical harm [Occupational Safety and Health Act of 1970 (Public Law 91–596, sec. 5(a)(1))]. Thus, NIOSH investigators encourage employers to make use of other OELs when making risk assessments and risk management decisions to best protect the health of their employees. NIOSH investigators also encourage the use of the traditional hierarchy of controls approach to eliminate or minimize identified workplace hazards. This includes, in order of preference, the use of (1) substitution or elimination of the hazardous agent, (2) engineering controls (e.g., local exhaust ventilation, process enclosure, dilution ventilation), (3) administrative controls (e.g., limiting time of exposure, employee training, work practice changes, medical surveillance), and (4) personal protective equipment (e.g., respiratory protection, gloves, eye protection, hearing protection). Control banding, a qualitative risk assessment and risk management tool, is a complementary approach to protecting employee health that focuses resources on exposure controls by describing how a risk needs to be managed. Information on control banding is available at http://www.cdc.gov/niosh/topics/ctrlbanding/. This approach can be applied in situations where OELs have not been established or can be used to supplement the OELs, when available.
Chloramines
Chloramines, specifically trichloramine and soluble chlorine compounds, are inorganic compounds formed by the reaction between chlorine disinfectants and nitrogenous compounds such as ammonia, amines, or organic nitrogen-containing material. The species and concentrations of chloramine are influenced by the concentration of residual chlorine, ammonia (or other nitrogen sources), pH, and temperature. In general, the lower the pH and the greater the chlorine to ammonia ratio, the higher the likelihood of producing trichloramine.
Soluble Chlorine CompoundsThe term soluble chlorine refers to the chlorine compounds collected using the silica gel tube portion of the sampler used. These chlorine compounds include monochloramine, dichloramine, hypochlorous acid, and hypochlorite. No OELs have been developed for soluble chlorine or for its specific possible constituents.
Monochloramine and dichloramine are less volatile than trichloramine; monochloramine is released into the air about 300 times slower and dichloramine about three times slower than trichloramine
Appendix B: oCCupAtionAl exposuRe limits And HeAltH effeCts
(Continued)

Page 37Health Hazard Evaluation Report 2007-0284 & 2007-0317-3155
[Holzwarth 1984]. They tend to be more abundant in water than in air. However, high air concentrations of monochloramine and dichloramine have been found in environments where water is aerosolized. In studies of chloramine exposures at poultry facilities and a green salad processing facility, eye and upper respiratory irritation symptoms were associated with soluble chlorine concentrations. In these scenarios, soluble chlorine compounds are generated from the mixing of chlorinated water with nitrogenous proteins produced by animals and plants [Hery et al. 1998; NIOSH 2003, 2006].
TrichloramineTrichloramine, or nitrogen trichloride, is a brownish-yellow gas, has a pungent chlorine odor, is a strong irritant, and causes excessive tearing of the eyes [Barbee 1983]. Trichloramine, the most volatile and prevalent chloramine compound in the air around swimming pools [Thickett et al. 2002], has low solubility and decomposes rapidly in sunlight. Eye and respiratory tract irritation appear to be the primary effects of exposure. Currently, no NIOSH or OSHA OELs exist for air trichloramine concentration.
Chlorine
Chlorine is a greenish-yellow gas with a characteristic irritating odor. Exposure to chlorine gas can cause severe irritation of the eyes and respiratory tract, resulting in tearing, runny nose, sneezing, coughing, choking, and chest pain [NIOSH 1978; Proctor et al. 2004]. Breathing difficulty, with a delayed onset, can also occur. Severe exposure can result in edema and can be fatal. Mucous membrane and eye irritation has been reported to occur at concentrations as low as 0.2 ppm [Proctor et al. 2004]. The NIOSH REL for chlorine is 0.5 ppm as a ceiling limit [NIOSH 2010]. The OSHA PEL for chlorine is 1 ppm as a ceiling limit [NIOSH 2010]. The ACGIH TLV for chlorine is 0.5 ppm; ACGIH has established a STEL for chlorine of 1 ppm [ACGIH 2011].
Chlorine Dioxide
Chlorine dioxide has an unpleasant chlorine-like odor and has an air odor threshold of 0.1 ppm. Exposure to chlorine dioxide can cause eye, nose, throat irritation; coughing, wheezing, bronchitis; pulmonary edema; chronic bronchitis. The NIOSH REL and OSHA PEL TWA for chlorine dioxide is 0.1 ppm [NIOSH 2010]. The ACGIH TLV for chlorine dioxide is 0.1 ppm; ACGIH has established a STEL for chlorine dioxide of 0.3 ppm [ACGIH 2011].
References
ACGIH [2011]. 2011 TLVs® and BEIs®: threshold limit values for chemical substances and physical agents and biological exposure indices. Cincinnati, OH: American Conference of Governmental Industrial Hygienists.
Appendix B: oCCupAtionAl exposuRe limits And HeAltH effeCts
(Continued)

Page 38 Health Hazard Evaluation Report 2007-0284 & 2007-0317-3155
AIHA [2011]. AIHA 2011 Emergency response planning guidelines (ERPG) & workplace environmental exposure levels (WEEL) handbook. Fairfax, VA: American Industrial Hygiene Association.
Barbee SJ, Thackara JW, Rinehart WE [1983]. Acute inhalation toxicology of nitrogen trichloride. Am Ind Hyg Assoc J 44(2):145–146.
CFR. Code of Federal Regulations. Washington, DC: U.S. Government Printing Office, Office of the Federal Register.
Hery M, Gerber JM, Hecht G, Subra I, Possoz C, Aubert S, Dieudonne M, Andre JC [1998]. Exposure to chloramines in a green salad processing plant. Ann Occup Hyg 42(7):437–451.
Holzwarth G, Balmer RG, Soni L [1984]. The fate of chlorine and chloramines in cooling towers. Water Res 18(11):1421–1427.
NIOSH [1978]. NIOSH/OSHA occupational health guidelines for chemical hazards–occupational health guideline for chlorine. Cincinnati, OH: U.S. Department of Health and Human Services, Centers for Disease Control and Prevention, National Institute for Occupational Safety and Health. DHHS (NIOSH) Publication No. 81-123.
NIOSH [2003]. Hazard evaluation and technical assistance report: Bil-Mar Foods, Inc., Storm Lake, IA. By King B and Page E. Cincinnati, OH: U.S. Department of Health and Human Services, Centers for Disease Control and Prevention, National Institute for Occupational Safety and Health, NIOSH HETA Report No. 2002-0257-2916.
NIOSH [2006]. Hazard evaluation and technical assistance report: Sara Lee Foods, Storm Lake, IA. By King B and Page E. Cincinnati, OH: U.S. Department of Health and Human Services, Centers for Disease Control and Prevention, National Institute for Occupational Safety and Health, NIOSH HETA Report No. 2006-0153-3022.
NIOSH [2010]. NIOSH pocket guide to chemical hazards. Cincinnati, OH: U.S. Department of Health and Human Services, Centers for Disease Control and Prevention, National Institute for Occupational Safety and Health, DHHS (NIOSH) Publication No. 2010-168c. [http://www.cdc.gov/niosh/npg/]. Date accessed: November 2011.
Proctor NH, Hathaway GH [2004]. Chemical hazards of the workplace, 5th ed. Hoboken, NJ: John Wiley & Sons, Inc.
Thickett KM, McCoach JS, Gerber JM, Sadhra S, Burge PS [2002]. Occupational asthma caused by chloramines in indoor swimming pool air. Eur Respir J 19(5):827–832.
Appendix B: oCCupAtionAl exposuRe limits And HeAltH effeCts
(Continued)

Page 39Health Hazard Evaluation Report 2007-0284 & 2007-0317-3155
Fluorescein Stain Grading Score
0 - Normal: negative slit-lamp findings1 - Mild: superficial stippling2 - Moderate: punctuate staining including superficial abrasion of the cornea3 - Severe: abrasion or corneal erosion, deep corneal abrasion, or recurrent erosion
Each eye was divided into five segments as seen on the scoring sheet below.
Appendix C: fluoResCein stAin sCoRing
Each segment was scored separately. The total fluorescein staining score for that eye was the sum of the five scores (maximum score/eye = 15). Examples of each score are illustrated by the photographs taken from the slide show portion of the website http://www.staininggrid.com/.
Copyright 2006–2007, Gary Andrasko, OD, LLC. All Rights Reserved. Staining Grid documents available from the Web (“Staining Grid Documents”) are protected by the copyright laws of the United States and International Treaties.
Permission to copy, view, and print Staining Grid documents available from the Web is authorized provided that: it is used for non-commercial and informational purposes, it is not modified, and the above copyright notice and this permission notice are contained in each Staining Grid Document. Notwithstanding the above, nothing contained herein shall be construed as conferring any right or license under any copyright of Gary Andrasko, OD, LLC.

Page 40 Health Hazard Evaluation Report 2007-0284 & 2007-0317-3155
Appendix d: tABles
Table D1. Personal breathing zone soluble chlorine and trichloramine air concentration results in the evisceration area
Day Soluble chlorine Trichloramine (µg/m3) (µg/m3)
1 130 45
5 120 [39]
4 110 [28]
1 100 [30]
2 93 [33]
1 86 [29]
1 68 [20]
1 65 [20]
1 64 NA*
1 63 [13]
1 63 [20]
1 62 [14]
1 61 [22]
1 60 [17]
1 58 [22]
1 57 [21]
2 54 NA
1 54 [21]
5 54 [33]
1 52 [13]
2 51 [26]
1 51 [23]
1 49 [21]
1 49 [23]
5 48 [31]
2 46 [21]
2 45 [20]
4 44 [14]
1 44 [15]
3 42 [18]
2 42 [26]
4 37 [14]

Page 41Health Hazard Evaluation Report 2007-0284 & 2007-0317-3155
Table D1. Personal breathing zone soluble chlorine and trichloramine air concentration results in the evisceration area (continued)
Day Soluble chlorine Trichloramine (µg/m3) (µg/m3)
5 36 [25]
2 36 [23]
2 35 [20]
5 33 [20]
2 33 [18]
2 33 [26]
4 32 [16]
4 32 [21]
5 30 [17]
5 29 [27]
4 29 ND†
4 28 [22]
5 [28] [30]
4 [26] ND
2 26 ND
4 26 ND
4 26 ND
5 26 [31]
4 [26] ND
5 [26] [28]
5 [26] [37]
5 [24] [30]
4 24 [19]
4 [24] [18]
5 [24] [25]
5 [23] [25]
5 [23] [25]
2 [23] ND
2 23 [20]
5 [23] [25]
4 [22] [24]
5 [22] [28]
Appendix d: tABles
(Continued)
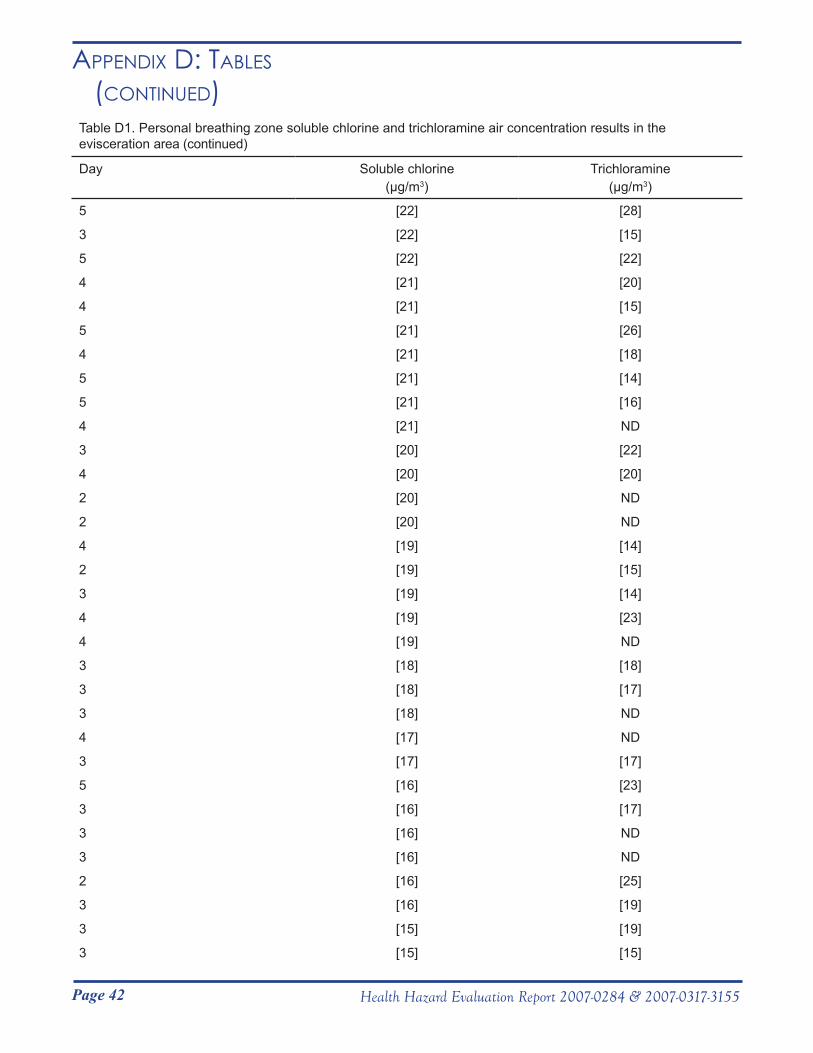
Page 42 Health Hazard Evaluation Report 2007-0284 & 2007-0317-3155
Table D1. Personal breathing zone soluble chlorine and trichloramine air concentration results in the evisceration area (continued)
Day Soluble chlorine Trichloramine (µg/m3) (µg/m3)
5 [22] [28]
3 [22] [15]
5 [22] [22]
4 [21] [20]
4 [21] [15]
5 [21] [26]
4 [21] [18]
5 [21] [14]
5 [21] [16]
4 [21] ND
3 [20] [22]
4 [20] [20]
2 [20] ND
2 [20] ND
4 [19] [14]
2 [19] [15]
3 [19] [14]
4 [19] [23]
4 [19] ND
3 [18] [18]
3 [18] [17]
3 [18] ND
4 [17] ND
3 [17] [17]
5 [16] [23]
3 [16] [17]
3 [16] ND
3 [16] ND
2 [16] [25]
3 [16] [19]
3 [15] [19]
3 [15] [15]
Appendix d: tABles
(Continued)
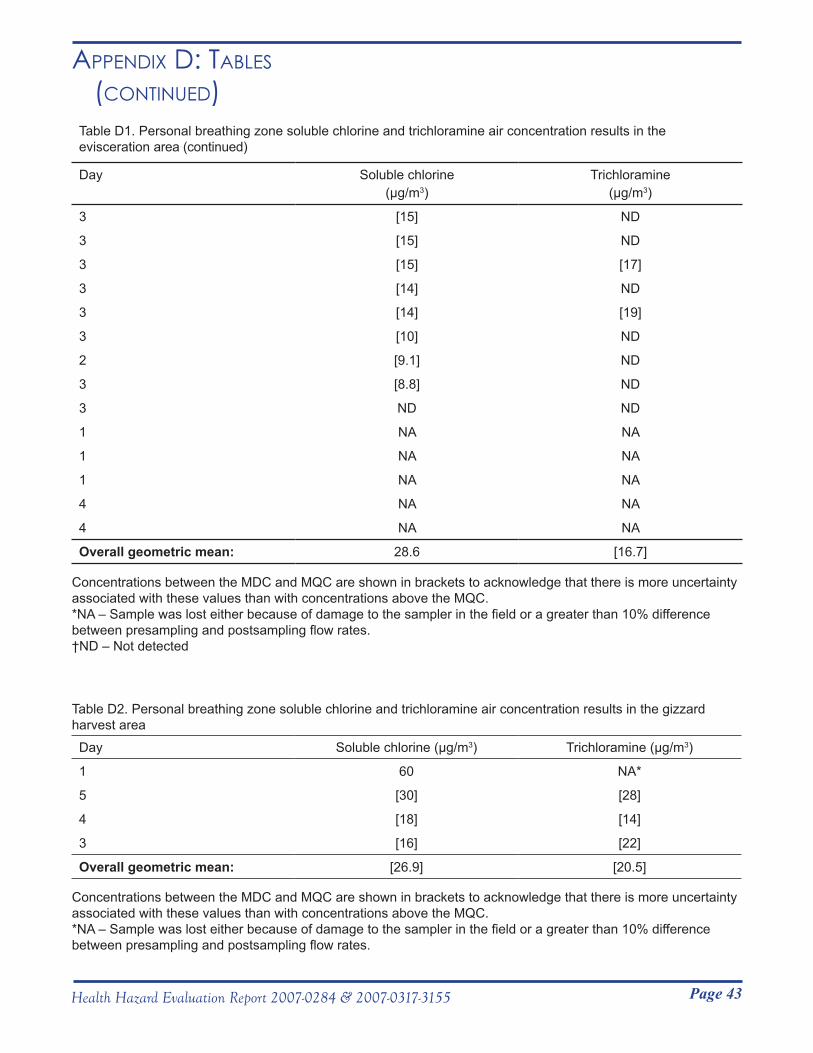
Page 43Health Hazard Evaluation Report 2007-0284 & 2007-0317-3155
Table D1. Personal breathing zone soluble chlorine and trichloramine air concentration results in the evisceration area (continued)
Day Soluble chlorine Trichloramine(µg/m3) (µg/m3)
3 [15] ND
3 [15] ND
3 [15] [17]
3 [14] ND
3 [14] [19]
3 [10] ND
2 [9.1] ND
3 [8.8] ND
3 ND ND
1 NA NA
1 NA NA
1 NA NA
4 NA NA
4 NA NA
Overall geometric mean: 28.6 [16.7]
Concentrations between the MDC and MQC are shown in brackets to acknowledge that there is more uncertainty associated with these values than with concentrations above the MQC.*NA – Sample was lost either because of damage to the sampler in the field or a greater than 10% difference between presampling and postsampling flow rates.†ND – Not detected
Appendix d: tABles
(Continued)
Table D2. Personal breathing zone soluble chlorine and trichloramine air concentration results in the gizzard harvest area
Day Soluble chlorine (µg/m3) Trichloramine (µg/m3)
1 60 NA*
5 [30] [28]
4 [18] [14]
3 [16] [22]
Overall geometric mean: [26.9] [20.5]
Concentrations between the MDC and MQC are shown in brackets to acknowledge that there is more uncertainty associated with these values than with concentrations above the MQC.*NA – Sample was lost either because of damage to the sampler in the field or a greater than 10% difference between presampling and postsampling flow rates.

Page 44 Health Hazard Evaluation Report 2007-0284 & 2007-0317-3155
Table D3. Personal breathing zone soluble chlorine and trichloramine air concentration results in the paw harvest areaDay Soluble chlorine (µg/m3) Trichloramine (µg/m3)1 65 [26]4 [28] [18]5 [24] [24]5 [23] [14]4 [22] [14]2 [21] [16]4 [18] [16]3 [13] NDOverall geometric mean: 24.0 [15.9]
Concentrations between the MDC and MQC are shown in brackets to acknowledge that there is more uncertainty associated with these values than with concentrations above the MQC.
Appendix d: tABles
(Continued)
Table D4. Personal breathing zone soluble chlorine and trichloramine air concentration results in the reprocessing area
Day Soluble chlorine (µg/m3) Trichloramine (µg/m3)
1 220 [39]
2 210 [34]
3 130 NA*
4 120 [33]
4 83 [25]
5 83 [25]
1 79 ND†
1 64 [21]
2 49 [22]
2 44 [29]
5 29 [21]
3 [23] [21]
3 [23] [20]
4 [22] [15]
4 [18] [13]
5 [18] [29]
Overall geometric mean: 54.0 [21.9]
Concentrations between the MDC and MQC are shown in brackets to acknowledge that there is more uncertainty associated with these values than with concentrations above the MQC.*NA – Sample was lost either because of damage to the sampler in the field or a greater than 10% difference between presampling and postsampling flow rates.†ND – Not detected

Page 45Health Hazard Evaluation Report 2007-0284 & 2007-0317-3155
Appendix d: tABles
(Continued)
Tab
le D
5. A
rea
trich
lora
min
e ai
r con
cent
ratio
n re
sults
by
loca
tion
Day
1D
ay 2
Day
3D
ay 4
Day
5G
eom
etric
PM
AM
PM
AM
PM
AM
PM
AM
PM
AM
mea
nA
rea
loca
tion
Tric
hlor
amin
e co
ncen
tratio
n (µ
g/m
3 )E
ast e
visc
erat
ion,
Sta
tion
1[2
6]47
[29]
[23]
[17]
[21]
[24]
[35]
[21]
[34]
[26.
6]E
ast e
visc
erat
ion,
Sta
tion
4[2
9][3
3][3
0][2
9]N
D*
NA
†[2
3][2
9][3
5][2
1][2
5.7]
Paw
har
vest
[19]
[34]
[39]
[28]
ND
[19]
[24]
[28]
[27]
[31]
[26.
2]R
epro
cess
ing
48[3
0]N
D‡
[19]
ND
[21]
[38]
[21]
49N
D[2
2.0]
Giz
zard
har
vest
ND
[31]
[32]
[24]
[14]
[25]
[21]
[22]
[19]
[38]
[22.
5]W
est e
visc
erat
ion,
Sta
tion
1[2
3][3
9][3
9][3
0]N
D[2
4][2
2][2
2][2
8][3
7][2
6.2]
Wes
t evi
scer
atio
n, S
tatio
n 4
ND
[29]
[24]
[30]
[16]
[14]
[21]
[23]
[25]
[37]
[21.
7]IQ
FN
A32
ND
ND
52N
DN
DN
DN
DN
D[1
8.0]
§W
OG
NA
ND
ND
**N
DN
DN
DN
DN
DN
DN
DN
DC
once
ntra
tions
bet
wee
n th
e M
DC
and
MQ
C a
re s
how
n in
bra
cket
s to
ack
now
ledg
e th
at th
ere
is m
ore
unce
rtain
ty a
ssoc
iate
d w
ith
thes
e va
lues
than
with
con
cent
ratio
ns a
bove
the
MQ
C.
*ND
– N
ot d
etec
ted
†NA
– N
o sa
mpl
e ta
ken
for t
his
loca
tion
‡Cas
sette
det
ache
d fro
m s
ampl
ing
train
and
was
foun
d as
sem
bled
bac
kwar
ds d
urin
g po
stca
libra
tion.
§App
roxi
mat
ely
75%
of s
ampl
es w
ere
belo
w th
e M
DC
.**
Sho
rter s
ampl
ing
time;
WO
G fi
nish
ed e
arly

Page 46 Health Hazard Evaluation Report 2007-0284 & 2007-0317-3155
Tabl
e D
6. A
rea
solu
ble
chlo
rine
air c
once
ntra
tion
resu
lts b
y lo
catio
n
Day
1D
ay 2
Day
3D
ay 4
Day
5G
eom
etric
PM
AM
PM
AM
PM
AM
PM
AM
PM
AM
mea
n
Are
a lo
catio
nS
olub
le c
hlor
ine
conc
entra
tion
(µg/
m3 )
Eas
t evi
scer
atio
n, S
tatio
n 1
6875
5649
4146
4635
2859
48.4
Eas
t evi
scer
atio
n, S
tatio
n 4
110
7463
5456
NA
*55
3441
4655
.8
Paw
har
vest
8673
8944
[39]
4860
4830
8056
.3
Rep
roce
ssin
g28
014
0N
D†,
‡84
170
9920
0[3
3]21
042
83.5
Giz
zard
har
vest
7748
4536
5251
40[3
2]§
3350
45.0
Wes
t evi
scer
atio
n, S
tatio
n 1
6070
[23.
8]§
5341
6247
3536
6146
.4
Wes
t evi
scer
atio
n, S
tatio
n 4
7387
4859
5051
4836
3563
52.9
IQF
NA
36N
DN
D§
[51.
7]N
DN
DN
DN
DN
D[1
0.3]
**
WO
GN
AN
DN
D††
ND
ND
ND
ND
ND
ND
ND
ND
Con
cent
ratio
ns b
etw
een
the
MD
C a
nd M
QC
are
sho
wn
in b
rack
ets
to a
ckno
wle
dge
that
ther
e is
mor
e un
certa
inty
ass
ocia
ted
with
thes
e va
lues
than
with
con
cent
ratio
ns a
bove
the
MQ
C.
*NA
– N
o sa
mpl
e ta
ken
for t
his
loca
tion
†ND
– N
ot d
etec
ted
‡Cas
sette
det
ache
d fro
m s
ampl
ing
train
and
was
foun
d as
sem
bled
bac
kwar
ds d
urin
g po
st c
alib
ratio
n.§
Sili
ca g
el tu
be b
roke
dur
ing
sam
plin
g.**
App
roxi
mat
ely
75%
of s
ampl
es w
ere
belo
w th
e M
DC
. ††
Sho
rter s
ampl
ing
time;
WO
G fi
nish
ed e
arly
Appendix d: tABles
(Continued)
Page 47Health Hazard Evaluation Report 2007-0284 & 2007-0317-3155
ACknowledgments And AvAilABility of RepoRt
The Hazard Evaluations and Technical Assistance Branch (HETAB) of the National Institute for Occupational Safety and Health (NIOSH) conducts field investigations of possible health hazards in the workplace. These investigations are conducted under the authority of Section 20(a)(6) of the Occupational Safety and Health Act of 1970, 29 U.S.C. 669(a)(6) which authorizes the Secretary of Health and Human Services, following a written request from any employer or authorized representative of employees, to determine whether any substance normally found in the place of employment has potentially toxic effects in such concentrations as used or found. HETAB also provides, upon request, technical and consultative assistance to federal, state, and local agencies; labor; industry; and other groups or individuals to control occupational health hazards and to prevent related trauma and disease.
Mention of any company or product does not constitute endorsement by NIOSH. In addition, citations to websites external to NIOSH do not constitute NIOSH endorsement of the sponsoring organizations or their programs or products. Furthermore, NIOSH is not responsible for the content of these websites. All Web addresses referenced in this document were accessible as of the publication date.
This report was prepared by Lilia Chen, Judith Eisenberg, Srinivas Durgam, and Charles Mueller of HETAB, Division of Surveillance, Hazard Evaluations and Field Studies. Industrial hygiene field assistance was provided by Donald Booher, Srinivas Durgam, Stefanie Evans, Karl Feldmann, Todd Niemeier, and Jessica Ramsey. Industrial hygiene equipment and logistical support was provided by Donald Booher and Karl Feldmann. Medical field assistance was provided by Diana Freeland, Matthew Groenwald, Soo-Jeong Lee, and Jim Taylor. Optometric consultation and field assistance was provided by Daniel Powell, Ohio State University College of Optometry. Optometric consultation was provided by Kelly Nichols, University of Houston, College of Optometry. Analytical support was provided by Jennifer Roberts of the Division of Applied Research and Technology, and Bureau Veritas. Health communication assistance was provided by Stefanie Evans. Editorial assistance was provided by Ellen Galloway. Desktop publishing was performed by Greg Hartle.
Copies of this report have been sent to employee and management representatives at this poultry processing facility, the government agency which submitted the technical assistance request, the Oklahoma state health department, and the Occupational Safety and Health Administration Regional Office. This report is not copyrighted and may be freely reproduced. The report may be viewed and printed at http://www.cdc.gov/niosh/hhe/. Copies may be purchased from the National Technical Information Service (NTIS) at 5825 Port Royal Road, Springfield, Virginia 22161.

Below is a recommended citation for this report:NIOSH [2012]. Health hazard evaluation report: evaluation of eye and respiratory symptoms at a poultry processing plant – Oklahoma. By Chen L, Eisenberg J, Durgam S, Mueller C. Cincinnati, OH: U.S. Department of Health and Human Services, Centers for Disease Control and Prevention, National Institute for Occupational Safety and Health, NIOSH HETA No. 2007-0284 & 2007-0317-3155.
To receive NIOSH documents or information about occupational safety and health topics, contact NIOSH at:1-800-CDC-INFO (1-800-232-4636)TTY: 1-888-232-6348E-mail: [email protected]
or visit the NIOSH web site at: www.cdc.gov/niosh.
For a monthly update on news at NIOSH, subscribe to NIOSH eNews by visiting www.cdc.gov/niosh/eNews.
Delivering on the Nation’s promise:Safety and health at work for all peoplethrough research and prevention.
National Institute for Occupational Safety and Health