hfa ii-i with guided progression analysis (gpa)atesveates.com/pdf/hfa_gpa_sample_cases.pdf ·...
TRANSCRIPT

HFA II-i with Guided Progression Analysis™ (GPA)
Sample Cases
Contents
Part I. Introduction
Part II. Understanding GPA Reports
Part III. GPA Sample Cases
Case 1 Slow progression
Case 2 Resetting the baseline
Case 3 Excluding a non-
representative exam
Case 4 Life expectancy
considerations
Case 5 Cataract patient
Case 6 Insufficient exams
2
3
5
5
6
7
8
9
10

Part I. Introduction
2
Now you can determine the stage of disease and the rate of progression, and
assess your patient’s risk of future vision loss—all at a glance. The Humphrey
Field Analyzer II-i with new Guided Progression Analysis™ (GPA) software
delivers current exam results, trends the entire visual field history and projects
future vision loss all on a single page. The new GPA Summary Report presentation
format is designed to simplify and streamline clinical interpretation.
VFI Plot — Regression analysis of VFI values and 3 to 5 year projection
VFI Bar — A graphical depiction of the pa-tient’s remaining useful vision at the current VFI value along with a 3-5 year projection of the VFI regression line if the current trend continues.
Baseline ExamsEstablishes initial visual
field status
VFI Rate of Progression Analysis
Trend analysis of patient’s overall visual field history
Current Visual Field Summary Complete report of current visual field including
VFI, the Glaucoma Change Probability Map (Progression Analysis Plot) and the GPA alert
GPA Alert — A message that indicates whether significant deterioration was noted in consecutive tests.
VFI Value — A summary measurement of the patient’s visual field status, epressed as a percent of a normal age-adjusted visual field.
VFI Value — A summary measurement of the patient’s visual field status, epressed as a percent of a normal age-adjusted visual field.
GPA Summary Report

3
GPA uses the Visual Field Index™ (VFI), a new summary measurement of
visual field status expressed as a percent of a normal age-adjusted visual field.
Pioneered by Boel Bengtsson, PhD1 as a more intuitive assessment of visual
function, VFI is optimized for progression analysis. VFI is center-weighted to
correlate with ganglion cell density and visual function. It is less affected by
cataract and other media changes compared with earlier indices. On the new
GPA Summary report, VFI is used to quantify rate of progression, where it is
plotted relative to patient age to calculate the rate of functional loss. This
brochure provides an overview of the new GPA Software for the HFA II-i and
some real life case examples showing how VFI is used in GPA.
Part II. Understanding the new GPA Summary Report
The new GPA Summary report is a powerful one-page report that provides an
overview of the patient’s entire visual field history. The report can be divided
into three sections: the Baseline Exams at the top, the visual field history and
trend in the middle, and the current exam at the bottom. Elements of each
section are described below.
GPA Baseline Exams
At the top of the report are the Baseline Exams. Graytone and Pattern Deviation
Plots are shown for both GPA Baselines, along with key indices such as VFI, MD,
and PSD. By default, the oldest two exams of the same type are automatically
selected as baseline. Then the initial selection of a SITA Standard or a SITA Fast
exam determines which exams will be included as follow-up exams. It is critical
that you ensure that tests included in the Baseline are representative of the
patient’s actual Baseline status. SITA Standard and SITA Fast exams cannot be
combined in the GPA analysis. Also, GPA supports Central 30-2 and 24-2 tests
in the same analysis, but when combined, GPA will analyze all tests as if they
were 24-2 tests. GPA does not support FastPac tests or Central 10-2 tests for
either Baseline or Follow-up.
VFI Plot
In the center of the report the VFI Plot graphs the VFI values of all exams
included in GPA analysis as a function of the patient’s age. The VFI Plot also
provides a linear regression analysis of the VFI over time when appropriate.
A minimum of 5 exams over 3 years or more must be included in GPA for the
linear regression results to be presented.
Note: The regression line slope may be positive due to statistical uncertainty or the Learning Effect.
VFI Bar
To the right of the VFI Plot is the VFI Bar, a histogram that indicates the patient’s
current VFI value. In addition, when the results of the regression analysis are
displayed, the VFI Bar will also graphically indicate the 3 to 5 year projection of
the linear regression line, shown as a broken line. The length of projection is equal
to the number of years of GPA data that is available, up to a maximum projection
time of 5 years.
1 A visual field index for calculation of glaucoma rate of progression. B Bengtsson and A Heijl Am J Ophthalmol, Feb 2008; 145(2): 343-53.
VFI PlotVFIVFI lPlotPlot
VFI BarVFI VFI BarBar
4
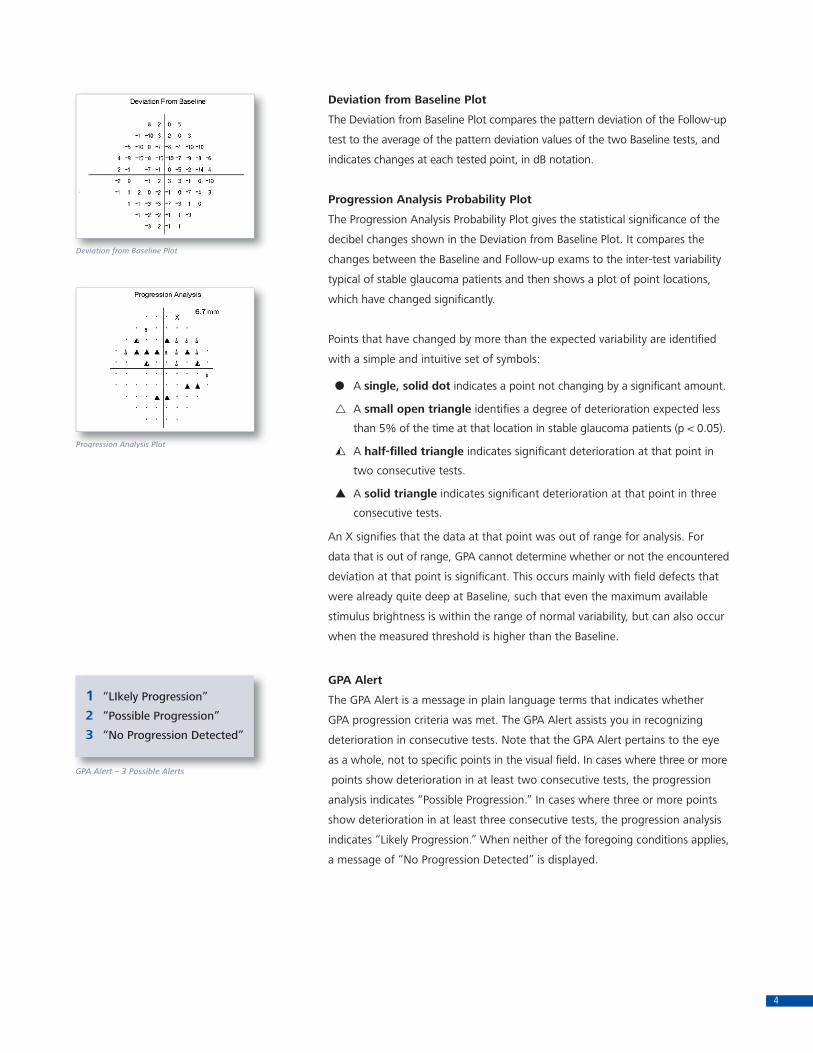
Deviation from Baseline Plot
The Deviation from Baseline Plot compares the pattern deviation of the Follow-up
test to the average of the pattern deviation values of the two Baseline tests, and
indicates changes at each tested point, in dB notation.
Progression Analysis Probability Plot
The Progression Analysis Probability Plot gives the statistical significance of the
decibel changes shown in the Deviation from Baseline Plot. It compares the
changes between the Baseline and Follow-up exams to the inter-test variability
typical of stable glaucoma patients and then shows a plot of point locations,
which have changed significantly.
Points that have changed by more than the expected variability are identified
with a simple and intuitive set of symbols:
● A single, solid dot indicates a point not changing by a significant amount.
r A small open triangle identifies a degree of deterioration expected less
than 5% of the time at that location in stable glaucoma patients (p < 0.05).
r A half-filled triangle indicates significant deterioration at that point in
two consecutive tests.
p A solid triangle indicates significant deterioration at that point in three
consecutive tests.
An X signifies that the data at that point was out of range for analysis. For
data that is out of range, GPA cannot determine whether or not the encountered
deviation at that point is significant. This occurs mainly with field defects that
were already quite deep at Baseline, such that even the maximum available
stimulus brightness is within the range of normal variability, but can also occur
when the measured threshold is higher than the Baseline.
GPA Alert
The GPA Alert is a message in plain language terms that indicates whether
GPA progression criteria was met. The GPA Alert assists you in recognizing
deterioration in consecutive tests. Note that the GPA Alert pertains to the eye
as a whole, not to specific points in the visual field. In cases where three or more
points show deterioration in at least two consecutive tests, the progression
analysis indicates “Possible Progression.” In cases where three or more points
show deterioration in at least three consecutive tests, the progression analysis
indicates “Likely Progression.” When neither of the foregoing conditions applies,
a message of “No Progression Detected” is displayed.
Deviation from Baseline PlotDeviDeviatioatio fn frn from Bom B laselaselineine lPlotPlot
GPA Alert – 3 Possible AlertsGPAGPA AlAlertert –– 3 P3 Possossiblible Ae Alerlertsts
1 “LIkely Progression”
2 “Possible Progression”
3 “No Progression Detected”
Progression Analysis PlotProgProgressressiionion lAnalAnal iysisysis lPlo Plottr
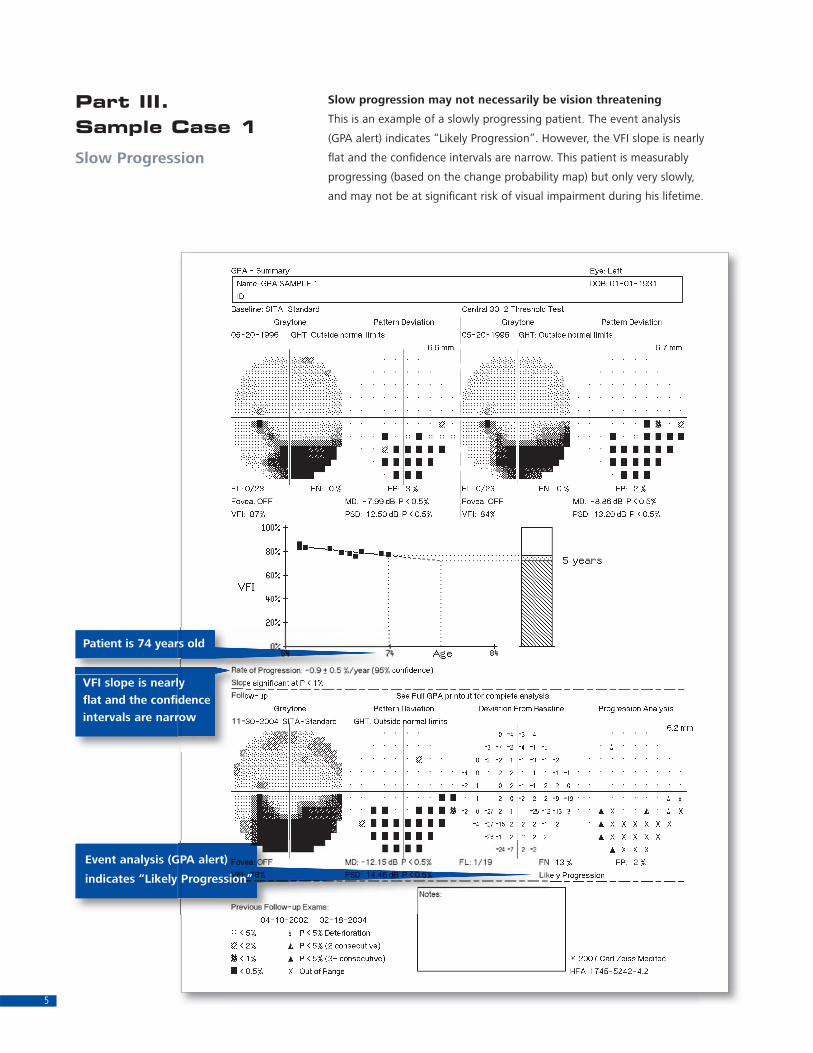
Part III. Sample Case 1
Slow Progression
Slow progression may not necessarily be vision threatening
This is an example of a slowly progressing patient. The event analysis
(GPA alert) indicates “Likely Progression”. However, the VFI slope is nearly
flat and the confidence intervals are narrow. This patient is measurably
progressing (based on the change probability map) but only very slowly,
and may not be at significant risk of visual impairment during his lifetime.
5
Patient is 74 years old
Event analysis (GPA alert)
indicates “Likely Progression”
VFI slope is nearly
flat and the confidence
intervals are narrow
6
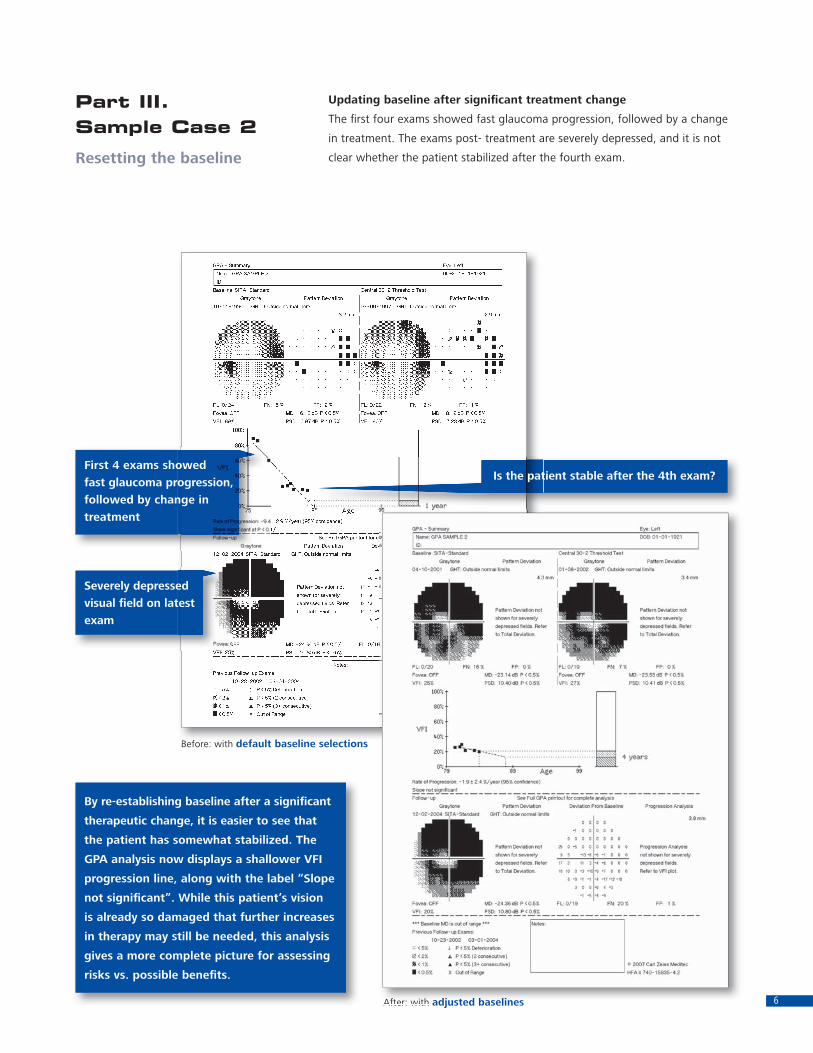
Updating baseline after significant treatment change
The first four exams showed fast glaucoma progression, followed by a change
in treatment. The exams post- treatment are severely depressed, and it is not
clear whether the patient stabilized after the fourth exam.
Before: with default baseline selections
After: with adjusted baselines
Part III. Sample Case 2
Resetting the baseline
Before: with default baseline selections
After: with adjusted baselines
Severely depressed
visual field on latest
exam
First 4 exams showed
fast glaucoma progression,
followed by change in
treatment
Is the patient stable after the 4th exam?
By re-establishing baseline after a significant
therapeutic change, it is easier to see that
the patient has somewhat stabilized. The
GPA analysis now displays a shallower VFI
progression line, along with the label “Slope
not significant”. While this patient’s vision
is already so damaged that further increases
in therapy may still be needed, this analysis
gives a more complete picture for assessing
risks vs. possible benefits.
Excluding non-representative exams
Notice that the third exam on this report has a markedly worse VFI. In this
case the patient probably was just having a bad day, because the next visit
shows a much improved field, more like the first and second exams. It is
important in a case like this to deselect that particular exam and not use it
in the GPA.
Before: with poor exam included
After: with poor exam excluded7
Part III. Sample Case 3
Excluding a non- representative exam
Before: Before: with poor exam includedwith poor exam included
Notice that the VFI regression line in the “After”
example with the poor exam deselected is a
much more typical looking regression line than
in the “Before” example
The third exam on this
report has a markedly
worse VFI

8
Part III. Sample Case 4
Life expectancy can be an important consideration
A progression rate that might be acceptable at age 85 may not be
acceptable at age 65.
Life expectancy considerations
Age at most
recent exam is 65
Event analysis (GPA alert)
indicates “Likely Progression”
VFI progression is
-3.0 ± 0.9 per year
VFI reduces the effect of cataract
This is an example of an eye with concomitant glaucoma and cataract
where the MD values reflect much more loss than the VFI. The time of
cataract surgery is marked by the red arrow in both graphs.
MD follow-up (dB/year)
VFI follow-up from same patient9
Part III. Sample Case 5
Cataract Patient
After surgery, MD
levels approach
those seen in the
baseline exams
MD follow up (dB/year)MD follow-up (dB/year)
Here is the same series of fields
with new Guided Progression
Analysis. As opposed to MD, VFI
is hardly influenced by cataract
and the true rate of progression
is almost zero
Cataract Surgery
Cataract Surgery
10
Part III. Sample Case 6
A patient with only 1 exam
When there are insufficient exams to perform a GPA analysis, the new
default report is the Single Field Analysis (SFA) report. Single page analysis
remains the standard until follow-up is established.Insufficient exams
VFI is calculated along
with MD and PSD for
each reliable exam

©20
08 C
arl Z
eiss
Med
itec,
Inc.
All
right
s re
serv
ed. S
peci
ficat
ions
sub
ject
to c
hang
e. P
rinte
d in
USA
. 030
8 .3
M
Phone: +1 925 557 4100
Toll free: 1 800 342 9821
Fax: +1 925 557 4101
www.meditec.zeiss.com/us
Carl Zeiss Meditec, Inc.
5160 Hacienda Drive
Dublin, CA 94568
USA
Carl Zeiss Meditec AG
Goeschwitzer Str. 51-52
07745 Jena
Germany
Phone: +49 36 41 22 03 33
Fax: +49 36 41 22 02 82
www.meditec.zeiss.com