here’s your sample issue
TRANSCRIPT
Here’s YourSample Issueof the Investor Advisory Service Newsletter
1.877.334.2582 InvestorAdvisoryService.com
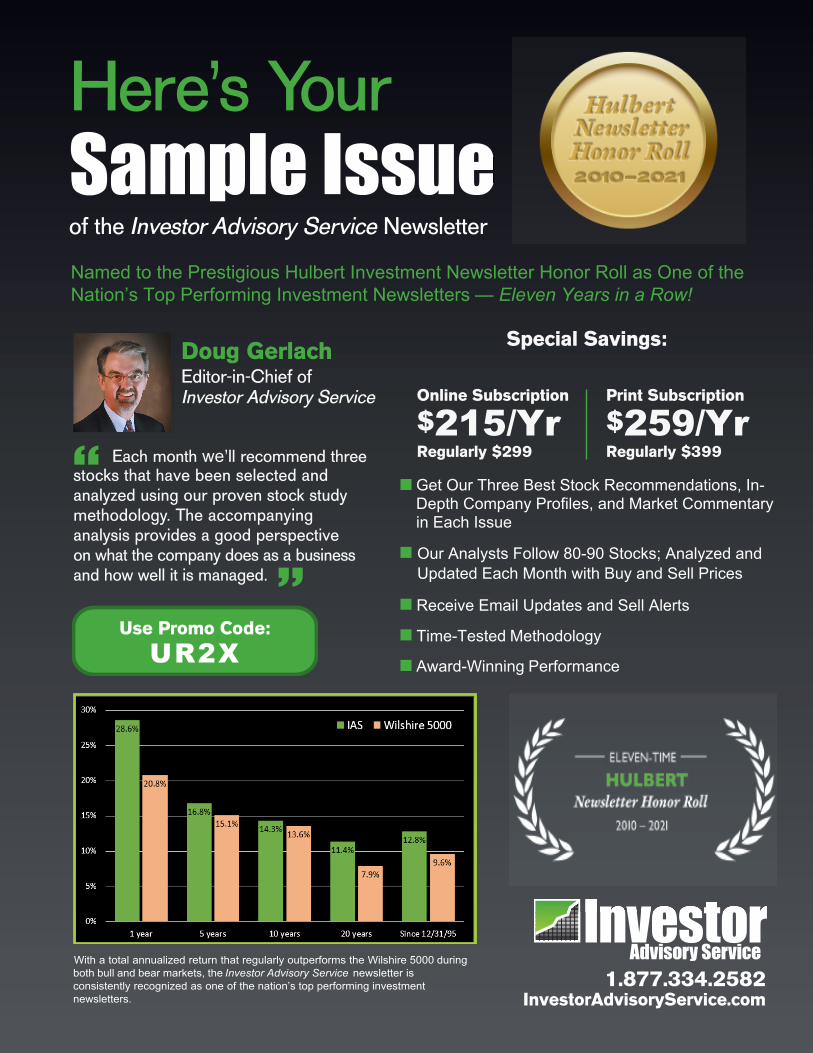
With a total annualized return that regularly outperforms the Wilshire 5000 during both bull and bear markets, the Investor Advisory Service newsletter is consistently recognized as one of the nation’s top performing investment newsletters.
Named to the Prestigious Hulbert Investment Newsletter Honor Roll as One of the Nation’s Top Performing Investment Newsletters — Eleven Years in a Row!
Online Subscription
$215/YrRegularly $299
Print Subscription
$259/YrRegularly $399
� Get Our Three Best Stock Recommendations, In-Depth Company Profiles, and Market Commentaryin Each Issue
� Our Analysts Follow 80-90 Stocks; Analyzed and Updated Each Month with Buy and Sell Prices
� Receive Email Updates and Sell Alerts
� Time-Tested Methodology
� Award-Winning Performance
Special Savings:
“
Doug Gerlach Editor-in-Chief of Investor Advisory Service
Each month we’ll recommend threestocks that have been selected and analyzed using our proven stock studymethodology. The accompanying analysis provides a good perspective on what the company does as a businessand how well it is managed.
“
Use Promo Code:
UR2X

November 2020
CACI International Inc. (CACI) ►New to Service Comcast Corporation (CMCSA) Douglas Dynamics, Inc. (PLOW) ►New to Service
INVESTMENT COMMENTS
We have a long way to go, but so far the post-COVID economy looks surprisingly robust. If colder weather does not bring a resurgence of the virus, then it feels safe to say that we are firmly on the road to economic recovery.
From peak to trough, U.S. GDP contracted by 10%, the third largest decline since at least 1910. The second-quarter average was -9%. More recently, September’s unemployment report published by the Bureau of Labor Sta-tistics measured unemployment at 7.9%, down from a peak of 14.7% in April. This prob-ably overstates the rebound slightly, as the la-bor force participation rate ticked down to 61.4% and is about 2% below its pre-pan-demic levels. Some workers have stayed on the sidelines and aren’t counted as unem-ployed.
Interest rates are pinned at zero. The Federal Reserve publishes its board members’ expec-tations for future rates, and short-term rates are expected to remain near zero for at least three more years. This partly reflects the Fed’s obsession with fighting deflation at all costs while preserving ample amounts of banking system liquidity. It also reflects the economic reality that recovering to previous levels of peak activity will probably take years. Don’t hold your breath waiting for your sav-ings account to pay interest again.
The Fed is determined not to tighten too quickly under any circumstances. In late Au-gust, Jerome Powell announced a new policy targeting average inflation of 2%, as opposed
to targeting current inflation of 2%. The differ-ence is that the Fed plans to allow for catch-up inflation after periods of below-target infla-tion. The 2% inflation target, while widely rec-ognized, is really a made-up number to begin with. The Fed’s original mission of full em-ployment and price stability implies that, if an-ything, it should aim for zero inflation, but monetary economists have gradually estab-lished a consensus opinion that 2% is just high enough to spur economic activity without unacceptably damaging the currency. By changing its 2% target to an average instead of a constant, the Fed pushes a little further out on the inflation limb. We note somewhat cynically that a wider variety of more inflation-ary interventions can be excused under a “2% average” policy than a “2% constant” policy.
This all sounds quite bearish for paper money, but currency markets do not seem bothered. In the wake of these two Fed an-nouncements, the U.S. dollar briefly rallied, and gold fell, before both eased back closer to their recent averages. The market basically shrugged, and perhaps the best explanation why is that the Fed is simply articulating what everybody knows. Measured consumer price inflation is currently too low to justify higher interest rates, and higher inflation would prob-ably be positive for the economy overall, at least to a point. We may be sowing the seeds of very high inflation long term, but we don’t live in the long term. For now, consumer prices are mostly controlled.
Asset price inflation is another story, with the

Page 2 November 2020
S&P 500 up 6% through September and bonds also higher in 2020 due to falling inter-est rates. Gold has been quiet in recent months but remains up 27% on the year. Among major asset classes, only commercial real estate is struggling, with the real estate investment trust (REIT) sector down 12% through September.
Zooming in on U.S. equities, the two hottest sectors in 2020 are Consumer Cyclical and Technology, both up 33% through early Octo-ber according to FinViz. The weakest are Fi-nancial stocks, down 15%, and Energy, down an eye-watering 47%. One has to wonder whether investors may be projecting the cur-rent state of affairs forward too far? We are not going to sit home on our computers spending stimulus checks forever. Eventually people will get out and travel by car, and even plane, again. Even the poor, beleaguered banking sector must eventually improve once the yield curve returns to a more normal shape.
Across sectors, growth has trounced value, with J.P. Morgan measuring growth’s outper-formance at 25% in small stocks, 27% in mid-cap stocks, and 36% for large stocks. This makes some sense, as the pandemic has ac-celerated trends that growth stocks benefit from. If value pays you now, and growth pays you later, then pulling the future forward fa-vors growth under “discounted cash flow” val-uation models. As with the sector perfor-mance extremes noted above, however, the huge magnitude of growth’s outperformance feels overdone.
And within the hottest sectors, the hottest stocks seem to be gobbling up more than their natural share of investor dollars. JP Morgan’s Guide to the Financial Markets from Septem-ber 30 notes that the five largest S&P 500 stocks by market capitalization—namely Ap-ple, Amazon, Microsoft, Alphabet, and Face-book—currently comprise 23% of the overall index value. The previous peak came in 2000 at 18%.
Lawmakers are noticing. Multiple news sources have stated that various government agencies will soon file complaints against Ap-ple, Alphabet, Amazon, and Facebook. The
timing here just before the November election is no coincidence, as both parties are con-cerned about big tech’s influence on voters. Challenging their competitive practices could help crimp them at this sensitive time.
Which brings us, finally, to the election itself. Betting markets currently give Donald Trump approximately a 33% chance of retaining his office, down from 50% in March. Polling data implies that Trump is way behind at the mo-ment, but the betting markets seem to imply that a late surge is possible. The Senate is considered more of a tossup. If Joe Biden wins along with the Senate tipping into Dem-ocrat control, then the market will probably anticipate a combination of higher taxes and more rapid fiscal stimulus. It is a little early to speculate about the potential market impact of policy changes following a future election. We note there is a possibility that a mail-in voting surge overwhelms clerks’ ability to count votes and delays election results. This frustrating and divisive possibility sounds a lit-tle unlikely, but the way 2020 has gone, we really should expect the unexpected.
Investment advice and education since 1973, helping
you become a successful lifetime investor. Published by ICLUBcentral Inc.
711 W. 13 Mile Rd., Madison Heights, MI 48071 1-248-654-3100 1-877-33-ICLUB
www.InvestorAdvisoryService.com Facebook: InvestorAdvisoryService
Twitter: @InvestWithIAS EDITOR-IN-CHIEF ...................................... Douglas Gerlach
Investment Analysis Provided by PROVIDENT INVESTMENT MANAGEMENT
PRESIDENT .......................................... Scott Horsburgh, CFA VICE-PRESIDENT ......................................... Dan Boyle, CFA PORTFOLIO MANAGER .......................... Miles Putnam, CFA RESEARCH ANALYST ............................James Skubik, CFA
Customer Service: For questions about your subscription, please contact us at www.InvestorAdvisoryService.com or by phone at 1-877-33-ICLUB. Information presented herein has been obtained from sources believed to be reliable, but the ac-curacy and completeness of summaries, conclusions, and opinions based on this information are not guaranteed. It should never be assumed that recommendations will be prof-itable or will equal the past performance of listed or recom-mended securities.

Page 3 November 2020
Key Market Indicators (through October 14, 2020)
NEWS OF COMPANIES
BlackRock had a solid second quarter, but a range of infrequent items made earnings appear more favorable than they really were. Revenue increased 18%, but even this was impacted by significant perfor-mance-based fees that produced almost two-thirds of that growth. Performance fee income also resulted in performance bonus expense to employees, so we can’t just re-duce earnings by the amount of those fees. There were also expenses related to a new product launch and lower revenue from se-curities lending. EPS gained 24%. The strong structure BlackRock has put in place over the years fosters one of the few things under its control—new asset flow grew at a 7% annualized rate in the quarter and was strong across the board. This is the underpinning of its long-term earnings growth.
BLK (639.85) is a buy up to 565.
CarMax’s Q2 results demonstrated sub-stantial recovery versus last quarter with strength across all aspects of its business.
However, the results failed to meet high ex-pectations and sent shares lower by 11%. Overall sales grew 3%, with used unit sales in comparable stores increasing just over 1% despite continued occupancy re-strictions in approximately half its stores. Positive used unit comparable sales con-tinued into Q3. Saleable inventory was be-low targeted levels during the quarter, serving as a headwind to results. Lower-than-targeted levels of inventory continued through quarter end, but as of the earnings release date inventory was again in a good position. Used vehicle gross profit per ve-hicle increased slightly despite an approxi-mate 3% decline in average used vehicle selling prices. Wholesale unit sales grew over 5% helped by a higher buy rate, partly offset by lower appraisal traffic. Wholesale gross profit per unit increased, aided by ro-bust market appreciation. CarMax Auto Fi-nance income grew 29% due to a reduction in the provision for loan losses, an increase in net margin due to lower funding costs, and growth in managed receivables. EPS of $1.79 was up nearly 28%.
1000
1500
2000
2500
3000
3500
1/10 1/12 1/14 1/16 1/18 1/20
Standard & Poor's 500
1.0
2.0
3.0
4.0
5.0
12/09 12/11 12/13 12/15 12/17 12/19
Yield on Long-term Treasuries
0.0
0.5
1.0
1.5
2.0
2.5
1/10 1/12 1/14 1/16 1/18 1/20
Yield on 91-Day Treasury Bills

Page 4 November 2020
The company announced the completion of its rollout of nationwide online car buying. Management continues to emphasize the omni-channel experience CarMax offers. The company plans to increase its market-ing spend in the back half of the year to help drive more customers to its digital properties. This is in direct response to online-only competitors, like Carvana, which are growing rapidly. The advertising will highlight the advantages of CarMax’s omni-channel model versus online-only and physical-only competitors. (► Alert emailed to subscribers on September 25, 2020.)
KMX (91.57) is a buy up to 87.
FactSet’s fourth fiscal quarter results were initially received with enthusiasm by the market. Revenue grew 5%, about double the previous quarter’s pace, but fairly con-sistent with the past year or so. EPS gained 16%; pretax profit growth of 4% was among the slowest quarters of the past three years, but its tax rate was 6% compared to 15.5% in last year’s fourth quarter. Cost savings from reduced travel spending largely offset the drag from FactSet’s on-going three-year investment program. Or-ganic growth in Annual Subscription Value plus services was 5.3% in the quarter and fiscal year. This growth rate is expected to be slightly lower next year. The company guides to adjusted EPS down 1% to up 3% in Fiscal 2021, although its guidance tends to be slightly conservative.
FDS (335.24) is a buy up to 250.
Fastenal continues to enjoy a tailwind from sales of pandemic-related safety products, helping offset softer demand in its tradi-tional markets. Sales grew more than 2% with daily sales increasing 2.7%. Safety product sales grew 34% and represented nearly 25% of total sales. Fasteners, which accounted for 30% of sales, were down 7% reflecting softness in manufacturing and construction markets. Management noted a gradual sequential improvement in busi-ness activity each month of the quarter. Gross margin improved sequentially but declined versus a year ago as a result of
increased sales of safety products, which generally possess lower margins. Excellent operating expense control led to a year-over-year increase in operating margin with EPS of $0.38, up over 3%.
Q3 signing activity for onsite locations and vending machines remained below pre-pandemic levels but improved through the quarter. The company signed 62 new on-site customers as total onsite locations in-creased nearly 15% versus a year ago. Fastenal also signed 4,680 vending de-vices with an installed base that increased nearly 7%. Though the company had previ-ously pulled its guidance for vending and onsite signings this year, commentary was generally upbeat about the continued op-portunity from these growth drivers.
FAST (44.95) is a buy up to 30.
Nike’s fiscal Q1 results easily exceeded expectations. Revenue declined 1%, as strong digital traffic helped offset lower foot traffic at retail stores globally. Digital sales in the quarter grew 82%, as Nike is now achieving its goal for 30% of sales to come from digital nearly three years ahead of schedule. Nike expects 50% digital pene-tration in the foreseeable future and contin-ues to invest to support its digital growth. Gross margin was significantly better than last quarter as higher promotions to reduce excess inventory were offset by the rever-sal of accruals associated with purchase order cancellations due to a stronger-than anticipated rebound in demand. Inventory at quarter end was up 15% versus a year ago but is on track to normalize by the end of fiscal Q2. EPS grew 10% to $0.95.
Nike has worked to restructure its opera-tions, incurring costs of $200-$250 million in the first half of the year. Despite the un-certain environment, management expects full year revenue will increase high-single to low-double digits led by continued strong digital performance. This guidance repre-sented an increase from prior expectations for “flat to up” full year revenue. Fiscal Q2 revenue is expected to be approximately flat, held back by supply limitations. Full year gross margin is expected to be flat

Page 5 November 2020
with SG&A dollars also flat including the re-structuring costs.
NKE (127.66) is a buy up to 68.
Synnex is recovering nicely from COVID-19 business disruption. For the third quar-ter ended August 31st, sales grew 4%, 5% in constant currency. The Technology Ser-vices (TS) segment grew 5%, with strength from hardware offerings that support re-mote computing offset by some weakness from larger customers delaying office buys. Concentrix, its Business Process Out-sourcing (BPO) segment, saw revenue flat, as weakness from travel, transportation, and tourism was offset by strong growth from technology, healthcare, financial ser-vices, and e-commerce. EPS grew 8%, to $2.60, as excellent operating leverage, particularly from Concentrix, was offset by COVID-19 expenses.
Fiscal fourth quarter guidance anticipates sales of $6.45-$6.65 billion, a drop of 2% to growth of 1%, and EPS of $2.95-$3.20, down 13% to up 7%. Both segments of the business continue to be negatively im-pacted by COVID-19, with TS suffering from supply chain disruptions that delay hardware sales and Concentrix incurring inefficiencies as employees continue to provide services remotely.
Synnex is confident it will complete its spinoff of Concentrix as a stand-alone pub-lic company, targeting December 1st to co-incide with the ending of fiscal year 2020. Stockholders will receive one Concentrix share for each Synnex share. Manage-ment anticipates capitalizing Concentrix with minimal cash and debt of $1.1 billion, less than a 2.0x Debt/EBITDA multiple. This should provide both companies with sufficient capacity to invest in organic growth and acquisition opportunities.
SNX (145.14) is a buy up to 147.
UnitedHealth is winning market share in public healthcare plans, especially Medi-
care Advantage, while continuing to grow its private business through price in-creases. Third quarter revenue of $65.1 bil-lion represented 8% growth. Total plan rev-enue increased 5%. Optum, which includes prescription management and healthcare delivery, grew 21%.
After falling by as much as one-third in the second quarter, total customer healthcare visits rebounded to 95% of their normal seasonal pattern in the third quarter. De-spite delivering a modestly lower volume of care overall, operating costs increased 9%, driven by consumer support measures and COVID-related direct medical costs. EPS of $3.30 declined 10%. The company raised its full-year expectation for adjusted EPS by 5% at the midpoint, expecting ad-justed earnings growth of 9% to 11%.
UNH (321.99) is a buy up to 324.
* * * * * “Est. EPS” on the ranking tables found be-fore this month’s company write-ups were updated to reflect estimated earnings for the twelve months ending 12/31/2021. Other individual adjustments are made when circumstances deem it necessary. Any of these changes can affect the buy and sell prices. We typically forecast ap-proximately twelve months into the future. However, the depth of the sudden eco-nomic crisis made 2020 earnings estimates unreliable, leaving them as an inappropri-ate springboard for growth projections. In-stead of beginning with EPS approximately one year into the future (calendar 2020) and projecting four more years of growth at the long-term growth rate, we begin ap-proximately two years out (calendar 2021) and project three more years at the long-term growth rate. Earnings should acceler-ate after a down year like 2020, and we felt that beginning with 2021 estimates would be the best way to smooth out that down-and-up effect.
Page 6 November 2020
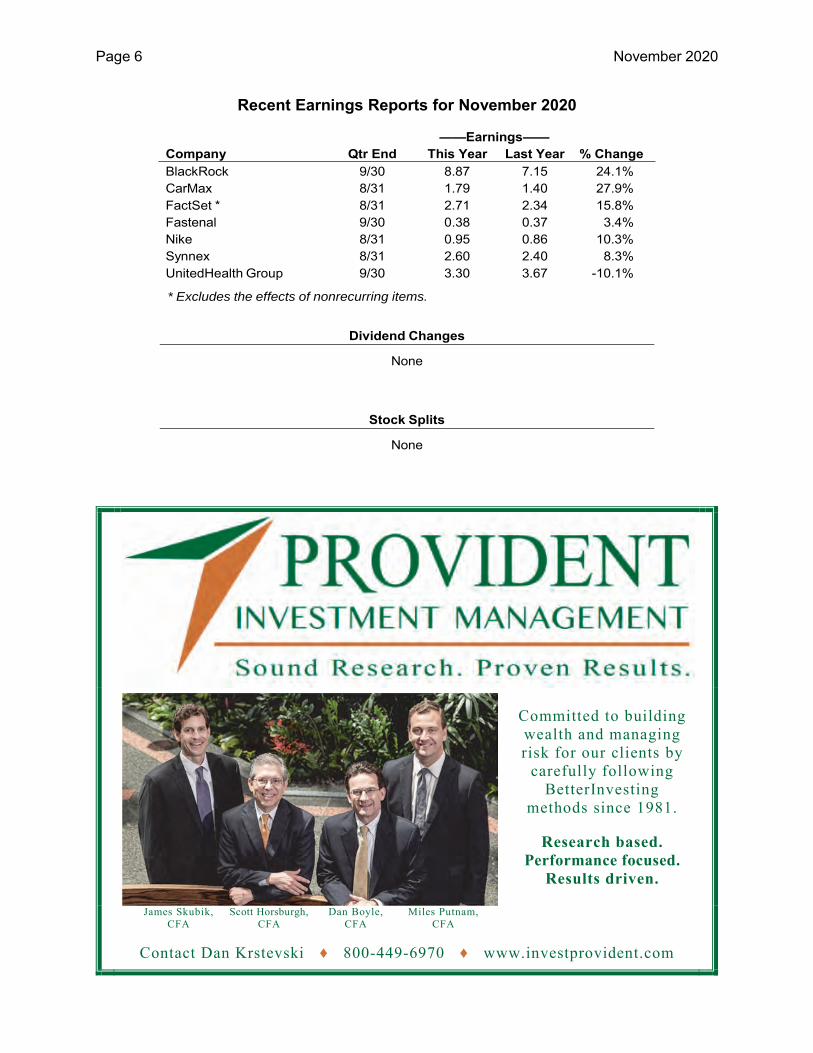
Recent Earnings Reports for November 2020
——Earnings—— Company Qtr End This Year Last Year % Change BlackRock 9/30 8.87 7.15 24.1% CarMax 8/31 1.79 1.40 27.9% FactSet * 8/31 2.71 2.34 15.8% Fastenal 9/30 0.38 0.37 3.4% Nike 8/31 0.95 0.86 10.3% Synnex 8/31 2.60 2.40 8.3% UnitedHealth Group 9/30 3.30 3.67 -10.1%
* Excludes the effects of nonrecurring items.
Dividend Changes
None
Stock Splits
None
Committed to building wealth and managing risk for our clients by
carefully following BetterInvesting
methods since 1981.
Research based. Performance focused.
Results driven.
James Skubik, CFA
Scott Horsburgh, CFA
Dan Boyle, CFA
Miles Putnam, CFA
Contact Dan Krstevski ♦ 800-449-6970 ♦ www.investprovident.com

Q
U Est EPS B Over- US/ P/E
A % thru Tot % Curr Buy U valued DS as % Mkt Date
L Sym Company Name Price Div Yld 12/31/21 Ret Grth P/E RV Up to Y At Ratio Grth Cap Rec
1 AAPL Apple 121.19 3.28 2.7% 4.06 -0.5 10% 29.9 209% 58.00 121.00 1.0 299% L 9/151 ABT Abbott Labs 107.75 1.44 1.3% 2.72 4.9 12% 39.6 158% 66.00 82.00 0.1 330% L 8/171 ADP ADP 148.51 3.64 2.5% 5.53 12.5 8% 26.8 99% 133.00 176.00 1.6 335% L 8/093 AKAM Akami Technologies 113.33 0.00 0.0% 3.79 13.0 12% 29.9 98% 115.00 B 139.00 3.3 249% M 7/204 AL Air Lease Corp. 29.50 0.60 2.0% 5.15 32.6 16% 5.7 58% 39.00 B 62.00 7.0 36% M 10/20
2 ALGN Align Technology 333.10 0.00 0.0% 7.54 6.7 15% 44.2 158% 187.00 264.00 0.3 295% L 05/203 ALGT Allegiant Travel 128.97 0.00 0.0% 8.88 12.3 12% 14.5 104% 119.00 148.00 2.0 121% M 12/192 AME Ametek 107.90 0.72 0.7% 3.70 5.4 13% 29.1 143% 61.00 83.00 0.2 224% M 3/172 ANET Arista Networks 228.07 0.00 0.0% 8.45 14.2 15% 27.0 112% 204.00 283.00 3.3 180% L 7/192 ANSS Ansys 351.40 0.00 0.0% 6.91 1.3 12% 50.9 179% 194.00 241.00 -0.1 424% M 7/14
3 ATH Athene Holding Ltd. 35.70 0.00 0.0% 7.01 24.3 12% 5.1 59% 42.00 B 67.00 5.5 43% M 11/193 AZPN Aspen Technology 133.08 0.00 0.0% 4.53 13.7 12% 29.4 104% 115.00 160.00 1.7 245% M 3/164 BEAT BioTelemetry, Inc. 44.56 0.00 0.0% 2.12 24.7 16% 21.0 76% 46.00 B 75.00 3.2 131% M 10/202 BKNG Booking Holdings 1732.60 0.00 0.0% 71.06 15.2 12% 24.4 92% 1781.00 B 2232.00 3.5 203% L 12/191 BLK BlackRock 639.85 14.52 2.3% 32.10 11.1 10% 19.9 113% 565.00 700.00 1.9 199% L 10/19
3 BOOT Boot Barn Holdings 32.82 0.00 0.0% 1.73 19.0 16% 19.0 66% 24.00 43.00 1.5 119% S 10/193 CACI CACI International 217.19 0.00 0.0% 15.44 16.2 11% 14.1 88% 220.00 B 303.00 3.2 128% M 11/202 CAKE Cheesecake Factory 30.13 1.44 4.8% 1.79 16.5 10% 16.8 96% 30.00 36.00 2.9 168% M 1/203 CASH Meta Financial Group 21.99 0.20 0.9% 2.93 31.6 12% 7.5 50% 26.00 B 53.00 4.4 63% S 3/202 CBOE Cboe Global Mkts. 84.50 1.68 2.0% 4.15 18.6 10% 20.4 77% 95.00 B 125.00 6.5 204% M 8/20
3 CCI Crown Castle Int'l. 165.00 4.80 2.9% 6.71 5.0 7% 24.6 136% 113.00 140.00 0.1 351% L 12/163 CENTA Central Garden & Pet 38.32 0.00 0.0% 1.88 9.2 8% 20.4 111% 30.00 44.00 1.0 255% S 3/203 CGNX Cognex 67.36 0.22 0.3% 1.08 2.7 15% 62.2 187% 31.00 50.00 0.0 415% S 6/112 CMCSA Comcast 45.28 0.92 2.0% 2.85 15.4 12% 15.9 96% 51.00 B 56.00 3.5 133% L 11/202 CMI Cummins 221.77 5.24 2.4% 12.02 7.3 10% 18.5 145% 138.00 192.00 0.3 185% L 9/18
2 CPRT Copart 115.80 0.00 0.0% 3.01 1.9 15% 38.5 186% 62.00 81.00 -0.1 257% M 11/162 DG Dollar General 220.15 1.44 0.7% 9.76 7.4 10% 22.6 126% 118.00 208.00 0.4 226% M 6/182 DHI D.R. Horton, Inc. 78.28 0.70 0.9% 6.72 15.1 12% 11.6 97% 62.00 97.00 1.4 97% L 6/202 DIS Walt Disney 126.58 1.76 1.4% 5.58 9.8 12% 22.7 123% 103.00 135.00 1.7 189% L 7/183 DORM Dorman Products 91.17 0.00 0.0% 3.27 6.7 12% 27.9 140% 65.00 81.00 0.5 233% S 8/18
3 ENSG Ensign Group 59.82 0.20 0.3% 3.30 18.9 11% 18.1 80% 50.00 92.00 1.9 165% S 8/203 EPAM EPAM Systems 346.89 0.00 0.0% 6.33 3.6 17% 54.8 179% 189.00 244.00 0.0 322% M 9/163 ESNT Essent Group Ltd. 42.33 0.64 1.5% 4.78 14.1 12% 8.9 107% 39.00 49.00 2.1 74% M 7/202 ESS Essex Property Trust 206.89 8.31 4.0% 13.05 15.7 6% 15.9 81% 216.00 B 284.00 4.2 265% L 9/203 EWBC East West Bancorp 36.10 1.10 3.0% 3.74 22.3 10% 9.6 73% 41.00 B 60.00 6.0 96% M 11/18
1 FAST Fastenal 44.95 1.00 2.2% 1.56 11.0 12% 28.7 120% 30.00 44.00 0.7 239% L 6/181 FB Facebook, Inc. 271.82 0.00 0.0% 10.10 18.4 17% 26.9 99% 263.00 356.00 2.7 158% L 1/202 FDS FactSet Research 335.24 3.08 0.9% 10.25 4.3 6% 32.7 128% 250.00 314.00 0.3 545% M 11/163 FFIV F5 Networks 129.11 0.00 0.0% 6.13 12.2 10% 21.1 98% 132.00 B 159.00 3.9 211% M 3/153 FIVE Five Below, Inc. 136.09 0.00 0.0% 3.82 22.1 22% 35.6 104% 131.00 190.00 2.8 162% M 9/20
2 FLT FleetCor Technologies 250.19 0.00 0.0% 10.40 17.7 15% 24.1 93% 249.00 330.00 3.0 161% L 6/203 FND Floor & Décor Holdings 83.80 0.00 0.0% 1.54 0.6 17% 54.4 218% 34.00 47.00 -0.2 320% S 1/193 FOXF Fox Factory Holding 87.34 0.00 0.0% 2.92 6.1 13% 29.9 142% 40.00 72.00 0.2 230% S 8/162 FRC First Republic Bank 121.14 0.80 0.7% 5.73 12.1 12% 21.1 107% 113.00 141.00 2.6 176% M 6/182 GILD Gilead Sciences 64.05 2.72 4.2% 6.97 17.9 11% 9.2 93% 71.00 B 84.00 7.5 84% L 6/20
Symbol Sort
October 14, 2020
Recommended companies are highlighted
Q
U Est EPS B Over- US/ P/E
A % thru Tot % Curr Buy U valued DS as % Mkt Date
L Sym Company Name Price Div Yld 12/31/21 Ret Grth P/E RV Up to Y At Ratio Grth Cap Rec
Symbol Sort
October 14, 2020
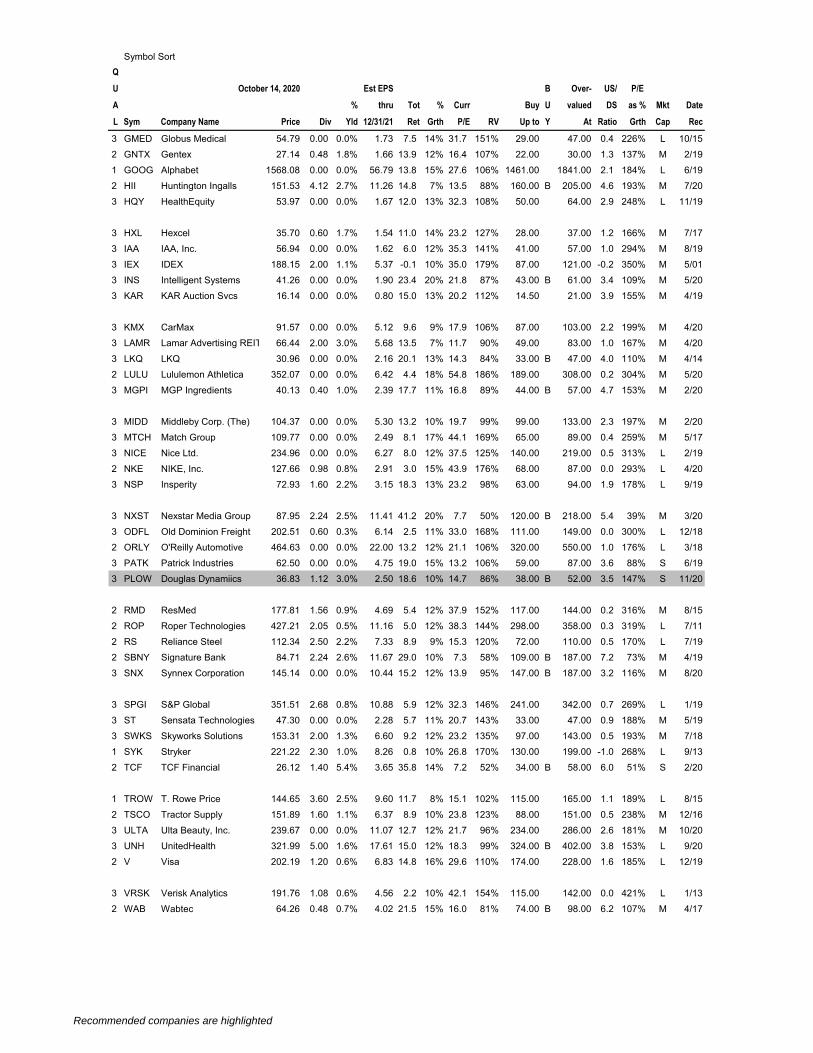
3 GMED Globus Medical 54.79 0.00 0.0% 1.73 7.5 14% 31.7 151% 29.00 47.00 0.4 226% L 10/152 GNTX Gentex 27.14 0.48 1.8% 1.66 13.9 12% 16.4 107% 22.00 30.00 1.3 137% M 2/191 GOOG Alphabet 1568.08 0.00 0.0% 56.79 13.8 15% 27.6 106% 1461.00 1841.00 2.1 184% L 6/192 HII Huntington Ingalls 151.53 4.12 2.7% 11.26 14.8 7% 13.5 88% 160.00 B 205.00 4.6 193% M 7/203 HQY HealthEquity 53.97 0.00 0.0% 1.67 12.0 13% 32.3 108% 50.00 64.00 2.9 248% L 11/19
3 HXL Hexcel 35.70 0.60 1.7% 1.54 11.0 14% 23.2 127% 28.00 37.00 1.2 166% M 7/173 IAA IAA, Inc. 56.94 0.00 0.0% 1.62 6.0 12% 35.3 141% 41.00 57.00 1.0 294% M 8/193 IEX IDEX 188.15 2.00 1.1% 5.37 -0.1 10% 35.0 179% 87.00 121.00 -0.2 350% M 5/013 INS Intelligent Systems 41.26 0.00 0.0% 1.90 23.4 20% 21.8 87% 43.00 B 61.00 3.4 109% M 5/203 KAR KAR Auction Svcs 16.14 0.00 0.0% 0.80 15.0 13% 20.2 112% 14.50 21.00 3.9 155% M 4/19
3 KMX CarMax 91.57 0.00 0.0% 5.12 9.6 9% 17.9 106% 87.00 103.00 2.2 199% M 4/203 LAMR Lamar Advertising REIT 66.44 2.00 3.0% 5.68 13.5 7% 11.7 90% 49.00 83.00 1.0 167% M 4/203 LKQ LKQ 30.96 0.00 0.0% 2.16 20.1 13% 14.3 84% 33.00 B 47.00 4.0 110% M 4/142 LULU Lululemon Athletica 352.07 0.00 0.0% 6.42 4.4 18% 54.8 186% 189.00 308.00 0.2 304% M 5/203 MGPI MGP Ingredients 40.13 0.40 1.0% 2.39 17.7 11% 16.8 89% 44.00 B 57.00 4.7 153% M 2/20
3 MIDD Middleby Corp. (The) 104.37 0.00 0.0% 5.30 13.2 10% 19.7 99% 99.00 133.00 2.3 197% M 2/203 MTCH Match Group 109.77 0.00 0.0% 2.49 8.1 17% 44.1 169% 65.00 89.00 0.4 259% M 5/173 NICE Nice Ltd. 234.96 0.00 0.0% 6.27 8.0 12% 37.5 125% 140.00 219.00 0.5 313% L 2/192 NKE NIKE, Inc. 127.66 0.98 0.8% 2.91 3.0 15% 43.9 176% 68.00 87.00 0.0 293% L 4/203 NSP Insperity 72.93 1.60 2.2% 3.15 18.3 13% 23.2 98% 63.00 94.00 1.9 178% L 9/19
3 NXST Nexstar Media Group 87.95 2.24 2.5% 11.41 41.2 20% 7.7 50% 120.00 B 218.00 5.4 39% M 3/203 ODFL Old Dominion Freight 202.51 0.60 0.3% 6.14 2.5 11% 33.0 168% 111.00 149.00 0.0 300% L 12/182 ORLY O'Reilly Automotive 464.63 0.00 0.0% 22.00 13.2 12% 21.1 106% 320.00 550.00 1.0 176% L 3/183 PATK Patrick Industries 62.50 0.00 0.0% 4.75 19.0 15% 13.2 106% 59.00 87.00 3.6 88% S 6/193 PLOW Douglas Dynamiics 36.83 1.12 3.0% 2.50 18.6 10% 14.7 86% 38.00 B 52.00 3.5 147% S 11/20
2 RMD ResMed 177.81 1.56 0.9% 4.69 5.4 12% 37.9 152% 117.00 144.00 0.2 316% M 8/152 ROP Roper Technologies 427.21 2.05 0.5% 11.16 5.0 12% 38.3 144% 298.00 358.00 0.3 319% L 7/112 RS Reliance Steel 112.34 2.50 2.2% 7.33 8.9 9% 15.3 120% 72.00 110.00 0.5 170% L 7/192 SBNY Signature Bank 84.71 2.24 2.6% 11.67 29.0 10% 7.3 58% 109.00 B 187.00 7.2 73% M 4/193 SNX Synnex Corporation 145.14 0.00 0.0% 10.44 15.2 12% 13.9 95% 147.00 B 187.00 3.2 116% M 8/20
3 SPGI S&P Global 351.51 2.68 0.8% 10.88 5.9 12% 32.3 146% 241.00 342.00 0.7 269% L 1/193 ST Sensata Technologies 47.30 0.00 0.0% 2.28 5.7 11% 20.7 143% 33.00 47.00 0.9 188% M 5/193 SWKS Skyworks Solutions 153.31 2.00 1.3% 6.60 9.2 12% 23.2 135% 97.00 143.00 0.5 193% M 7/181 SYK Stryker 221.22 2.30 1.0% 8.26 0.8 10% 26.8 170% 130.00 199.00 -1.0 268% L 9/132 TCF TCF Financial 26.12 1.40 5.4% 3.65 35.8 14% 7.2 52% 34.00 B 58.00 6.0 51% S 2/20
1 TROW T. Rowe Price 144.65 3.60 2.5% 9.60 11.7 8% 15.1 102% 115.00 165.00 1.1 189% L 8/152 TSCO Tractor Supply 151.89 1.60 1.1% 6.37 8.9 10% 23.8 123% 88.00 151.00 0.5 238% M 12/163 ULTA Ulta Beauty, Inc. 239.67 0.00 0.0% 11.07 12.7 12% 21.7 96% 234.00 286.00 2.6 181% M 10/203 UNH UnitedHealth 321.99 5.00 1.6% 17.61 15.0 12% 18.3 99% 324.00 B 402.00 3.8 153% L 9/202 V Visa 202.19 1.20 0.6% 6.83 14.8 16% 29.6 110% 174.00 228.00 1.6 185% L 12/19
3 VRSK Verisk Analytics 191.76 1.08 0.6% 4.56 2.2 10% 42.1 154% 115.00 142.00 0.0 421% L 1/132 WAB Wabtec 64.26 0.48 0.7% 4.02 21.5 15% 16.0 81% 74.00 B 98.00 6.2 107% M 4/17
Recommended companies are highlighted
November 2020
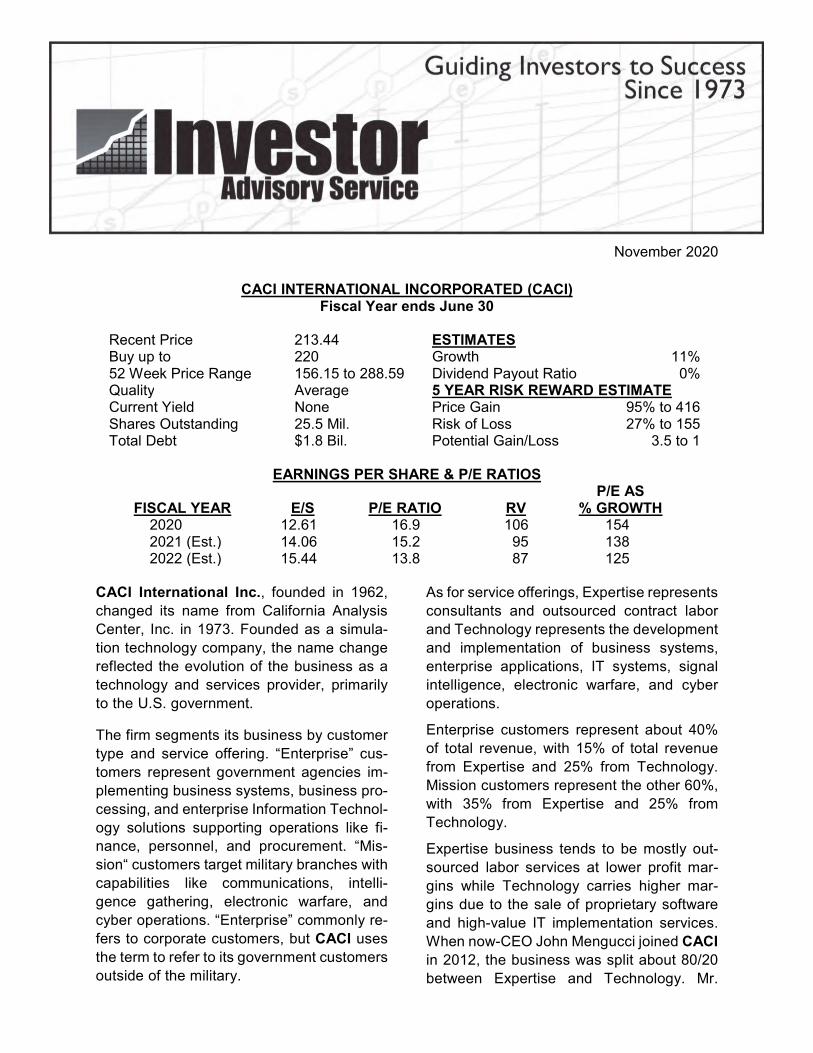
CACI INTERNATIONAL INCORPORATED (CACI) Fiscal Year ends June 30
Recent Price 213.44 ESTIMATES Buy up to 220 Growth 11% 52 Week Price Range 156.15 to 288.59 Dividend Payout Ratio 0%Quality Average 5 YEAR RISK REWARD ESTIMATECurrent Yield None Price Gain 95% to 416 Shares Outstanding 25.5 Mil. Risk of Loss 27% to 155Total Debt $1.8 Bil. Potential Gain/Loss 3.5 to 1
EARNINGS PER SHARE & P/E RATIOS
FISCAL YEAR E/S P/E RATIO RVP/E AS
% GROWTH2020 12.61 16.9 106 154 2021 (Est.) 14.06 15.2 95 138 2022 (Est.) 15.44 13.8 87 125
CACI International Inc., founded in 1962, changed its name from California Analysis Center, Inc. in 1973. Founded as a simula-tion technology company, the name change reflected the evolution of the business as a technology and services provider, primarily to the U.S. government.
The firm segments its business by customer type and service offering. “Enterprise” cus-tomers represent government agencies im-plementing business systems, business pro-cessing, and enterprise Information Technol-ogy solutions supporting operations like fi-nance, personnel, and procurement. “Mis-sion“ customers target military branches with capabilities like communications, intelli-gence gathering, electronic warfare, and cyber operations. “Enterprise” commonly re-fers to corporate customers, but CACI uses the term to refer to its government customers outside of the military.
As for service offerings, Expertise represents consultants and outsourced contract labor and Technology represents the development and implementation of business systems, enterprise applications, IT systems, signal intelligence, electronic warfare, and cyber operations.
Enterprise customers represent about 40% of total revenue, with 15% of total revenue from Expertise and 25% from Technology. Mission customers represent the other 60%, with 35% from Expertise and 25% from Technology.
Expertise business tends to be mostly out-sourced labor services at lower profit mar-gins while Technology carries higher mar-gins due to the sale of proprietary software and high-value IT implementation services. When now-CEO John Mengucci joined CACI in 2012, the business was split about 80/20 between Expertise and Technology. Mr.

Page 2 November 2020
Mengucci has consciously focused on ex-panding Technology such that the current mix is roughly 50/50. Gross margin since 2012 reflects this strategy, moving from 31% to 35% today.
CACI has emphasized building long-term re-lationships through multi-year contracts. Its largest customer is the Department of De-fense, representing about 70% of sales and led by the U.S. Army. Growing worldwide threats have created the need for advanced communications systems, greater intelli-gence, and security from cyber threats. CACI was recently awarded up-to a $1.5 bil-lion contract, the largest in its history, with a base period of five years and five one-year annual renewals to provide mission and cy-bersecurity to the National Geospatial-Intelli-gence Agency. The firm has a backlog of $22 billion with contracts having an average du-ration of five years, up from 3.5 years in fiscal 2017.
Another strategy to protect and improve mar-gins has been the movement toward more cost reimbursement contracts that allow CACI to bill at a consistent rate while imple-menting cost-saving initiatives over time. Cost reimbursement contracts represent 57% of Fiscal 2020 sales, up from 55% the year before, with the remaining 43% from fixed price and time and materials contracts.
As for top-line growth, CACI targets mid-sin-gle digit organic growth complemented by an aggressive acquisition strategy that looks to add emerging technology capabilities. CACI has completed more than 80 acquisitions in its long history and nine over the past three fiscal years. The recently announced Ascent Vision Technologies (AVT) acquisition is a good example. AVT brings advanced infra-red imagining systems for airborne, ground, and maritime platforms for intelligence, sur-veillance, and reconnaissance for day and night operations.
CACI is coming off a record year for Fiscal 2019, but headwinds from the COVID-19
pandemic are hurting growth. Some of this has been alleviated by the CARES Act through additional reimbursement for provid-ing stand-by labor should existing contract personnel get sick. Even so, guidance for Fiscal year 2021 is solid, with sales growth of 5%-8%, 5.5% from organic means at the midpoint, and EPS of $13.50-$14.28, up 7%-13%. CACI generates approximately $500 million per year in operating cash flow and its leverage ratio after the AVT acquisition is a very manageable 2.8x Debt/EBITDA.
The obvious risk to owning CACI shares is the near total reliance on government cus-tomers, particularly the military. Earlier in the decade, growth in military spending was cur-tailed by the Budget Control Act. However, recent growth has accelerated in a bipartisan fashion as Washington responds to threats increasingly waged online. Defense appro-priations are largely decided for the govern-ment’s fiscal year 2021 ending next Septem-ber and whomever is in the White House will have to contend with continued threats from abroad.
Analysts are projecting CACI can grow earn-ings 13% per year, but we will instead use roughly the past 10 years average growth rate of 11%. Five years of this growth and an average high P/E of 19.6 could generate a stock price as high as 416. We use a low price of 155, the product of fiscal year 2020 EPS of $12.61 and the average low P/E of 12.3. The upside/downside ratio is 3.5 to 1.
CACI International Incorporated is listed on the NYSE under the symbol CACI.
Investor contact is:
Investor Relations CACI International Incorporated 1100 North Glebe Road Arlington, VA 22201
Telephone: 703/841-7666
Website: www.caci.com

www.iclub.com
Growth Analysis
%%
%%
Percentage Change
Year Ago Quarter
Latest Quarter
% Institutions
% InsidersTotal Debt($M)
Preferred($M)Diluted(M Shares)
(3) Historical Earnings Per Share Growth
(4) Estimated Future Earnings Per Share Growth(6) Earnings Per Share Growth R 2
(2) Estimated Future Sales Growth(5) Sales Growth R 2
(1) Historical Sales Growth
SALES ($M) ($)
PER SHAREEARNINGS
RECENT QUARTERLY FIGURES
% Tot Debt to Tot Cap
Sector
Quality
StockStudy
1
Reference
Industry
Price Date
Data Source
Last Judgment
Data DateStudy by
Company
1
2
3
4
5
6
7
8910
20
30
40
50
60
70
8090
100
200
2011 2012 2013 2014 2015 2016 2017 2018 2019 2020 2021 2022 2023 2024 2025
(Buy)
5,720.0
12.61
401.6
8,022.7
21.25
4.97.0
10.711.0
0.71 0.70
s s s ss
s
s ss
s
e
ee
e ee
e
ee
e
p
pp
pp
pp
pp
p
CACI International In.. 10/09/20
IAS 10/09/20
Technology
StkCntrl
10/09/20
NYS:
Information Technology S
3.0 (IAS)
Morningsta0.0
25.5 2.2
77.61,781.7
41.0
CACI
FY 2020 Q4 (Ended 6/30/2020)
1,495.6 3.68
1,373.9 1.96
8.9% 87.8%
Printed: 10/16/20 09:59 AM Prepared by: IAS Using Toolkit 6

5
4
3
2
TOTAL RETURN ANALYSIS
EVALUATING REWARD and RISK over the next 5 years
PRICE, PRICE/EARNINGS RATIO and DIVIDEND ANALYSIS
QUALITY ANALYSIS
Fiscal Year
6
5
4
3
2
1
A CURRENT YIELD
C % COMPOUND ANNUAL TOTAL RETURN - USING FORECAST HIGH P/E
B AVERAGE YIELD - USING FORECAST HIGH P/E
D REWARD/RISK ANALYSIS (Potential Gain vs. Risk of Loss)
C PRICE RANGES
B FUTURE LOW PRICE ANALYSIS -- NEXT 5 YEARS
A FUTURE HIGH PRICE ANALYSIS -- NEXT 5 YEARS
Average Yield % + Annual Appreciation % = Compound Annual Total Return %
Avg. % Payout ÷ Forecast High P/E = Avg. Yield
=÷ Current Price of Stock $Present Full Year's Dividend $ Present Yield or % Returned on Purchase Price
To 1) =- Estimated Low PriceCurrent Price- Current Price ) ÷ ((Forecast High Price
= $
Forecast High Price - Estimated Low Price = Range 25% of Range =
MAYBE (Middle 50% of Range) =
BUY (Lower 25% of Range) =
SELL (Upper 25% of Range) =
to
to
to
Current Price is in the Range
(a) Sel. Low P/E
(b) Average 5-Year Low Price =
(c) Recent Severe Low Price =
= $X Estimated Low Earnings/Share
Selected Estimated Low Price
(d) Price Dividend Will Support = Present Divd. ÷ High Yield = =÷
= Forecast High Price $Selected High P/E X Estimated High Earnings/Share
% High Yield% PayoutDividendEPS
UP / DOWNTREND
© 2017 ICLUBcentral Inc., 711 West 13 Mile Road, Madison Heights, MI 48071 (248)-654-3100 www.iclub.com
(as adj.)
% ROE (Beginning Yr)
% LT Debt to Equity
% Pre-tax Profit on Sales
B
C
A
CURRENT PRICE (P/E) 52-WEEK HIGH (P/E) 52-WEEK LOW (P/E)
Low Price High Price
PROJECTED P/E RATIOAVERAGE P/E RATIO
AVERAGE
5
CURRENT P/E RATIO
RELATIVE VALUE PROJ. RELATIVE VALUE AVG TTM + FTM EPS
PEG RATIO
TTM EPS
FTM EPS
YEAR AVG.
Company
Low P/EHigh P/E
2011
6.3
29.7
2012
7.3
13.8
37.7
2013
6.6
12.7
25.2
2014
6.1
10.8
87.9
2015
6.1
9.2
71.6
2016
6.0
9.8
87.5
2017
5.7
10.1
66.1
2018
6.7
16.8
48.3
2019
6.6
12.6
68.0
2020
7.0
13.5
64.0
213.44 (16.9) 288.59 (22.9) 156.15 (12.4)
2016 111.1 72.2 5.76 19.3 12.5 0.000 0.0 0.0
2017 135.4 87.7 6.53 20.7 13.4 0.000 0.0 0.0
2018 174.8 118.1 11.93 14.7 9.9 0.000 0.0 0.0
2019 212.8 138.4 10.46 20.3 13.2 0.000 0.0 0.0
2020 288.6 156.2 12.61 22.9 12.4 0.000 0.0 0.0
CACI International Inc (CACI) 10/09/20
6.4 UP
12.5 UP
66.8 DOWN
114.5 19.6 12.3 0.0
16.0
16.9
106.0% 95.6%
12.6115.2
14.00
13.30
1.4
19.6 21.25 416.5
12.3 12.61 155.1
114.5
138.4
0.00 0.000 0.0
155.1
416.5 155.1 261.4 65.3
155.1 220.4
220.4 351.2
351.2 416.5
213.44 Buy
416.5 213.44 3.5213.44 155.1
0.000 213.44 0.0 %
0.0 14.3 14.3
0.0 19.6 0.0
Printed: 10/16/20 09:59 AM Prepared by: IAS Using Toolkit 6
November 2020
COMCAST CORPORATION (CMCSA) Fiscal Year ends December 31
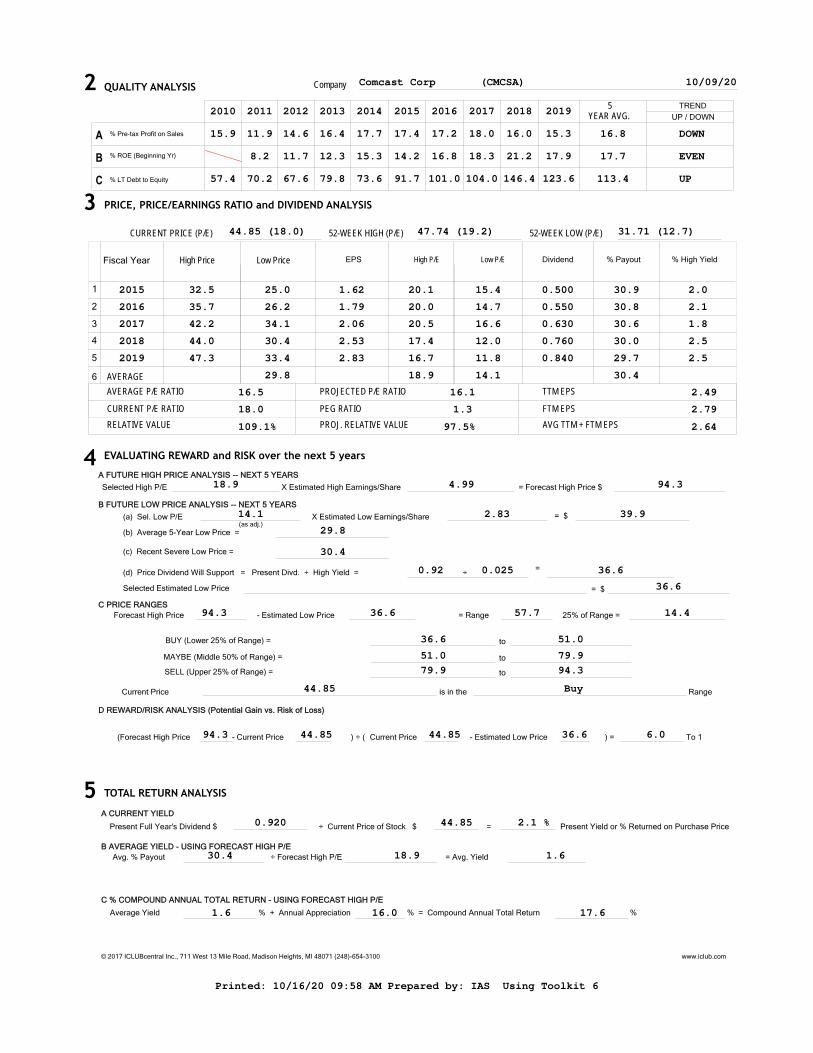
Recent Price 44.85 ESTIMATES Buy up to 51 Growth 12%52 Week Price Range 31.71 to 47.74 Dividend Payout Ratio 30%Quality Above Average 5 YEAR RISK REWARD ESTIMATE Current Yield 2.1% Price Gain 110% to 94Shares Outstanding 4,607 Mil. Risk of Loss 18% to 37 Total Debt $104.8 Bil. Potential Gain/Loss 6.0 to 1
EARNINGS PER SHARE & P/E RATIOS
FISCAL YEAR E/S P/E RATIO RV P/E AS
% GROWTH 2019 2.83 15.8 96 132 2020 (Est.) 2.00 22.4 136 187 2021 (Est.) 2.85 15.7 95 131
Comcast’s businesses operate in environ-ments undergoing meaningful transition. The company has faced headwinds in recent years in its largest business, cable, from cord-cutting. However, the company has done an admirable job of pivoting away from video and toward broadband as its featured product. We remain strong believers in the value of the broadband pipe into the home, which the pan-demic has helped highlight. Driven by broad-band strength, the cable business has grown customers at a low-single digit percentage rate in recent years. High-speed internet and business services are each growing revenue at nearly a 10% rate, while contributing most of the profitability within the cable segment. Strong broadband net additions have contin-ued this year, aided by COVID-19. Last year, Comcast added 1.4 million net new subscrib-ers, growing total subscribers by more than 5%. In 2020, the company is on pace to meaningfully exceed last year’s net sub-scriber growth, setting Comcast up for its 15th consecutive year with more than one million
net broadband customer additions. Im-portantly, Comcast’s broadband penetration in its footprint is only approaching 50%, leav-ing plenty of room for continued growth as the company takes share from competitors. Comcast is well-positioned to continue offer-ing the fastest speeds in its coverage areas, which should help broadband subscriber growth continue at a healthy rate. It is im-portant to note that the broadband business has superior margins and lower capital inten-sity relative to video, leading to improved cash flow generation.
There is some concern the introduction of 5G fixed wireless broadband could threaten the high-speed internet business, but we expect this threat is farther out on the horizon. For broadly available 5G to become a reality, it is likely wireline will be required for backhaul given spectrum limitations. There is a reason-able chance 5G represents more of an oppor-tunity than a threat for Comcast.
Another segment, NBCUniversal, includes
Page 2 November 2020
the news, entertainment, and sports cable networks; broadcast networks; Universal Pic-tures; and Universal Parks and Resorts. This business has been meaningfully impacted by the pandemic, depressing earnings in the near term. Parks were closed and new theat-rical releases have been delayed. Prior to the pandemic, the Parks’ business was a strength for the company, and it is expected to perform well on the other side of the pandemic. While two of its three parks are currently open, traf-fic is far below historical levels.
NBCUniversal saw results rebound from the depths seen earlier this year. Sports returned, which helped with advertising. Television and film production have ramped back up, and NBCU will see tailwinds over the next 18 months as it is scheduled to broadcast two Olympics and the Super Bowl.
With its nearly $50 billion acquisition of Sky, it is clear that Comcast intends to position itself for the delivery of its own over-the-top (OTT) streaming content service. Sky boasted 23 million customer relationships, giving Com-cast greater scale. Today the combined com-pany has more than 55 million customer rela-tionships and a strong position in both the U.S. and Europe.
Comcast released its OTT product, Peacock, to its cable customers in April, with a national debut of the product in July. Unlike Netflix and Disney+, Peacock is predominantly an ad-driven service that features original program-ming as well as exclusive access to classic shows like “The Office.” To date, Peacock has achieved more than 15 million sign-ups. The company looks to continue to grow this num-ber and has reached agreements with other pay-TV providers as well as manufacturers of streaming devices to help broaden distribution.
Investors will be closely watching the costs as-sociated with both producing new content for Peacock and securing rights to shows it had previously sold to companies like Netflix. For example, Comcast paid $500 million for exclu-sive rights to “The Office” when the show’s deal with Netflix runs out in 2021. Investors are unlikely to respond favorably to ballooning content costs that signal an intention to go head-to-head with other, better positioned
OTT players like Disney or Netflix. Though the company has not yet formally broken out the required investment for Peacock, manage-ment has indicated it would not materially im-pact Comcast’s earnings growth trajectory.
Comcast has two share classes. Class A shares are publicly traded and have two-thirds voting power. Class B shares are owned by the Roberts family and represent less than 1% economic ownership but one-third of total voting power. Brian Roberts, son of the company’s co-founder, is Chairman and CEO. The dual-share structure gives Roberts great influence in steering the com-pany’s direction. This has led to questionable capital allocation in the past, such as the Sky acquisition at what appeared to be a very rich multiple.
We anticipate Comcast will grow revenue 5% a year over the next several years with EPS growth averaging 12%. Margins should be aided by trends in the cable business. Once target leverage is likely achieved in 2022 fol-lowing debt paydown associated with the Sky acquisition, a resumption of buybacks will provide a boost to EPS growth. Projecting 12% EPS growth over the next five years and applying a high P/E of 18.9, we get a potential high price of 94. Applying a low price of 37 reflecting the price supported by its dividend results in an upside/downside ratio of 6.0 to 1 and projected high total return over 17% an-nually.
Comcast Corporation is listed on the NASDAQ under the symbol CMCSA.
Investor contact is: Marci Ryvicker Senior Vice President, Investor Relations Comcast Corporation One Comcast Center Philadelphia, PA 19103 Telephone: 215/286-4781 Website: www.cmcsa.com

www.iclub.com
Growth Analysis
%%
%%
Percentage Change
Year Ago Quarter
Latest Quarter
% Institutions
% InsidersTotal Debt($M)
Preferred($M)Diluted(M Shares)
(3) Historical Earnings Per Share Growth
(4) Estimated Future Earnings Per Share Growth(6) Earnings Per Share Growth R 2
(2) Estimated Future Sales Growth(5) Sales Growth R 2
(1) Historical Sales Growth
SALES ($M) ($)
PER SHAREEARNINGS
RECENT QUARTERLY FIGURES
% Tot Debt to Tot Cap
Sector
Quality
StockStudy
1
Reference
Industry
Price Date
Data Source
Last Judgment
Data DateStudy by
Company
1
2
3
45
10
20
30
4050
100
200
300
400500
1K
2K
3K
4K5K
10K
20K
2010 2011 2012 2013 2014 2015 2016 2017 2018 2019 2020 2021 2022 2023 2024
(Buy)
108,942.0
2.83
16,656.5
139,040.7
4.99
9.85.0
16.912.0
0.96 0.91
s
ss s s s s s
ss
ee
ee
e e ee
ee
p p
pp
p p p p p p
Comcast Corp 10/09/20
IAS 10/09/20
Communication Services
StkCntrl
10/09/20
NAS:
Entertainment
2.0 (IAS)
Morningsta0.0
4,607.0 0.2
75.9104,810.0
57.2
CMCSA
FY 2020 Q2 (Ended 6/30/2020)
23,715.0 0.65
26,858.0 0.68
-11.7% -4.4%
Printed: 10/16/20 09:58 AM Prepared by: IAS Using Toolkit 6
5
4
3
2
TOTAL RETURN ANALYSIS
EVALUATING REWARD and RISK over the next 5 years
PRICE, PRICE/EARNINGS RATIO and DIVIDEND ANALYSIS
QUALITY ANALYSIS
Fiscal Year
6
5
4
3
2
1
A CURRENT YIELD
C % COMPOUND ANNUAL TOTAL RETURN - USING FORECAST HIGH P/E
B AVERAGE YIELD - USING FORECAST HIGH P/E
D REWARD/RISK ANALYSIS (Potential Gain vs. Risk of Loss)
C PRICE RANGES
B FUTURE LOW PRICE ANALYSIS -- NEXT 5 YEARS
A FUTURE HIGH PRICE ANALYSIS -- NEXT 5 YEARS
Average Yield % + Annual Appreciation % = Compound Annual Total Return %
Avg. % Payout ÷ Forecast High P/E = Avg. Yield
=÷ Current Price of Stock $Present Full Year's Dividend $ Present Yield or % Returned on Purchase Price
To 1) =- Estimated Low PriceCurrent Price- Current Price ) ÷ ((Forecast High Price
= $
Forecast High Price - Estimated Low Price = Range 25% of Range =
MAYBE (Middle 50% of Range) =
BUY (Lower 25% of Range) =
SELL (Upper 25% of Range) =
to
to
to
Current Price is in the Range
(a) Sel. Low P/E
(b) Average 5-Year Low Price =
(c) Recent Severe Low Price =
= $X Estimated Low Earnings/Share
Selected Estimated Low Price
(d) Price Dividend Will Support = Present Divd. ÷ High Yield = =÷
= Forecast High Price $Selected High P/E X Estimated High Earnings/Share
% High Yield% PayoutDividendEPS
UP / DOWNTREND
© 2017 ICLUBcentral Inc., 711 West 13 Mile Road, Madison Heights, MI 48071 (248)-654-3100 www.iclub.com
(as adj.)
% ROE (Beginning Yr)
% LT Debt to Equity
% Pre-tax Profit on Sales
B
C
A
CURRENT PRICE (P/E) 52-WEEK HIGH (P/E) 52-WEEK LOW (P/E)
Low Price High Price
PROJECTED P/E RATIOAVERAGE P/E RATIO
AVERAGE
5
CURRENT P/E RATIO
RELATIVE VALUE PROJ. RELATIVE VALUE AVG TTM + FTM EPS
PEG RATIO
TTM EPS
FTM EPS
YEAR AVG.
Company
Low P/EHigh P/E
2010
15.9
57.4
2011
11.9
8.2
70.2
2012
14.6
11.7
67.6
2013
16.4
12.3
79.8
2014
17.7
15.3
73.6
2015
17.4
14.2
91.7
2016
17.2
16.8
101.0
2017
18.0
18.3
104.0
2018
16.0
21.2
146.4
2019
15.3
17.9
123.6
44.85 (18.0) 47.74 (19.2) 31.71 (12.7)
2015 32.5 25.0 1.62 20.1 15.4 0.500 30.9 2.0
2016 35.7 26.2 1.79 20.0 14.7 0.550 30.8 2.1
2017 42.2 34.1 2.06 20.5 16.6 0.630 30.6 1.8
2018 44.0 30.4 2.53 17.4 12.0 0.760 30.0 2.5
2019 47.3 33.4 2.83 16.7 11.8 0.840 29.7 2.5
Comcast Corp (CMCSA) 10/09/20
16.8 DOWN
17.7 EVEN
113.4 UP
29.8 18.9 14.1 30.4
16.5
18.0
109.1% 97.5%
2.4916.1
2.79
2.64
1.3
18.9 4.99 94.3
14.1 2.83 39.9
29.8
30.4
0.92 0.025 36.6
36.6
94.3 36.6 57.7 14.4
36.6 51.0
51.0 79.9
79.9 94.3
44.85 Buy
94.3 44.85 6.044.85 36.6
0.920 44.85 2.1 %
1.6 16.0 17.6
30.4 18.9 1.6
Printed: 10/16/20 09:58 AM Prepared by: IAS Using Toolkit 6

November 2020 DOUGLAS DYNAMICS, INC. (PLOW)
Fiscal Year ends December 31
Recent Price 36.83 ESTIMATES Buy up to 38 Growth 10% 52 Week Price Range 24.12 to 56.89 Dividend Payout Ratio 53%Quality Average 5 YEAR RISK REWARD ESTIMATE Current Yield 3.0% Price Gain 92% to 71Shares Outstanding 22.9 Mil. Risk of Loss 25% to 28Total Debt $291 Mil. Potential Gain/Loss 3.7 to 1
EARNINGS PER SHARE & P/E RATIOS
FISCAL YEAR E/S P/E RATIO RV P/E AS
% GROWTH 2019 2.11 17.5 103 175 2020 (Est.) (1.52) (24.2) N/A N/A 2021 (Est.) 2.50 14.7 86 147
Headquartered in Milwaukee and with facil-ities throughout the Midwest and North-east, Douglas Dynamics manufactures and installs snowplows and other work truck attachments.
The company enjoys a strong competitive position within its snow removal niche. Revenue can be lumpy, but the company’s products serve a predictable need that is not going away. The snow removal market grows at about the pace of overall GDP, with incremental growth opportunities com-ing from acquisitions and product line ex-tensions.
In a rich market, shares are priced reason-ably. The company typically converts more than 100% of earnings to free cash flow and also returns about half its profits to shareholders through dividends.
Snow and ice removal accounts for more than 80% of revenue. A plow’s useful life is
about 9-12 years. Snowfall can vary dra-matically from year to year. A peak year in the company’s market brings about twice as much snowfall as a trough year. More snowfall causes extra wear and tear on plows and also puts more money in cus-tomers’ pockets, driving a replacement cy-cle. 2018 and 2019 were both average years, and 2020’s snowfall season has not started yet.
A recent initiative to integrate vertically into installation has not been entirely success-ful. In 2014, Douglas paid $95 million for Henderson, an Iowa company which makes heavy-duty snow and salt trucks. In 2016, Douglas paid $206 million for Dejana, which installs truck equipment, mainly for utility companies.
In the second quarter of 2020, Douglas took a non-cash goodwill impairment charge of $128 million related to these ac-quisitions, reducing overall balance sheet

Page 2 November 2020
goodwill by more than half. Taking the im-pairment should boost future GAAP earn-ings modestly, as goodwill and intangible amortization has cost the company about $11 million per year since the Henderson acquisition. While disappointing, these ac-quisitions seem like mistakes the company can easily bounce back from. CEO Robert McCormick, who assumed the role at the beginning of 2019, talks about focusing on smaller tuck-in acquisitions in the future.
Douglas came public in 2010 and has per-formed similarly to the S&P 500 since then. It has done a little better than the Russell 2000, an index which tracks smaller-capi-talization companies. Douglas shares have struggled over the past year, down 15%. The S&P 500 is up about 18% and the Russell 2000 is up about 11% in that time. As long as this year’s snowfall is not too far below average, this could be a good time to acquire shares at a discount to the market.
One problem with industrial sector invest-ments is that growth tends to require a lot of incremental capital. Douglas has been able to grow without significant capital in-vestment. Free cash flow has consistently run about $60 million per year over the past five years. That equates to a free cash flow yield of over 7% based on the current mar-ket capitalization.
The company’s return on equity has fluctu-ated between the mid-teens and low twen-ties during this period. 2020 will be a chal-lenging year, but the company expects free cash flow to cover its 3% dividend yield.
A 3% dividend yield is nothing to scoff at in a world where 30-year Treasuries pay 1.6%. A diversified portfolio of stocks like Douglas with modest debt, good market position, and negligible risk of obsoles-cence would seem like a slam dunk to out-perform bonds over the intermediate to long term. Broad swaths of the market are so richly valued or rely on such speculative business models that it is impossible to say with confidence that they will earn any
return over time. Again, a portfolio of stocks like Douglas ought to at least keep up with the growth rate of nominal GDP. That sounds like a pretty good value proposition right now.
We model 10% compound EPS growth. This is similar to both its historical long-term trend when trough years are elimi-nated and the internal growth rate implied by its average return on equity (21.4%) and its earnings retention (one minus its 49.8% dividend payment rate).
If achieved, 10% growth would generate EPS of $3.40 in five years. That figure, combined with a high P/E of 20.8, gener-ates a high price of 71.
For a low price, we apply a low P/E of 13.1 to 2019 EPS of $2.11 and get 28. On that basis, the upside/downside ratio is 3.7 to 1.
Douglas Dynamics, Inc. is listed on the NYSE under the symbol PLOW.
Investor contact is:
Nathan Elwell Investor Relations Douglas Dynamics, Inc. Phone: 847/530-0249
Email: [email protected]
Website: www.douglasdynamics.com

www.iclub.com
Growth Analysis
%%
%%
Percentage Change
Year Ago Quarter
Latest Quarter
% Institutions
% InsidersTotal Debt($M)
Preferred($M)Diluted(M Shares)
(3) Historical Earnings Per Share Growth
(4) Estimated Future Earnings Per Share Growth(6) Earnings Per Share Growth R 2
(2) Estimated Future Sales Growth(5) Sales Growth R 2
(1) Historical Sales Growth
SALES ($M) ($)
PER SHAREEARNINGS
RECENT QUARTERLY FIGURES
% Tot Debt to Tot Cap
Sector
Quality
StockStudy
1
Reference
Industry
Price Date
Data Source
Last Judgment
Data DateStudy by
Company
1
2
3
45
10
20
30
4050
100
200
300
400500
1K
2K
3K
4K5K
10K
20K
2010 2011 2012 2013 2014 2015 2016 2017 2018 2019 2020 2021 2022 2023 2024
(Buy)
571.7
2.11
61.8
765.1
3.40
16.86.0
34.410.0
0.67 0.87
ss
s
s
s
s ss s s
e
e
e
e ee
ee
e
p
p
p
p
p p pp p
p
Douglas Dynamics Inc 10/09/20
IAS 10/09/20
Consumer Cyclical
StkCntrl
10/09/20
NYS:
Auto Parts
3.0 (IAS)
Morningsta0.0
22.9 2.3
96.3291.0
49.2
PLOW
FY 2020 Q2 (Ended 6/30/2020)
120.0 -4.55
176.4 1.10
-31.9% -513.6%
Printed: 10/16/20 09:58 AM Prepared by: IAS Using Toolkit 6

5
4
3
2
TOTAL RETURN ANALYSIS
EVALUATING REWARD and RISK over the next 5 years
PRICE, PRICE/EARNINGS RATIO and DIVIDEND ANALYSIS
QUALITY ANALYSIS
Fiscal Year
6
5
4
3
2
1
A CURRENT YIELD
C % COMPOUND ANNUAL TOTAL RETURN - USING FORECAST HIGH P/E
B AVERAGE YIELD - USING FORECAST HIGH P/E
D REWARD/RISK ANALYSIS (Potential Gain vs. Risk of Loss)
C PRICE RANGES
B FUTURE LOW PRICE ANALYSIS -- NEXT 5 YEARS
A FUTURE HIGH PRICE ANALYSIS -- NEXT 5 YEARS
Average Yield % + Annual Appreciation % = Compound Annual Total Return %
Avg. % Payout ÷ Forecast High P/E = Avg. Yield
=÷ Current Price of Stock $Present Full Year's Dividend $ Present Yield or % Returned on Purchase Price
To 1) =- Estimated Low PriceCurrent Price- Current Price ) ÷ ((Forecast High Price
= $
Forecast High Price - Estimated Low Price = Range 25% of Range =
MAYBE (Middle 50% of Range) =
BUY (Lower 25% of Range) =
SELL (Upper 25% of Range) =
to
to
to
Current Price is in the Range
(a) Sel. Low P/E
(b) Average 5-Year Low Price =
(c) Recent Severe Low Price =
= $X Estimated Low Earnings/Share
Selected Estimated Low Price
(d) Price Dividend Will Support = Present Divd. ÷ High Yield = =÷
= Forecast High Price $Selected High P/E X Estimated High Earnings/Share
% High Yield% PayoutDividendEPS
UP / DOWNTREND
© 2017 ICLUBcentral Inc., 711 West 13 Mile Road, Madison Heights, MI 48071 (248)-654-3100 www.iclub.com
(as adj.)
% ROE (Beginning Yr)
% LT Debt to Equity
% Pre-tax Profit on Sales
B
C
A
CURRENT PRICE (P/E) 52-WEEK HIGH (P/E) 52-WEEK LOW (P/E)
Low Price High Price
PROJECTED P/E RATIOAVERAGE P/E RATIO
AVERAGE
5
CURRENT P/E RATIO
RELATIVE VALUE PROJ. RELATIVE VALUE AVG TTM + FTM EPS
PEG RATIO
TTM EPS
FTM EPS
YEAR AVG.
Company
Low P/EHigh P/E
2010
1.4
79.2
2011
14.4
10.8
69.0
2012
7.2
3.5
72.8
2013
9.6
7.3
76.2
2014
20.1
27.1
110.4
2015
16.3
25.5
97.9
2016
15.1
20.1
143.4
2017
11.0
25.2
121.3
2018
10.5
18.8
88.4
2019
10.8
17.4
80.3
36.83 (NMF) 56.89 (NMF) 24.12 (NMF)
2015 24.5 18.7 1.94 12.6 9.6 0.890 45.9 4.8
2016 34.8 16.9 1.70 20.5 9.9 0.940 55.3 5.6
2017 42.6 28.6 2.40 17.7 11.9 0.960 40.0 3.4
2018 49.5 33.5 1.89 26.2 17.7 1.060 56.1 3.2
2019 56.6 34.3 2.11 26.8 16.3 1.090 51.7 3.2
Douglas Dynamics Inc (PLOW) 10/09/20
12.7 DOWN
21.4 DOWN
106.3 DOWN
26.4 20.8 13.1 49.8
17.0
-9.3
-54.9% -49.9%
-3.96-8.5
-4.36
-4.16
-0.8
20.8 3.40 70.7
13.1 2.11 27.6
26.4
24.1
1.12 0.056 20.1
27.6
70.7 27.6 43.1 10.8
27.6 38.4
38.4 59.9
59.9 70.7
36.83 Buy
70.7 36.83 3.736.83 27.6
1.120 36.83 3.0 %
2.4 13.9 16.3
49.8 20.8 2.4
Printed: 10/16/20 09:58 AM Prepared by: IAS Using Toolkit 6