hendricks-schmitt-project report group1
TRANSCRIPT
Refining the Transonic Capability of Purdue’s 12-inch Ludwieg Tube
AAE520 Project Report Draft April 16, 2007
Lynn Hendricks
Matt Schmitt
School of Aeronautics and Astronautics Purdue University
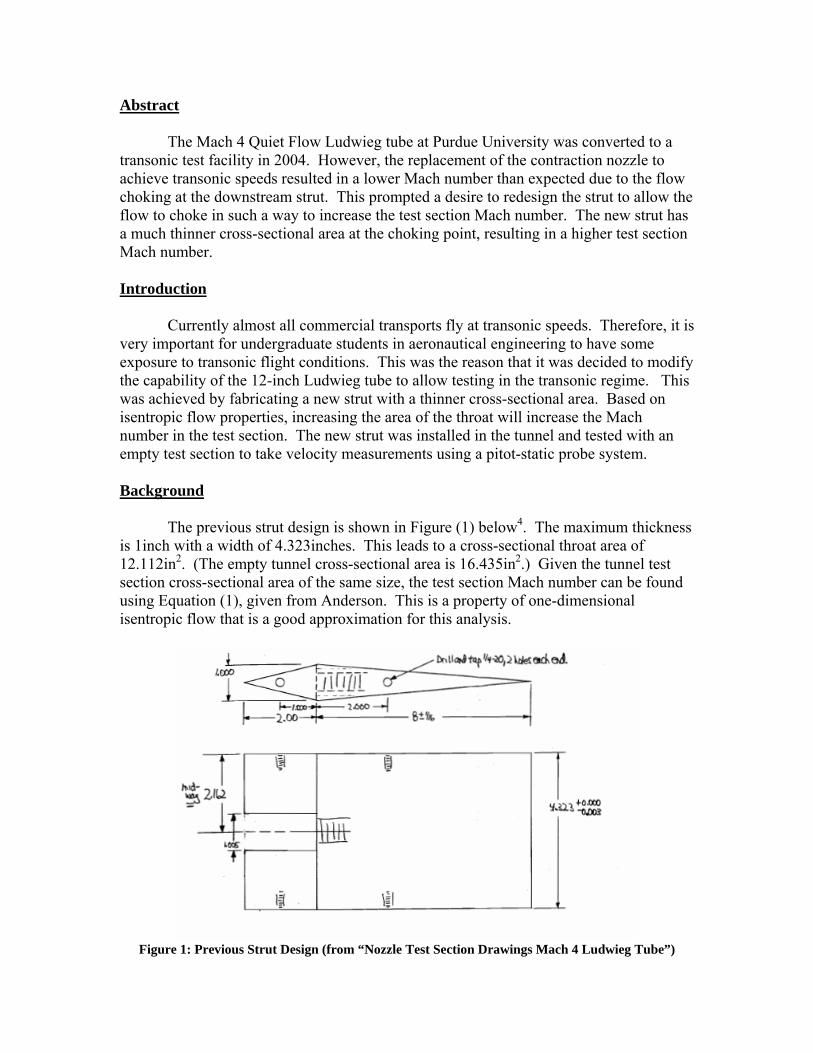
Abstract The Mach 4 Quiet Flow Ludwieg tube at Purdue University was converted to a transonic test facility in 2004. However, the replacement of the contraction nozzle to achieve transonic speeds resulted in a lower Mach number than expected due to the flow choking at the downstream strut. This prompted a desire to redesign the strut to allow the flow to choke in such a way to increase the test section Mach number. The new strut has a much thinner cross-sectional area at the choking point, resulting in a higher test section Mach number. Introduction Currently almost all commercial transports fly at transonic speeds. Therefore, it is very important for undergraduate students in aeronautical engineering to have some exposure to transonic flight conditions. This was the reason that it was decided to modify the capability of the 12-inch Ludwieg tube to allow testing in the transonic regime. This was achieved by fabricating a new strut with a thinner cross-sectional area. Based on isentropic flow properties, increasing the area of the throat will increase the Mach number in the test section. The new strut was installed in the tunnel and tested with an empty test section to take velocity measurements using a pitot-static probe system. Background The previous strut design is shown in Figure (1) below4. The maximum thickness is 1inch with a width of 4.323inches. This leads to a cross-sectional throat area of 12.112in2. (The empty tunnel cross-sectional area is 16.435in2.) Given the tunnel test section cross-sectional area of the same size, the test section Mach number can be found using Equation (1), given from Anderson. This is a property of one-dimensional isentropic flow that is a good approximation for this analysis.
Figure 1: Previous Strut Design (from “Nozzle Test Section Drawings Mach 4 Ludwieg Tube”)
11
22
2
211
121
*
−+
⎥⎦
⎤⎢⎣
⎡⎟⎠⎞
⎜⎝⎛ −+
+=⎟
⎠⎞
⎜⎝⎛ γ
γ
γγ
MMA
A (1)1
This leads to a test-section Mach number of 0.52. According to the report of the initial testing of the facility during the fall of 2004, the actual Mach number in the test section of the empty tunnel was 0.54203. In order to increase this Mach number, the area of the strut must be decreased, to increase the overall area of the throat. To measure the Mach number in the test section, a similar procedure to the initial tests will be used. In the previous experiments, a Kulite pitot probe and a static pressure probe were placed in the flow in the test section. The probes were wired to a digital oscilloscope and the data transferred to a computer using Scope Explorer. The Mach number can then be found based on the two pressures using Equation (2), also a property of 1-D isentropic flow. A similar procedure will be used in the trial runs with the new strut.
1
2 011
1
2 11
pMp
γγ
γ
−⎡ ⎤⎛ ⎞⎢ ⎥= −⎜ ⎟⎢ ⎥− ⎝ ⎠⎣ ⎦
(2)3
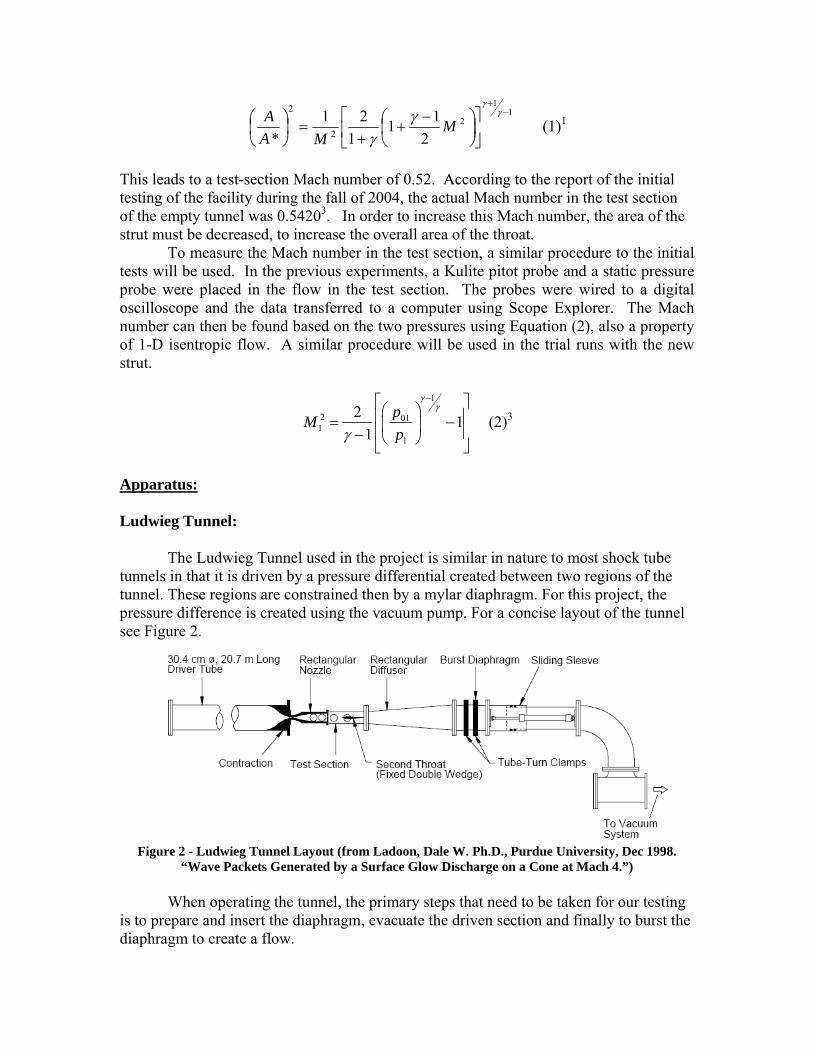
Apparatus: Ludwieg Tunnel: The Ludwieg Tunnel used in the project is similar in nature to most shock tube tunnels in that it is driven by a pressure differential created between two regions of the tunnel. These regions are constrained then by a mylar diaphragm. For this project, the pressure difference is created using the vacuum pump. For a concise layout of the tunnel see Figure 2.
Figure 2 - Ludwieg Tunnel Layout (from Ladoon, Dale W. Ph.D., Purdue University, Dec 1998.
“Wave Packets Generated by a Surface Glow Discharge on a Cone at Mach 4.”) When operating the tunnel, the primary steps that need to be taken for our testing is to prepare and insert the diaphragm, evacuate the driven section and finally to burst the diaphragm to create a flow.
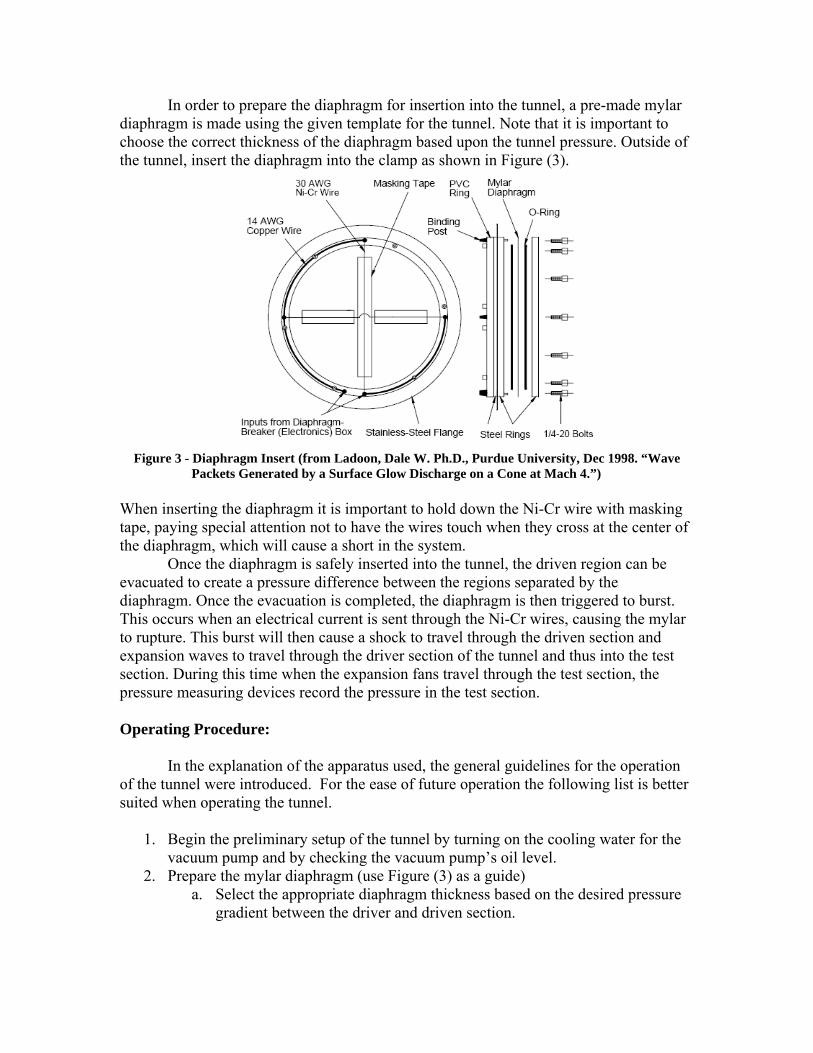
In order to prepare the diaphragm for insertion into the tunnel, a pre-made mylar diaphragm is made using the given template for the tunnel. Note that it is important to choose the correct thickness of the diaphragm based upon the tunnel pressure. Outside of the tunnel, insert the diaphragm into the clamp as shown in Figure (3).
Figure 3 - Diaphragm Insert (from Ladoon, Dale W. Ph.D., Purdue University, Dec 1998. “Wave
Packets Generated by a Surface Glow Discharge on a Cone at Mach 4.”) When inserting the diaphragm it is important to hold down the Ni-Cr wire with masking tape, paying special attention not to have the wires touch when they cross at the center of the diaphragm, which will cause a short in the system. Once the diaphragm is safely inserted into the tunnel, the driven region can be evacuated to create a pressure difference between the regions separated by the diaphragm. Once the evacuation is completed, the diaphragm is then triggered to burst. This occurs when an electrical current is sent through the Ni-Cr wires, causing the mylar to rupture. This burst will then cause a shock to travel through the driven section and expansion waves to travel through the driver section of the tunnel and thus into the test section. During this time when the expansion fans travel through the test section, the pressure measuring devices record the pressure in the test section. Operating Procedure: In the explanation of the apparatus used, the general guidelines for the operation of the tunnel were introduced. For the ease of future operation the following list is better suited when operating the tunnel.
1. Begin the preliminary setup of the tunnel by turning on the cooling water for the vacuum pump and by checking the vacuum pump’s oil level.
2. Prepare the mylar diaphragm (use Figure (3) as a guide) a. Select the appropriate diaphragm thickness based on the desired pressure
gradient between the driver and driven section.
b. Place the diaphragm in the diaphragm holder, making sure to match up all the necessary holes and pins on the diaphragm and the holder.
c. Place the top section of the holder over the diaphragm so that the diaphragm is sandwiched between both sections of the holder. Screw the sections together
d. Thread the Ni-Cr wire through the two wire holders that are opposite one another. Leave some slag in the wire.
e. Using the masking tape, tape the wire to the surface of the diaphragm. f. Now thread the Ni-Cr wire through the other two opposing wire holds.
Once again leave some slag in the wire. g. Use two smaller sections of masking tape to tape the wire to the
diaphragm as well. Make sure that the wire does not intersect with the other taped section of wire. To do this, create an arch over the intersection point.
h. Trim excess wire from the edges of the holder. 3. Check to see that the tunnel is at atmospheric pressure before opening the tunnel 4. Open the tunnel. 5. Short the wires. 6. Remove the old diaphragm holder if it is in the tunnel and then replace with the
new diaphragm that was just prepared. 7. Close the tunnel, though make sure the that wires are connected to the circuit. 8. Evacuate the driven section using the vacuum pump. Turn off vacuum when the
evacuation is complete. 9. If desired, pressure the driver section. 10. Turn on the capacitor and trigger the cable to cause the diaphragm to rupture.
Make sure any measuring equipment is ready before triggering. 11. Open pressure valve to return the tunnel to atmospheric pressure. 12. Open tunnel and remove broken diaphragm 13. Save/Record and data recorded.
Redesigned Strut: In order to meet the design requirements that the test section Mach number be 0.75, a new strut needed to be designed. Using Equation (1) and the data in Table (1), it is clear that this new strut can be designed to reach the target Mach number of 0.75.
Empty Tunnel Area (square inches) 16 Frontal Area of New Strut (square inches) 0.9
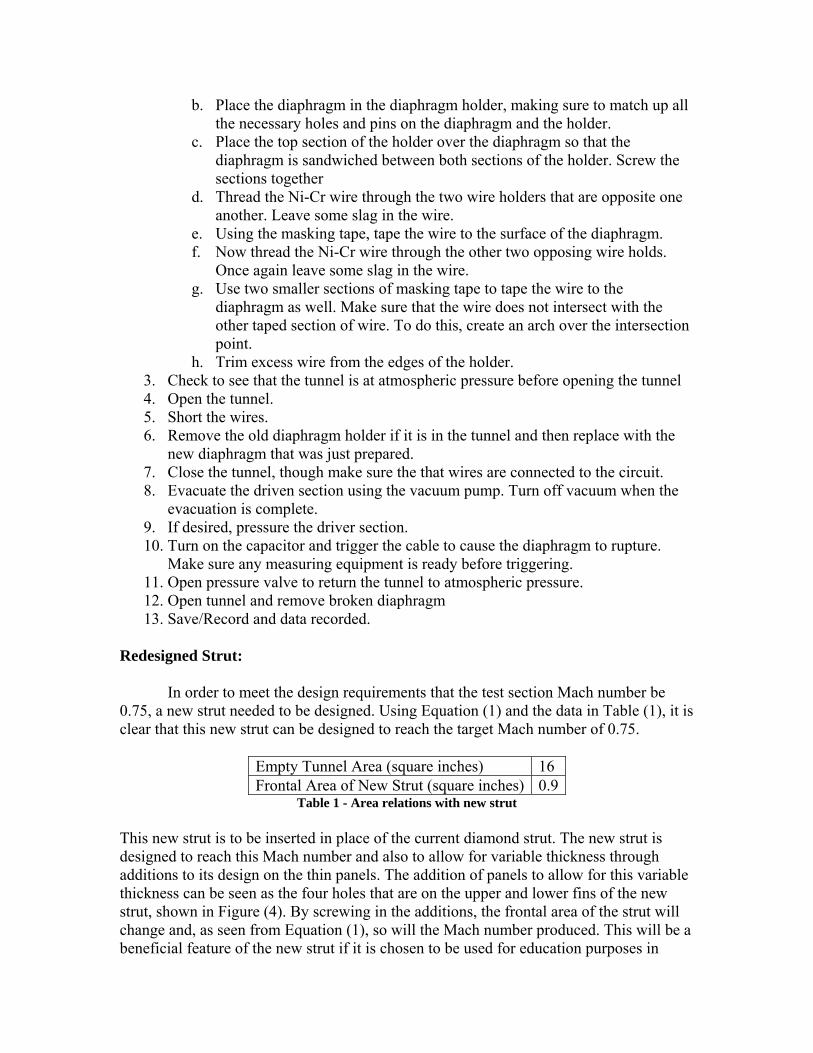
Table 1 - Area relations with new strut This new strut is to be inserted in place of the current diamond strut. The new strut is designed to reach this Mach number and also to allow for variable thickness through additions to its design on the thin panels. The addition of panels to allow for this variable thickness can be seen as the four holes that are on the upper and lower fins of the new strut, shown in Figure (4). By screwing in the additions, the frontal area of the strut will change and, as seen from Equation (1), so will the Mach number produced. This will be a beneficial feature of the new strut if it is chosen to be used for education purposes in
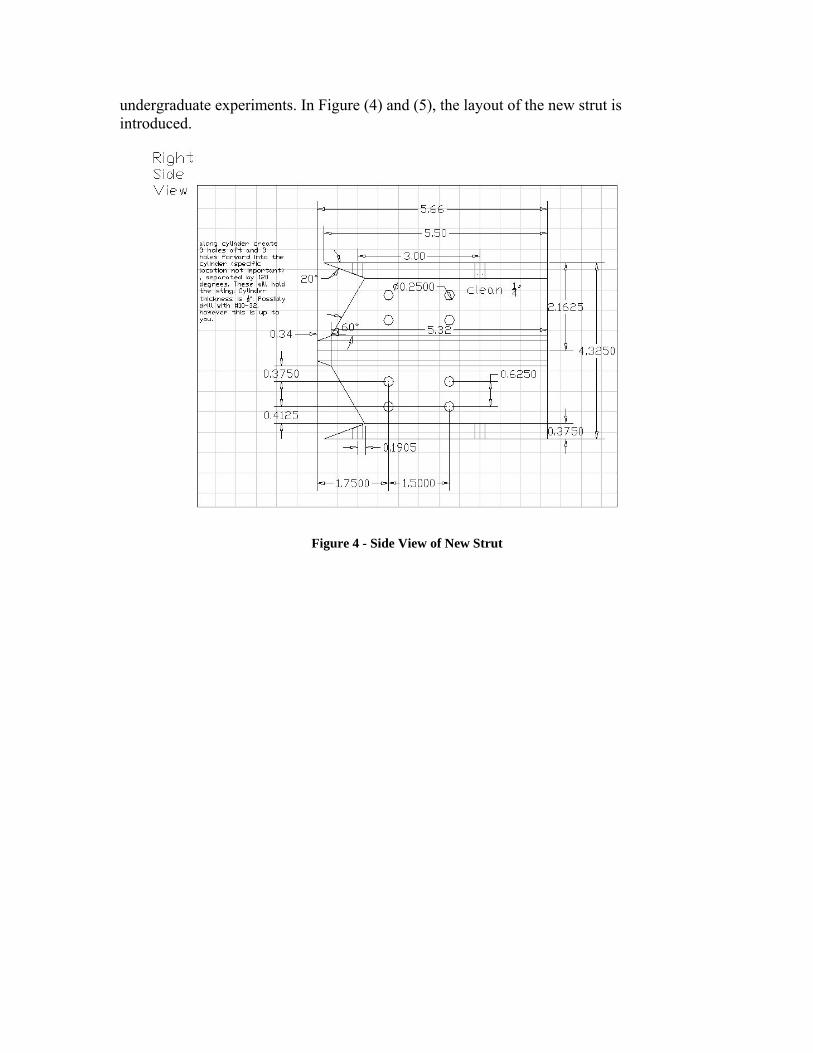
undergraduate experiments. In Figure (4) and (5), the layout of the new strut is introduced.
Figure 4 - Side View of New Strut
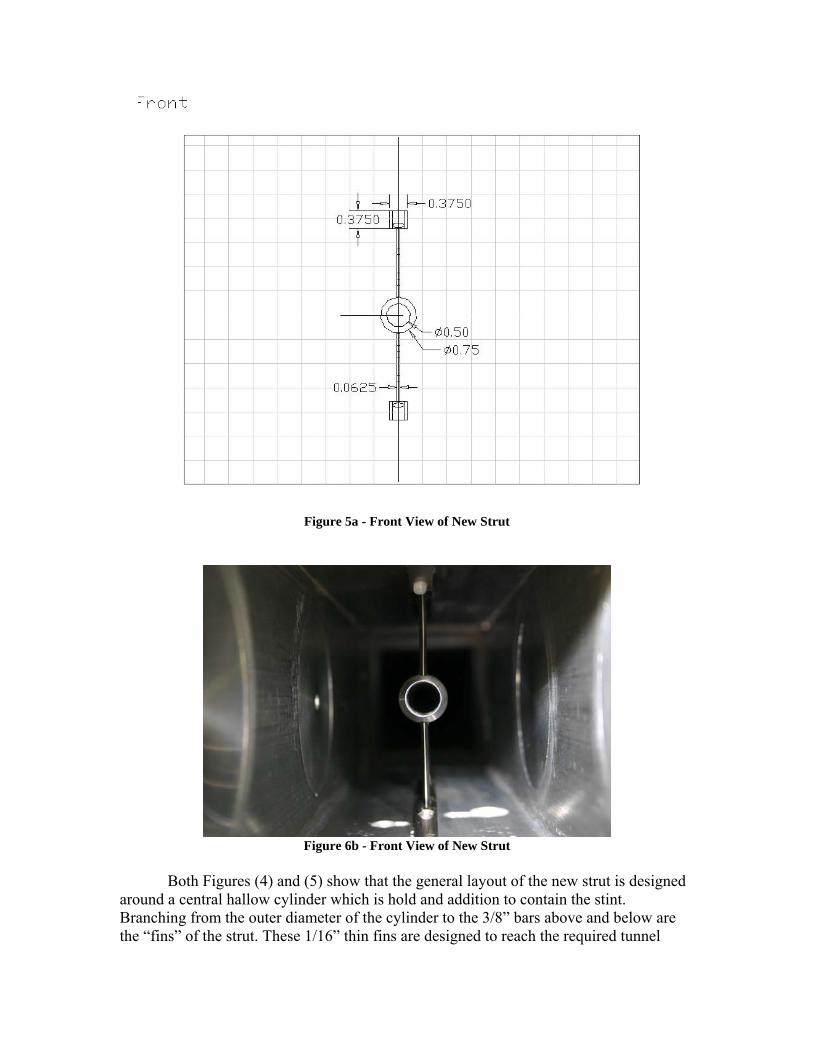
Figure 5a - Front View of New Strut
Figure 6b - Front View of New Strut
Both Figures (4) and (5) show that the general layout of the new strut is designed
around a central hallow cylinder which is hold and addition to contain the stint. Branching from the outer diameter of the cylinder to the 3/8” bars above and below are the “fins” of the strut. These 1/16” thin fins are designed to reach the required tunnel

Mach number of 0.75 and, due to the area relationship requirement, are extremely thin. From Figure (4), notice that four holes are meant to be drilled in the fins. These will allow for pieces of variable thickness to be added to the fins at a later time and thus to create varying Mach numbers in the test section. The fins are swept back at a 30 degree angle to allow for a smoother transition of the flow or simply to reduce any undo disturbances. Finally in order to securely attach the new strut to the upper and lower tunnel walls, the 3/8” rectangles are created. These will allow for the fins to be properly tensioned and for the strut to fit securely in the 4.32” tall test section.
As part of the idea of varying the geometry of the fins, this new strut needs to be accessible from outside the tunnel without too much disassembly of the tunnel itself. Therefore, in relation to the tunnel, the new strut can be reached through a set of side panels as seen in Figure (6).
Figure 7a - New Strut in Tunnel (Right)
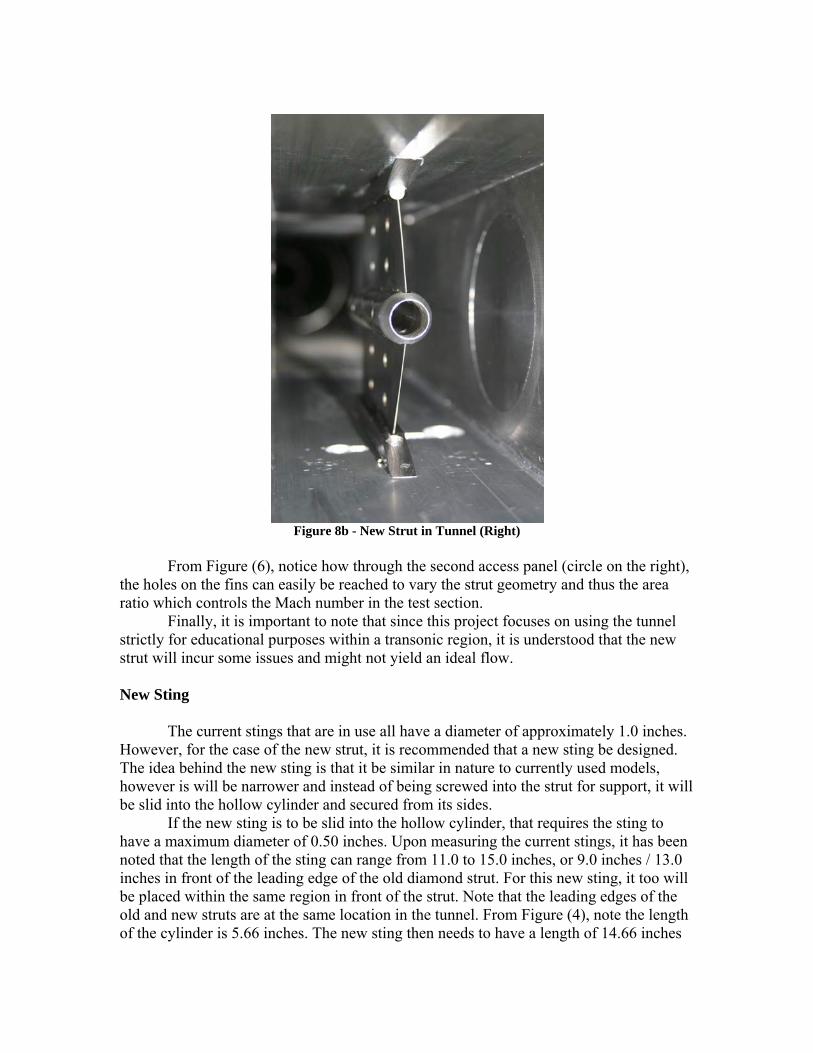
Figure 8b - New Strut in Tunnel (Right)
From Figure (6), notice how through the second access panel (circle on the right), the holes on the fins can easily be reached to vary the strut geometry and thus the area ratio which controls the Mach number in the test section. Finally, it is important to note that since this project focuses on using the tunnel strictly for educational purposes within a transonic region, it is understood that the new strut will incur some issues and might not yield an ideal flow.
New Sting The current stings that are in use all have a diameter of approximately 1.0 inches. However, for the case of the new strut, it is recommended that a new sting be designed. The idea behind the new sting is that it be similar in nature to currently used models, however is will be narrower and instead of being screwed into the strut for support, it will be slid into the hollow cylinder and secured from its sides. If the new sting is to be slid into the hollow cylinder, that requires the sting to have a maximum diameter of 0.50 inches. Upon measuring the current stings, it has been noted that the length of the sting can range from 11.0 to 15.0 inches, or 9.0 inches / 13.0 inches in front of the leading edge of the old diamond strut. For this new sting, it too will be placed within the same region in front of the strut. Note that the leading edges of the old and new struts are at the same location in the tunnel. From Figure (4), note the length of the cylinder is 5.66 inches. The new sting then needs to have a length of 14.66 inches
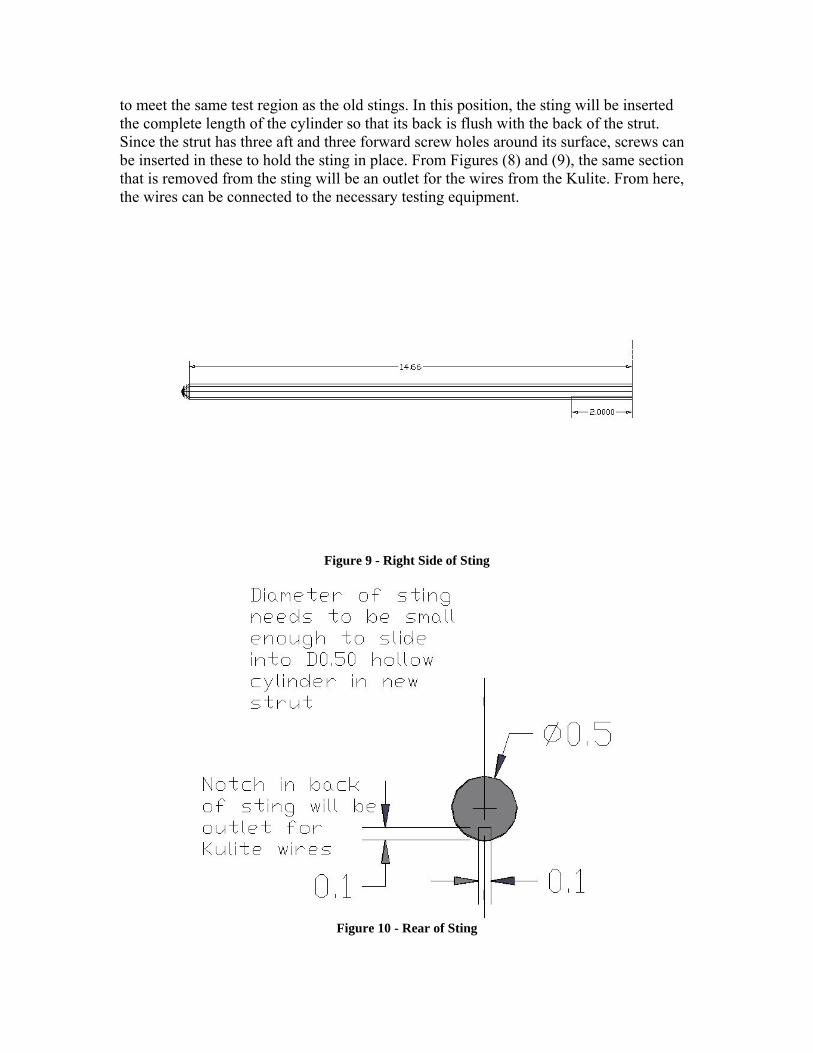
to meet the same test region as the old stings. In this position, the sting will be inserted the complete length of the cylinder so that its back is flush with the back of the strut. Since the strut has three aft and three forward screw holes around its surface, screws can be inserted in these to hold the sting in place. From Figures (8) and (9), the same section that is removed from the sting will be an outlet for the wires from the Kulite. From here, the wires can be connected to the necessary testing equipment.
Figure 9 - Right Side of Sting
Figure 10 - Rear of Sting
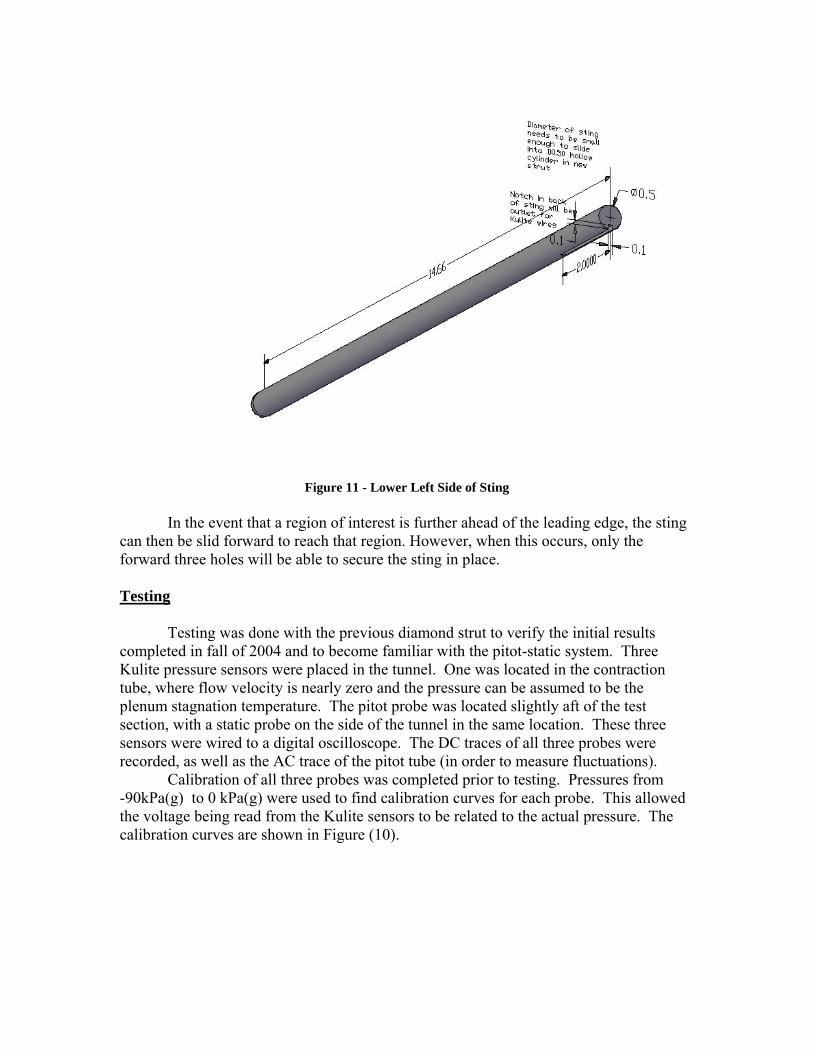
Figure 11 - Lower Left Side of Sting
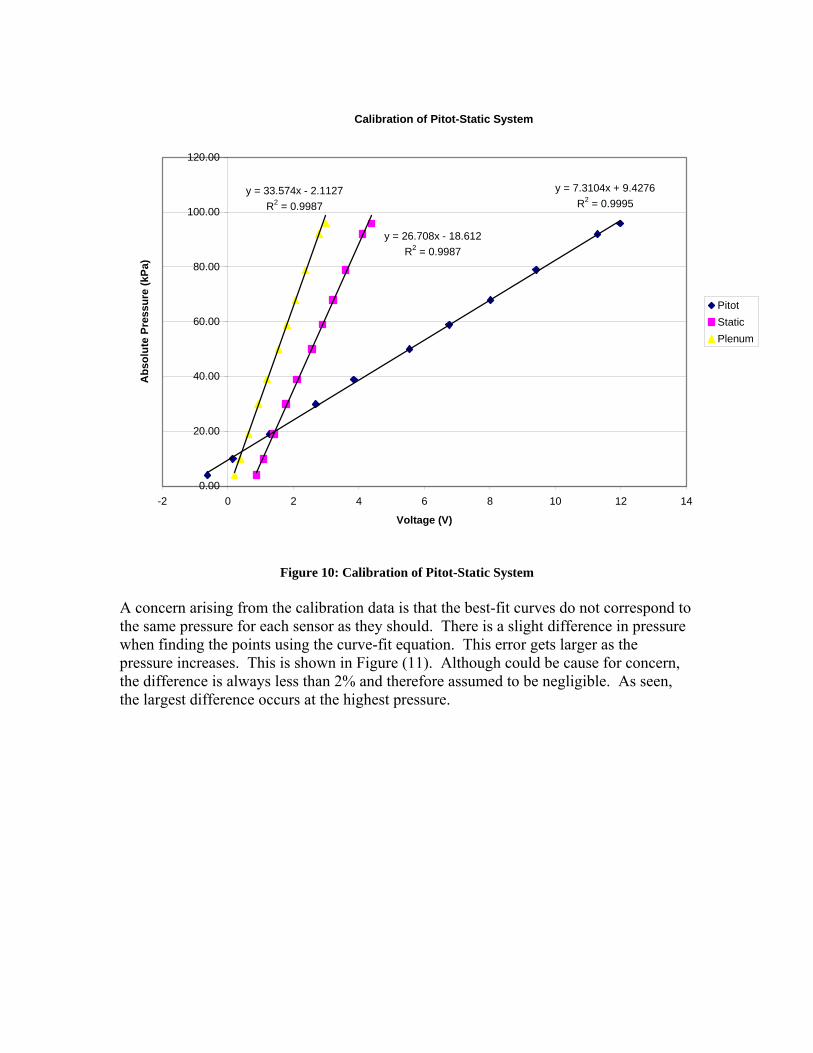
In the event that a region of interest is further ahead of the leading edge, the sting can then be slid forward to reach that region. However, when this occurs, only the forward three holes will be able to secure the sting in place. Testing Testing was done with the previous diamond strut to verify the initial results completed in fall of 2004 and to become familiar with the pitot-static system. Three Kulite pressure sensors were placed in the tunnel. One was located in the contraction tube, where flow velocity is nearly zero and the pressure can be assumed to be the plenum stagnation temperature. The pitot probe was located slightly aft of the test section, with a static probe on the side of the tunnel in the same location. These three sensors were wired to a digital oscilloscope. The DC traces of all three probes were recorded, as well as the AC trace of the pitot tube (in order to measure fluctuations). Calibration of all three probes was completed prior to testing. Pressures from -90kPa(g) to 0 kPa(g) were used to find calibration curves for each probe. This allowed the voltage being read from the Kulite sensors to be related to the actual pressure. The calibration curves are shown in Figure (10).
Calibration of Pitot-Static System
y = 33.574x - 2.1127R2 = 0.9987
y = 26.708x - 18.612R2 = 0.9987
y = 7.3104x + 9.4276R2 = 0.9995
0.00
20.00
40.00
60.00
80.00
100.00
120.00
-2 0 2 4 6 8 10 12 14
Voltage (V)
Abs
olut
e Pr
essu
re (k
Pa)
PitotStaticPlenum
Figure 10: Calibration of Pitot-Static System
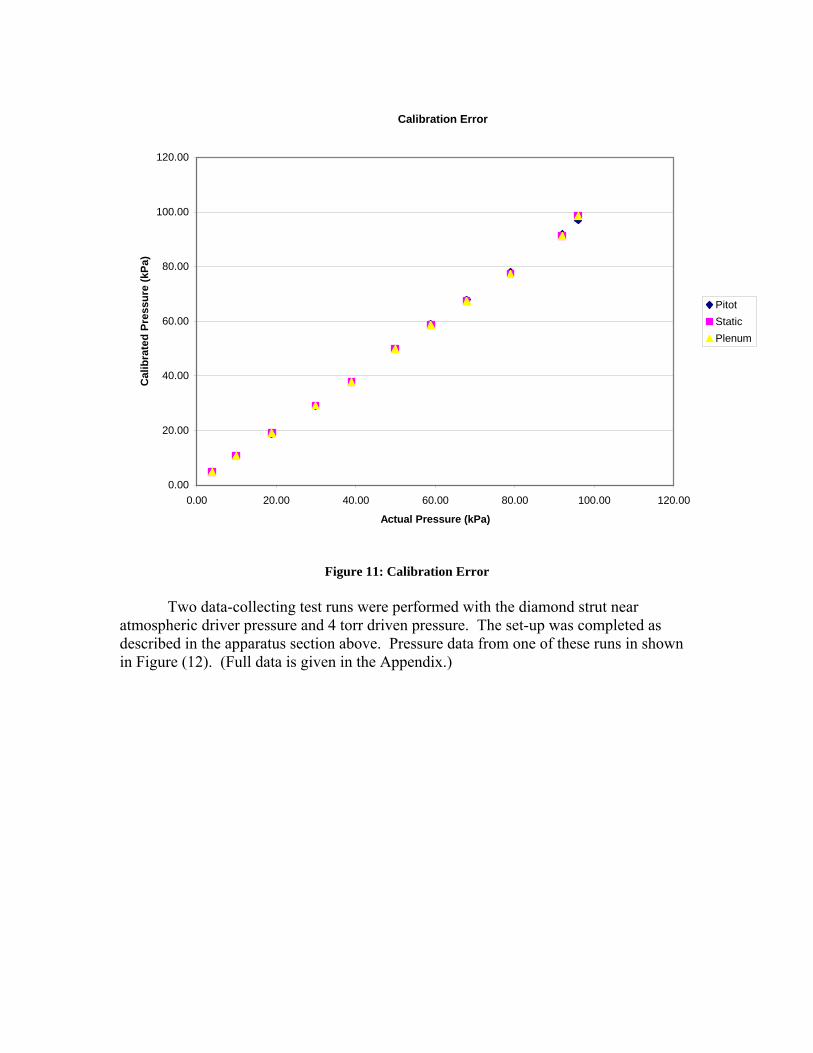
A concern arising from the calibration data is that the best-fit curves do not correspond to the same pressure for each sensor as they should. There is a slight difference in pressure when finding the points using the curve-fit equation. This error gets larger as the pressure increases. This is shown in Figure (11). Although could be cause for concern, the difference is always less than 2% and therefore assumed to be negligible. As seen, the largest difference occurs at the highest pressure.
Calibration Error
0.00
20.00
40.00
60.00
80.00
100.00
120.00
0.00 20.00 40.00 60.00 80.00 100.00 120.00
Actual Pressure (kPa)
Cal
ibra
ted
Pres
sure
(kPa
)
PitotStaticPlenum
Figure 11: Calibration Error
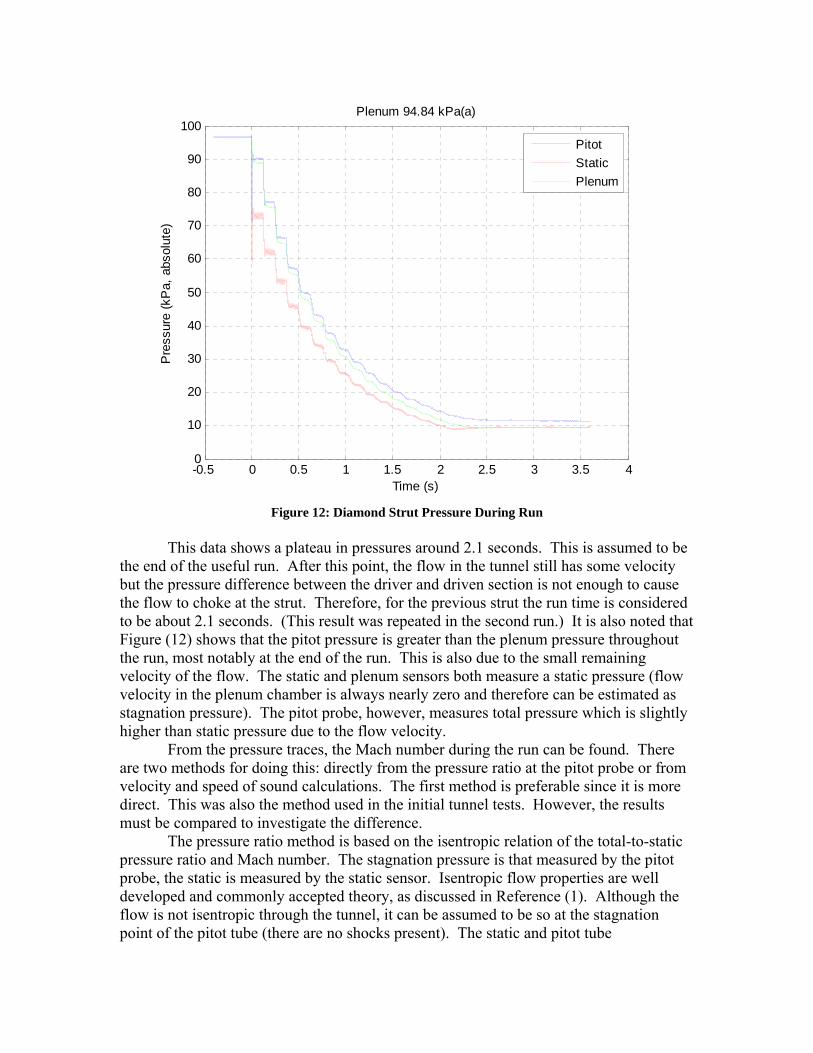
Two data-collecting test runs were performed with the diamond strut near atmospheric driver pressure and 4 torr driven pressure. The set-up was completed as described in the apparatus section above. Pressure data from one of these runs in shown in Figure (12). (Full data is given in the Appendix.)
-0.5 0 0.5 1 1.5 2 2.5 3 3.5 40
10
20
30
40
50
60
70
80
90
100
Time (s)
Pre
ssur
e (k
Pa,
abs
olut
e)
Plenum 94.84 kPa(a)
PitotStaticPlenum
Figure 12: Diamond Strut Pressure During Run
This data shows a plateau in pressures around 2.1 seconds. This is assumed to be the end of the useful run. After this point, the flow in the tunnel still has some velocity but the pressure difference between the driver and driven section is not enough to cause the flow to choke at the strut. Therefore, for the previous strut the run time is considered to be about 2.1 seconds. (This result was repeated in the second run.) It is also noted that Figure (12) shows that the pitot pressure is greater than the plenum pressure throughout the run, most notably at the end of the run. This is also due to the small remaining velocity of the flow. The static and plenum sensors both measure a static pressure (flow velocity in the plenum chamber is always nearly zero and therefore can be estimated as stagnation pressure). The pitot probe, however, measures total pressure which is slightly higher than static pressure due to the flow velocity. From the pressure traces, the Mach number during the run can be found. There are two methods for doing this: directly from the pressure ratio at the pitot probe or from velocity and speed of sound calculations. The first method is preferable since it is more direct. This was also the method used in the initial tunnel tests. However, the results must be compared to investigate the difference.
The pressure ratio method is based on the isentropic relation of the total-to-static pressure ratio and Mach number. The stagnation pressure is that measured by the pitot probe, the static is measured by the static sensor. Isentropic flow properties are well developed and commonly accepted theory, as discussed in Reference (1). Although the flow is not isentropic through the tunnel, it can be assumed to be so at the stagnation point of the pitot tube (there are no shocks present). The static and pitot tube
measurements are used to find Mach number from Equation (2), repeated below. The specific heat ratio, γ, is taken to be 1.4 for the air in the tunnel.
1
2 011
1
2 11
pMp
γγ
γ
−⎡ ⎤⎛ ⎞⎢ ⎥= −⎜ ⎟⎢ ⎥− ⎝ ⎠⎣ ⎦
(2)
The second method uses the pitot measurement to find velocity, and then uses the speed of sound calculated from the air temperature to find the Mach number. These are shown in Equations (3)-(5).
02( )SP PV
a RTVMa
ρ
γ
∞
∞
−=
=
=
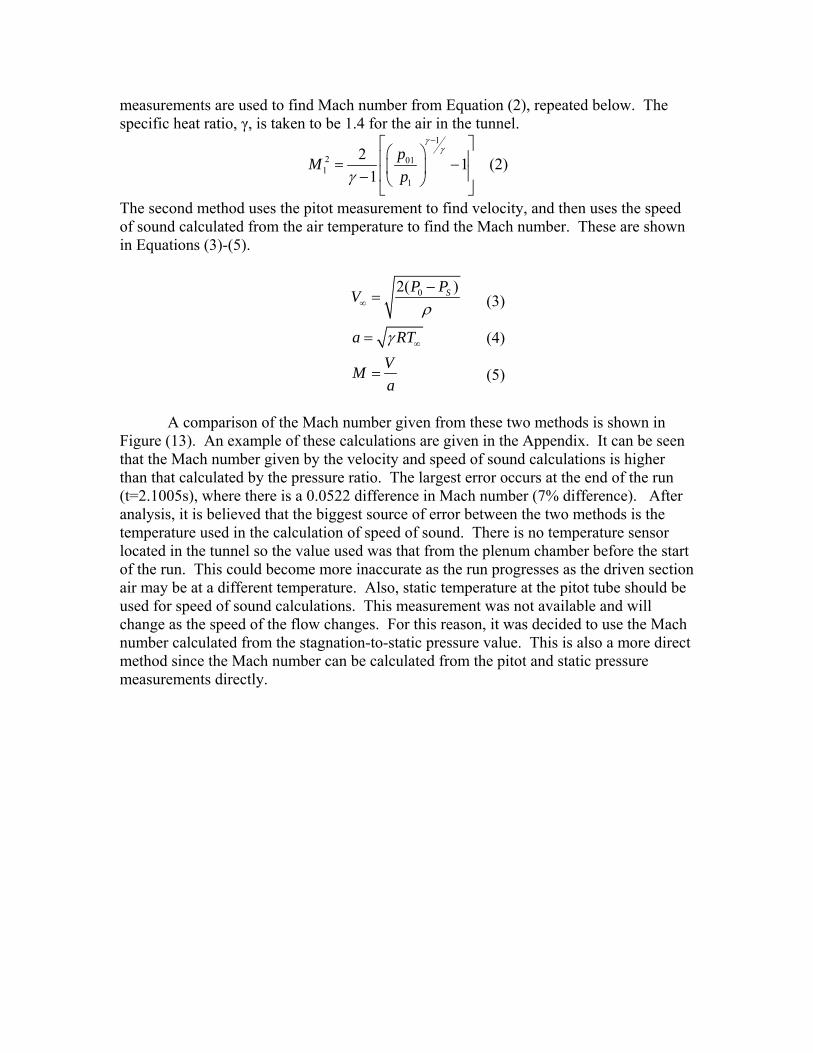
A comparison of the Mach number given from these two methods is shown in Figure (13). An example of these calculations are given in the Appendix. It can be seen that the Mach number given by the velocity and speed of sound calculations is higher than that calculated by the pressure ratio. The largest error occurs at the end of the run (t=2.1005s), where there is a 0.0522 difference in Mach number (7% difference). After analysis, it is believed that the biggest source of error between the two methods is the temperature used in the calculation of speed of sound. There is no temperature sensor located in the tunnel so the value used was that from the plenum chamber before the start of the run. This could become more inaccurate as the run progresses as the driven section air may be at a different temperature. Also, static temperature at the pitot tube should be used for speed of sound calculations. This measurement was not available and will change as the speed of the flow changes. For this reason, it was decided to use the Mach number calculated from the stagnation-to-static pressure value. This is also a more direct method since the Mach number can be calculated from the pitot and static pressure measurements directly.
(3) (4) (5)
-0.5 0 0.5 1 1.5 2 2.5 3 3.5 40
0.1
0.2
0.3
0.4
0.5
0.6
0.7
0.8Mach Number
Time (s)
Mac
h N
umbe
r
From Po/PFrom V and a
Figure 123: Comparison of Mach Number Calculation Methods
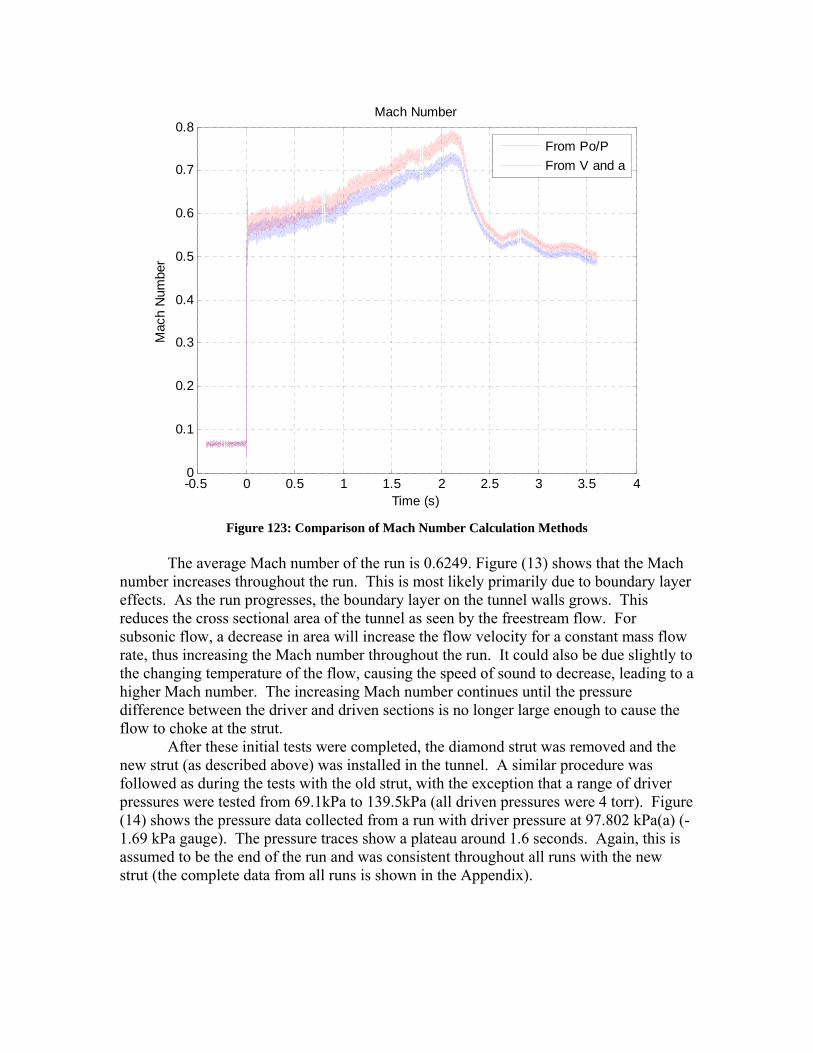
The average Mach number of the run is 0.6249. Figure (13) shows that the Mach number increases throughout the run. This is most likely primarily due to boundary layer effects. As the run progresses, the boundary layer on the tunnel walls grows. This reduces the cross sectional area of the tunnel as seen by the freestream flow. For subsonic flow, a decrease in area will increase the flow velocity for a constant mass flow rate, thus increasing the Mach number throughout the run. It could also be due slightly to the changing temperature of the flow, causing the speed of sound to decrease, leading to a higher Mach number. The increasing Mach number continues until the pressure difference between the driver and driven sections is no longer large enough to cause the flow to choke at the strut. After these initial tests were completed, the diamond strut was removed and the new strut (as described above) was installed in the tunnel. A similar procedure was followed as during the tests with the old strut, with the exception that a range of driver pressures were tested from 69.1kPa to 139.5kPa (all driven pressures were 4 torr). Figure (14) shows the pressure data collected from a run with driver pressure at 97.802 kPa(a) (-1.69 kPa gauge). The pressure traces show a plateau around 1.6 seconds. Again, this is assumed to be the end of the run and was consistent throughout all runs with the new strut (the complete data from all runs is shown in the Appendix).
-0.5 0 0.5 1 1.5 2 2.5 3 3.5 40
10
20
30
40
50
60
70
80
90
100
Time (s)
Pre
ssur
e (k
Pa,
abs
olut
e)
Plenum 97.802 kPa(a)
PitotStaticPlenum
Figure 134: New Strut Pressure During Run
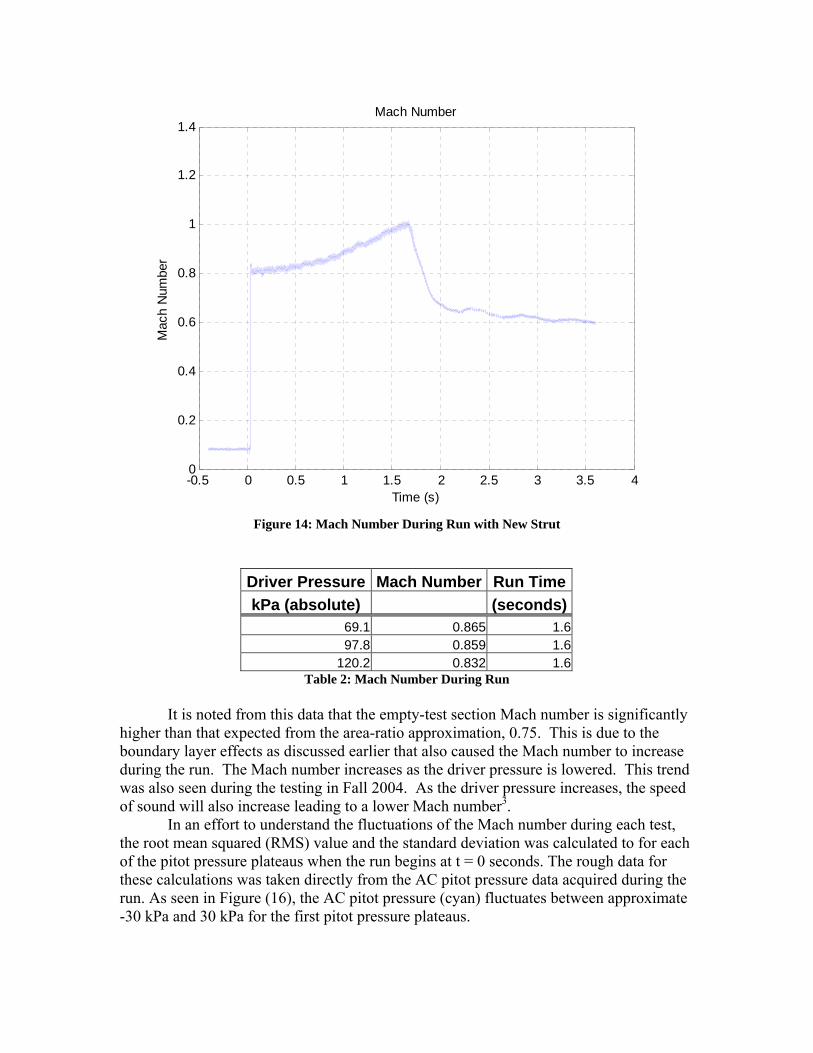
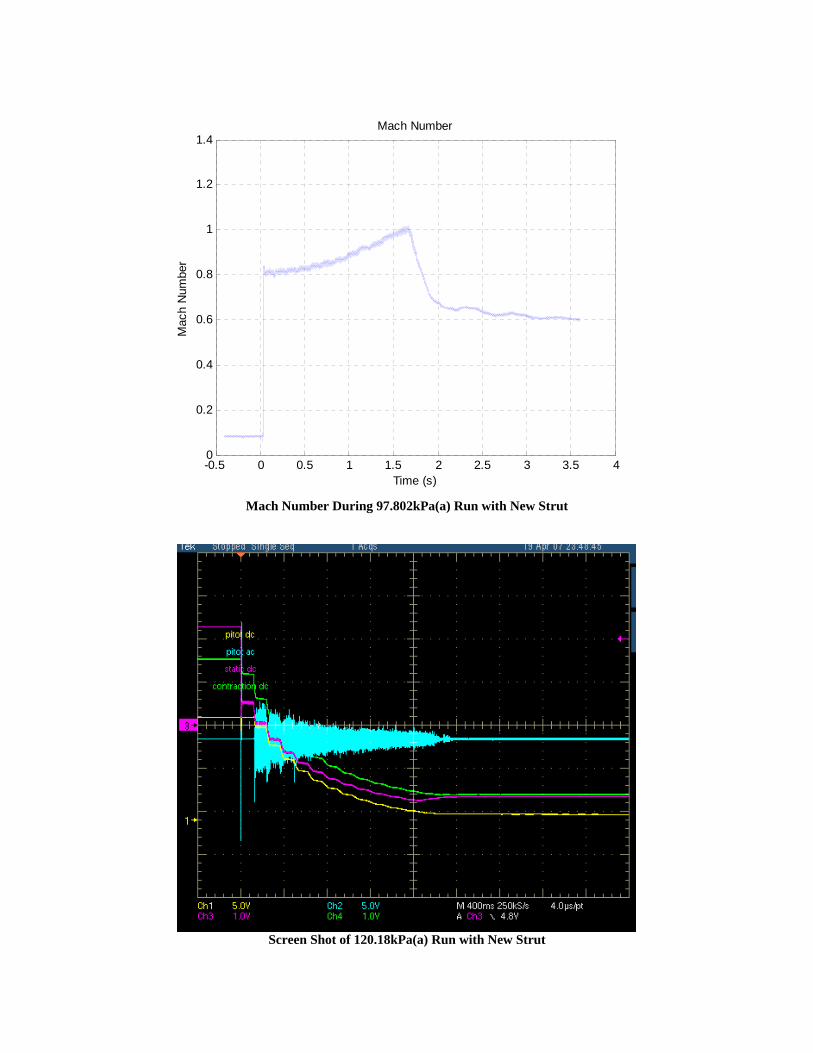
The Mach number during the run with the new strut was calculated using the total-to-static pressure ratio from the pitot and static probes using the isentropic flow property as done above. The Mach number during the run is shown in Figure (15) below. The average Mach number during the 1.6 seconds of run time at this pressure was 0.859. This trace shows that near the end of the run, the flow reached sonic speed at the pitot tube (maximum Mach number was 1.01). This was unexpected as the area of the pitot tube was 0.72in2 and the area of the strut was 0.90in2. These dimensions lead to a smaller throat area at the strut, where the flow should choke. The boundary layer from the walls should be larger at the strut which is further aft in the flow. The sonic condition at the throat needs to be further investigated to determine the cause. The one-dimensional flow theory used to investigate this problem is not sufficient to explain this phenomenon. One possible solution for future measurements would be to create wall contours at the pitot tube to negate the wall effects (similar to the ones to be used for the airfoil tests). This would allow for a more accurate measurement of Mach number without boundary layer effects, which would prevent the flow from choking. Table (2) shows the average run Mach number for each driver pressure tested. Driven pressure was set at 4 torr for each run.
-0.5 0 0.5 1 1.5 2 2.5 3 3.5 40
0.2
0.4
0.6
0.8
1
1.2
1.4Mach Number
Time (s)
Mac
h N
umbe
r
Figure 14: Mach Number During Run with New Strut
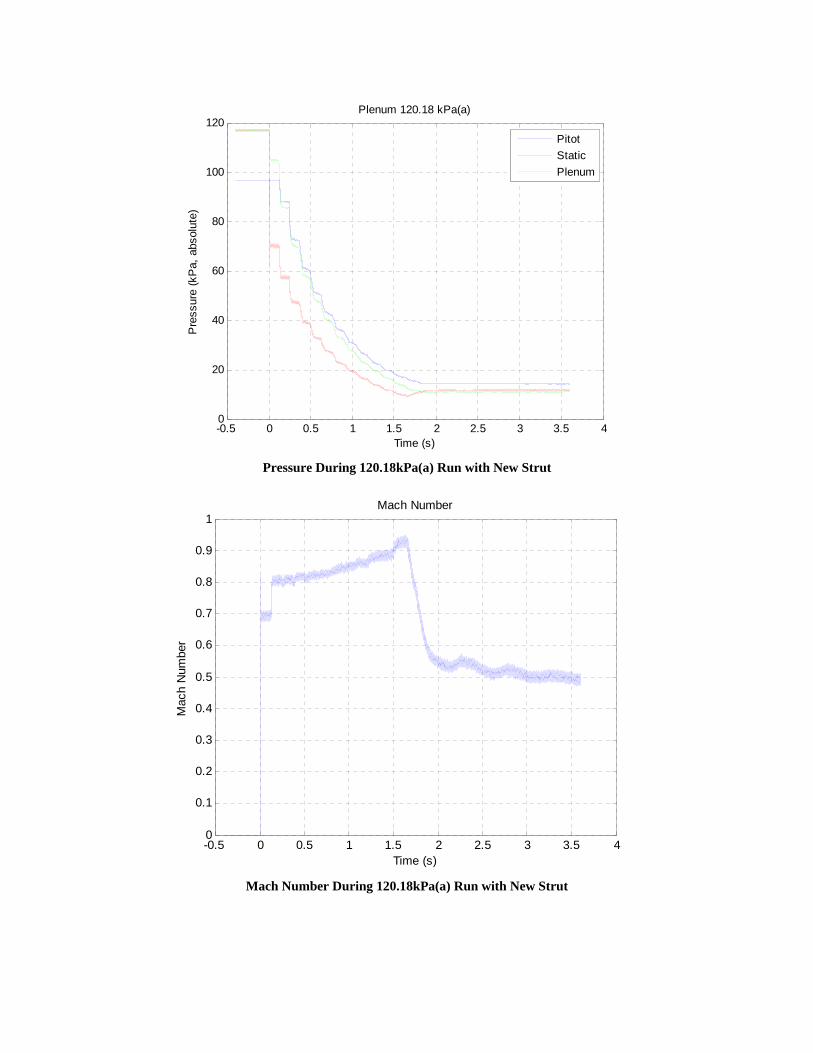
Driver Pressure Mach Number Run TimekPa (absolute) (seconds)
69.1 0.865 1.6 97.8 0.859 1.6
120.2 0.832 1.6 Table 2: Mach Number During Run
It is noted from this data that the empty-test section Mach number is significantly higher than that expected from the area-ratio approximation, 0.75. This is due to the boundary layer effects as discussed earlier that also caused the Mach number to increase during the run. The Mach number increases as the driver pressure is lowered. This trend was also seen during the testing in Fall 2004. As the driver pressure increases, the speed of sound will also increase leading to a lower Mach number3.
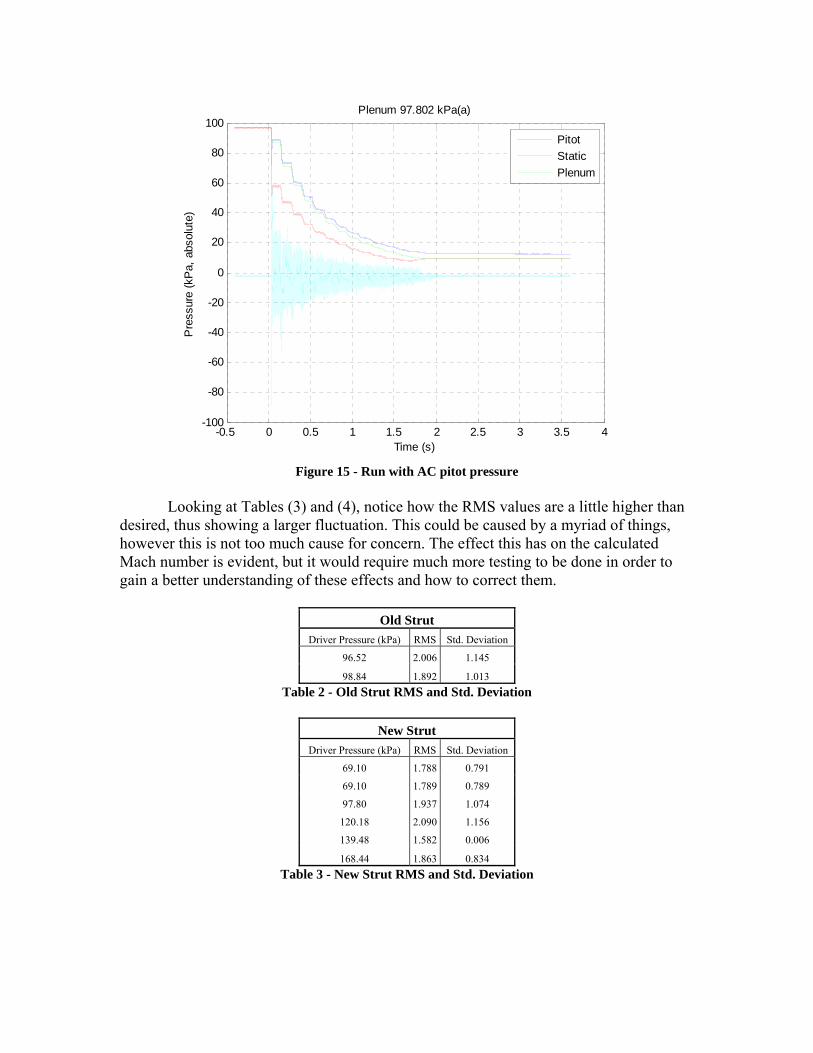
In an effort to understand the fluctuations of the Mach number during each test, the root mean squared (RMS) value and the standard deviation was calculated to for each of the pitot pressure plateaus when the run begins at t = 0 seconds. The rough data for these calculations was taken directly from the AC pitot pressure data acquired during the run. As seen in Figure (16), the AC pitot pressure (cyan) fluctuates between approximate -30 kPa and 30 kPa for the first pitot pressure plateaus.
-0.5 0 0.5 1 1.5 2 2.5 3 3.5 4-100
-80
-60
-40
-20
0
20
40
60
80
100
Time (s)
Pre
ssur
e (k
Pa,
abs
olut
e)
Plenum 97.802 kPa(a)
PitotStaticPlenum
Figure 15 - Run with AC pitot pressure
Looking at Tables (3) and (4), notice how the RMS values are a little higher than
desired, thus showing a larger fluctuation. This could be caused by a myriad of things, however this is not too much cause for concern. The effect this has on the calculated Mach number is evident, but it would require much more testing to be done in order to gain a better understanding of these effects and how to correct them.
Old Strut
Driver Pressure (kPa) RMS Std. Deviation
96.52 2.006 1.145
98.84 1.892 1.013 Table 2 - Old Strut RMS and Std. Deviation
New Strut
Driver Pressure (kPa) RMS Std. Deviation
69.10 1.788 0.791
69.10 1.789 0.789
97.80 1.937 1.074
120.18 2.090 1.156
139.48 1.582 0.006
168.44 1.863 0.834 Table 3 - New Strut RMS and Std. Deviation
Discussion and Conclusion The purpose of this project was to design a new strut that allows students to study the transonic regime in the 12-inch Ludwieg tube tunnel. The test results using the previous diamond strut confirmed that the flow in the test section was not maintaining transonic speed. The average Mach number during the run with the old strut found to be 0.6249. By designing a new strut with a smaller cross sectional area, the area of the throat was increased, leading to a higher test section Mach number. This was confirmed in the tests, where an average Mach number of 0.85 was achieved (depending on the initial driver pressure).
With the first round of experimentation of the redesigned strut completed, there is time to be pleased with the results that it has provided but also further questions have arisen. It is safe to say that the redesigned strut accomplished the overall goal of allowing for the test section of provide transonic scenarios that can be easily repeated. This fact alone means that the option for this to be used as an educational experiment for undergraduates it feasible. However, questions still remain in the analysis of the data acquired during these experiments. As more and more analysis is done, it becomes obvious that these questions are not always simply answered. Particularly puzzling is the variation in the Mach number over the run. Due to the fact that only the pitot and static pressures are being measured could result in this error, or does temperature have a large enough effect on these measurement to warrant the development of a method to measure that as well during a run. It could even been argued that trying to find out when the run starts and stops could be another valuable topic of further research. Whatever the case is there is still more than can be researched regarding this transonic tunnel. A segue from this idea, brings light onto the future work that can be done with the tunnel. As mentioned above there are more and more areas of the tunnel operations that can and most likely should be researched further. However, if the primary goal of this project was simply to create an operational tunnel to teach students about transonic flow the next steps would ideally be in the creation of the pieces of variable geometry that can be added to the tunnel fins to adjust the Mach number. Similarly, the final design and building of the new sting would be beneficial for data acquisition in future runs. These two steps alone are a large undertaking, yet they most likely will provide the most value in an educational aspect. On a final note, it is satisfying to discover that the redesigned strut preformed very close to how it was designed. That alone extols confidence in the understanding of how this tunnel works and the importance of experimental aerodynamics. This project has provided a unique stepping stone into understanding the region of transonic aerodynamics, something that very few students are able to work with at the undergraduate level. It has been a great learning experience and hopefully future students can benefit from this work and continue forward with it.
References (1) Anderson, John D. Jr. Fundamentals of Aerodynamics. McGraw-Hill, New
York, 2001. pp. 566-584.
(2) Borg, Matt. “Instructions on Use of Purdue Mach 4/Transonic Ludwieg Tube.” Purdue University. 3/29/2005.
(3) Wilhelm, Tyler. “Conversion of Purdue’s Mach-4 Ludwieg Tube to a Transonic
Educational Facility.” Purdue University. 12/12/2004.
(4) “Nozzle Test Section Drawings Mach 4 Ludwieg Tube.”
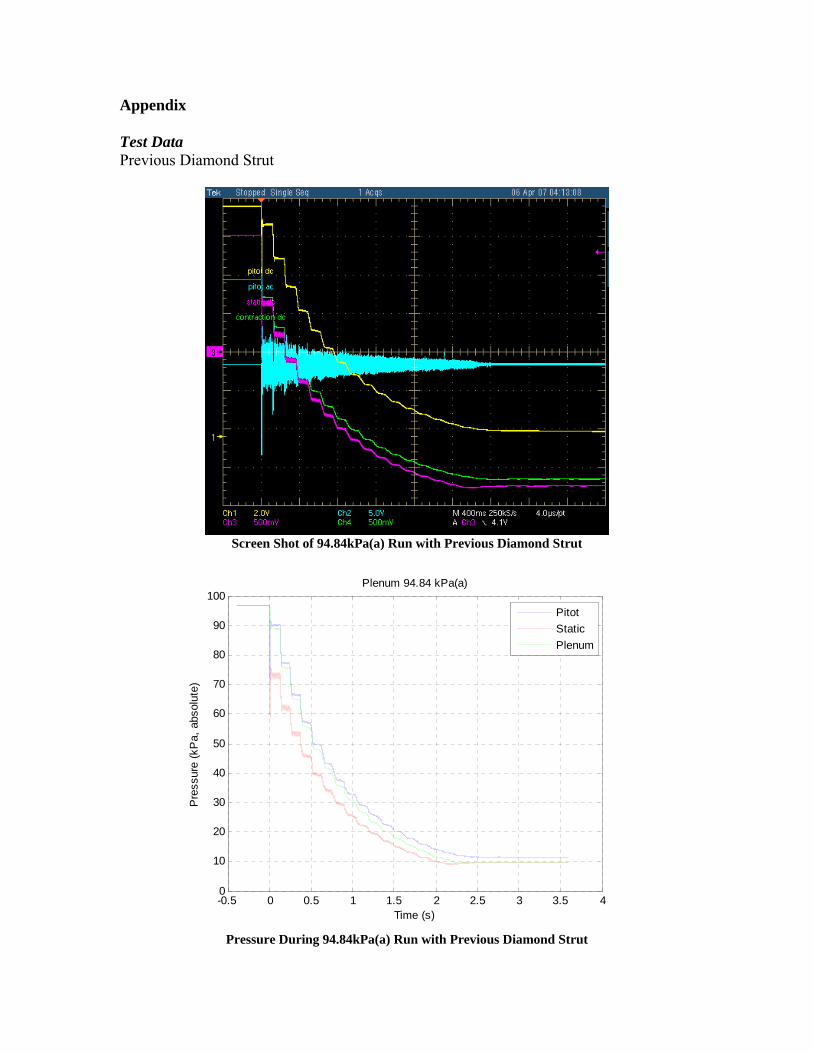
Appendix Test Data Previous Diamond Strut
Screen Shot of 94.84kPa(a) Run with Previous Diamond Strut
-0.5 0 0.5 1 1.5 2 2.5 3 3.5 40
10
20
30
40
50
60
70
80
90
100
Time (s)
Pre
ssur
e (k
Pa,
abs
olut
e)
Plenum 94.84 kPa(a)
PitotStaticPlenum
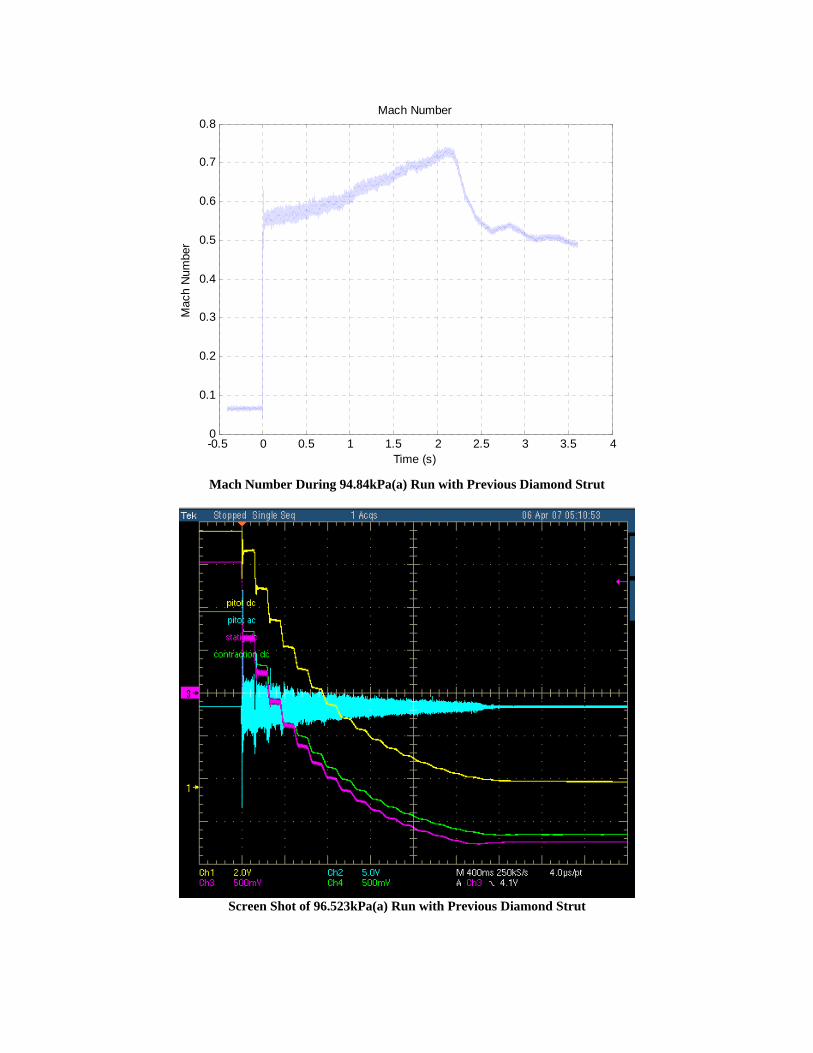
Pressure During 94.84kPa(a) Run with Previous Diamond Strut
-0.5 0 0.5 1 1.5 2 2.5 3 3.5 40
0.1
0.2
0.3
0.4
0.5
0.6
0.7
0.8Mach Number
Time (s)
Mac
h N
umbe
r
Mach Number During 94.84kPa(a) Run with Previous Diamond Strut
Screen Shot of 96.523kPa(a) Run with Previous Diamond Strut
-0.5 0 0.5 1 1.5 2 2.5 3 3.5 40
10
20
30
40
50
60
70
80
90
100
Time (s)
Pre
ssur
e (k
Pa,
abs
olut
e)
Plenum 96.523 kPa(a)
PitotStaticPlenum
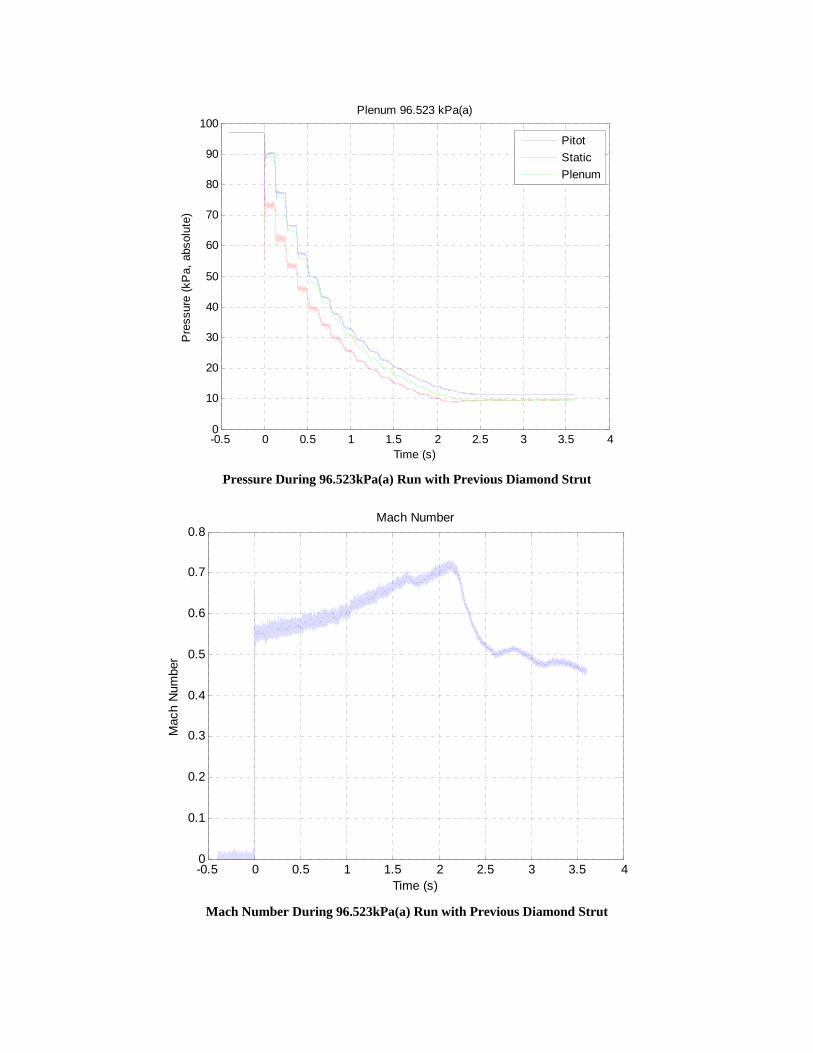
Pressure During 96.523kPa(a) Run with Previous Diamond Strut
-0.5 0 0.5 1 1.5 2 2.5 3 3.5 40
0.1
0.2
0.3
0.4
0.5
0.6
0.7
0.8Mach Number
Time (s)
Mac
h N
umbe
r
Mach Number During 96.523kPa(a) Run with Previous Diamond Strut
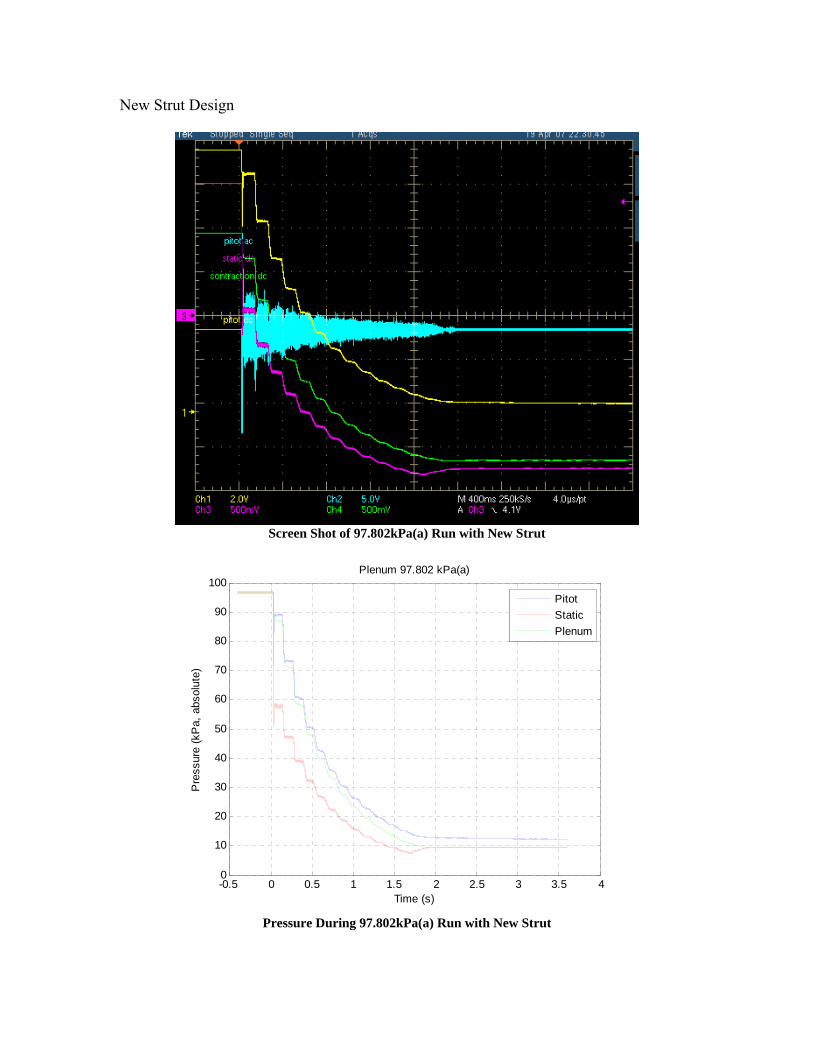
New Strut Design
Screen Shot of 97.802kPa(a) Run with New Strut
-0.5 0 0.5 1 1.5 2 2.5 3 3.5 40
10
20
30
40
50
60
70
80
90
100
Time (s)
Pre
ssur
e (k
Pa,
abs
olut
e)
Plenum 97.802 kPa(a)
PitotStaticPlenum
Pressure During 97.802kPa(a) Run with New Strut
-0.5 0 0.5 1 1.5 2 2.5 3 3.5 40
0.2
0.4
0.6
0.8
1
1.2
1.4Mach Number
Time (s)
Mac
h N
umbe
r
Mach Number During 97.802kPa(a) Run with New Strut
Screen Shot of 120.18kPa(a) Run with New Strut
-0.5 0 0.5 1 1.5 2 2.5 3 3.5 40
20
40
60
80
100
120
Time (s)
Pre
ssur
e (k
Pa,
abs
olut
e)
Plenum 120.18 kPa(a)
PitotStaticPlenum
Pressure During 120.18kPa(a) Run with New Strut
-0.5 0 0.5 1 1.5 2 2.5 3 3.5 40
0.1
0.2
0.3
0.4
0.5
0.6
0.7
0.8
0.9
1Mach Number
Time (s)
Mac
h N
umbe
r
Mach Number During 120.18kPa(a) Run with New Strut
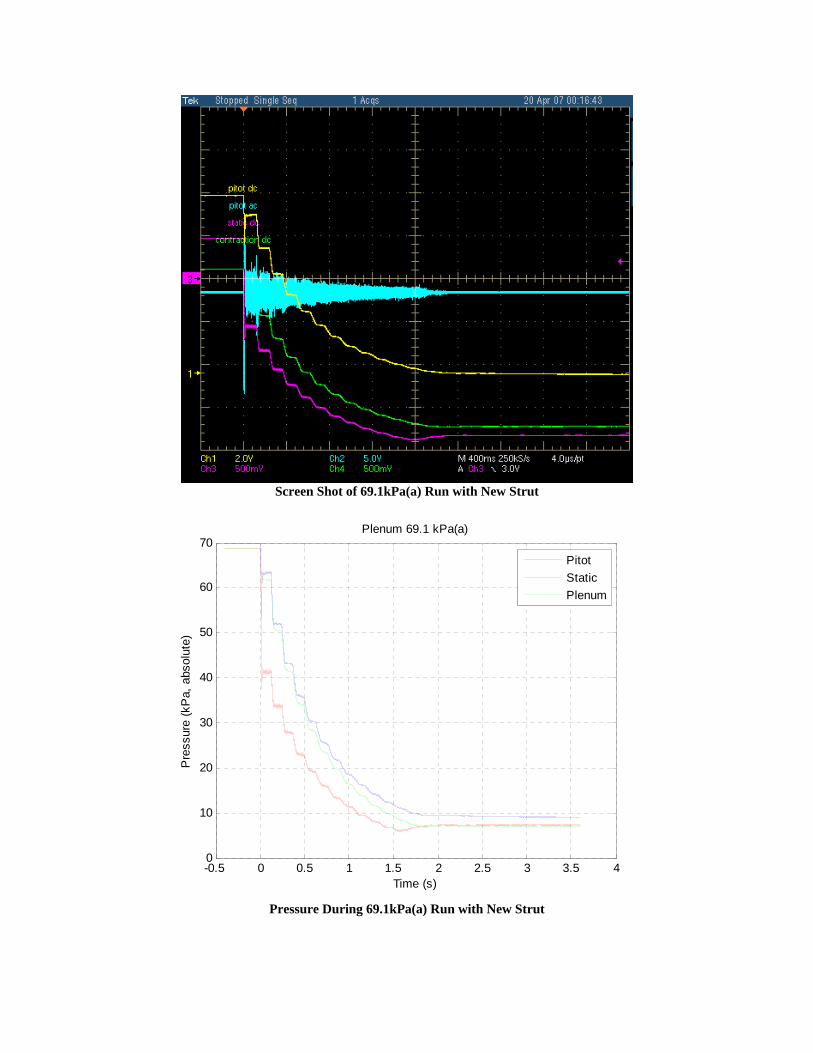
Screen Shot of 69.1kPa(a) Run with New Strut
-0.5 0 0.5 1 1.5 2 2.5 3 3.5 40
10
20
30
40
50
60
70
Time (s)
Pre
ssur
e (k
Pa,
abs
olut
e)
Plenum 69.1 kPa(a)
PitotStaticPlenum
Pressure During 69.1kPa(a) Run with New Strut
-0.5 0 0.5 1 1.5 2 2.5 3 3.5 40.1
0.2
0.3
0.4
0.5
0.6
0.7
0.8
0.9
1
1.1Mach Number
Time (s)
Mac
h N
umbe
r
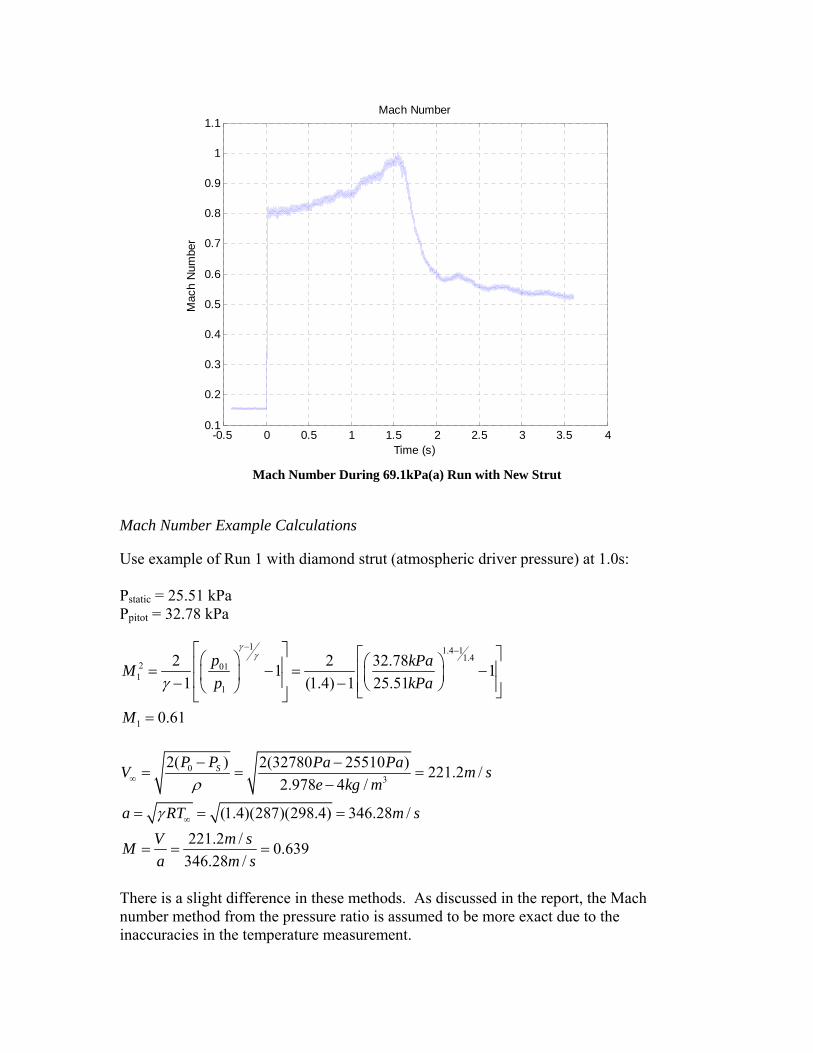
Mach Number During 69.1kPa(a) Run with New Strut
Mach Number Example Calculations
Use example of Run 1 with diamond strut (atmospheric driver pressure) at 1.0s: Pstatic = 25.51 kPa Ppitot = 32.78 kPa
03
2( ) 2(32780 25510 ) 221.2 /2.978 4 /
(1.4)(287)(298.4) 346.28 /221.2 / 0.639
346.28 /
SP P Pa PaV m se kg m
a RT m sV m sMa m s
ρ
γ
∞
∞
− −= = =
−
= = =
= = =
There is a slight difference in these methods. As discussed in the report, the Mach number method from the pressure ratio is assumed to be more exact due to the inaccuracies in the temperature measurement.
1 1.4 11.4
2 011
1
1
2 2 32.781 11 (1.4) 1 25.51
0.61
p kPaMp kPa
M
γγ
γ
− −⎡ ⎤ ⎡ ⎤⎛ ⎞ ⎛ ⎞⎢ ⎥ ⎢ ⎥= − = −⎜ ⎟ ⎜ ⎟⎢ ⎥− − ⎝ ⎠⎢ ⎥⎝ ⎠ ⎣ ⎦⎣ ⎦=
Literature Review: This group’s project is directed toward the conversion of the Mach 4 Ludwieg Tunnel into a transonic tunnel. Specifically, the group is focusing on the design and implementation of a strut that will produce a transonic flow in the test section of approximately Mach=0.76. Therefore the focus of the literature review will be based upon gaining a better understanding of previous results from another tunnel conversion, the theory behind designing the strut and finally a focus on the operation of the tunnel itself. Together these sources provide an appropriate background unto how to approach this project. The first piece of literature dealt with a previous modification of a transonic test section. This piece provided an insight into issues experienced during the conversion and also introduced some issues concerning the real world results of the design in terms of its success in reaching the desired transonic flow requirements.
(1) Wilhelm, Tyler. “Conversion of Purdue’s Mach-4 Ludwieg Tube to a Transonic Educational Facility.” Purdue University. 12/12/2004.
This source describes fabrication and operation of the transonic facility as
modified from the original Mach-4 tunnel design. The initial test results given in this report are of importance to this project. The conclusion of this report states that contoured insert section of the transonic facility was designed to create a freestream test section Mach number of 0.772. According to the initial trials, however, it was found that the average Mach number was around 0.540. It was determined that the difference was due to the flow choking at the downstream throat. Although the results of these tests have not been verified by more trials, numerous runs were done during the initial testing and the same results were achieved. It can also be shown theoretically that the current diamond-wedge strut only allows a Mach number of 0.52 in the throat if the flow is choked. It is because of these results that the goal of this project is to increase the test Mach number by decreasing the area of the downstream throat. The newly designed strut has a smaller area where the flow will choke, leading to a theoretical Mach number of 0.75 in the test section.
This second piece of literature could be considered to be the foundation of the
new strut design. The relationships describe here directly effected the design dimensions of the strut.
(2) Anderson, John D. Jr. Fundamentals of Aerodynamics. McGraw-Hill, New
York, 2001. pp. 566-584.
This source provided much of the background aerodynamic theory for the new strut design. For estimation purposes, the flow through the tunnel before the strut can be assumed to be one-dimensional isentropic flow. This allows for easy estimation of the flow Mach number based on the area ratio of the test section to that of the throat, according to the equation given in Anderson.
12 12
* 2
1 2 111 2
A MA M
γγγ
γ
+−⎡ ⎤−⎛ ⎞ ⎛ ⎞= +⎜ ⎟ ⎜ ⎟⎢ ⎥+⎝ ⎠ ⎝ ⎠⎣ ⎦
Using this theory, it can be found that to obtain a Mach number of 0.75 in the test section as desired, the total area ratio at the throat needs to be 1.063. This can be counted as a very credible source as it is an accurate and well accepted model of one-dimensional isentropic flow.
Finally, this last piece of literature is simply operating instructions for our specific
tunnel at Purdue. As both members of the team are new to operating the tunnel, this piece aided in our introduction to the tunnel and will remain an important piece of information throughout our testing.
(3) Borg, Matt. “Instructions on Use of Purdue Mach 4/Transonic Ludwieg Tube.”
Purdue University. 3/29/2005. This article is introduced the necessary topics of how to prepare to open the tunnel, opening and closing the tunnel, installing and preparing the diaphragm, how to operate the vacuum pumps to create a pressure differential and finally how the run the tunnel. The piece established the importance of understanding various pressure conditions of the tunnel through making notice of the various pressure readings. For instance, when opening the tunnel after a test it is imperative that the pressure gauge read at or slightly above atmospheric in order to make it a simpler to open the tunnel as well as to limit the amount of contaminated air that enters the tunnel once opened. Also of importance is how to prepare the diaphragm. Seeing as the diaphragm will be the control piece in maintaining a desired pressure differential, it is important to properly create and prepare the diaphragm so that the test will not begin prematurely. It is important to note the information regarding the placement of the wires along the diaphragm and to ensure that they do not cross one another to short the circuit. Furthermore, a faulty diaphragm or installation will either cause the diaphragm to break prematurely or not break at all when the operator sends the electric pulse to burst the diaphragm. Finally, this piece once again re-introduced the operations for pressuring the tunnel. All together this piece was a well detailed manual for our test purposes. Considering the scope of the project and it major focus of the design of the strut itself, one last piece of literature that was rather important were the design drawings for the Mach 6 tunnel. These drawings helped to establish a foundation in our strut design as well as aid the machinist in the fabrication of our strut.