helping teams use data for decision making · pdf filestudent information system ... precise...
TRANSCRIPT

Helping Teams Use Data for Decision Making
Idaho Positive Behavior Network ConferenceBoise State UniversityJanuary 19, 2018


PBISApps is run by Educational and Community Supports (ECS), a research
unit at the University of Oregon since 1977. Lead by Kent McIntosh, PhD,
ECS focuses on federal and state funded projects supporting research, teaching,
and technical assistance through the PBIS OSEP Technical Assistance Center.

Introductions
• To close performance gaps we need the right people to have the right data, at the right time, and in the right format (Gilbert, 1978)
Purpose
• Rationale for leaders to build comprehensive data and decision systems
• Behavior data for decision making
• Core features of data analysis or the “drill down” approach
Objectives

Considerations for School & District Teams
Using data to:
Be responsive leaders
Inform and set realistic school climate improvement goals
Illustrate progress toward those goals
Celebrate success and uncover needs
Avoid traps … access data you need…don’t drown in your data!

How many data systems do schools use?
Student Registration System
Behavior Data System
Cafeteria System
Bus System
Staff Evaluation System
Attendance System Academic Reporting System
Grade Reporting System
Scheduling System
Library System

There is a lot of data available!
Different users
Different needs
Different systems
How do we effectively glean the information we desire?

PBIS Conference…. Let’s focus on behavior
Most of our focus will be on behavior information… It is a PBIS conference after all
But feel free to raise questions about any of the other systems as we go

Information
People
Time
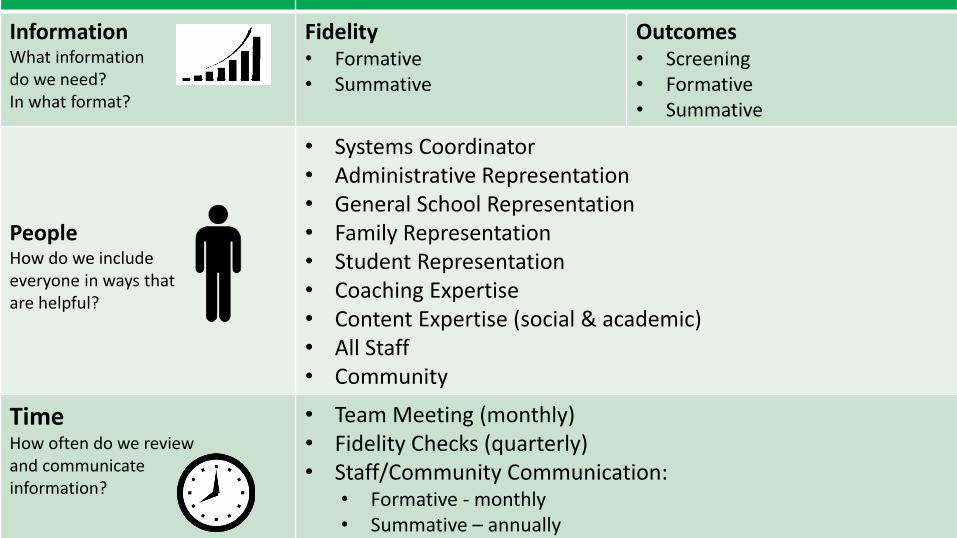
Session OrganizerInformationWhat informationdo we need? In what format?
Fidelity• Formative• Summative
Outcomes• Screening• Formative• Summative
PeopleHow do we includeeveryone in ways thatare helpful?
• Systems Coordinator• Administrative Representation• General School Representation• Family Representation• Student Representation • Coaching Expertise• Content Expertise (social & academic)• All Staff• Community
TimeHow often do we review and communicate information?
• Team Meeting (monthly) • Fidelity Checks (quarterly)• Staff/Community Communication:
• Formative - monthly• Summative – annually

Why use data for decision making?
Decisions are more likely to be effective and efficient
when they are based upon data.
The quality of decision making depends mostly upon the first step:
Defining the problem to be solved with precision and clarity

Why use data for decision making?
Data help place the “problem” in the local context rather than on the students.
Data help us ask the right questions…they do not provide the solutions.
Use data and the drill down process to:a. Identify problems
b. Refine problems and understand the context
c. Define the questions that lead to a solution

Continuous Quality Improvement
Identify problems with precision
Establish goal(s)
Develop solution(s)
Implement solution(s) with integrity and fidelity
Monitor outcomes and compare to goal(s)
Reassess and revise solution(s) as needed

Continuum of Decision Making
Tertiary—intensive, individualized
5% of student population
Secondary—targeted, small
group
15% of student population
Universal—primary prevention
provided to all students,
effective for approximately 80%
All specialized interventions are more effective & durable with strong universal, Tier I systems as a foundation.

Outcome/Goal
SWPBIS and Outcomes
Desired Outcome: Enhanced social competence & academic achievement for all students.
How do we get to our desiredoutcome?
SystemsStaff Behavior Supports
PracticesStudent Behavior Supports
DataDecision-Making Supports

SWPBIS Sustainability Research
0
10
20
30
40
50
60
70
80
Nu
mb
er
of
Re
spo
nse
s
McIntosh, K., Predy, L., Upreti, G., Hume, A. E. & Mathews, S. (2014)
0
10
20
30
40
50
60
70
80
Nu
mb
er
of
Re
spo
nse
s
Enablers• Admin Support• Staff Buy-In • Fidelity• Data• Teaming
Barriers• Resources• Turnover• Fidelity• Staff Buy-In• Philosophy

SWPBIS Sustainability Research
What is the factor most related to high sustainability of SWPBIS?
The frequency that DATA are presented to all school staff!
McIntosh, Kim, Mercer, Strickland-Cohen, & Horner (2015)

Identifying Performance Gaps
Information
Resources
Incentives
Motives
Capacity
Knowledge
Performance Gap = The difference between where an organization is and where they want to be.

Performance Gap & Cause Analysis
Gilbert’s Behavior Engineering Model (BEM) provides a way to systemically identify barriers to individual and organizational performance.

Addressing Performance Gaps
1. Information
2. Resources
3. Incentives
4. Motives
5. Capacity
6. Knowledge
Gilbert, 1978

Right
Information

Data-Based Decision Making
The quality of decision making depends mostly upon the first step:
Defining problems to be solved with:
Precision (who, what, when, where,
why)
Clarity (general agreement across team)
Decisions are more likely to be effective and efficient when they are based upon data.

What data are used in PBIS Tier I systems?
Fidelity DataHow the adults are doing?
Team. Surveys, Action Plans*Tiered Fidelity Inventory (TFI – Tier I)
Staff. Surveys, observations, interviews
Student. Surveys, observations, interviews
External. Non-staff observations, interviews (TFI Walk-through)
Procedures, Routines, Perceived enablers and barriers to fidelity
Outcome DataHow the students are doing?
Overall effectiveness (e.g., % students with 0-1, 2-5, 6+ discipline referrals, academic data)
School Climate (surveys, interviews)
Context-specific problems/progresswho, what, where, when, how often, whyo Overall Summary for year
o Current Summary (month/quarter)
o Specific problem contexts
o Students to refer for additional supports

Connecting Fidelity & Outcomes
Lucky Sustaining
Positive OutcomesLow understanding of howthey were achieved
Replication of success unlikely
Positive OutcomesHigh understanding of howthey were achieved
Replication of success likely
Losing Ground Learning
Undesired OutcomesLow understanding of howthey were achieved
Replication of failure likely
Undesired OutcomesHigh understanding of howthey were achieved
Replication of failure unlikely
Ou
tco
mes
Fidelity
It’s all about connecting the dots

How are data used?
Screening. Are we matching supports and services to those who need them?
Formative. How can we quickly identify status, progress, potential problems to make decisions right now?
Summative. What is the BIG picture (comprehensive) and what are the major areas of progress and concern that we should find out more about?

“Drill Down” Approach
The Drill Down approach starts with the big picture and looks for potential “red flags” that might indicate a problem that might need to be addressed. Then we identify and address the problem context.
1. What is our current reality?
2. Is there a problem (red flag)?
3. What is the specific problem context?
What, where, when, who, how often, why?
Be efficient, don’t “drown” by getting too specific (e.g., red heads with blue shoes)

Data Analyst Role
Who has access and interest in analyzing data and then summarizing visually and verbally to tell the story?
Data analysts need to understand the school culture, the data, and storytelling to be effective!

Where can we get that data?
What do you have on hand? Hard copies of ODRs, attendance reports,
surveys, staff room talk….
Flat files – spreadsheet compilations of information
Someone skillful and FTE
Student Information System Behavior component
Software application dedicated to collection and analysis of behavioral data

What are PBISApps?
PBIS Applications are educational tools
created to support implementation of
multi-tiered system of supports (MTSS).
PBIS Applications have been utilized in more
than 25,000 schools internationally.
www.pbisapps.org

Fidelity Dataand the
Drill Down Process
Fidelity

PBIS Assessment – Fidelity Data

TFI Total Score Report

TFI: Scale Report

TFI: Subscale Report

TFI: Individual Items

SAS: Total Score Report

SAS: Subscale Report

SAS: Items Report
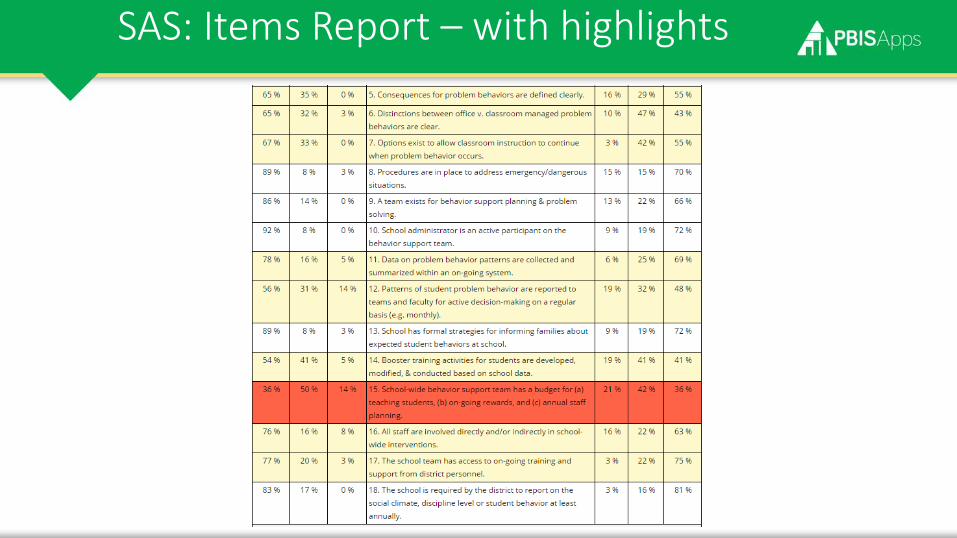
SAS: Items Report – with highlights

Outcome Dataand the
Drill Down Process
Outcomes

Capturing Behavioral Data
Records of behavioral incidents (office discipline referrals, ODRs) are commonly used as an indicator of school environments.
(Irvin, Tobin, Sprague, Sugai, and Vincent, 2004)
Incident records or office discipline referrals help identify:
• How frequently behaviors are happening in the school
• What behaviors are happening
• Where and when those behaviors are likely happening
• Who is involved
• Why those behaviors are happening in that context (motivation/function)

SWIS – Outcome Data

SWIS - Dashboard
Shows the status reports for the
current school year (year-to-date)
Average Referrals Per Day Per Month
Referrals by Time of Day
Referrals by Location
Referrals by Day of Week
Referrals by Problem behavior
Referrals by Grade
Referrals by Student

SWIS – Core Reports
Allows each report to be tailored for a contextual status (select the dates)
Average Referrals Per Day Per Month
Referrals by Time of Day
Referrals by Location
Referrals by Day of Week
Referrals by Problem behavior
Referrals by Grade
Referrals by Student

SWIS – Additional Reports
Allows for additional perspectives to
be used at least quarterly or as
needed
Multi-year reports
Referrals by Staff
(for Administrator use only)
Ethnicity Reports
Triangle Data
Year-End Reports
Student Dashboard

SWIS - Drill Down Tool
Change the Graph Type to
change the lens of analysis
(who, what, when, where, why).
Use the information from the SWIS
Dashboard to drill down and analyze
data.
Use the Summary to
analyze problem size.

Precise Problem Statements
Does our problem statement answer the following questions?
What is the problem behavior?
Where is the problem happening?
Who is engaged in the behavior (subgroups, not individuals)?
When is the problem most likely to occur?
How often is the problem happening?
Why is the problem sustaining?

Primary vs. Precise Problem Statements
Primary Problem Statement
Low fidelity of SWPBS implementation
Too many referrals
Gang behavior is increasing
The cafeteria is a nightmare
Staff aren’t giving out praise tickets
Precise Problem Statement
There are twice as many ODRs for aggression on the playground during first recess than last year. These involve a large number of students (32) and staff (8), and it seems to be related to getting access to the new playground equipment.

Primary vs. Precise Problem Statements
Low fidelity of SWPBS implementation
Too many referrals
Gang behavior is increasing
The cafeteria is a nightmare
Staff aren’t giving out praise tickets
During first recess, 32 students received ODRs on the playground for aggression while trying to access play equipment.

Setting Goals & Building Solutions
1. Define the goal
What would be “good enough” to move to another problem?
2. Use the goal to guide the solution (action plan)
How can we move from where we are to where we want to be?
Solution Components Prevention
Teaching (re-teaching)
Elevate recognition
Extinction
Consistent corrective consequences
Data collection

Right
People

Collaborative Problem Solving
Team Initiated Problem Solving Model (TIPS) Todd, et al. (2011)
“Nearly every school in the country has teams meeting regularly to make decisions concerning administrative, academic, and social support issues.”
“The assumption is that … multiple individuals … will provide a more inclusive system of problem solving and decision making in which collective experiences, knowledge, skills, language, and visioncontribute to improving the core features of schooling and outcomes for children.”

“Right” People?
Everyone is represented:Administrators, coaches, teams, staff, students, families, community
1. Who needs to know what? Overall status of fidelity and outcomes
Detailed status of fidelity and outcomes
Specific focus areas (e.g., problems, needs, goals met, new initiatives)
2. Why? Awareness only (shared knowledge)
Call to action
Celebration of success

Identifying Stakeholders
Data analyst(s)
Core decision makers
Implementers
Administration
Local community members
Building Positive
Relationships

Right Format

Storytelling with Data (Knaflic, 2015)
Relevant
Easy to Read
Focused
Simple

Evaluation Report Example

Discuss with a neighbor
How are we sharing information with our stakeholders (outside the team)?
What information?
Fidelity? Outcomes?
How often?
Monthly? Quarterly? Annually? Ever?

Right
Time

Continuum of Supports
As we increase the intensity (tier)
of supports we will
also increase the
frequency
& specificity
of our data collection,
data analysis,
& decision-making cycles.

Timeliness is a Key Issue
When we need the data, we want the data.
We can wait for the data analyst to tell the story….
Or we can work to have it available on demand.

Routines Per Stakeholder Groups
Group Information Schedule
Data Analyst(s) & Core Team
• Comprehensive Fidelity Checks• Comprehensive Outcome Checks • Formative Fidelity Checks (based on action plan)
• Formative Outcome – current status, progress reports, new precise problems
• Annually• Annually• At least monthly• At least monthly
Related Decision Makers & Implementers
• Brief summary of data reported at core (SWPBS) team meetings
• Monthly(e.g., staff meetings)
Administration • This depends on the needs and interests of administrators… minimally a brief summary of fidelity and outcomes
• Quarterly or annually
Local Community • Website • Newspaper or local media or local meetings
• Quarterly • As available

Summary: Using Data for Decision Making Related to Behavior

Summary – Why use data for decision making?
Decisions are more likely to be effective and efficient
when they are based upon data.
The quality of decision making depends mostly upon the first step:
Defining the problem to be solved with precision and clarity

Summary – The Right Information
Fidelity data
Adult performance
Are we doing what we said we would do?
Are we doing it as it was designed?
Outcome data
Student performance
ODRs
Suspension/Expulsion
Attendance
Academic performance
School climate perception
Graduation rates
Two basic questions:1) Are we implementing our interventions with fidelity?2) Are they improving the outcomes for students?

Summary – The Right People
Stakeholders Core Team
All Staff
Students
Families
District
Community

Summary – The Right Time
Formative Quick reports
Available now
Screening
Progress monitoring
Summative More comprehensive reports
Available annually or quarterly
On demand access to the information help inform our action plans for school climate improvement.

Summary – The Right Format
Easy to Read
Graphs and tables
Tells a Story
Where we are currently compared to where we want to be
Successes
Remaining challenges
Our next plan

Use behavior data to….
Be Responsive Leaders
Set Realistic Goals
Illustrate Progress
Celebrate Success
Uncover Existing Needs
Avoid Traps and Pitfalls

Use data to…..
Build Positive Relationships
Make Informed Decisions
Focus on Continuous Quality
ImprovementTell the Story&