help!!
DESCRIPTION
HELP!!. Regional Winds On The West Florida Shelf There are some quality control issues with our data set. So if you plan to use our WFS wind data you will need a little help. We have identified the data subsets that can be used and those that cannot. - PowerPoint PPT PresentationTRANSCRIPT

Regional Winds On The West Florida Shelf
There are some quality control issues with our data set. So if you plan to use our WFS wind data you will need a little help. We have identified the data subsets that can be used and those that cannot.
HELP!!

We compare six NDBC and NOS stations, green triangles, with five COMPS moorings, red circles, (see map). The data from the COMPS moorings provide a wide spectrum of quality for the time period of our observations from Jan. 1999 through Dec. 2007. Herein we detail the problems encountered and provide some speculations as to the causes of the ensemble of data quality issues. The along-shelf domain extends from the 42036 station to the composite (Comp) station composed of PLSF1, SANF1 and SMKF1 in the Keys. This distance is some 460 km along the shelf. The cross-shelf extent is ~150 km from the beach to the 100m isobath. Timelines for NDBC and NOS stations are CP, VN, CW and 36. The COMPS stations are C10 through C17. As you can see there is quite a lot of missing data and not all of the data that we have can be used. All of the data have been referenced to 10m above SL. All data have also been 40h Low Pass filtered and resampled every 8h, avoiding Sea Breeze effects thereby focusing on the Synoptic Wind Band of 3-14 da periods where most of the wind energy lies.

Hierarchy of Vector Correlations Between Moorings and Regional Standards With ~ Lags.
We consider data quality (QC) issues between the five COMPS moorings C10, C12, C13, C14 and C17 and the four NDBC, NOS and NOAA stations that are 42036, CWBF1, VENF1 and the Comp (already defined). The assumption here is that any data quality issues with respect to (wrt) the NDBC, NOS and NOAA stations have been addressed and hence we can use these records as standards. Even with close to perfect observations, relationships between these data must be compromised by regional weather scales. However intuitively, correlations between the standards should provide a benchmark of sorts for the correlations computed between the COMPS moorings and the standards and a basis for evaluating data quality. Substandard correlations would then be used to target the data sets for a more detailed analysis. The best correlations are achieved beween C10, C14 and 42036, VENF1, CWBF1 and Comp. With few exceptions the records at C10 and C14 are comparable to the standards. The along-shelf standard between 42036 and Comp establishes a benchmark of ~ 0.65 for data of high quality. Half the along-shelf scale say from 42036 to C10 gives us about 0.85 the difference being the shelf-wide wind field scales.
Standards
42036 x CWBF1 0.86 ~2-3h42036 x VENF1 0.8 ~3-4h 42036 x Comp 0.65 ~4-5hVENF1 x Comp 0.6 ~2-3h ---------------------------------------------
Hierarchy of Correlations
A x B ρ Lag
C14 x 42036 0.91 0C10 x VENF1 0.9 0 C14 x C10 0.88 <1h42036 x C10 0.85 ~1hC14 x CWBF1 0.84 0 C10 x Comp 0.72 ~1-2hC14 x Comp 0.62 ~4h ----------------------------------------------C10 x C17 0.71 < 1hC12 x VENF1 0.63 ~1-2hC12 x 42036 0.62 0C12 x C14 0.61 0C12 x C10 0.61 ~1hC10 x C13 0.51 ~1hC13 x Comp 0.51 ~4h C12 x Comp 0.5 ~4hC17 x Comp 0.48 0

(an)
W1(t)
W2(t)
Vector CorrelationKundu, 1976, JPO v 6pp. 238, 242
+ W2(t) is oriented (an) radiansfrom W1(t) (measured + anticlockwise wrt W1(t)
Between two vector sequences: W1 = u1 +iv1, W2 = u2 +iv2The results supply a correlation amplitude |a| and the veering angle (an) as described above
The correlation (rho) is complex: rho = (a + ic)/D and is derived from the covariance between the two records [ W1* x W2] = a + ic and |a| = sqrt [a2 + c2] an = arctan(c/a) and:
a = Cu1u2 + Cv1v2, c = Cu1v2 – Cu2v1 and D = sqrt [(Cu1u1 + Cv1v1) x (Cu2u2 + Cv2v2)]
The quantities Cuiuj and Cuivj are just the covariances between the scalar quantities u and v.
In our discussions we will concern ourselves only with the amplitude of the correlation |a| as a function of lag where we find the maximum correlation as we time shift one sequence wrt to the other.

The vector correlation amplitude between C10 and VENF1, C10 and 42036 and C10 and Comp is plotted below as a function of lag. For C10 wrt Comp there is a lag of ~1-2h and a correlation of 0.72. This shows that the record at C10 is quite good with very few problems. As we shall see shortly the record at C14 is just as good and both can be used to evaluate the other COMPS moorings. Notice that the distances between C10 and Comp and VENF1 And Comp are both 300 km or so yet the correlation decreases from 0.7 to 0.6. This suggests that regional weather scales are at work where coastal winds are somewhat different than those over the shelf.
C10 x VENF1
42036 x C10
C10 x Comp0.72
0.90 lag48 km
0.85~1h lag216 km
1-2h lag~300 km
C14 x C10 0.88< 1h lag132 km
VENF1 X Comp 0.6 ~2-3h lag ~300 km
42036 x VENF1 0.8 ~3-4h lag ~250 km

Here we compare C10 with 42036 for the year 1999. There is only about a month where the observations at C10 appear to be compromised, mostly in Feb. Otherwise agreement is quite good and is expected based on the vector correlation amplitude shown previously. What follows this is the year 2002 and 2005 for comparisons with 42036.

C10 comparison with 42036 for the year 2002. Some speed issues in Mar, Apr, May and Jul.

C10 comparison with 42036 for the year 2005. The year 2005, insofar as quality is concerned, is typical and comparable to the years 2000, 2001, 2003, 2004, 2006 and 2007. Other than the two time periods in 1999 and 2002, data at C10 are comparable to the standards and henceforth will be considered as such.

Vector correlations are performed between C12 and 42036, C12 and C10 and C10 and Comp. The correlations are significantly lower for reasons that will become clear. Note the correlations between 42036 and C12 (0.62) and C12 and Comp (0.5) are considerably smaller than between 42036 and C10 (0.85) and between C10 and Comp (0.72). Note also that the correlations between C12 and C14 and C12 and C10 are essentially the same. These contrasting correlations indicate data quality issues as we shall see in looking at individual years.
C12 x 42036
C12 x C10Almost exactly same as C12 x C14
C12 x Comp
0.62
C10 x 42036 0.85
0.61
0.5

C12 comparison with 42036 for the year 1999. Problem with the compass. Data bad until Dec. New Weatherpak installed in Dec.

C12 comparison with 42036 for the year 2000. Everything looks good

No data for 2001. C12 comparison with 42036 for the year 2002. New Weatherpak installed in Apr.

C12 comparison with 42036 for the year 2003. Speed issues in Jan, Feb. Data go bad in Jun. Weatherpak installed in Feb and Sep.

C12 comparison with 42036. for the year 2004. Speed issues in Jan, Feb. Data bad the rest of the year. Weatherpak installed in Nov but compass was bad and it was removed in Dec.

C12 comparison with 42036 for the year 2005. Speeds bad beginning in Apr.despite a Weatherpak installation in Mar. Weatherpak replaced in Jun which didn’t do any good and again in Sep afterwhich data are good the rest of the year.
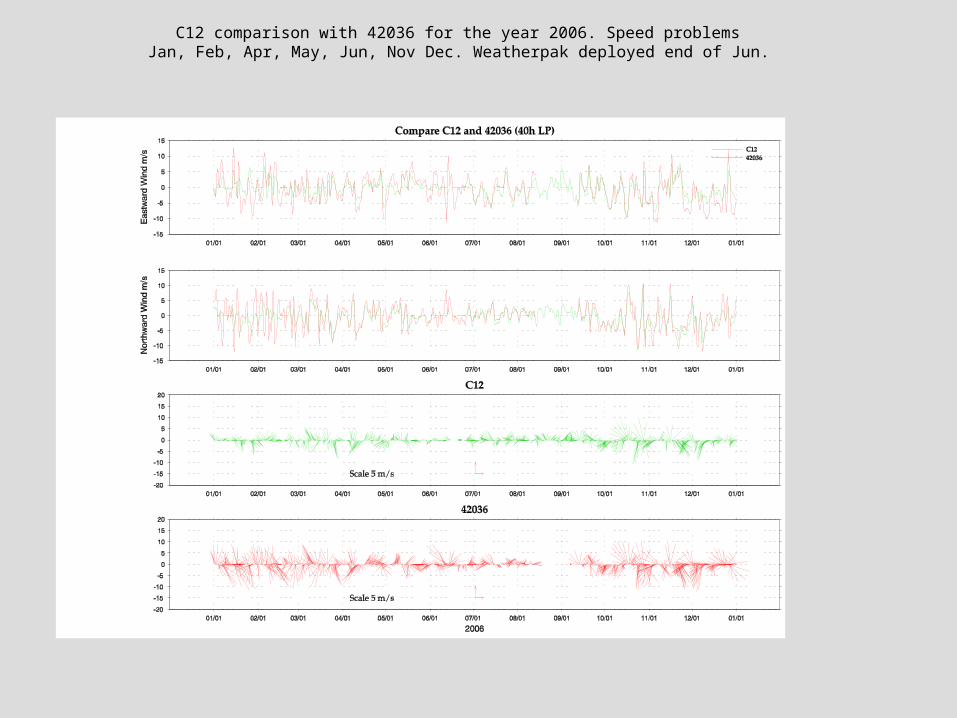
C12 comparison with 42036 for the year 2006. Speed problems Jan, Feb, Apr, May, Jun, Nov Dec. Weatherpak deployed end of Jun.

C14 comparison with C12 for the year 2007. Questionable data in Feb. Speed issues for the whole year except from mid-Jul to end of Aug. Weatherpak deployed Jul. ASIMET deployed Sep and swapped in Oct but didn’t do any good.

Vector correlations are performed between C10 and C13, C10 and Comp and C13 and Comp. More than half of the data at C13 are missing. The correlations are significantly lower than between C10 and C14 though the distances are essentially the same. The same can be said between C13 and Comp. What makes the latter even worse is that the distance between C13 and Comp is about 100 km less than between C10 and Comp.
C10 x C13 0.51
C10 x C14 0.88
C10 x Comp
0.72
C13 x Comp
0.51

C13 comparison with C10 for the year 1999. Speed issues Oct, Nov and 1/2 of Dec. Good data Aug, Sep and last 1/2 of Dec. Weatherpak deployed Aug. There are speed issues Oct and Nov. Compass reset mid-Dec.

C13 comparison with Comp. for the year 1999. Compass reset mid-Dec.and data good for this time period.

C13 comparison with C10 for the year 2000. This is a good year. Weatherpak replaced in Mar and Oct.

C13 comparison with C12 for the year 2000. Except for speed problems in Feb and Mar data are good for the whole year.

C13 comparison with Comp for the year 2000. All good except for Feb and Mar.

C13 comparison with Comp for the year 2001. Data OK in Jan. Bad data through May. Weatherpak removed in May and replaced in Aug but still no data.

C13 comparison with C10 for the year 2004. There are no data in 2001 and 2003. Here there are speed issues in Mar and Apr. Weatherpak installed in May but data here start in Jun. These data beginning in Jun should begin in May as we shall show.

Lead C13 by 31 da and compare with Comp. for the year 2004. Here the data match up perfectly if we advance C13 by 31 da.

The correlation amplitude for C10 x Comp. and C13 x Comp and C13(Lead by 31 da) x Comp for 2004 only. Here we verify that by time shifting the desired correlation standard is achieved. We know this already because of the previous plot but here it is quantified.
C10 xComp
0.72
C13 x CompComp leads by 31 da
C13 x Comp 31 da shift 0.74

C13 comparison with C10 for the year 2005. Bad data Jan through Apr. Weatherpak replaced Aug. Bad data begins end of Oct through the rest of the year

C13 comparison with C12 for the year 2006. Bad data Jul and first part of Aug. Weatherpak replaced mid-Aug. Good data until Nov when speeds begin to degrade.
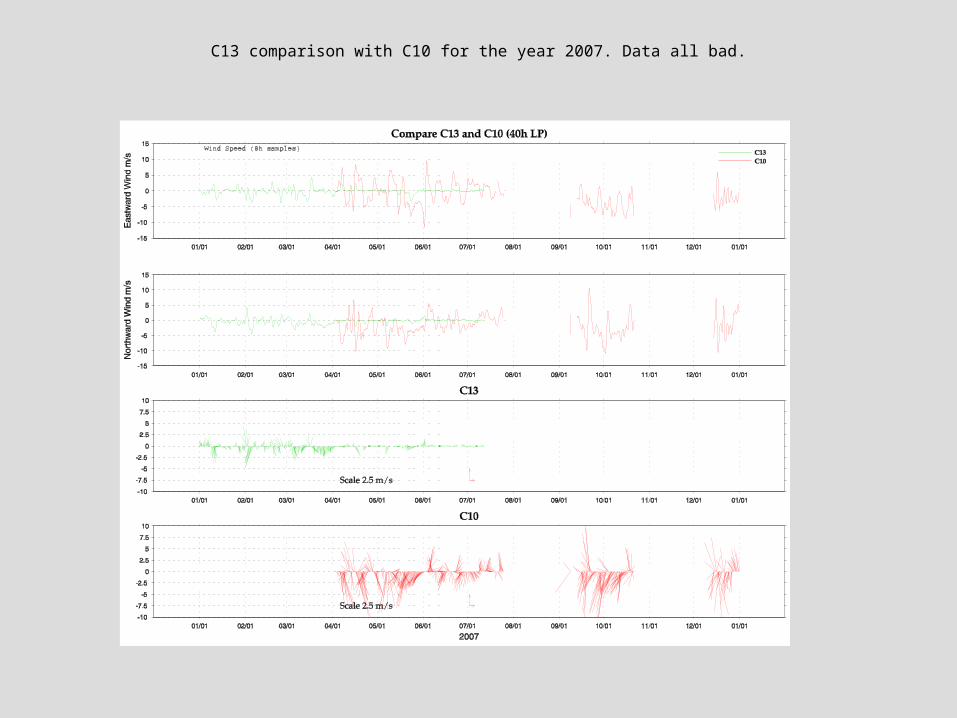
C13 comparison with C10 for the year 2007. Data all bad.

Vector correlations are performed between C14 and 42036, CWBF1 and 42036 and C14 and CWBF1. Doesn’t get much better than this.
C14 x 42036 CWBF1 x 42036
C14 x CWBF1 0.84
C14 x C10 0.88
0.91 0.86

C14 comparison with 42036 for the year 2002. Speed issues Feb and Mar. Data are good thereafter where there are data.

C14 comparison with 42036 for the year 2003. Processing problem in Sep where data are missing.

C14 comparison with 42036 for the year 2004. Data are good except for where there are jumps.

C14 comparison with 42036 for the year 2005

C14 comparison with 42036 for the year 2006

C14 comparison with C10 for the year 2007
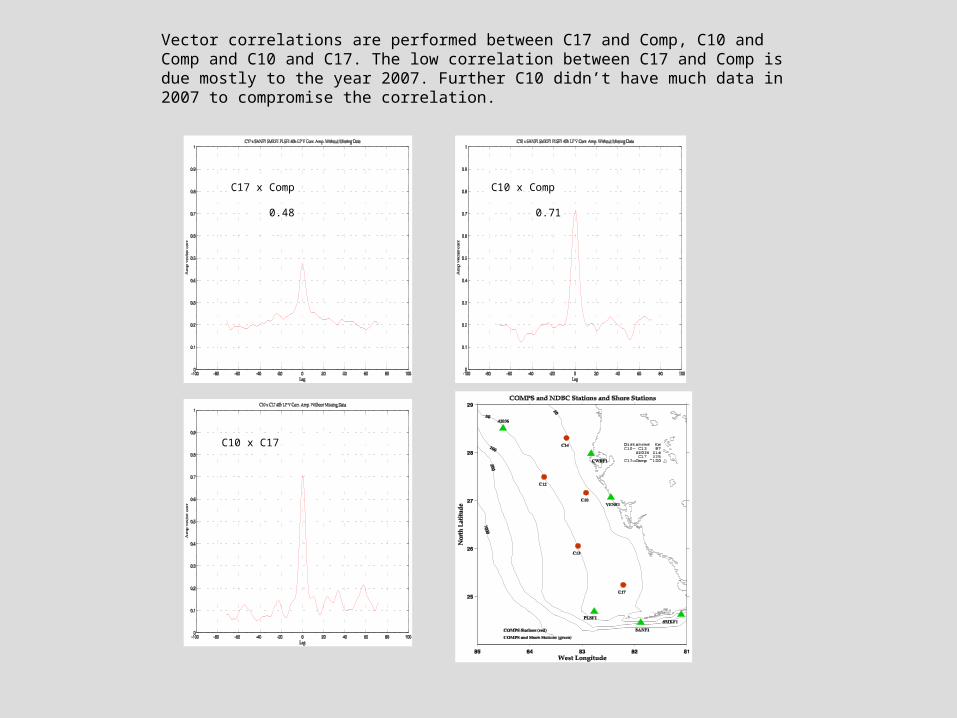
Vector correlations are performed between C17 and Comp, C10 and Comp and C10 and C17. The low correlation between C17 and Comp is due mostly to the year 2007. Further C10 didn’t have much data in 2007 to compromise the correlation.
C17 x Comp
C10 x Comp
0.71
C17 x Comp
0.48
C10 x C17

C17 comparison with Comp. for the year 2004. Not much data but it’s good in May through Jul afterwhich speeds degrade in Aug.

C10 comparison with C17 for the year 2004.

C10 comparison with C17 for the year 2005.

C10 comparison with C17 for the year 2006.

C17 comparison with Comp. for the year 2007.

Summary of Data Quality
C10 3287 da 837 da missing 144 da badC12 3122 931 1144 C13 3055 1632 660 C14 2540 1050 ~60 C17 1340 714 ~360
Percentage of Available Data That Are Good
C10 6 % C12 52 % C13 46 % C14 4 % C17 68 % but 0 % without 2007