heat transfer analysis of a circular tubes using extended
TRANSCRIPT

SKIT Research Journal VOLUME 9; ISSUE 1: 2019
86
Heat transfer analysis of a circular tubes
using extended surfaces
Sanjay Kumar Sharma, Ashish Nayyar, Chandan Kumar Department of Mechanical Engineering, Swami Keshvanad Institute of Technology, Management &
Gramothan, Jaipur-302017 (INDIA)
Email- [email protected]
Received 23.12.2018 received in revised form 28.01.2019, accepted 02.02.2019
Abstract: This paper analyze the use of extended
surfaces in circular tube to enhance heat transfer.
Heat transfer parameters in simple circular (SC) tube
without insert, with rectangular insert (RI), with
twisted insert (TI) and with wave insert (WI) have
been calculated and compared. The heat transfer in
air for Reynolds number having range from 5000-
15000 was studied experimentally and numerically in
a simple circular tube and in three extended surfaces
of different design with same surface area (One insert
area:0.000680m2). In present study, design of
experiment (DOE) is used to develop the experiment
layout. Total five factors are selected i.e. Extended
surface, velocity, heat flux, material of tube and air
pressure in domain. The experimental results are
validated by CFD simulation. It is concluded that
extended surfaces improve heat transfer rate in
circular tubes. The rectangular insert of extended
surface is optimum among all tested combinations.
Keywords: Computational fluid dynamics, Forced
convection, Heat transfer, Extended Surface, Nusselt
number, S/N Ratio.
1. INTRODUCTION
Circular tube is an element which is used to
transfer thermal energy among fluids & fluid and
solid surfaces at different temperature when in
thermally contact. It does not required any external
heat and work interaction. The purpose of
constructing a circular tube is to get an efficient
method of heat transfer from one fluid to another,
by direct contact or by indirect contact. It is used in
various practical applications such as heating and
cooling of fluids, space heating, refrigeration, air
conditioning, power stations, chemical plant,
petroleum refinery, sewage treatment etc. [1]. Some
common applications of circular tube in engineering
are shell & tube type heat exchangers, condensers,
evaporator, automobile radiator, cooling tower and
air preheater [2]. A circular tube play an important
role in heat transfer applications therefore chosen
for the works.
The heat transfer occurs by three manners:
conduction, convection and radiation. The radiation
heat transfer in a circular tube is negligible in
comparison to conduction and convection.
Conduction takes place when the heat from the high
temperature fluid flows to the surrounding through
solid wall. The conductive heat transfer can be
maximized by selecting a minimum thickness of
wall of a highly conductive material. Convection
plays the major role in the heat transfer mechanism
of a circular tube.
A. Tohidi et al. [1] on the characteristics of heat
transfer and friction factor of laminar flow
(480<Re<1750) in a circular tube fitted with central
slant rods under constant heat flux condition. The
computation result shows that Nusselt number and
friction factor increase with a decrease in rod pitch.
C. X. Lin et al. [2] done the numerical analysis on
investigate three-dimension turbulent developing
convective heat transfer in helical pipes with finite
pitch. The studied involved k-ϵ turbulent model
and FVM method. Circumferential average Nusselt
number is discovered to be oscillatory and pitch
curvature or Reynolds number increase than the
oscillation phenomenon enhanced. A. M. Husseina
et al. [3] numerical investigated the thermal and
flow flied in transverly corrugated circular tube for
turbulent flow (5000<Re<60,000) under constant
heat flux. Friction factor is in-depended on
Reynolds number for corrugated tube.
F.Akbaridoust et al. [4] studied numerically and
experimentally the pressure drop and convective
heat transfer behavior of nanofluid (CuO) for steady
state and laminar flow (200<Re<1000) in helically
coiled tube at a constant wall temperature. The coil
with different curvature and torsion ratio for is
used. It is observed that heat transfer is enhanced
with greater curvature ratio. Jalaluddin et al. [5]
have discussed on thermal performance and
pressure drop of the spiral tube ground source heat
pump. It is reported that spiral pipe provides a
better heat exchange rate than straight pipe.
Pressure drop of water flow is also increased due to
increasing the length of pipes per meter borehole
depth therefore pumping power is also increased. P.
Naphon et al. [6] have performed study on effect of
curvature ratio on the heat transfer and flow
development in the horizontal spirally coiled tube

SKIT Research Journal VOLUME 9; ISSUE 1: 2019
87
under constant wall temperature. The k-ϵ standard
model and finite volume method have been for
simulation. Heat transfer rate is directly
proportional to the mass flow rate. Nusselt number
is higher for lower curvature ratio. V. Singh et al.
[7] have described heat transfer and flow friction
characteristics in a tubular heat exchanger inserted
with single, double, triple and quadruple twisted
tape with solid ring. It is observed that number of
twisted tape is increase than friction factor, Nusselt
number and thermal performance factor is also
increase.
Heat Transfer in circular tubes [8]
)(.
1 Inoutp TTCmQ
(1)
Where Here ṁ is mass flow rate, Tout is out
temperature and Tin is inlet temperature of circular
tube.
Heat flux is given to this circular tube by
electrical energy and then convective heat transfer
is
)(1 bulksur TThAQ
(2)
Where Tsur is tube surface temperature and Tbulk is
bulk temperature.
This is heat flow is equal to Q1 and then
)(
1
Bulksur TTA
Qh
(3)
This is used for calculation of Nu number [8]
k
hDNu h
(4)
This Nu is then validated by Dittus-Boelter
correlation which is presented here [8]. nNu PrRe02.0 8.0
(5)
Here, n = 0.4 for heating and 0.3 for cooling.
To develop a customized forced convection heat
transfer analysis in circular tube which work on one
fluid flow conditions. To the study heat transfer,
Nusselt number and dimensionless factor
experimentally in a circular tube which has an inner
corrugated tube filled with various categories of
extended surface (Rectangular insert, Rectangular
twisted insert, Wave Insert) from conventional to
modified insert types which include perforated and
the Reynolds number is changed from 5000 to
15,000 of turbulent regime. To apply Signal to
Noise ratio through Taguchi method for numerical
analysis and to optimize the response parameters.
2. EXPERIMENTAL SETUP
Performance analysis of heat transfer through
forced convection in circular tube is investigated in
current research study for air as fluid medium.
Selection of setup design is take care from literature
review. The schematic line diagram of the
experimental set up is shown in figure 1, Schematic
diagram of the rectangular insert, twisted insert and
wave insert in figure 2.
1. Blower, 2. Orifice, 3. Heater, 4. Insulation Wall, 5. Copper Tube, 6. Pressure Valve, 7. U-Tube Manometers, 8. Voltmeter, 9. Temperature, 10. Ammeter, 11. Dimmer for Blower, 12. Temperature Sensing Points 13. Voltage Controller T1: Air inlet temperature to test specimen T2-T6: Temperature test specimen surface along the length T7: Air outlet temperature from test specimen
Figure 1 : Line diagram of setup
Figure 2 : Schematic of the inserts
(a) Rectangular insert, (b) Twisted insert, (c) Wave insert
4. CFD- ANALYSIS
Computation fluid dynamics (CFD) is a research
tool of fluid dynamics which provides cost effective
means, simulate real flows using the numerical
solution of governing equations. Main governing
equation used is Navies-Stokes equation.
Computational technique used algebraic equations
instead of partial differential equations and solve by
digital computer [8]. It also provide testing
conditions which are very difficult to measure
experimentally and cannot solve analytically. Steps
involves in CFD analysis are process:
Mathematical modeling
Numerical Analysis
Software tool ( solver, pre and post
processing )

SKIT Research Journal VOLUME 9; ISSUE 1: 2019
88
Governing equation of mass conservation [9, 10]:
0)(
udiv
t
p
(6)
Momentum conservation
X- Direction
Mxzxyxxx Szyx
p
Dt
Du
)(
(7)
Y direction
My
zyyyxyS
zy
p
xDt
Dv
)(
(8)
Z direction
Mzzzyzxz S
z
p
yxDt
Dw
)(
(9)
Energy conservation:
Ezzyzxz
zyyyxyxzxyxx
SKgardTdivz
w
y
w
x
w
z
v
y
v
x
v
z
u
y
u
x
uudiv
Dt
DE
)()()()(
)()()()()()()(
(10)
Here
E = i + 1/2 (u2 + v
2 + w
2) (11)
Experimental and simulation both studies are
investigated for circular tube. The numerical part of this study is discussed. ANSYS WB and ANSYS FLUENT software's are used for CAD modelling and CFD simulation work.
All important steps are present in following section. 3.1 Formulation of flow Problem
CFD domain is required for simulation and validation so formulation of CFD is required. The two type of CFD domain used, first design is simple circular tube and second design is circular tube with extended surface. 3.2 Making of Flow Domain
CAD file is generated by ANSYS DM software. The dimensions of test specimen are measured by experimental setup.
3.3. Formulation of Boundary Conditions
Boundary conditions are developed in ANSYS ICAM CFD software.
Figure 5 : CFD domain CAD diagram
Figure 6: Boundary of circular tube
3.4 Grid Generation
Mesh generation is completed in ANSYS ICAM
CFD software. Finite structured grids are generated.
Grid Independence test is also performed for
optimum grid size selection as shown in fig. 7 and
table 1.
Figure 7 : Mesh of CFD domain
Table 1 Grid quality index for discretized domain of circular tube
Mesh Quality Avg. Max. Min. St. Dv.
Element Quality 0.61 0.99 9.05 0.23
Aspect Ratio 2.79 13.45 1.13 1.41
Orthogonal 0.98 0.99 0.63 3.52
Skewness 0.12 0.62 0.02 9.18
3.5 Establish CFD simulation
All boundaries requires proper data input, proper
selection of solver type, model selection, and other
important steps. CFD simulation is performed using
ANSYS FLUENT software.
3.6 Set Solution Controls
After selection of proper selection of data inputs
time to select proper solution techniques to solve
governing equations. This step is solved using
ANSYS FLUENT software.
3.7 Monitor Simulation parameters (Residuals)
Various types of errors are present in CFD
simulation like truncation error, residuals errors and
many more. Residuals are required step to show the
error percentage in CFD simulation.
3.8 Post Processing of Simulation
The required results are extract from solved files
of Ansys Fluent software. The main results

SKIT Research Journal VOLUME 9; ISSUE 1: 2019
89
extracted from CFD simulation are contours for temperature.
4 FACTOR AND LEVELS
In this section the application of the Taguchi experimental design method and Signal to Noise ratio approach is discussed. The scheme of carrying out experiments was selected and the experiments were conducted to investigate the effect of process parameters on the output parameters e.g. Nusselt number, Dimensionless parameter.
For the present experimental work the three process parameters each at four levels have been decided for Taguchi method. It is desirable to have four minimum levels of process parameters to reflect the true behavior of output parameters of study. The process parameters are renamed as factors and they are given in the adjacent column. The levels of the individual process parameters/factors are given in Table 2.
Table 2 : Process Parameters and their Levels (Taguchi Method)
Factor Unit LevelL1 L2 L3 L4
A: Extended Surface - SC RI TI WIB: MFR (Mass Flow Rate) m/s 3.0 4.0 5.0 6.0
C: HF (Heat Flux) W/m2 795 1195 1590 1990
Here Factor A represent design condition of circular tube, SC represent simple circular tube design, RI represent Rectangular Insert, TI represent Twisted Insert and WI level represent Wave Insert. L-16 orthogonal array is developed for this research study.
5 RESULT AND DISCUSSION
4.1 Taguchi Analysis
Taguchi technique has been used for two type of works, first to develop an experimental plan which is presented in table 3 and second is analysis of experimental data with response. There are two responses Nusselt number and dimensionless temperature difference parameter. The analysis is performed using “Signal to Noise ratio” curves. These curves are helpful to find most effective factors which are responsible for response improvement or decrements [11, 12].
Table 3 : S/N Ratio Analysis of NU Sr. No.
A(ES)
B(MFR)
C(HF) Nu S/N
RATIO1 1 1 1 18.58 25.38092 1 2 2 25.41 28.10013 1 3 3 28.93 29.22704 1 4 4 32.96 30.35975 2 1 2 40.82 32.2175
6 2 2 1 47.20 33.47887 2 3 4 76.98 37.72768 2 4 3 57.07 35.12829 3 1 3 37.42 31.4621
10 3 2 4 45.27 33.116211 3 3 1 49.85 33.953312 3 4 2 54.06 34.657513 4 1 4 40.20 32.084514 4 2 3 48.32 33.682515 4 3 2 57.81 35.240116 4 4 1 67.47 36.5822
4.2 S/N Ratio Analysis
Signal to Noise Ratio analysis is performed for both responses Nu and θ and present in this section. S/N ratio analysis for Nu is present in table 3 for each experiment.
For Nu response, larger is better option is select for S/N ratio analysis, as seen in table 4, the best factor which improve Nu number is extended surface install in circular tube, whereas least factor which show low effect for Nu number is heat flux.
Table 4 : S/N ratio for Nu number (larger is better)
Level A (ES) B (MFR) C (HF)1 28.27 30.29 32.352 34.64 32.09 32.553 33.3 34.04 32.374 34.4 34.18 33.32
Delta 6.37 3.9 0.97Rank 1 2 3
Figure 8 : S/N ratio analysis for Nu number
As seen in figure 8, the best case for optimal Nu number is following, extended surface must be design-2, mass flow rate must be level-IV and heating flux must be level-IV.
S/N ratio analysis for θ is present in table 5 for each experiments.

SKIT Research Journal VOLUME 9; ISSUE 1: 2019
90
Table 5 S/N ratio analysis for θ response variableSr. No.
A(ES)
B(MFR)
C(HF) θ
S/N RATIO
1 1 1 1 3.57 -11.05342 1 2 2 4.01 -12.06293 1 3 3 4.40 -12.86914 1 4 4 4.63 -13.31165 2 1 2 1.87 -5.43686 2 2 1 2.16 -6.68917 2 3 4 1.65 -4.34978 2 4 3 2.68 -8.56279 3 1 3 2.04 -6.1926
10 3 2 4 2.25 -7.043711 3 3 1 2.55 -8.130812 3 4 2 2.83 -9.035713 4 1 4 1.90 -5.575114 4 2 3 2.11 -6.485615 4 3 2 2.20 -6.848516 4 4 1 2.26 -7.0822
For θ response, smaller is better option is select
for S/N ratio analysis, as seen in table 6, the best factor which improve θ number is extended surface
install in circular tube, whereas least factor which show low effect for θ number is heat flux.
Table 6 : S/N ratio analysis for θ (smaller is better)Level A (ES) B (MFR) C (HF)
1 -12.324 -7.064 -8.2392 -6.26 -8.07 -8.3463 -7.601 -8.049 -8.5284 -6.498 -9.498 -7.57
Delta 6.065 2.434 0.957Rank 1 2 3
Like table 6 for S/N ratio, graphical representation is also present in figure 9 for S/N ratio.
S/N ratio figure help to predict the best case among all possible combinations of experiments and this is the best part of Taguchi method. The peak of hill is always present the best case of selective response and lowest peak of figure always present worse case of selective response.
Figure 9 : S/N ratio analysis for θ number
As seen in figure 9, the best case for optimal θnumber is following, extended surface must be
Level-II, mass flow rate must be level-I and heating flux must be level-IV.
4.3 Optimal Solution Analysis
Taguchi method also develop a optimal solution for selective responses using S/N Ratio technique. Optimal solution for Nu and θ is present in table 7 and table 8 respectively. For both cases best and worse optimal solutions are present with CFD contour analysis for these optimal conditions.
Table 7 : Optimal solution for Nu number Factors Level- ES Level- MFR Level- HF
Best Case RI 6.0 1990Worse Case SC 3.0 795
The best case for Nu have optimal level for extended surface is Rectangular insert, optimal mass flow rate is 6.0 m/s and optimal level for heat flux is 1990 W/m2.
Table 8 : Optimal solution for θ number Factors Level- ES Level- MFR Level- HF
Best Case RI 3.0 1990Worse Case SC 6.0 1590
The best case for θ have optimal level for extended surface is Rectangular insert, optimal mass flow rate is 3.0 m/s and optimal level for heat flux is 1990 W/m2. 4.4 Visual Analysis of CFD Result
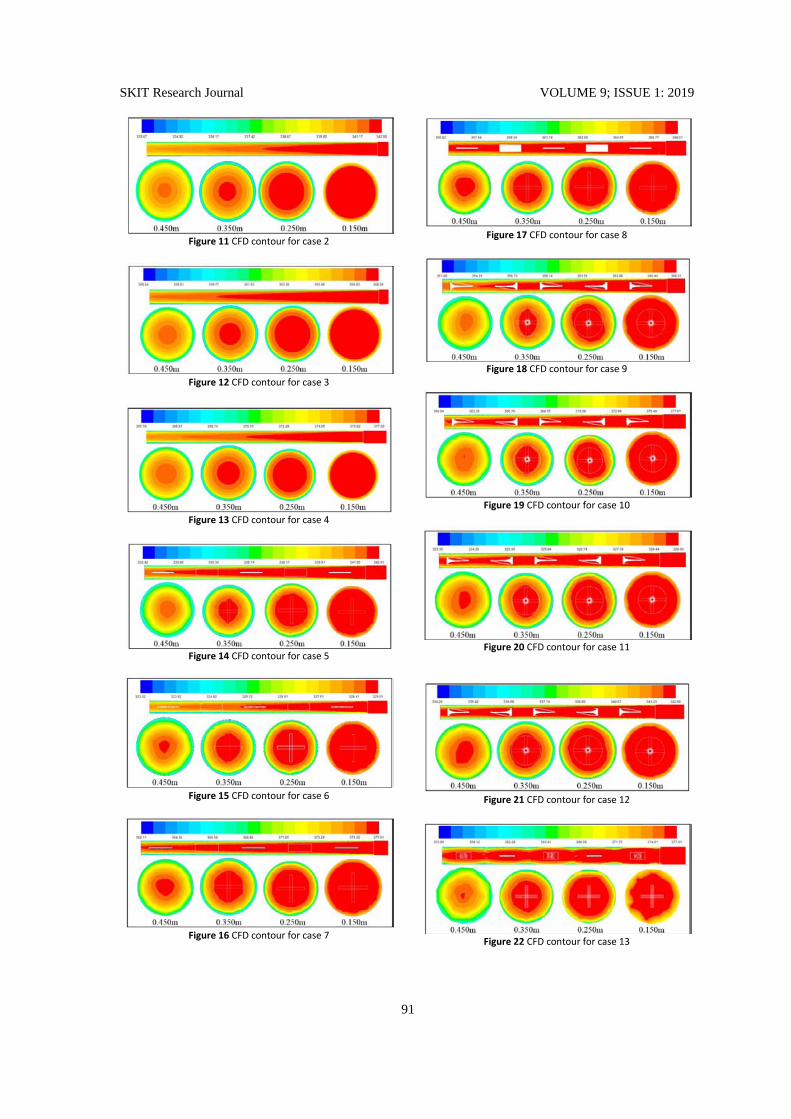
The CFD simulation has been done for all the 16 cases as per DOE given in table 3. CFD has one best advantage of visual analysis of results of Nu and θ. CFD contours for static temperature
magnitude for cases 1-16 have been shown in fig. 10 to fig. 25.
It can be observed from these contours that Rectangular Insert (RI) having higher rate of heat transfer then other combinations. It can be visualize by static temperature contour in figure 10 - 25. This observation of CFD analysis verify the optimum results given by S/N ratio analysis and is shown in table 3 and table 5.
Figure 10 CFD contour for case 1
SKIT Research Journal VOLUME 9; ISSUE 1: 2019
91
Figure 11 CFD contour for case 2
Figure 12 CFD contour for case 3
Figure 13 CFD contour for case 4
Figure 14 CFD contour for case 5
Figure 15 CFD contour for case 6
Figure 16 CFD contour for case 7
Figure 17 CFD contour for case 8
Figure 18 CFD contour for case 9
Figure 19 CFD contour for case 10
Figure 20 CFD contour for case 11
Figure 21 CFD contour for case 12
Figure 22 CFD contour for case 13

SKIT Research Journal VOLUME 9; ISSUE 1: 2019
92
Figure 23 CFD contour for case 14
Figure 24 CFD contour for case 15
Figure 25 CFD contour for case 16
6 CONCLUSIONS
1. In the present paper, force convective heat
transfer analysis for a circular tube is studied
experimentally and numerically.
2. Experimental results are validated by CFD
simulation analysis.
3. In this research work, experiments were
design by using DOE software. Taguchi
technique is applied for analysis of the
observed data. Total three factors and two
responses are selected for four levels each.
Total 16 experiments were performed as per
L16 design layout.
4. For all 16 cases CFD contours are generated
and discussed.
5. Signal to Noise ratio analysis is performed for
both responses (i.e. Nu & θ). This analysis
gives the rank of factors on selective response.
For both responses extended surface (ES) is
ranked number 1.
6. Another result given by the signal to noise
ratio is the optimal level for both responses.
The second level (2nd
) i.e. Rectangular insert
the optimal level of the factors for optimum
heat transfer.
REFERENCES
[1] A. Tohidi, H. Ghaffari, H. Nasibi and A. S. Mujumdar,
“Heat transfer enhancement by combination of chaotic advection and nanofluids flow in helically coiled tube”
Applied Thermal Engineering (2015), 86, 91-105.
[2] C. X. Lin and M. A. Ebadian, “The effects of inlet turbulence on the development of fluid flow and heat
transfer in a helically coiled pipe” International Journal
of Heat and Mass Transfer (1999), 42, 739-751.
[3] A. M. Husseina and H. K. Dawood, “Numerical study on
turbulent forced convective heat transfer using
nanofluids TiO2 in an automotive cooling system” Case Studies in Thermal Engineering (2017), 9, 72–78.
[4] F. Akbaridoust and M. Rakhsha, “Experimental and
numerical investigation of nanofluid heat transfer in helically coiled tubes at constant wall temperature using
dispersion model” International Journal of Heat and Mass Transfer (2013), 58, 480–491.
[5] Jalaluddin and A. Miyara, “Thermal performance and
pressure drop of spiral-tube ground heat exchangers for ground-source heat pump” Applied Thermal Engineering
(2015), 90, 630-637.
[6] P. Naphon, “Heat transfer and pressure drop in the horizontal double pipes with and without twisted tape
insert” International Communications in Heat and Mass
Transfer (2006), 33, 166-175.
[7] V. Singh, S. Chamoli, M. Kumar and A. Kumar, “Heat
transfer and fluid flow characteristics of heat exchanger
tube with multiple twisted tapes and solid rings inserts” Chemical Engineering and Processing: Process
Intensification (2016), 102, 156-168
[8] Y. A. Cengel “Heat Transfer: A Practical Approach” 2nd ed., McGraw-Hill, 2003.
[9] J. S. Jayakumara, S. M. Mahajani and J. C. Mandal,
“CFD analysis of single-phase flows inside helically coiled tubes” Computers and Chemical Engineering
(2010), 34, 430–446.
[10] L. S. Sundar and M. K. Singh, “Convective heat transfer and friction factor correlations of nanofluid in a tube and
with inserts: A review” Renewable and Sustainable
Energy Reviews (2013), 20, 23–35. [11] Zhenyu Wang and Yuchen Wang, “Improvement of the
aerodynamic performance of vertical axis wind turbines
with leading-edge serrations and helical blades using
CFD and Taguchi method” Energy Conversion and
Management (2018), 177, 107–121
[12] M. T. J. Abad, A. Zamzamian and M. Dehghan, “Experimental studies on the heat transfer and pressure
drop characteristics of Cu–water and Al–water
nanofluids in a spiral coil” Experimental Thermal and Fluid Science (2013), 47, 206–212.