heat index climatology for the north-central … · heat index climatology for the north-central...
TRANSCRIPT

1
HEAT INDEX CLIMATOLOGY FOR THE NORTH-CENTRAL UNITED STATES
Todd Rieck National Weather Service
La Crosse, Wisconsin
1. Introduction
Heat is an underrated danger, with an average of 175 Americans losing their lives annually from heat-related causes. According to the Centers for Disease Control and Prevention, from 1979-2003 excessive heat exposure caused 8,015 deaths in the United States. During this period, more people died from extreme heat than from hurricanes, lightning, tornadoes, and floods combined.
Heat kills by taxing the human body beyond its ability to cool itself. Cooling is primarily accomplished by the evaporation of perspiration. How efficiently this process functions is directly related to the amount of water vapor in the air. High moisture content reduces the evaporative cooling rate of perspiration, making it difficult for the body to maintain a steady and safe internal temperature. One way to measure the combined effect of temperature and moisture on the human body is the heat index.
In 1979, R. G. Steadman constructed an apparent temperature table using temperature, relative humidity, and other factors, based on a number of published research papers over a 54-year span. The National Weather Service (NWS) developed a heat index equation based on Steadman’s work as guidance for heat-related advisories or warnings. Heat advisories or warnings are issued to the public when values approach dangerous levels.
This study will attempt to show the frequency of various heat index values for a section of the United States, focusing on the Plains, upper and
middle Mississippi River Valleys, and the western Great Lakes. Also, the physiological response to heat will be briefly investigated, including a review of how heat acclimatization affects the human body’s biology. This protective biological response is an important consideration when evaluating the impact of the heat on those that are, or are not, acclimatized to the heat.
In this study, 95°F will be used as the start for the climatological analysis as prolonged exposure to heat this warm increases the risk of sunstroke, heat cramps, and heat exhaustion (Table 1) .
2. Data
All available weather observations from the National Climatic Data Center were used from 192 locations (Fig. 1), extending from Utah to Michigan, and from the Canadian-U.S. border south to a northern New Mexico to Arkansas line. Initially, the period of record used was the last set of climate normals, 1971-2000. Due to some data unreliability and station closures, a majority of the sites only had data extending back to 1973. This study focused on the summer months of June, July and August, when the combination of heat and humidity produces the highest heat indices. Some areas of study were under-represented by the original data set. In an attempt to fill these data voids, “newer” locations were used and therefore more recent data (1990 to the present) were incorporated into the data set. These additional data were used sparingly, trying to keep the data set as true to the 1971-2000 period as possible.

2
The data were quality controlled and observations were eliminated where the temperatures and dew points were suspect or missing. If there was any question to the integrity of an observation, it was eliminated from the data set.
Appendix A contains a full listing of the sites used and related data.
3. Results
The frequency of occurrence of heat indices from 95°F to 110°F (every 5 degrees) was calculated over the data domain, along with air temperatures of 95 degrees or greater (Figs. 2-6). A 110°F heat index was used as the extreme value for analysis as data indicated that heat indices warmer than 110°F occurred very infrequently (generally less than 5 observations out of 10,000). Even in the warmest, most humid areas, percentages of observations with heat indices over 110°F were predominantly under 0.5%.
Examining the frequency of occurrence of 95°F degree or greater air temperatures (Fig. 2), a broad maximum is located across much of the Central Plains into portions of southern South Dakota. This was expected as the latitude and
geographical and climatic location (humid continental to semi arid; Fig. 7) favor warm to hot summer temperatures. The maximum over the Badlands of South Dakota is also a favored location for warm to hot summer temperatures due to terrain and relative lack of vegetation (Fig. 8).
Within this broad maximum are a few areas where the percentage of warm air temperatures is reduced. Across southern Missouri, the somewhat higher elevation and more densely vegetated Ozarks keep this region cooler than locations to its south and west. The higher elevation of the Black Hills in western South Dakota keep that area relatively cooler compared to the warmer Badlands to the south and east. South of the Badlands are the Sand Hills of Nebraska, which is another minimum. The Sand Hills is a region of mixed-grass prairie covering just over one-quarter of Nebraska, and is the largest and most intricate wetland ecosystem in the United States. It’s this ecosystem that keeps it cooler than surrounding territories.
Inspecting the heat index maps (Figs. 3-6), a maximum is noted from the Central Plains east to the middle Mississippi River Valley. The
Fig 1. Observation sites used in this study.

3
Central Plains are a favored location for warm to hot summer temperatures and high heat indices are expected. Meanwhile, the middle Mississippi River Valley is generally not as warm as locations to the west, but dew points during the summer are high. This is largely the result of two processes: moisture from the Gulf of Mexico transported north, and evapotranspiration from vegetative cover. Looking more closely at this broad area, the influence of the Ozarks is noted with a relative minimum of high heat indices in this area (Figs. 4-5).
A few other, more minor maxima are evident, especially on the 100°F or greater heat index map (Fig. 4). Over central South Dakota, a maximum is indicated near Pierre and areas to the east. While there are not many data points in this area, this maximum appears to be valid for a couple reasons: geography and irrigation. In South Dakota the terrain transitions from a hilly, drier, and more arid land in the west (Black Hills and the Badlands), to flatter terrain, more vegetation and crops in the east. The higher percentage of crops and vegetation requires more irrigation resulting in additional evaporation and evapotranspiration.
Another minor maximum is located over southwest Minnesota. This area is located on the lee side of the Buffalo Ridge, which is a large expanse of rolling hills and the second highest point in Minnesota. Down sloping winds off this ridge can lead to warmer temperatures compared to surrounding portions of Minnesota. In addition, agriculture is predominant across southern Minnesota, adding moisture via evapotranspiration. These influences likely play a role in the higher heat indices.
A minimum in the heat index is indicated over southeast Minnesota (Figs. 3-4). Rochester is the data point associated with these lower values, and this observation site is located at the airport, on an open and unsheltered ridge south of the city. Its location makes it cooler than surrounding areas, with lower dew points. Therefore, while representative for the data point
itself, the localized minimum is not as widespread as the figures would suggest.
One more maximum of note is located over southeast Colorado, and is only apparent on the 95°F air temperature and heat index maps (Figs. 2-3). A likely explanation for this would be deep mixing in the afternoon leading to warm temperatures but low humidities. Further investigation of the data points responsible for this maximum (PUB, LAA, and LHX) revealed that all the instances of 95-degree temperatures or heat indices occurred late in the afternoon, during peak heating. Relative humidities were less than 30% in nearly all cases with temperatures above 100°F about 60% of the time. This supports the maximum indicated in Figures 2 and 3. However, at temperatures this warm, further moisture would be required to raise the heat indices higher. In a deeply mixed environment, this is difficult to accomplish without some form of moisture advection. Since this is rare on days this warm over southeast Colorado, a maximum is not evident for heat indices above 95°F (Figs. 4-6).
In the more northern latitudes, temperatures are generally not as warm, nor is there a nearby large source of moisture (i.e., Gulf of Mexico). Therefore, the frequency of high heat indices is much less.
4. Physiological Effects of Heat
The body tries to maintain a consistent temperature by using various means to cool or warm itself. When blood is heated above 98.6°F, the body attempts to dissipate this extra heat by losing water through the skin and sweat glands, varying the rate and depth of blood circulation, and as a last resort – panting. About 90 percent of the body’s heat is lost through the skin, mostly through perspiration. Above 98.6°F, heat can only be lost through sweating.
4
Sweating itself does not cool the body; rather, it’s the evaporation of this water that performs this function. Energy is required to change liquid water into a vapor, and the body provides this in the form of heat. However, some water vapor condenses back onto the body, returning some of that heat energy back to the body. In order for the body to cool, the rate of evaporation needs to exceed the rate of condensation. As the humidity increases, the rate of condensation starts to limit the amount of cooling from evaporation, causing the core body temperature to rise. In addition to overheating, the loss of water through sweating can lead to dehydration and can cause chemical imbalances in the body as essential minerals (such as salt) are lost through the sweat. Dehydration also depletes the body of water needed for sweating and thickens the blood. The heart has to pump harder to move the blood through the body, straining the heart and blood vessels as it does. The increased heart rate and blood flow can cause harm, or even death, to those with heart
or circulatory diseases.
Overall, the inability of the body to shed heat, and the loss of fluids and minerals through sweating, can result in various heat-related disorders and illnesses, such as heat cramps, heat exhaustion, and heat stroke (Table 1). One common element to them all is that the individual affected has either overexposed or overexerted him or herself in a very warm (and likely humid) environment. Research has also shown that the severity of heat disorders increases with age. For instance, what may cause heat cramps in a 17-year old could result in heat exhaustion in someone 40, while a 60-year old could suffer heat stroke.
Heat Acclimatization
Heat acclimatization is a term used to describe the physiological adaptations associated with prolonged exposure to high environmental temperatures. During the process, resting pulse rate decreases, blood flow to the skin improves, and sweating increases. Sweat becomes more watery so that heat loss from the body can be maximized without losing too much salt. Heat-acclimatized individuals suffer less from nausea, dizziness, and discomfort in hot conditions.
The bulk of the available research focuses on short-term acclimatization: how quickly individuals laboring or performing strenuous athletics in high heat environments can adjust to the heat. Acclimatization takes about 1 to 2 weeks, but when removed from this environment, can be lost in nearly the same amount of the time. Resting in the heat results in some acclimatization, but a greater adaptive state can be induced by intermittent exposure to exercise in the heat (Greenleaf and Kaciuba-Uschiko 1989). A degree of acclimatization can also be achieved by just living and working in a hot climate. However, those that participate in strenuous outdoor activities usually acclimatize more rapidly, and retain the benefits longer, compared to sedentary individuals.
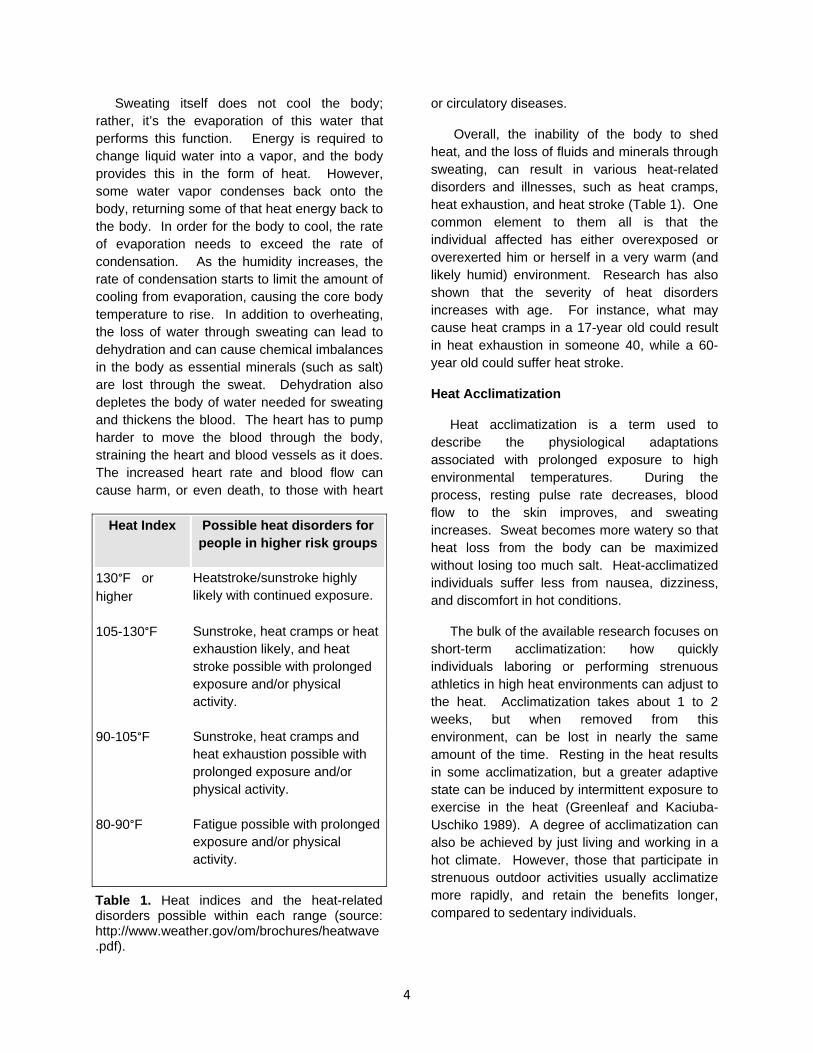
Heat Index Possible heat disorders for people in higher risk groups
130°F or higher
Heatstroke/sunstroke highly likely with continued exposure.
105-130°F Sunstroke, heat cramps or heat exhaustion likely, and heat stroke possible with prolonged exposure and/or physical activity.
90-105°F Sunstroke, heat cramps and heat exhaustion possible with prolonged exposure and/or physical activity.
80-90°F Fatigue possible with prolonged exposure and/or physical activity.
Table 1. Heat indices and the heat-related disorders possible within each range (source: http://www.weather.gov/om/brochures/heatwave.pdf).

5
This research supports the perception that individuals that are more accustomed to the heat (i.e., live in a warmer climate) will have a higher tolerance and be less affected by it, compared to individuals that live in cooler climates. However, the research also suggests that full acclimatization occurs by coupling active outdoor activities (sports, labor, etc.) with a very warm environment.
Heat acclimatization acts to protect the body from the heat. When discussing the impacts of high temperatures and humidity, this biological response should be taken into consideration.
5. Summary
Heat is an underrated danger, and the heat index is a way to assess the threat from the combined effects of the air temperature and humidity. Around 175 people in the United States lose their lives each year from heat related causes.
A review of historical summer (June through August) observations for 192 locations, mostly across the Plains and upper and mid-Mississippi River Valleys showed a propensity for dangerous heat across the Central Plains into the mid-Mississippi River Valley. The geographic and climatic location, along with proximity to the Gulf of Mexico, makes these areas prone to very warm temperatures, and in some cases, high humidity. This results in more frequent and higher heat indices. Other more localized maxima are located over portions of central South Dakota, and southwest Minnesota. Across the bulk of the Northern Plains and Great Lakes States, frequencies of high heat indices are much lower due to the latitude and geographical location.
Research has shown that active individuals in warm environments can become acclimatized to the heat. The body adjusts to these high heat conditions, helping to protect itself from the heat’s effects. Comparatively, sedentary individuals in a similar environment do not acclimatize as well and will be at a higher risk to
suffer from heat-related illnesses. Individuals unaccustomed to very warm environments, such as those that live in higher latitudes, will also be at a greater risk as their bodies have had little exposure, and therefore time, to acclimatize.
6. References
Center for Disease Control and Prevention, cited 2006: Extreme Heat: A Prevention Guide to Promote Your Personal Health and Safety. [Available online at http://emergency.cdc.gov/disasters/extremeheat/heat_guide.asp.]
Greenleaf John E. , Hanna Kaciuba-Uscilko, April 1989: Acclimatization to Heat in Humans. National Aeronautics and Space Administration Technical Memorandum 101011, 1-24.
National Weather Service: Heat Wave. [Available online at http://www.weather.gov/om/brochures/heatwave.pdf.]
NIOSH, 1986:Criteria for a Recommended Standard…Occupational Exposure to Hot Environments. DHHS (NIOSH) Publication No. 86-113, 135 pp.
Steadman, R. G., 1979: The Assessment of Sultriness. Part I: A Temperature-Humidity Index Based on Human Physiology and Clothing Science. Journal of Applied Meteorology, 18, 861-873.
Steadman, R. G., 1979: The Assessment of Sultriness. Part II: Effects of Wind, Extra Radiation and Barometric Pressure on Apparent Temperature. Journal of Applied Meteorology, 18, 874-885.

6
Fig 2. Percent of observations with an air temperature of 95°F or greater June through August.
Fig 3. Percent of observations with heat indices of 95°F or greater June through August.

7
Fig 4. Percent of observations with heat indices of 100°F or greater June through August.
Fig 5. Percent of observations with heat indices of 105°F or greater June through August.

8
Fig 7. Climate zones of the Continental United States (source: http://en.wikipedia.org/wiki/File:Climatemapusa2.PNG).
Fig 6. Percent of observations with heat indices of 110°F or greater June through August.

9
Fig 8. Topography map from the Rocky Mountains east to the Great Lakes and Ohio River Valley (source:http://commons.wikimedia.org/wiki/File:USA_topo_en.jpg )

10
APPENDIX A
Observation sites included in this study, with total number of observations (OBS total), number of observations with an air temperature of 95°F or greater (95°F or greater), percentage with 95°F or greater air temperature (%95°F or greater), and percentage of certain heat indices (for example, HI 100°F % represents the percentage of observations that produced a 100°F or warmer heat index in the data set).
Site ID Name OBS total
95°F or greater
% 95°F or
greater HI 95°F % HI 100°F % HI 105°F % HI 110°F %
KABR Aberdeen 58201 749 1.3 2.53 0.95 0.22 0.03 KANW Ainsworth 35636 1065 3 3.9 0.85 0.13 0.01 KAKO Akron, CO 55352 723 1.3 0.17 0 0 0 KCAK Akron, OH 64902 56 0.1 0.83 0.16 0.04 0 KALS Alamosa 49492 0 0 0 0 0 0 KABQ Albuquerque 63082 1759 2.8 0.36 0 0 0 KAXN Alexandria 59679 156 0.3 1.17 0.3 0.06 0.01 KAIA Alliance 36234 1203 3.3 1.54 0.2 0.02 0 KAMA Amarillo 65307 2264 3.5 1.63 0.09 0 0 KASE Aspen 38208 0 0 0 0 0 0 KBEI Beatrice 32570 2037 6.3 12.7 5.78 1.66 0.37 KBJI Bemidji 46788 89 0.2 0.51 0.1 0.01 0 KBIL Billings 63052 798 1.3 0.26 0.01 0 0 KBIS Bismarck 63882 656 1 1.16 0.35 0.03 0 KBWG Bowling Green 59950 673 1.1 7.55 2.74 0.74 0.17 KBRD Brainerd 39707 145 0.4 1.87 0.68 0.16 0.06 KTRI Bristol 28872 27 0.1 0.83 0.07 0 0 KBBW Broken Bow 31405 805 2.6 4.88 1.12 0.16 0.04 KBRL Burlington 58224 562 1 5.87 2.74 0.98 0.26 KBTM Butte 48529 21 0 0 0 0 0 KCAD Cadillac 38215 41 0.1 0.53 0.23 0.09 0.03 KVOK Camp Douglass 21950 106 0.5 2.63 0.94 0.31 0.1 KCGI Cape Girardeau 59918 1236 2.1 12.22 5.75 1.98 0.49 KCPR Casper 63086 518 0.8 0.04 0 0 0 KCDR Chadron 42804 2048 4.8 2.19 0.23 0.01 0 KCMI Champaign/Urbana 50016 382 0.8 5.7 2.62 1.12 0.35 KCNU Chanute 50682 2067 4.1 12.43 5.17 1.58 0.4 KCHA Chattanooga 64278 1016 1.6 7.71 2.34 0.5 0.13 KCYS Cheyenne 64290 34 0.1 0 0 0 0 KCHI Chicago 63606 317 0.5 3.05 1.2 0.38 0.11 KCAO Clayton 65536 906 1.4 0.14 0 0 0 KCOU Columbia 64308 1032 1.6 7.54 3.13 0.84 0.11 KCMH Columbus 64362 172 0.3 2.43 0.68 0.1 0.02 KOLU Columbus, NE 39490 1143 2.9 7.99 3.68 1.25 0.34 KCNK Concordia 64294 2946 4.6 8.25 3.21 0.75 0.1 KCEZ Cortez 22147 93 0.4 0.22 0.05 0.03 0.01 KCVG Covington 64390 232 0.4 3.28 0.99 0.2 0.02 KDHT Dalhart 50171 1740 3.5 1.19 0.04 0 0 KDAY Dayton 65036 199 0.3 2.36 0.65 0.15 0.04 KDEN2 Den-Stapleton 48708 438 0.9 0.06 0 0 0

11
Site ID Name OBS total
95°F or greater
% 95°F or
greater HI 95°F % HI 100°F % HI 105°F % HI 110°F %
KDEN Denver 37913 550 1.5 0.09 0 0 0 KDSM Des Moines 64240 731 1.1 4.2 1.7 0.61 0.09 KDVL Devils Lake 16219 98 0.6 0.94 0.17 0.02 0.01 KDIK Dickinson 57437 656 1.1 0.6 0.09 0.01 0 KDDC Dodge City 65535 4539 6.9 7.11 1.79 0.17 0.01 KDBQ Dubuque 50051 117 0.2 2.35 0.88 0.25 0.05 KDLH Duluth 65535 7 0 0.16 0.01 0 0 KDYR Dyersburg 44909 1096 2.4 17.57 7.76 2.57 0.72 KEAU Eau Clairie 63116 201 0.3 1.3 0.52 0.13 0.04 KEHA Elkhart 17816 895 5 2.11 0.26 0.06 0.01 KELO Ely 64587 23 0 0.43 0.09 0.01 0 KEMP Emporia 45852 1860 4.1 11.32 4.31 1.14 0.25 KEND Enid 62241 5270 8.5 13.03 5.3 1.04 0.1 CYEN Estevan 50953 250 0.5 0.28 0.04 0.01 0.01 KEVW Evanston 23137 0 0 0.01 0.01 0 0 KEVV Evansville 64707 836 1.3 8.78 3.56 1.01 0.18 KFNB Falls City 19354 959 5 13.9 6.74 2.01 0.42 KFAR Fargo 63958 290 0.5 1.25 0.35 0.09 0 KFMN Farmington 53526 738 1.4 0.08 0 0 0 KFYV Fayetteville 57912 1108 1.9 8.63 2.6 0.46 0.05 KFDY Findlay 59878 129 0.2 1.76 0.57 0.11 0.03 KFLP Flippin 55858 2004 3.6 9.19 3.14 0.59 0.03 KFNL Fort Collins 20099 38 0.2 0 0 0 0 KFWA Fort Wayne 64570 236 0.4 2.59 0.89 0.24 0.05 KTBN Ft. Leonard Wood 38795 1213 3.1 11.58 4.39 1.27 0.33 KGAG Gage 54600 4426 8.1 9.21 2.08 0.23 0.05 KGCK Garden City 57813 3875 6.7 6.46 1.4 0.04 0 KGCC Gillette 53108 643 1.2 0.22 0.01 0.01 0 KGGW Glasgow 63233 790 1.2 0.43 0.04 0 0 KGDV Glendive 20308 238 1.2 0.38 0.06 0 0 KGLD Goodland 65535 1960 3 1.29 0.04 0 0 KGFK Grand Forks 61826 191 0.3 0.95 0.22 0.04 0 KGRI Grand Island 65318 1649 2.5 4.93 1.81 0.35 0.06 KGJT Grand Junction 62687 2393 3.8 0.43 0.01 0 0 KGRR Grand Rapids 64604 69 0.1 1.41 0.37 0.05 0.02 KGBD Great Bend 18952 842 4.4 6.64 1.74 0.12 0.01 KGRB Green Bay 65130 110 0.2 0.88 0.4 0.12 0.04 KHRO Harrison 56342 932 1.7 6.83 1.83 0.41 0.13 KHSI Hastings 33410 1249 3.7 8.89 3.6 0.91 0.2 KHDN Hayden 25096 0 0 0 0 0 0 KHYS Hays 19563 1209 6.2 6.99 2.12 0.21 0 KHIB Hibbing 59292 23 0 0.25 0.03 0 0 KHLC Hill City 41790 3975 9.5 10.57 3.46 0.6 0.09 KHOT Hot Springs 42280 3470 8.2 24.42 10.88 3.31 0.49 KHTL Houghton Lake 53056 38 0.1 0.43 0.08 0.02 0.02 KHTS Huntington 65535 244 0.4 3.13 0.71 0.12 0.02 KHON Huron 63492 1028 1.6 3.58 1.42 0.36 0.07

12
Site ID Name OBS total
95°F or greater
% 95°F or
greater HI 95°F % HI 100°F % HI 105°F % HI 110°F %
KHUT Hutchinson 34369 2817 8.2 13.25 5.62 1.36 0.26 KIML Imperial 19995 586 2.9 2.45 0.5 0.1 0.02 KIND Indianapolis 64589 222 0.3 3.18 1.44 0.4 0.05 KINL International Falls 63445 30 0 0.25 0.04 0 0 KIMT Iron Mountain 30953 38 0.1 0.91 0.44 0.12 0.05 KIWD Ironwood 41533 33 0.1 0.43 0.06 0.01 0 KJAC Jackson 38552 0 0 0 0 0 0 KJKL Jackson, KY 56216 94 0.2 1.9 0.39 0.05 0 KJBR Jonesboro 56049 2008 3.6 16.67 7.56 2.33 0.44 KJLN Joplin 60881 1815 3 10.43 4.02 0.91 0.1 KMCI Kansas City 63882 1385 2.2 8.3 2.96 0.92 0.1 KEAR Kearney 39576 1066 2.7 5.39 1.37 0.22 0.02 KIRK Kirksville 41107 763 1.9 7.81 3.06 0.73 0.1 KTYS Knoxville 64711 414 0.6 4.57 1.08 0.14 0.01 KLSE La Crosse 63263 391 0.6 2.89 1.24 0.56 0.21 KLHX La Junta 56673 4631 8.2 3.35 0.2 0 0 KLAF Lafayette 59684 453 0.8 4.65 1.98 0.69 0.2 KLAA Lamar 28509 10061 7.2 2.7 0.34 0.04 0.01 KLAN Lansing 64077 118 0.2 1.17 0.44 0.08 0.02 KLVS Las Vegas, NM 41052 24 0.1 0 0 0 0 KLEX Lexington 64795 228 0.4 3.24 0.77 0.08 0 KLBL Liberal 31646 2875 9.1 9.69 2.51 0.54 0.16 KLIC Limon 32540 100 0.3 0.01 0 0 0 KLNK Lincoln 64774 2017 3.1 7.62 3.34 1.03 0.2 KLIT Little Rock 25131 1499 6 21.14 11.61 4.11 0.84 KSDF Louisville 64579 514 0.8 6.9 2.7 0.72 0.13 KMSN Madison 64734 162 0.3 1.63 0.62 0.17 0.05 KMKT Mankato 34118 181 0.5 3.21 1.44 0.59 0.2 KMQT Marquette 37993 21 0.1 0.2 0.01 0 0 KMCW Mason City 63238 272 0.4 2.8 1.14 0.31 0.05 KMCK McCook 37625 2615 7 7.77 1.93 0.27 0.03 KP28 Medicine Lodge 48019 4791 10 13.02 5.35 1 0.07 KMEM Memphis 63096 1948 3.1 19.1 9.13 2.84 0.61 KMLS Miles City 37821 1494 4 1.75 0.24 0.01 0.01 KMKE Milwaukee 64386 189 0.3 1.73 0.66 0.16 0.06 KMSP Minneapolis 63928 283 0.4 1.92 0.67 0.18 0.03 KMOT Minot 65536 408 0.6 0.68 0.13 0.03 0.01 KCNY Moab 6521 360 5.5 2.5 0.18 0 0 KMBG Mobridge 18793 185 1 1.1 0.44 0.05 0.01 KMLI Moline 64158 561 0.9 4.84 2.19 0.78 0.21 KMTJ Montrose 26716 210 0.8 0.09 0 0 0 KJMR Mora 18748 6 0 0.88 0.28 0.1 0.03 KMVN Mount Vernon 21834 193 0.9 8.48 4.04 1.89 0.68 KMHN Mullen 20611 459 2.2 2.18 0.24 0.01 0.01 KMKG Muskegon 63953 7 0 0.39 0.07 0.02 0.01 KBNA Nashville 64056 926 1.4 8.12 2.54 0.48 0.04 KOFK Norfolk 61045 1056 1.7 4.49 1.62 0.3 0.03

13
Site ID Name OBS total
95°F or greater
% 95°F or
greater HI 95°F % HI 100°F % HI 105°F % HI 110°F %
KLBF North Platte 64940 1259 1.9 2.33 0.38 0.04 0 KOGA Ogallala 49382 1874 3.8 2.25 0.34 0.04 0 KOKC Oklahoma City 64301 3947 6.1 13.06 4.66 0.81 0.06 KOAX Omaha 61553 1231 2 7.05 3.41 1.18 0.24 KONL O'Neill 17811 349 2 4.21 1.34 0.16 0.01 KODX Ord 36987 944 2.6 5.86 1.8 0.35 0.03 KOTM Ottumwa 58092 740 1.3 5.4 2.28 0.66 0.16 KPAH Paducah 51099 512 1 9.54 4.11 1.07 0.13 KPGA Page 58409 4928 8.4 1.87 0.11 0.01 0 KPPF Parsons 25740 1106 4.3 12.06 5.52 1.47 0.14 KPIA Peoria 64978 436 0.7 4.82 2.17 0.74 0.19 KPHP Phillip 11978 633 5.3 4.64 1.49 0.23 0 KPIR Pierre 65316 2538 3.9 4.43 1.62 0.42 0.07 KPHI Pocatello 61698 665 1.1 0.13 0 0 0 KPNC Ponca City 54476 5029 9.2 17.46 8.13 2.19 0.34 KPOF Poplar Bluff 48409 557 1.2 11.56 5.13 1.36 0.29 KPUC Price 32613 87 0.3 0 0 0 0 KPUB Pueblo 62904 3199 5.1 1.19 0.02 0 0 KUIN Quincy 59619 721 1.2 5.48 2.35 0.65 0.17 KRAP Rapid City 63205 1151 1.8 0.95 0.13 0 0 KRWL Rawlins 47281 26 0.1 0 0 0 0 KRWF Redwood Falls 56641 678 1.2 3.72 1.67 0.59 0.1 KRHI Rhinelander 34582 27 0.1 0.74 0.26 0.11 0.03 KRIW Riverton 29691 161 0.5 0.07 0.02 0.01 0.01 KRST Rochester 64986 106 0.2 0.92 0.43 0.12 0.02 KVIH Rolla/Vichy 49276 796 1.6 7.22 2.31 0.56 0.19 KMBS Saginaw 60745 159 0.3 1.54 0.54 0.15 0.05 KSLN Salina 59651 7318 12.3 12.27 5.72 1.7 0.37 KSLC Salt Lake City 65535 2479 3.8 0.66 0.03 0 0 CYAM Sault Ste Marie 36401 0 0 0.06 0 0 0 KBFF Scottsbluff 63485 1515 2.4 0.95 0.08 0 0 KDMO Sedalia 25664 576 2.2 8.42 3.8 1.1 0.07 KSHR Sheridan 59950 879 1.5 0.39 0.05 0 0 KSNY Sidney 62106 1241 2 0.45 0 0 0 KSUX Sioux City 64796 691 1.1 4.69 1.98 0.52 0.08 KFSD Sioux Falls 64444 762 1.2 3.37 1.19 0.27 0.05 KSBN South Bend 64697 244 0.4 2.43 0.82 0.24 0.07 KSPW Spencer 45001 364 0.8 3.76 1.51 0.5 0.11 KSGF Springfield 64312 1122 1.7 7.05 2.04 0.21 0.01 KSPI Springfield, IL 64276 576 0.9 6.45 3.03 1.1 0.27 KSTC St Cloud 46586 174 0.4 1.59 0.51 0.13 0.02 KSTJ St Jospeh 32153 980 3 11.96 5.56 1.96 0.37 KSTL St Louis 64454 1405 2.2 9.99 4.33 1.31 0.35 KTEX Telluride 33574 0 0 0 0 0 0 CYQT Thunder Bay 50802 18 0 0.11 0.03 0.01 0 KTOP Topeka 65535 1710 2.6 9.99 4.45 1.24 0.18 KTCC Tucumcari 39850 2895 7.3 3.05 0.27 0.01 0

14
Site ID Name OBS total
95°F or greater
% 95°F or
greater HI 95°F % HI 100°F % HI 105°F % HI 110°F %
KTUL Tulsa 65535 4472 6.8 18.07 8.79 2.85 0.6 KTUP Tupelo 23673 771 3.3 20.13 10.05 3.78 1.51 KVTN Valentine 65535 1753 2.7 2.55 0.64 0.06 0 KVEL Vernal 21048 139 0.7 0.11 0.02 0 0 KARG Walnut Ridge 19088 394 2.1 11.33 4.29 1.13 0.21 KALO Waterloo 63667 353 0.6 3.01 1.29 0.47 0.1 KATY Watertown 52667 359 0.7 1.7 0.47 0.08 0.01 KAUW Wausau 41095 39 0.1 0.57 0.16 0.06 0.01 KICT Wichita 64515 4590 7.1 11.42 4.5 0.85 0.09 KISN Williston 63381 884 1.4 0.91 0.19 0.02 0 KINW Winslow 65535 2393 3.7 0.39 0.01 0 0