healthy urban environment characterization focused on physical activity and food: a gis-based method
TRANSCRIPT

Healthy urban environment characterization
focused on physical activity and food: A GIS-
based method
Alba Cebrecos1,2 ([email protected]), Julia Díez2, Pedro Gullón2,
Usama Bilal2,3, Manuel Franco2,3 and Francisco Escobar1,2
1. Department of Geology, Geography and Environment, Faculty of Biology,
Chemistry and Environmental Sciences, University of Alcalá, Alcalá de
Henares, Madrid, Spain.
2. Social and Cardiovascular Epidemiology Research Group, Universidad de
Alcala, Madrid, Spain
3. Johns Hopkins Bloomberg School of Public Health, Baltimore, MD

http://hhhproject.eu
Background
OBESITY
ENERGY INTAKE
ENERGY EXPEDITURE
OBESOGENIC ENVIRONMENT
FOOD ENVIRONMENT
PHYSICAL ACTIVITY ENVIRONMENT
INDIVIDUAL BEHAVIOURS
BUILTENVIRONMENT
Individual SES
Socioeconomicenvironment

http://hhhproject.eu
Background
Conectivity
Foodstores
Diversity
Accesibility
Ratio
Facilities
Sprawl
Urbandesign
Safety
Price
FOOD ENVIRONMENT
PHYSICAL ACTIVITY ENVIRONMENT
INTE
GR
ATED
AP
PR
OA
CH
GIS
-bas
ed
OBESOGENIC ENVIRONMENT

http://hhhproject.eu
Objective
To design a multivariable tool based on
Geographic Information Systems (GIS) to integrate
information from the physical activity and food
environment to better characterize obesogenic
environments in urban areas.
http://hhhproject.eu
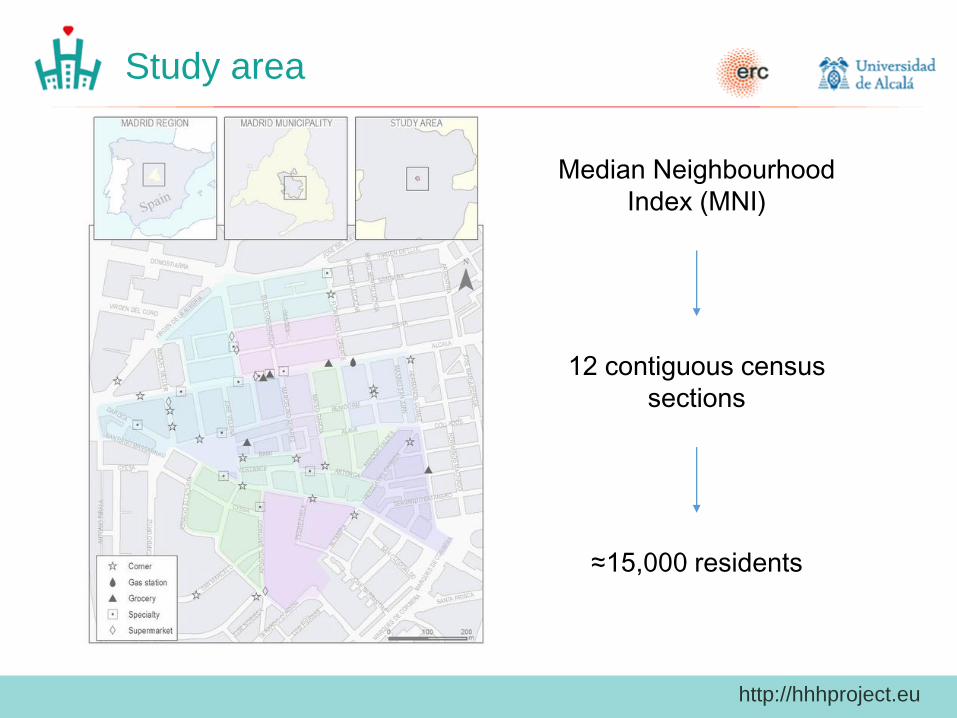
Median Neighbourhood
Index (MNI)
12 contiguous census
sections
≈15,000 residents
Study area

http://hhhproject.eu

http://hhhproject.eu
Methods

http://hhhproject.eu
Methods
Kernel Density Estimation
(KDE)

http://hhhproject.eu
Results

http://hhhproject.eu
Discussion and conclusions
Development of an innovative method to assess the obesogenic
environment by a synthetic index integrating measures of food and
physical activity environments
Results highlight a way to consider urban environments as
integrated promoters or barriers for healthy behaviors such as
better eating and being physically active
Synthetic index may be relevant tool to inform future urban health
interventions or research.
Future research may consider more complex weighting of factors
when considering the importance of the food and physical activity
environment

http://hhhproject.eu
THANKS!Questions?

http://hhhproject.eu
Results
7915024 7915030 7915033 7915034 7915035 7915036 7915037 7915038 7915039 7915112 7915113 7915114 TOTAL
Population (%) 980 (6.5) 1110 (7.4) 1265 (8.4) 635 (4.2) 1205 (8.0) 540 (3.6) 1335 (8.9) 2145 (14.3) 1980 (13.2) 1680 (11.2) 1480 (9.9) 625 (4.2) 14975
Women (%) 555 (56.6) 600 (54.0) 780 (61.6) 395 (62.2) 670 (55.6) 320 (59.2) 750 (56.2) 1210 (56.4) 1135 (57.3) 980 (58.3) 865 (58.4) 315 (50.4) 8580 (57.3)
Foreign born (%) 200 (20.4) 205 (18.5) 165 (13.0) 115 (18.1) 230 (19.1) 485 (18.5) 535 (20.5) 495 (23.1) 190 (9.6) 200 (11.9) 205 (13.8) 165 (26.4) 2615 (17.5)
Years <16 (%) 180 (18.4) 60 (5.4) 135 (10.7) 25 (6.8) 130 (10.8) 70 (13.0) 125 (9.4) 230 (10.7) 105 (5.3) 140 (8.3) 40 (2.7) 70 (11.2) 1320 (8.8)
Years > 65 (%) 180 (18.4) 310 (28.0) 435 (34.4) 255 (40.1) 300 (24.9) 160 (29.6) 250 (18.7) 350 (16.3) 505 (25.5) 230 (13.7) 395 (10.8) 275 (26.7) 3645 (24.3)
Area in km2 (%) 0.05 (12.0) 0.04 (9.3) 0.05 (12.2) 0.03 (7.4) 0.03 (6.3) 0.02 (4.7) 0.03 (6.9) 0.04 (9.6) 0.03 (7.9) 0.03 (8.1) 0.03 (8.2) 0.03 (7.5) 0.42
Density Hab/m2 19366.1 28224.2 24478.0 20359.1 45451.1 27387.5 45980.6 53011.4 59102.7 49018.2 42545.8 19691.2 35416.4
Characterization LOW MEDIUM-LOW MEDIUM-LOW HIGHMEDIUM-
HIGHMEDIUM-LOW LOW LOW
MEDIUM-HIGH
LOWMEDIUM-
HIGHMEDIUM-LOW