healthy living consumer products: industry update, … living consumer products: ... foods, zevia,...
TRANSCRIPT

Michael Burgmaier
Managing Director
Nicolas McCoy
Managing Director
Healthy Living Consumer Products:
Industry Update, Deal Review and 'Hot' Categories
Natural Products Expo West
March 2018

2
3
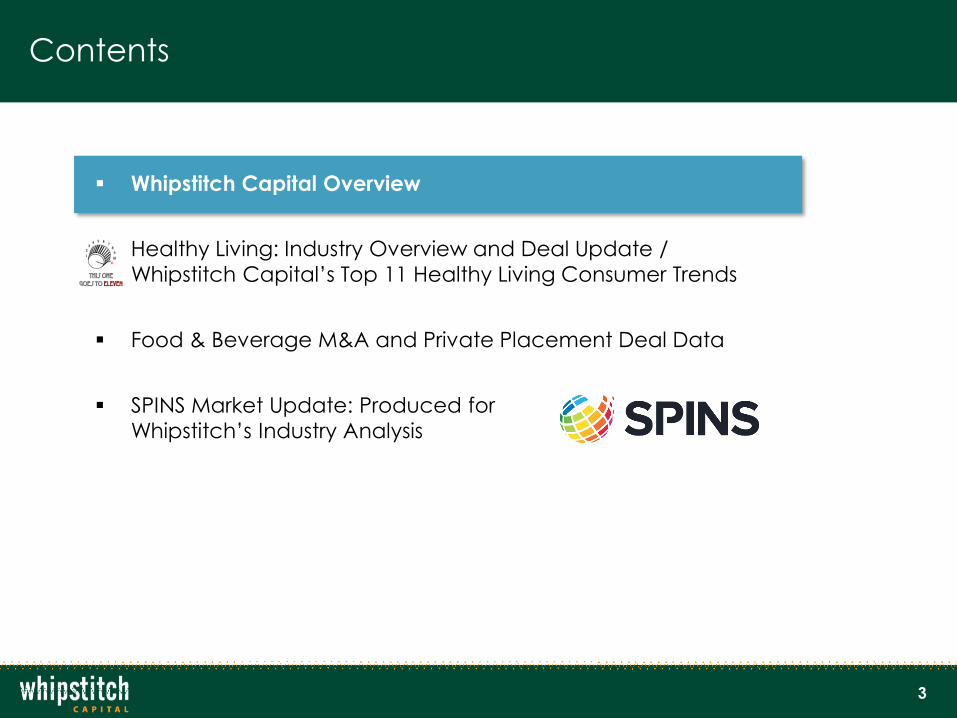
Contents
▪ Whipstitch Capital Overview
▪ Healthy Living: Industry Overview and Deal Update /
Whipstitch Capital’s Top 11 Healthy Living Consumer Trends
▪ Food & Beverage M&A and Private Placement Deal Data
▪ SPINS Market Update: Produced for
Whipstitch’s Industry Analysis
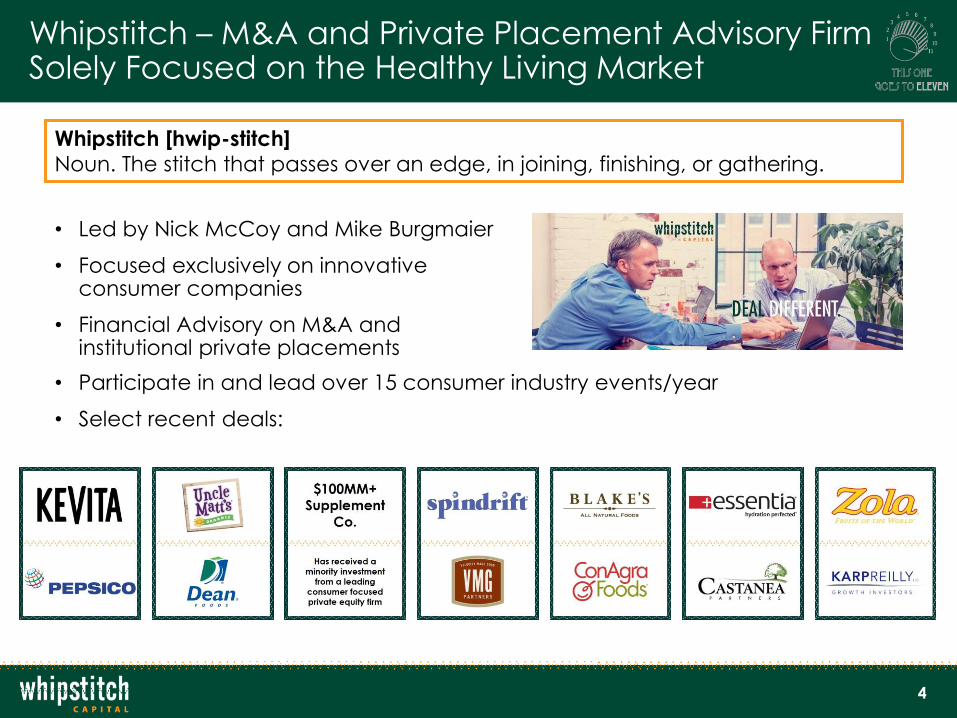
Whipstitch – M&A and Private Placement Advisory Firm Solely Focused on the Healthy Living Market
4
• Participate in and lead over 15 consumer industry events/year
• Select recent deals:
Whipstitch [hwip-stitch]Noun. The stitch that passes over an edge, in joining, finishing, or gathering.
• Led by Nick McCoy and Mike Burgmaier
• Focused exclusively on innovative consumer companies
• Financial Advisory on M&A and institutional private placements

We Deal Different: 100% Founder Owned, 100% Consumer Focused, Middle-Market Banking Capabilities
5
100% Owned by
Mike And Nick
Mike and Nick are entrepreneurs
Founded Whipstitch; have been working together
for 11 years
Whipstitch is here for the long term
100% Consumer
Focused
Highly experienced Team: Over 50 years of transactional
experience
Cohesive: Over 30 years of combined experience working
with one another
We know how to talk about your company, no learning curve
Middle-Market Banking
Capabilities, High-touch Commitment
We do BIG DEALS with strategic acquirers
Middle-market capabilities with a high-touch approach
Unrivaled access to key decision makers
Recent Client Acquirers
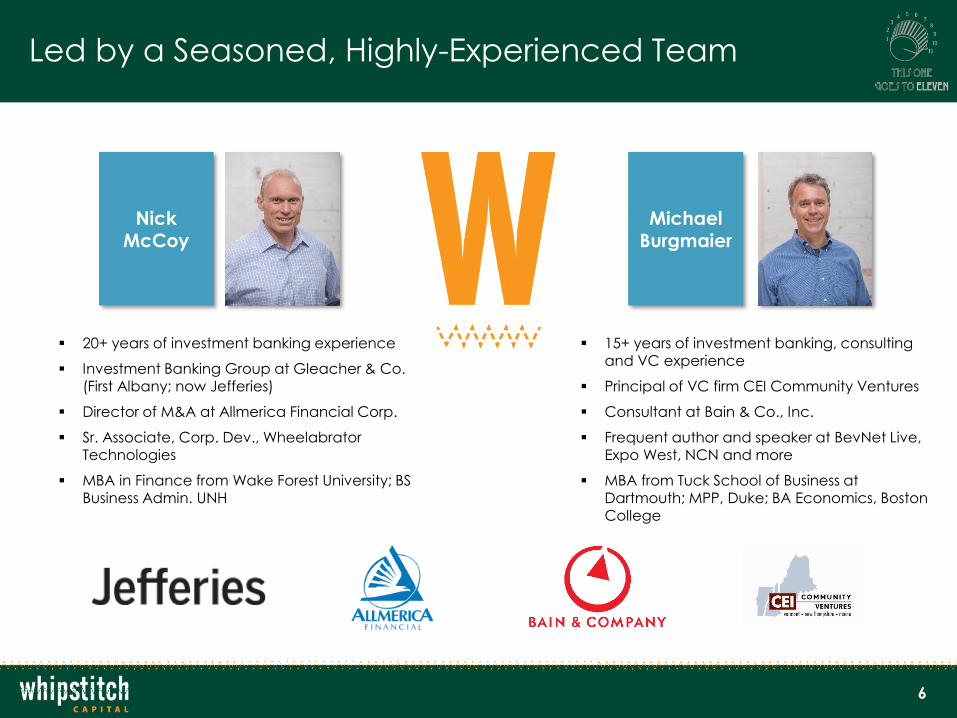
Led by a Seasoned, Highly-Experienced Team
6
Nick McCoy
Michael Burgmaier
▪ 20+ years of investment banking experience
▪ Investment Banking Group at Gleacher & Co. (First Albany; now Jefferies)
▪ Director of M&A at Allmerica Financial Corp.
▪ Sr. Associate, Corp. Dev., Wheelabrator Technologies
▪ MBA in Finance from Wake Forest University; BS Business Admin. UNH
▪ 15+ years of investment banking, consulting and VC experience
▪ Principal of VC firm CEI Community Ventures
▪ Consultant at Bain & Co., Inc.
▪ Frequent author and speaker at BevNet Live, Expo West, NCN and more
▪ MBA from Tuck School of Business at Dartmouth; MPP, Duke; BA Economics, Boston College
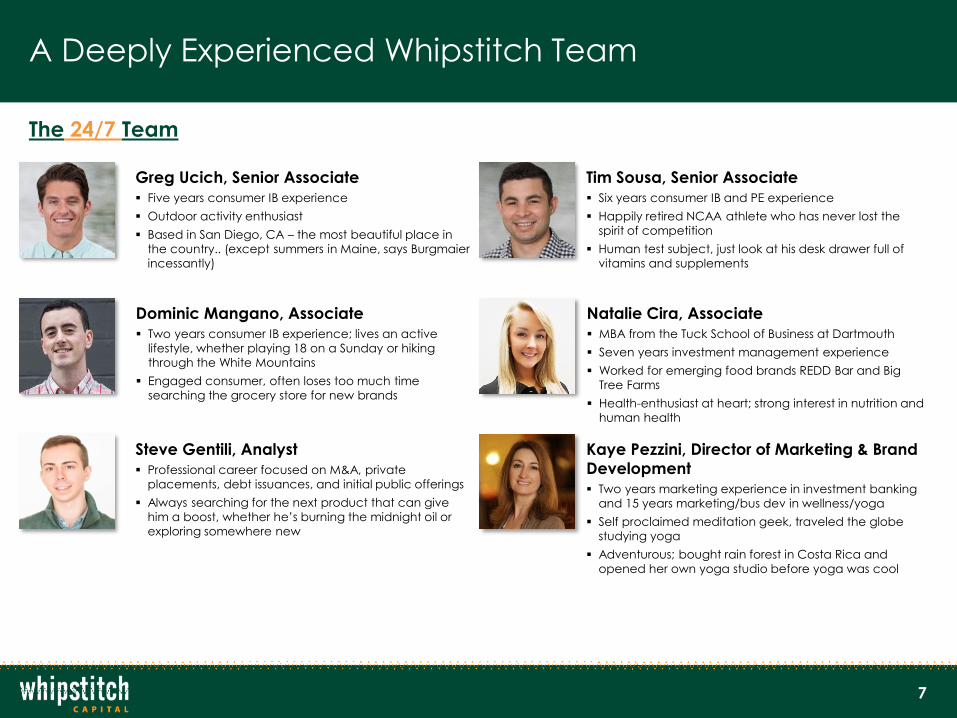
A Deeply Experienced Whipstitch Team
7
Natalie Cira, Associate
▪ MBA from the Tuck School of Business at Dartmouth
▪ Seven years investment management experience
▪ Worked for emerging food brands REDD Bar and Big
Tree Farms
▪ Health-enthusiast at heart; strong interest in nutrition and
human health
The 24/7 Team
Greg Ucich, Senior Associate
▪ Five years consumer IB experience
▪ Outdoor activity enthusiast
▪ Based in San Diego, CA – the most beautiful place in
the country.. (except summers in Maine, says Burgmaier
incessantly)
Tim Sousa, Senior Associate
▪ Six years consumer IB and PE experience
▪ Happily retired NCAA athlete who has never lost the
spirit of competition
▪ Human test subject, just look at his desk drawer full of
vitamins and supplements
Dominic Mangano, Associate
▪ Two years consumer IB experience; lives an active
lifestyle, whether playing 18 on a Sunday or hiking
through the White Mountains
▪ Engaged consumer, often loses too much time
searching the grocery store for new brands
Kaye Pezzini, Director of Marketing & Brand
Development
▪ Two years marketing experience in investment banking
and 15 years marketing/bus dev in wellness/yoga
▪ Self proclaimed meditation geek, traveled the globe
studying yoga
▪ Adventurous; bought rain forest in Costa Rica and
opened her own yoga studio before yoga was cool
Steve Gentili, Analyst
▪ Professional career focused on M&A, private
placements, debt issuances, and initial public offerings
▪ Always searching for the next product that can give
him a boost, whether he’s burning the midnight oil or
exploring somewhere new
8
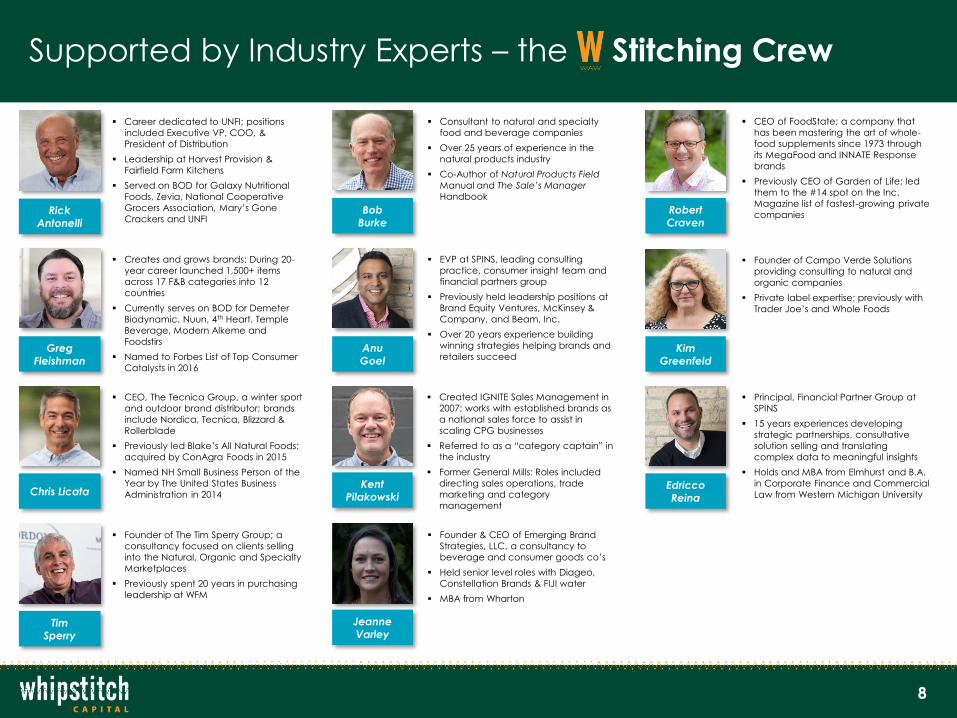
Supported by Industry Experts – the Stitching Crew
Kent Pilakowski
▪ Created IGNITE Sales Management in
2007; works with established brands as
a national sales force to assist in
scaling CPG businesses
▪ Referred to as a “category captain” in
the industry
▪ Former General Mills: Roles included
directing sales operations, trade
marketing and category
management
Chris Licata
▪ CEO, The Tecnica Group, a winter sport
and outdoor brand distributor; brands
include Nordica, Tecnica, Blizzard &
Rollerblade
▪ Previously led Blake’s All Natural Foods;
acquired by ConAgra Foods in 2015
▪ Named NH Small Business Person of the
Year by The United States Business
Administration in 2014
▪ Consultant to natural and specialty
food and beverage companies
▪ Over 25 years of experience in the
natural products industry
▪ Co-Author of Natural Products Field
Manual and The Sale’s Manager
Handbook
Bob Burke
▪ Founder of Campo Verde Solutions
providing consulting to natural and
organic companies
▪ Private label expertise; previously with
Trader Joe’s and Whole Foods
Kim Greenfeld
Rick Antonelli
▪ Career dedicated to UNFI; positions
included Executive VP, COO, &
President of Distribution
▪ Leadership at Harvest Provision &
Fairfield Farm Kitchens
▪ Served on BOD for Galaxy Nutritional
Foods, Zevia, National Cooperative
Grocers Association, Mary’s Gone
Crackers and UNFI
Anu Goel
▪ EVP at SPINS, leading consulting
practice, consumer insight team and
financial partners group
▪ Previously held leadership positions at
Brand Equity Ventures, McKinsey &
Company, and Beam, Inc.
▪ Over 20 years experience building
winning strategies helping brands and
retailers succeed
Edricco Reina
▪ Principal, Financial Partner Group at
SPINS
▪ 15 years experiences developing
strategic partnerships, consultative
solution selling and translating
complex data to meaningful insights
▪ Holds and MBA from Elmhurst and B.A.
in Corporate Finance and Commercial
Law from Western Michigan University
▪ Creates and grows brands: During 20-
year career launched 1,500+ items
across 17 F&B categories into 12
countries
▪ Currently serves on BOD for Demeter
Biodynamic, Nuun, 4th Heart, Temple
Beverage, Modern Alkeme and
Foodstirs
▪ Named to Forbes List of Top Consumer
Catalysts in 2016
GregFleishman
▪ CEO of FoodState; a company that
has been mastering the art of whole-
food supplements since 1973 through
its MegaFood and INNATE Response
brands
▪ Previously CEO of Garden of Life; led
them to the #14 spot on the Inc.
Magazine list of fastest-growing private
companiesRobert Craven
Jeanne Varley
▪ Founder & CEO of Emerging Brand
Strategies, LLC, a consultancy to
beverage and consumer goods co’s
▪ Held senior level roles with Diageo,
Constellation Brands & FIJI water
▪ MBA from Wharton
Tim Sperry
▪ Founder of The Tim Sperry Group; a
consultancy focused on clients selling
into the Natural, Organic and Specialty
Marketplaces
▪ Previously spent 20 years in purchasing
leadership at WFM
8
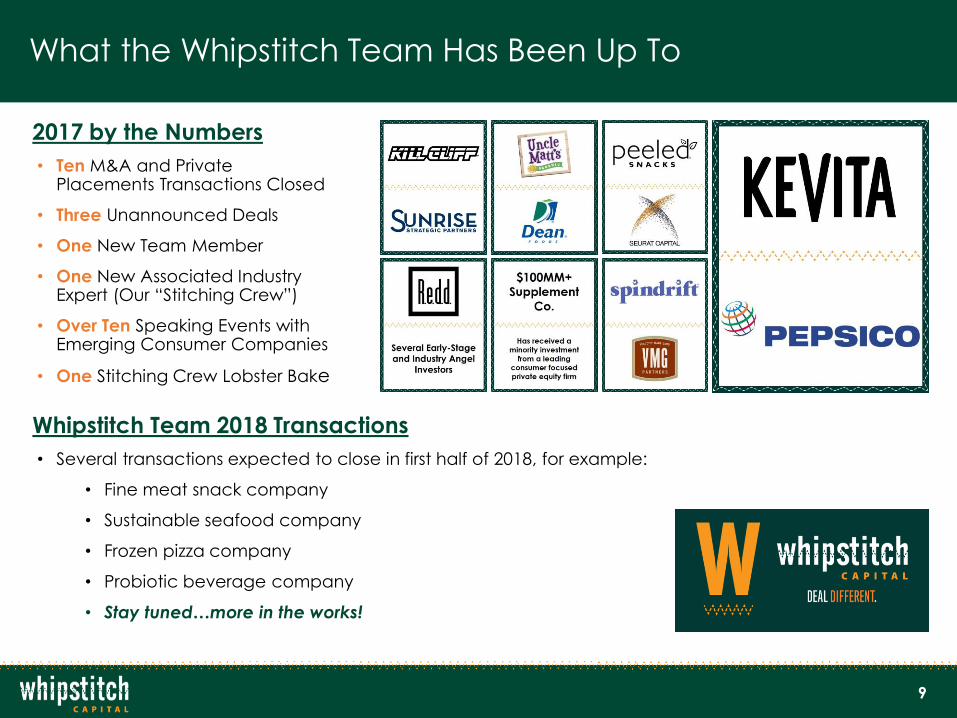
What the Whipstitch Team Has Been Up To
2017 by the Numbers
• Ten M&A and Private Placements Transactions Closed
• Three Unannounced Deals
• One New Team Member
• One New Associated Industry Expert (Our “Stitching Crew”)
• Over Ten Speaking Events with Emerging Consumer Companies
• One Stitching Crew Lobster Bake
Whipstitch Team 2018 Transactions
• Several transactions expected to close in first half of 2018, for example:
• Fine meat snack company
• Sustainable seafood company
• Frozen pizza company
• Probiotic beverage company
• Stay tuned…more in the works!
9

10
The Whipstitch Way: You Get the Best Bankers… and More
Whipstitch…Explained
▪ Whipstitch Capital provides a hands-on approach to better-for-you consumer clients
▪ Our core-competencies surround running highly-competitive processes for our high-growth clients
▪ Whipstitch actively consults with our clients to ensure they are building equity value on a daily basis
▪ Whipstitch serves as connectors – this is our only industry and we are entrenched in it, we know the
buyers, investors, retailers – the key decision makers…
▪ Do not take our word for it, we would probably under-promise and over-deliver anyways..
‘Nick and Mike led KeVita
expertly through more than five
financing transactions and the
ultimate exit to PepsiCo. Their
knowledge, insight and tactical
instincts created an amazing
opportunity for KeVita and a
tremendous outcome.’
Bill Moses – Co-Founder, CEO
and Chairman, KeVita
‘When Whipstitch presented to
Uncle Matt's, they came
prepared with an in-depth
analysis of our industry, and they
knew more than I expected
about our brand and space. The
Whipstitch team helped us every
step of the way, and they were
instrumental in negotiating the
final deal with Dean Foods.’
Matt McLean – Founder and
CEO Uncle Matt’s Organics
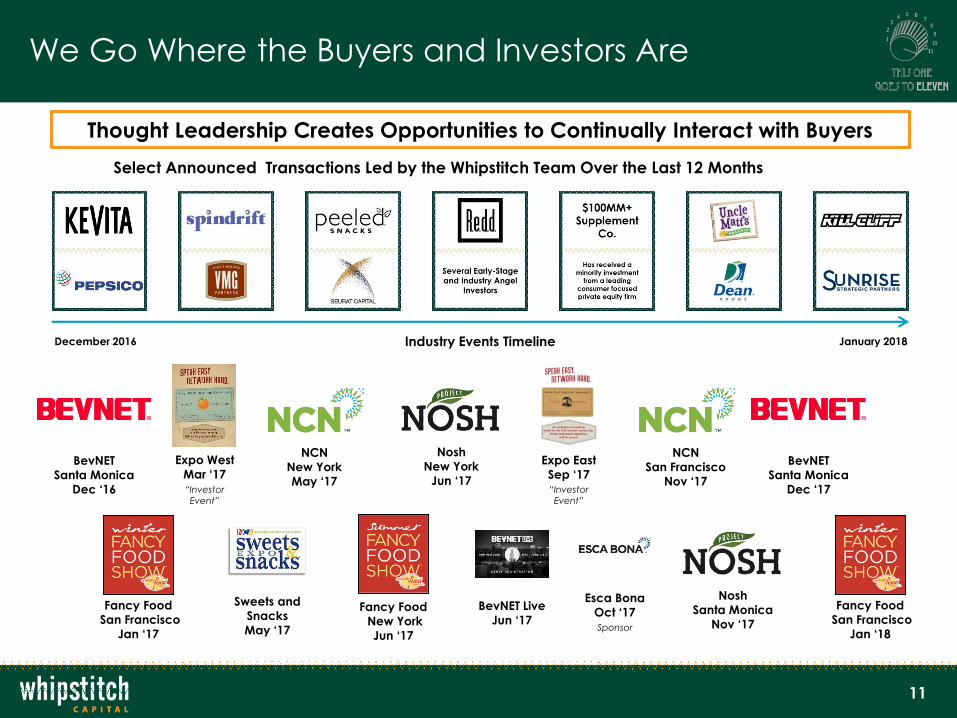
We Go Where the Buyers and Investors Are
11
Thought Leadership Creates Opportunities to Continually Interact with Buyers
Select Announced Transactions Led by the Whipstitch Team Over the Last 12 Months
December 2016 January 2018Industry Events Timeline
BevNET Live
Jun ‘17Fancy Food
New York
Jun ‘17
BevNET
Santa Monica
Dec ‘16
Fancy Food
San Francisco
Jan ‘17
“Investor
Event”
Expo West
Mar ‘17
Sweets and
Snacks
May ‘17
“Investor
Event”
Expo East
Sep ‘17
Fancy Food
San Francisco
Jan ‘18
Esca Bona
Oct ‘17Sponsor
BevNET
Santa Monica
Dec ‘17
NCN
San Francisco
Nov ‘17
NCN
New York
May ‘17
Nosh
New York
Jun ‘17
Nosh
Santa Monica
Nov ‘17
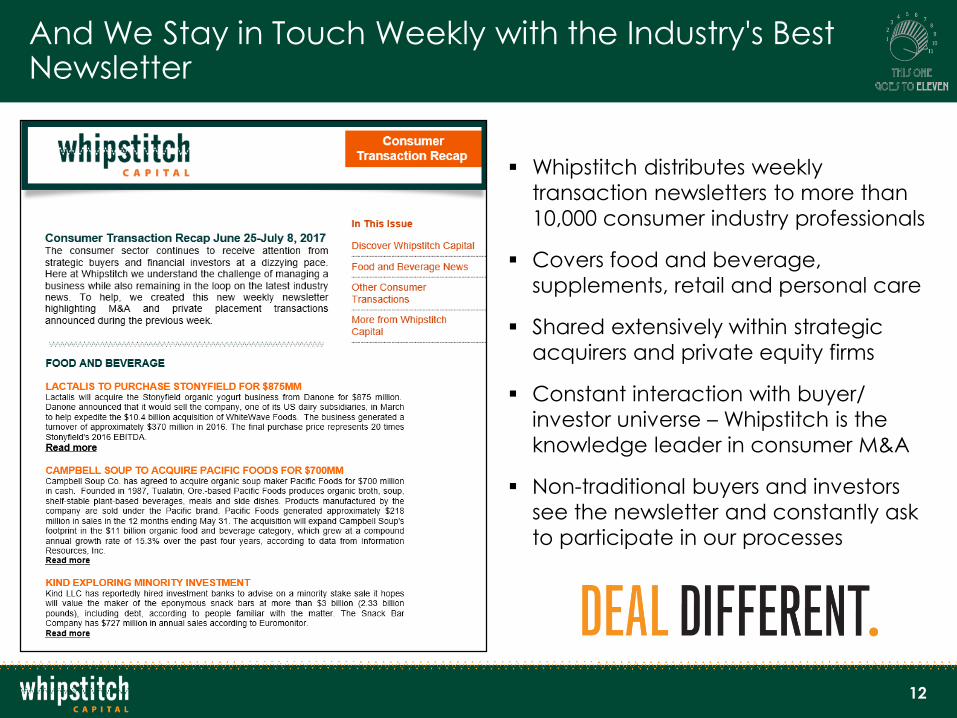
And We Stay in Touch Weekly with the Industry's Best Newsletter
12
▪ Whipstitch distributes weekly
transaction newsletters to more than
10,000 consumer industry professionals
▪ Covers food and beverage,
supplements, retail and personal care
▪ Shared extensively within strategic
acquirers and private equity firms
▪ Constant interaction with buyer/
investor universe – Whipstitch is the
knowledge leader in consumer M&A
▪ Non-traditional buyers and investors
see the newsletter and constantly ask
to participate in our processes
13
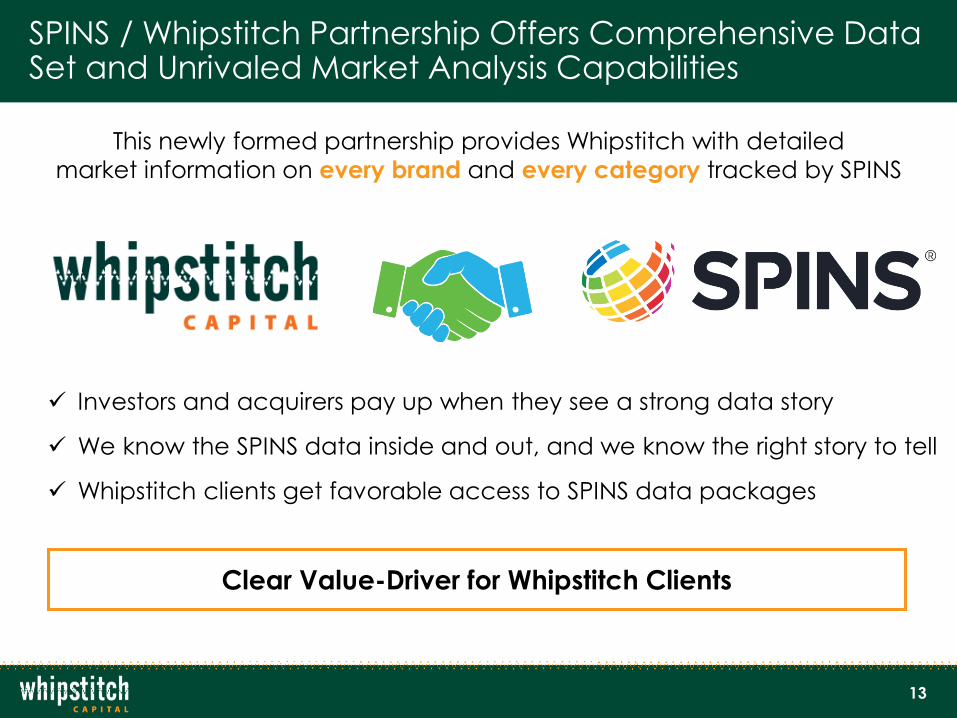
SPINS / Whipstitch Partnership Offers Comprehensive Data Set and Unrivaled Market Analysis Capabilities
✓ Investors and acquirers pay up when they see a strong data story
✓ We know the SPINS data inside and out, and we know the right story to tell
✓ Whipstitch clients get favorable access to SPINS data packages
This newly formed partnership provides Whipstitch with detailed
market information on every brand and every category tracked by SPINS
Clear Value-Driver for Whipstitch Clients
14
M&A Advisory: Select Deals Led by the Whipstitch Team
15
Private Placement Advisory: Select Deals Led by the Whipstitch Team
16
Contents
▪ Whipstitch Capital Overview
▪ Healthy Living: Industry Overview and Deal Update /
Whipstitch Capital’s Top 11 Healthy Living Consumer Trends
▪ Food & Beverage M&A and Private Placement Deal Data
▪ SPINS Market Update: Produced for
Whipstitch’s Industry Analysis
17
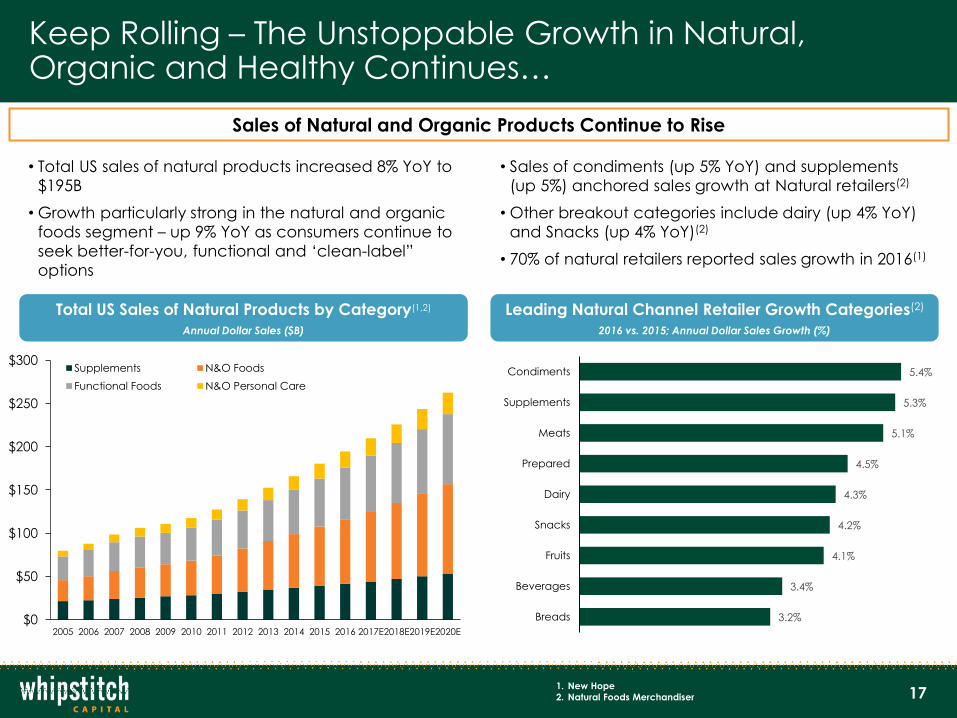
Keep Rolling – The Unstoppable Growth in Natural, Organic and Healthy Continues…
• Total US sales of natural products increased 8% YoY to
$195B
• Growth particularly strong in the natural and organic
foods segment – up 9% YoY as consumers continue to
seek better-for-you, functional and ‘clean-label”
options
$0
$50
$100
$150
$200
$250
$300
2005 2006 2007 2008 2009 2010 2011 2012 2013 2014 2015 2016 2017E2018E2019E2020E
Supplements N&O Foods
Functional Foods N&O Personal Care
• Sales of condiments (up 5% YoY) and supplements
(up 5%) anchored sales growth at Natural retailers(2)
• Other breakout categories include dairy (up 4% YoY)
and Snacks (up 4% YoY)(2)
• 70% of natural retailers reported sales growth in 2016(1)
Total US Sales of Natural Products by Category(1,2)
Annual Dollar Sales ($B)
Leading Natural Channel Retailer Growth Categories(2)
2016 vs. 2015; Annual Dollar Sales Growth (%)
5.4%
5.3%
5.1%
4.5%
4.3%
4.2%
4.1%
3.4%
3.2%
Condiments
Supplements
Meats
Prepared
Dairy
Snacks
Fruits
Beverages
Breads
1. New Hope
2. Natural Foods Merchandiser
Sales of Natural and Organic Products Continue to Rise
18
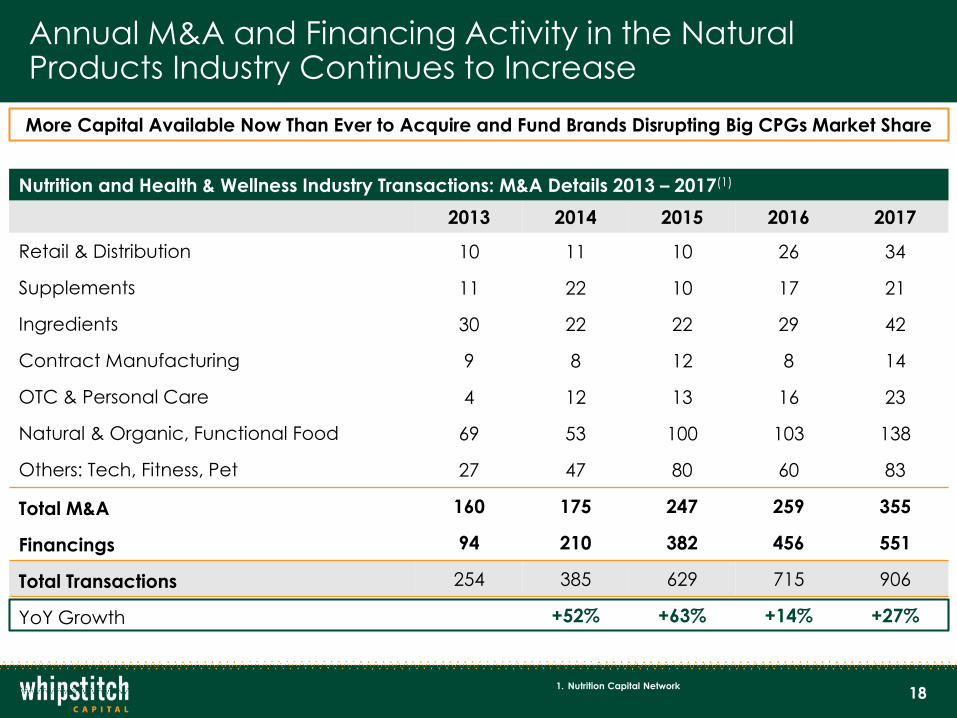
Annual M&A and Financing Activity in the Natural Products Industry Continues to Increase
Nutrition and Health & Wellness Industry Transactions: M&A Details 2013 – 2017(1)
2013 2014 2015 2016 2017
Retail & Distribution 10 11 10 26 34
Supplements 11 22 10 17 21
Ingredients 30 22 22 29 42
Contract Manufacturing 9 8 12 8 14
OTC & Personal Care 4 12 13 16 23
Natural & Organic, Functional Food 69 53 100 103 138
Others: Tech, Fitness, Pet 27 47 80 60 83
Total M&A 160 175 247 259 355
Financings 94 210 382 456 551
Total Transactions 254 385 629 715 906
YoY Growth +52% +63% +14% +27%
More Capital Available Now Than Ever to Acquire and Fund Brands Disrupting Big CPGs Market Share
1. Nutrition Capital Network

Buyer Target Date
19
Recent Food & Beverage M&A Highlights
Buyer Target Date Buyer Target Date
Jan 2018
Jan 2018
Dec 2017
Dec 2017
Dec 2017
Dec 2017
Dec 2017
Nov 2017
Nov 2017
Nov 2017
Oct 2017
Oct 2017
Oct 2017
Oct 2017
Sep 2017
Sep 2017
Feb 2018
Nov 2017
Feb 2018 Oct 2017
Dec 2017Feb 2018
Jan 2018
Nov 2017
Source: Pitchbook
20
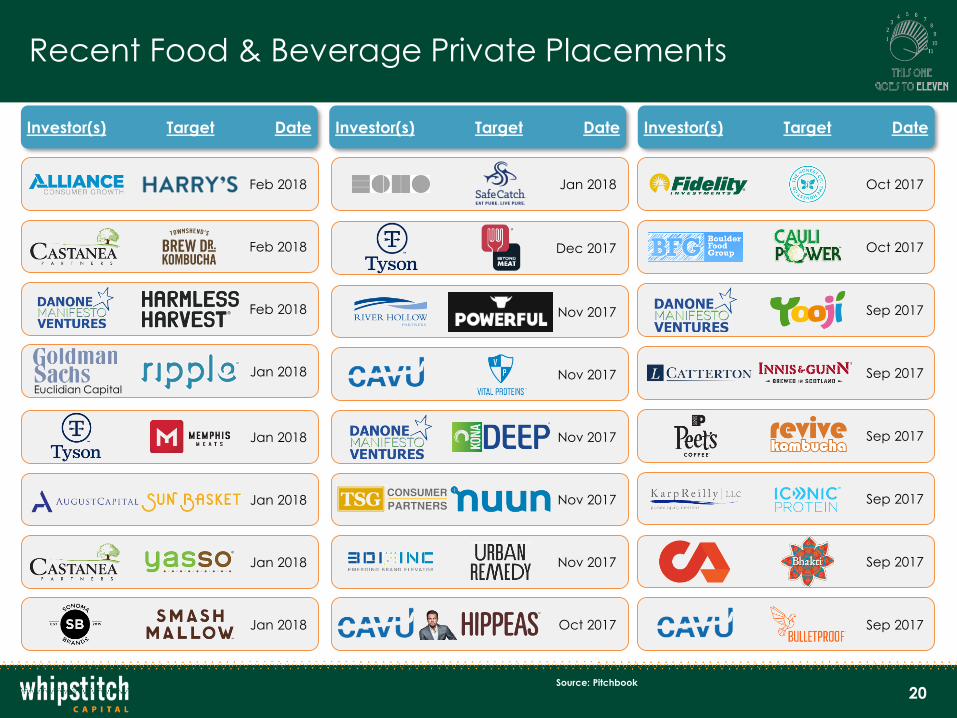
Recent Food & Beverage Private Placements
Investor(s) Target Date Investor(s) Target Date Investor(s) Target Date
Feb 2018
Feb 2018
Feb 2018
Euclidian Capital
Jan 2018
Jan 2018
Jan 2018
Jan 2018
Jan 2018
Jan 2018
Dec 2017
Nov 2017
Nov 2017
Nov 2017
Nov 2017
Nov 2017
Oct 2017
Oct 2017
Oct 2017
Sep 2017
Sep 2017
Sep 2017
Sep 2017
Sep 2017
Sep 2017
Source: Pitchbook
21
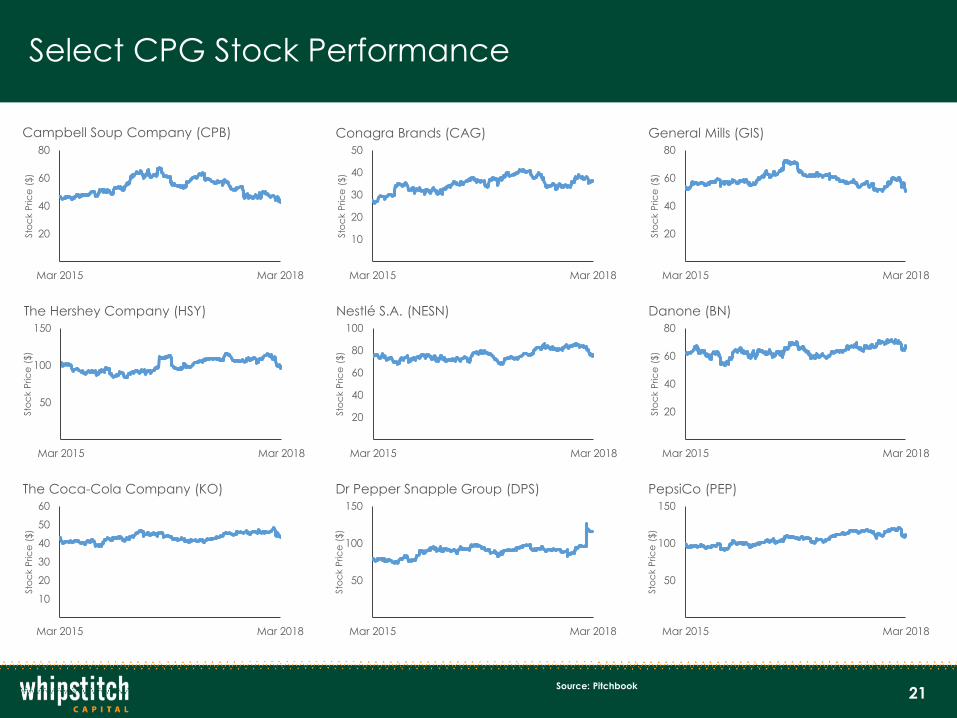
Select CPG Stock Performance
20
40
60
80
Mar 2015 Mar 2018
Sto
ck P
ric
e (
$)
Campbell Soup Company (CPB)
10
20
30
40
50
Mar 2015 Mar 2018
Sto
ck P
ric
e (
$)
Conagra Brands (CAG)
20
40
60
80
Mar 2015 Mar 2018
Sto
ck P
ric
e (
$)
General Mills (GIS)
50
100
150
Mar 2015 Mar 2018
Sto
ck P
ric
e (
$)
The Hershey Company (HSY)
10
20
30
40
50
60
Mar 2015 Mar 2018
Sto
ck P
ric
e (
$)
The Coca-Cola Company (KO)
20
40
60
80
100
Mar 2015 Mar 2018
Sto
ck P
ric
e (
$)
Nestlé S.A. (NESN)
20
40
60
80
Mar 2015 Mar 2018
Sto
ck P
ric
e (
$)
Danone (BN)
50
100
150
Mar 2015 Mar 2018
Sto
ck P
ric
e (
$)
Dr Pepper Snapple Group (DPS)
50
100
150
Mar 2015 Mar 2018
Sto
ck P
ric
e (
$)
PepsiCo (PEP)
Source: Pitchbook
22
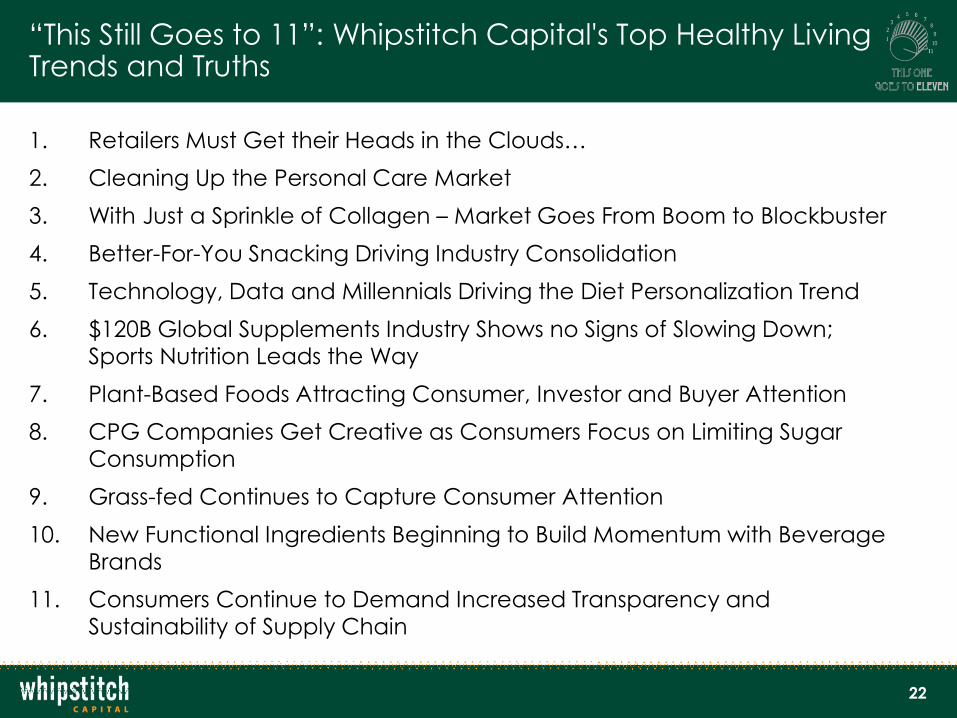
“This Still Goes to 11”: Whipstitch Capital's Top Healthy Living Trends and Truths
1. Retailers Must Get their Heads in the Clouds…
2. Cleaning Up the Personal Care Market
3. With Just a Sprinkle of Collagen – Market Goes From Boom to Blockbuster
4. Better-For-You Snacking Driving Industry Consolidation
5. Technology, Data and Millennials Driving the Diet Personalization Trend
6. $120B Global Supplements Industry Shows no Signs of Slowing Down; Sports Nutrition Leads the Way
7. Plant-Based Foods Attracting Consumer, Investor and Buyer Attention
8. CPG Companies Get Creative as Consumers Focus on Limiting Sugar Consumption
9. Grass-fed Continues to Capture Consumer Attention
10. New Functional Ingredients Beginning to Build Momentum with Beverage Brands
11. Consumers Continue to Demand Increased Transparency and Sustainability of Supply Chain

23
1. Retailers Must Get their Heads in the Clouds…
$0
$20
$40
$60
$80
$100
$120
Largest Grocery OutletsMost recent fiscal year sales ($B)(2)
• 70% of consumers will buy groceries online by 2024(1) (Note: NOT a typo)
• This off-putting, forward-facing fact retailers must accept is becoming a reality faster than expected – sales expected to hit $100B by 2022; nearly in half the time as originally thought(1)
• This means the online grocery opportunity is equivalent in dollar sales to the largest grocery retailer, Kroger, and may quickly surpass them should growth meet expectations
• Retailers forced to react – the value of the online opportunity estimated at $850 annually per US household(1)
Key Implications of Online Grocery Growth
With $100B in projected
sales, online grocery is the
second-largest grocery
outlet…
Brand Level
Retailer Level
• Anticipate an influx of M&A – retailers targeting online-centric businesses to drive revenue growth
• Retailers desperate for the online ‘recipe’ – easier bought than built; e.g. Albertsons and Plated
• Omni-channel is key, retailers are feeling the pain; what can your brand provide outside of ‘product’
• E.g. Kellogg’s acquisition of RxBar
helped Kellogg implement an online-strategy
1. Food Marketing Institute and Nielsen
2. Pitchbook
Online Grocery is Here. Period
242424
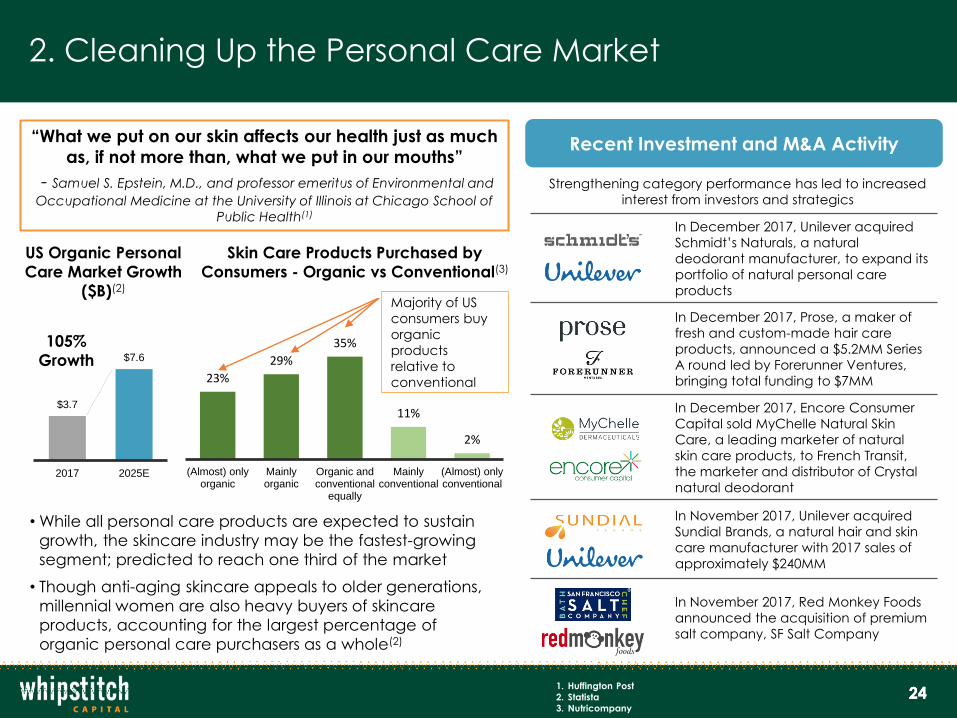
In December 2017, Unilever acquired
Schmidt’s Naturals, a natural
deodorant manufacturer, to expand its
portfolio of natural personal care
products
In December 2017, Prose, a maker of
fresh and custom-made hair care
products, announced a $5.2MM Series
A round led by Forerunner Ventures,
bringing total funding to $7MM
In December 2017, Encore Consumer
Capital sold MyChelle Natural Skin
Care, a leading marketer of natural
skin care products, to French Transit,
the marketer and distributor of Crystal
natural deodorant
In November 2017, Unilever acquired
Sundial Brands, a natural hair and skin
care manufacturer with 2017 sales of
approximately $240MM
In November 2017, Red Monkey Foods
announced the acquisition of premium
salt company, SF Salt Company
“What we put on our skin affects our health just as much
as, if not more than, what we put in our mouths”
- Samuel S. Epstein, M.D., and professor emeritus of Environmental and
Occupational Medicine at the University of Illinois at Chicago School of
Public Health(1)
• While all personal care products are expected to sustain
growth, the skincare industry may be the fastest-growing
segment; predicted to reach one third of the market
• Though anti-aging skincare appeals to older generations,
millennial women are also heavy buyers of skincare
products, accounting for the largest percentage of
organic personal care purchasers as a whole(2)
Recent Investment and M&A Activity
2. Cleaning Up the Personal Care Market
Strengthening category performance has led to increased
interest from investors and strategics
$3.7
$7.6
2017 2025E
US Organic Personal
Care Market Growth
($B)(2)
23%
29%
35%
11%
2%
(Almost) onlyorganic
Mainlyorganic
Organic andconventional
equally
Mainlyconventional
(Almost) onlyconventional
Skin Care Products Purchased by
Consumers - Organic vs Conventional(3)
105%
Growth
Majority of US
consumers buy
organic
products
relative to
conventional
1. Huffington Post
2. Statista
3. Nutricompany

25
3. With Just a Sprinkle of Collagen – Market Goes From Boom to Blockbuster
Demand for healthy aging is driving interest in collagen
Nutraceuticals & Beauty
$3.7
$6.6
2016 2025E
Collagen Applications – Expanding Beyond the Supplement Aisle
Collagen Market Growth ($B)(1)
• Global collagen market reached $3.7 billion in 2016 and is forecasted to reach $6.6 billion by 2025,(1) driven by
demand from key verticals including food & beverage, cosmetics and healthcare, among others(1)
• Food & beverage and healthcare application segments are expected to grow significantly over the coming years,
projected to grow at CAGRs of 7.2% and 6.4%, respectively(1)
• Growth of the food & beverage and healthcare industries can be attributed to the increasing awareness regarding
benefits of collagen consumption, growing population, growing geriatric population, and rising purchasing
capacity of consumers
Food & Beverage
Hair, Skin and Nails Supplements Sales ($MM)(2)
290% growth
$-
$400
$800
$1,200
$1,600
1. Grand View Research
2. Nutrition Business Journal
26
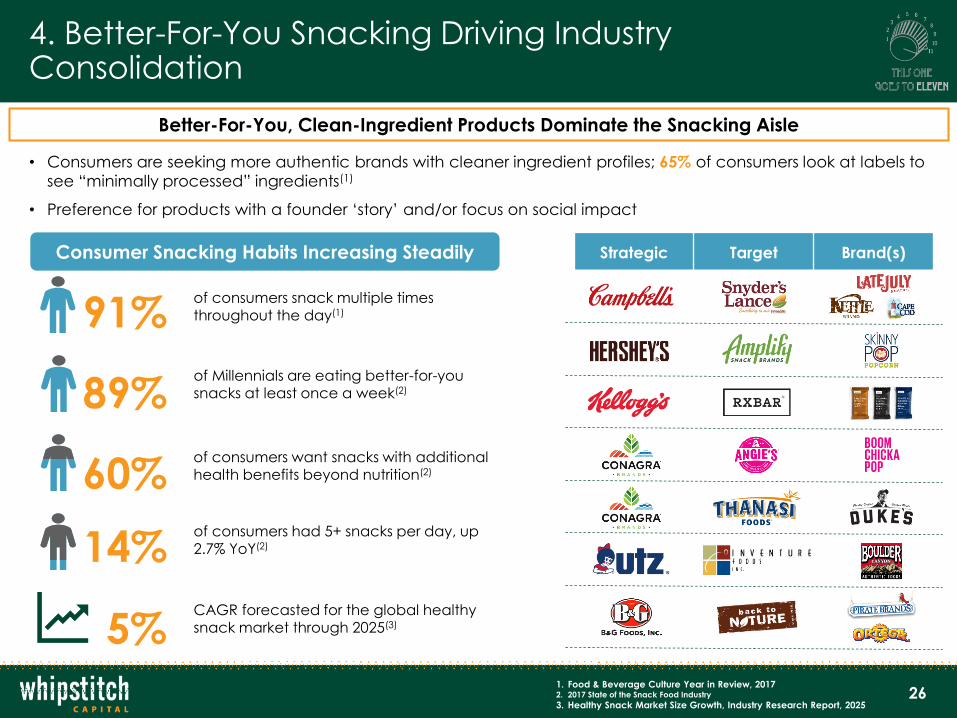
4. Better-For-You Snacking Driving Industry Consolidation
91%
Strategic Target Brand(s)
• Consumers are seeking more authentic brands with cleaner ingredient profiles; 65% of consumers look at labels to
see “minimally processed” ingredients(1)
• Preference for products with a founder ‘story’ and/or focus on social impact
Better-For-You, Clean-Ingredient Products Dominate the Snacking Aisle
1. Food & Beverage Culture Year in Review, 20172. 2017 State of the Snack Food Industry
3. Healthy Snack Market Size Growth, Industry Research Report, 2025
of Millennials are eating better-for-you snacks at least once a week(2)
of consumers had 5+ snacks per day, up 2.7% YoY(2)
Consumer Snacking Habits Increasing Steadily
of consumers snack multiple times
throughout the day(1)
89%
of consumers want snacks with additional health benefits beyond nutrition(2)60%
14%
5%CAGR forecasted for the global healthy snack market through 2025(3)
27
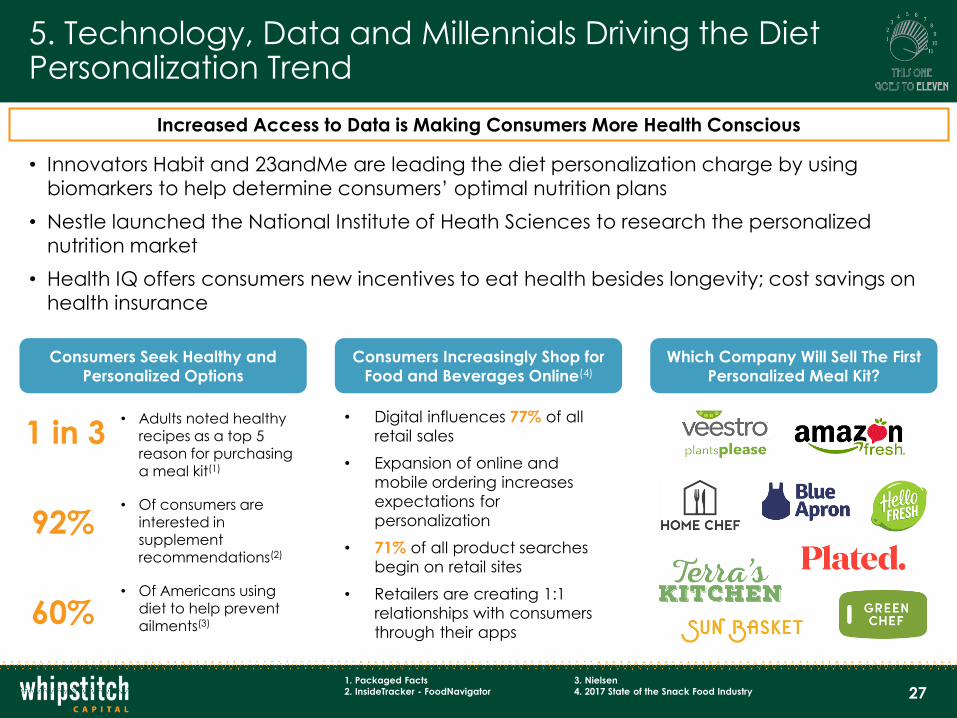
5. Technology, Data and Millennials Driving the Diet Personalization Trend
Consumers Seek Healthy and
Personalized Options
• Innovators Habit and 23andMe are leading the diet personalization charge by using
biomarkers to help determine consumers’ optimal nutrition plans
• Nestle launched the National Institute of Heath Sciences to research the personalized
nutrition market
• Health IQ offers consumers new incentives to eat health besides longevity; cost savings on
health insurance
Which Company Will Sell The First
Personalized Meal Kit?
• Digital influences 77% of all
retail sales
• Expansion of online and
mobile ordering increases
expectations for
personalization
• 71% of all product searches
begin on retail sites
• Retailers are creating 1:1
relationships with consumers
through their apps
Consumers Increasingly Shop for
Food and Beverages Online(4)
1. Packaged Facts
2. InsideTracker - FoodNavigator
Increased Access to Data is Making Consumers More Health Conscious
• Adults noted healthy recipes as a top 5 reason for purchasing a meal kit(1)
• Of consumers are interested in
supplement recommendations(2)
• Of Americans using diet to help prevent ailments(3)
3. Nielsen
4. 2017 State of the Snack Food Industry
1 in 3
92%
60%
28
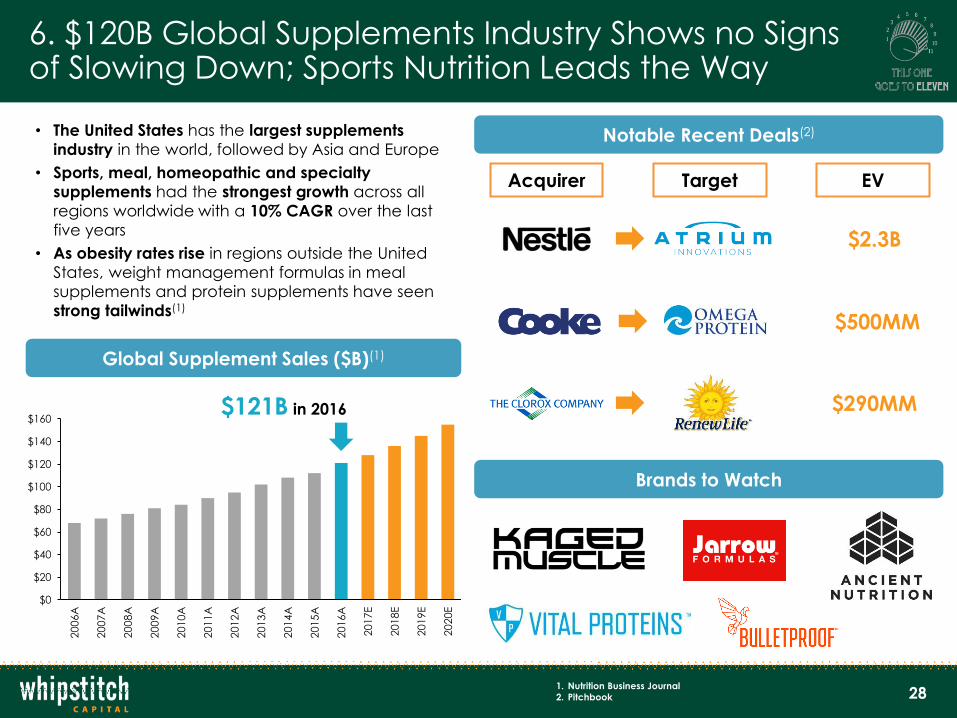
6. $120B Global Supplements Industry Shows no Signs of Slowing Down; Sports Nutrition Leads the Way
$0
$20
$40
$60
$80
$100
$120
$140
$160
2006A
2007A
2008A
2009A
2010A
2011A
2012A
2013A
2014A
2015A
2016A
2017E
2018E
2019E
2020E
Global Supplement Sales ($B)(1)
• The United States has the largest supplements
industry in the world, followed by Asia and Europe
• Sports, meal, homeopathic and specialty
supplements had the strongest growth across all
regions worldwide with a 10% CAGR over the last
five years
• As obesity rates rise in regions outside the United
States, weight management formulas in meal
supplements and protein supplements have seen
strong tailwinds(1)
$121B in 2016
Acquirer Target EV
Notable Recent Deals(2)
Brands to Watch
$290MM
$500MM
$2.3B
1. Nutrition Business Journal
2. Pitchbook

29
7. Plant-Based Foods Attracting Consumer, Investor and Buyer Attention
1. SPINS
2. Nutrition Business Journal
3. Healthy Focus International
Rapid Growth in the Plant-Based Segment Attracting Investors and Large GPG Co’s
• The plant-based food and beverage channel in the US reached $3.1B in annual sales with year-over-year growth of
8.1% (August 2016 to August 2017)(1)
• Growth driven by rapid consumer interest of plant-based diets – with 42% of consumers saying they know more about
plant-based diets than they did five years ago(2)
• 17% of consumers eat a predominantly plant-based diet and over 60% are cutting back on meat-based products
• Of those who are reducing their intake of animal-based proteins, 77% say the change is permanent(3)
Rising Interest in Plant-Based Foods
69% of consumers state they are eating more meatless-meals or meat-alternative based meals2
42% of consumers are more likely to try plant-based alternatives than five years ago
63% of consumersnoted they had tried plant-based protein alternatives
Investors and Large CPGs Taking
Notice – Recent Deals IncludeDairy Alternatives Leading the Way
Plant-based dairy sales up 20% YoY(3) with:
Yogurt up 56% YoY(3)
Milk up 5% YoY(3)Dec. ‘17
Jan. ‘18
Jan. ‘18
July ‘17
30
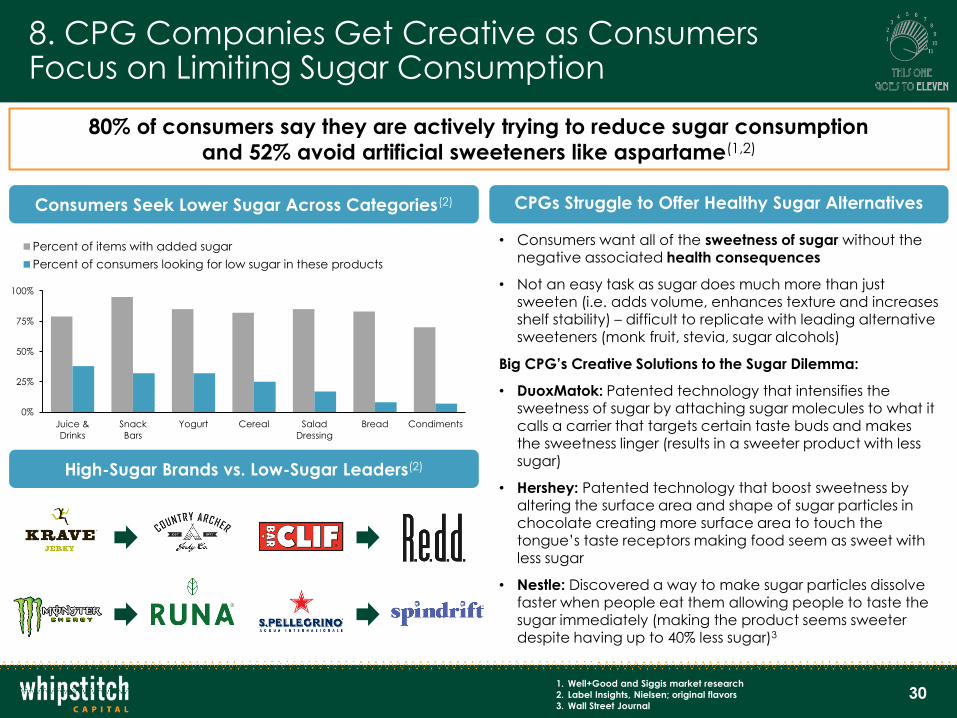
8. CPG Companies Get Creative as Consumers Focus on Limiting Sugar Consumption
80% of consumers say they are actively trying to reduce sugar consumption
and 52% avoid artificial sweeteners like aspartame(1,2)
0%
25%
50%
75%
100%
Juice &
Drinks
Snack
Bars
Yogurt Cereal Salad
Dressing
Bread Condiments
Percent of items with added sugar
Percent of consumers looking for low sugar in these products
Consumers Seek Lower Sugar Across Categories(2)
• Consumers want all of the sweetness of sugar without the negative associated health consequences
• Not an easy task as sugar does much more than just sweeten (i.e. adds volume, enhances texture and increases shelf stability) – difficult to replicate with leading alternative sweeteners (monk fruit, stevia, sugar alcohols)
Big CPG’s Creative Solutions to the Sugar Dilemma:
• DuoxMatok: Patented technology that intensifies the sweetness of sugar by attaching sugar molecules to what it calls a carrier that targets certain taste buds and makes the sweetness linger (results in a sweeter product with less
sugar)
• Hershey: Patented technology that boost sweetness by altering the surface area and shape of sugar particles in chocolate creating more surface area to touch the tongue’s taste receptors making food seem as sweet with less sugar
• Nestle: Discovered a way to make sugar particles dissolve faster when people eat them allowing people to taste the sugar immediately (making the product seems sweeter despite having up to 40% less sugar)3
1. Well+Good and Siggis market research
2. Label Insights, Nielsen; original flavors
3. Wall Street Journal
CPGs Struggle to Offer Healthy Sugar Alternatives
High-Sugar Brands vs. Low-Sugar Leaders(2)

31
9. New Functional Ingredients Beginning to Build Momentum with Beverage Brands
Brands Exploring Use of Adaptogens and MCT Oil to Meet Consumer Demand for Functional Benefits
• After several years of building momentum in the supplement community, use of ingredients such as adaptogens, MCT
oil and nootropics have begun to cross-over into more traditional beverage categories
• Given their highly functional benefits, these ingredients have steadily attracted attention from consumers seeking
products that can improve cognitive function, reduce stress and better energy levels
• Similar to probiotics, beverage brands have begun to formulate innovative drinks infused with these functional
ingredients to increase the marketability and ease of consumer access
• In the last year, these ingredients have recognized great growth – for example, dollar sales of products using
apoptogenic mushrooms such as Maitaki, Cordycep and Shiitake all increased by over 100% in the last year(1)
1. SPINS – YoY Dollar Growth %
2. AARP and ASA-MetLife Foundation
3. New Hope Network
Ingredients Offer Various
Functional Benefits
Answering Functional Benefits in
High Demand from Consumers
Beverage Brands Beginning to
Leverage New Ingredients
AdaptogensImproves cognitive functionRelieves stressMaintains energy
MCT OilPromotes weight lossImproves cognitive functionStrengthens heart health
NootropicsImproves memoryIncreases focus and attentionEnhances mood and reduces anxiety
Over 80% of consumersolder than 50 say “staying mentally sharp” is their number one priority(2)
77% of consumers indicate that relieving stress would increase their quality of life(3)
2% 3% 7%
18% 19%
98%103%
Antibiotic Free Natural' Conventional Organic Vegetarian Fed Organic grass-fed
Non-organicgrass-fed
32
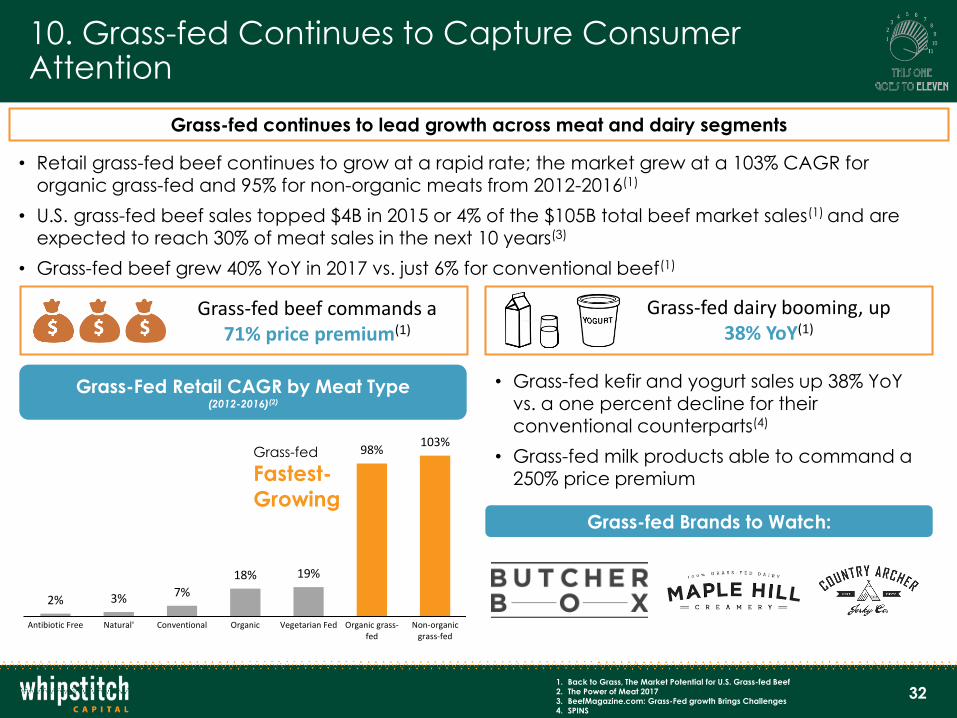
10. Grass-fed Continues to Capture Consumer Attention
• Retail grass-fed beef continues to grow at a rapid rate; the market grew at a 103% CAGR for organic grass-fed and 95% for non-organic meats from 2012-2016(1)
• U.S. grass-fed beef sales topped $4B in 2015 or 4% of the $105B total beef market sales(1) and are expected to reach 30% of meat sales in the next 10 years(3)
• Grass-fed beef grew 40% YoY in 2017 vs. just 6% for conventional beef(1)
Grass-Fed Retail CAGR by Meat Type (2012-2016)(2)
Grass-fed
Fastest-
Growing
1. Back to Grass, The Market Potential for U.S. Grass-fed Beef
2. The Power of Meat 2017
3. BeefMagazine.com: Grass-Fed growth Brings Challenges
4. SPINS
Grass-fed continues to lead growth across meat and dairy segments
Grass-fed beef commands a 71% price premium(1)
• Grass-fed kefir and yogurt sales up 38% YoY vs. a one percent decline for their
conventional counterparts(4)
• Grass-fed milk products able to command a 250% price premium
Grass-fed dairy booming, up 38% YoY(1)
Grass-fed Brands to Watch:

33
11. Consumers Continue to Demand Increased Transparency and Sustainability of Supply Chain
Innovative Brands Addressing Major Food Supply Chain Challenges Gaining Momentum
1. Nielsen
2. Center of Food Integrity
3. Food Business News
4. CB Insights
Consumers in Higher Demand for Cleaner,
Better-for-the-Planet Meat-Based Protein
Food Waste a Growing Issue Attracting Attention from
CPGs and New Brands
Animal-based protein remains consumers top source of protein
Yet, consumers remain in need of more transparent, trustworthy protein sources
Significant opportunity for brands offering transparent, cleaner meat
Size and breadth of food waste problem alarmingly high
New brands and large CPGs using innovative concepts to reduce food waste problem
78% of Americansconsume meat as primary source of protein1
61% of Americansregularly eat eggs for protein1
Less than 1 in 3 consumers are confident in the safety of the food they consume2
75% of consumers do not believe U.S. meat is raised
humanely2
Each year, U.S. consumers, businesses and farms spend nearly $220 billion on food
that goes uneaten3
Research suggests that not enough food will be available to feed global
population by 20504
Misfit Juicery uses aesthetically unappealing fruits and vegetables that are typically discarded in its juice products
Recently announced development of Yappah, a protein snack utilizing ingredients like spent grain and vegetable pulp
A food delivery service that sells “ugly” fruits and vegetables up to 30-to-50 percent off normal grocery store prices
34
Contents
▪ Whipstitch Capital Overview
▪ Healthy Living: Industry Overview and Deal Update /
Whipstitch Capital’s Top 11 Healthy Living Consumer Trends
▪ Food & Beverage M&A and Private Placement Deal Data
▪ SPINS Market Update: Produced for
Whipstitch’s Industry Analysis
35
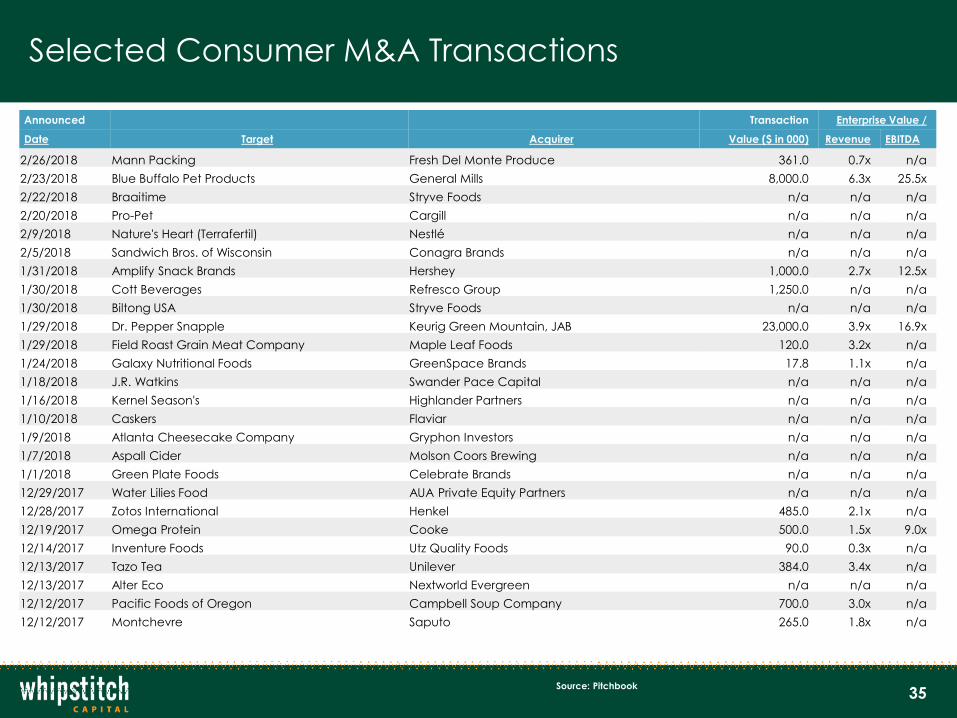
Selected Consumer M&A Transactions
Announced Transaction Enterprise Value /
Date Target Acquirer Value ($ in 000) Revenue EBITDA
2/26/2018 Mann Packing Fresh Del Monte Produce 361.0 0.7x n/a
2/23/2018 Blue Buffalo Pet Products General Mills 8,000.0 6.3x 25.5x
2/22/2018 Braaitime Stryve Foods n/a n/a n/a
2/20/2018 Pro-Pet Cargill n/a n/a n/a
2/9/2018 Nature's Heart (Terrafertil) Nestlé n/a n/a n/a
2/5/2018 Sandwich Bros. of Wisconsin Conagra Brands n/a n/a n/a
1/31/2018 Amplify Snack Brands Hershey 1,000.0 2.7x 12.5x
1/30/2018 Cott Beverages Refresco Group 1,250.0 n/a n/a
1/30/2018 Biltong USA Stryve Foods n/a n/a n/a
1/29/2018 Dr. Pepper Snapple Keurig Green Mountain, JAB 23,000.0 3.9x 16.9x
1/29/2018 Field Roast Grain Meat Company Maple Leaf Foods 120.0 3.2x n/a
1/24/2018 Galaxy Nutritional Foods GreenSpace Brands 17.8 1.1x n/a
1/18/2018 J.R. Watkins Swander Pace Capital n/a n/a n/a
1/16/2018 Kernel Season's Highlander Partners n/a n/a n/a
1/10/2018 Caskers Flaviar n/a n/a n/a
1/9/2018 Atlanta Cheesecake Company Gryphon Investors n/a n/a n/a
1/7/2018 Aspall Cider Molson Coors Brewing n/a n/a n/a
1/1/2018 Green Plate Foods Celebrate Brands n/a n/a n/a
12/29/2017 Water Lilies Food AUA Private Equity Partners n/a n/a n/a
12/28/2017 Zotos International Henkel 485.0 2.1x n/a
12/19/2017 Omega Protein Cooke 500.0 1.5x 9.0x
12/14/2017 Inventure Foods Utz Quality Foods 90.0 0.3x n/a
12/13/2017 Tazo Tea Unilever 384.0 3.4x n/a
12/13/2017 Alter Eco Nextworld Evergreen n/a n/a n/a
12/12/2017 Pacific Foods of Oregon Campbell Soup Company 700.0 3.0x n/a
12/12/2017 Montchevre Saputo 265.0 1.8x n/a
Source: Pitchbook
36
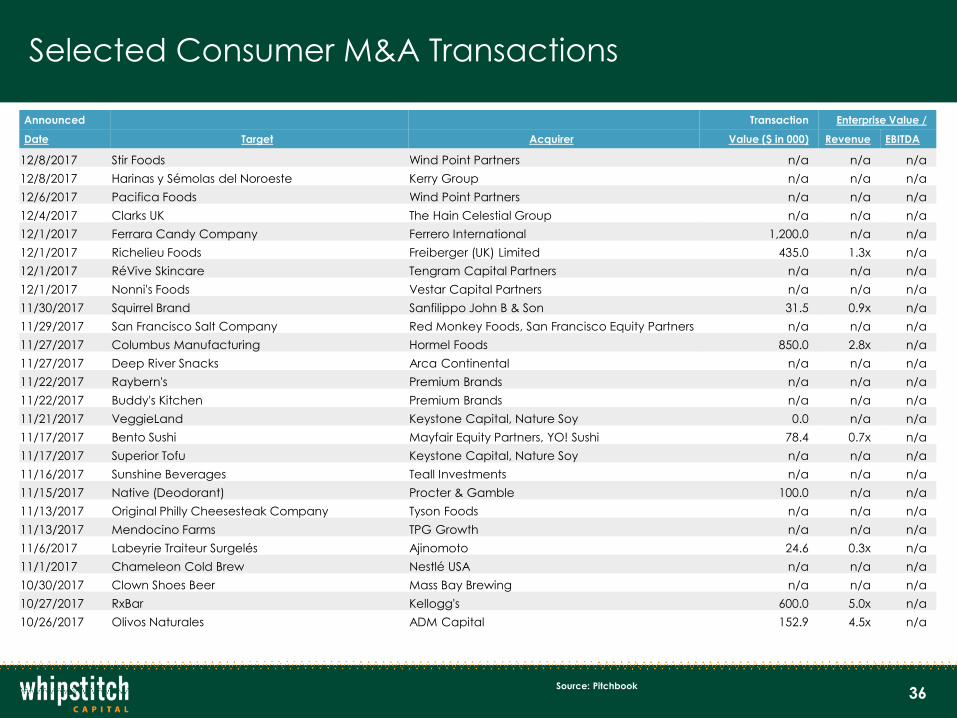
Selected Consumer M&A Transactions
Announced Transaction Enterprise Value /
Date Target Acquirer Value ($ in 000) Revenue EBITDA
12/8/2017 Stir Foods Wind Point Partners n/a n/a n/a
12/8/2017 Harinas y Sémolas del Noroeste Kerry Group n/a n/a n/a
12/6/2017 Pacifica Foods Wind Point Partners n/a n/a n/a
12/4/2017 Clarks UK The Hain Celestial Group n/a n/a n/a
12/1/2017 Ferrara Candy Company Ferrero International 1,200.0 n/a n/a
12/1/2017 Richelieu Foods Freiberger (UK) Limited 435.0 1.3x n/a
12/1/2017 RéVive Skincare Tengram Capital Partners n/a n/a n/a
12/1/2017 Nonni's Foods Vestar Capital Partners n/a n/a n/a
11/30/2017 Squirrel Brand Sanfilippo John B & Son 31.5 0.9x n/a
11/29/2017 San Francisco Salt Company Red Monkey Foods, San Francisco Equity Partners n/a n/a n/a
11/27/2017 Columbus Manufacturing Hormel Foods 850.0 2.8x n/a
11/27/2017 Deep River Snacks Arca Continental n/a n/a n/a
11/22/2017 Raybern's Premium Brands n/a n/a n/a
11/22/2017 Buddy's Kitchen Premium Brands n/a n/a n/a
11/21/2017 VeggieLand Keystone Capital, Nature Soy 0.0 n/a n/a
11/17/2017 Bento Sushi Mayfair Equity Partners, YO! Sushi 78.4 0.7x n/a
11/17/2017 Superior Tofu Keystone Capital, Nature Soy n/a n/a n/a
11/16/2017 Sunshine Beverages Teall Investments n/a n/a n/a
11/15/2017 Native (Deodorant) Procter & Gamble 100.0 n/a n/a
11/13/2017 Original Philly Cheesesteak Company Tyson Foods n/a n/a n/a
11/13/2017 Mendocino Farms TPG Growth n/a n/a n/a
11/6/2017 Labeyrie Traiteur Surgelés Ajinomoto 24.6 0.3x n/a
11/1/2017 Chameleon Cold Brew Nestlé USA n/a n/a n/a
10/30/2017 Clown Shoes Beer Mass Bay Brewing n/a n/a n/a
10/27/2017 RxBar Kellogg's 600.0 5.0x n/a
10/26/2017 Olivos Naturales ADM Capital 152.9 4.5x n/a
Source: Pitchbook
37
Selected Consumer M&A Transactions
Announced Transaction Enterprise Value /
Date Target Acquirer Value ($ in 000) Revenue EBITDA
10/23/2017 Angie's Artisan Treats Conagra Brands 250.0 n/a n/a
10/16/2017 East Balt Bakeries Grupo Bimbo 650.0 1.5x 9.3x
10/16/2017 NutriScience Innovations Akoya Capital Partners n/a n/a n/a
10/12/2017 Acetum Associated British Foods 372.7 3.3x n/a
10/11/2017 Ganeden Biotech Kerry Group n/a n/a n/a
10/2/2017 Back To Nature Foods B&G Foods 162.5 2.0x 9.6x
10/1/2017 Plated Albertsons 187.5 n/a n/a
9/30/2017 Hourglass Cosmetics Unilever 275.0 3.9x n/a
9/30/2017 Sweet Earth Natural Foods Nestlé USA n/a n/a n/a
9/22/2017 Unilever (South African Margarine Business) Pembani Remgro Infrastructure Fund 900.0 n/a n/a
9/18/2017 Schlotterbeck & Foss Frontenac n/a n/a n/a
9/14/2017 Blue Bottle Coffee Nestlé 700.0 n/a n/a
9/12/2017 Trilliant Food and Nutrition The Blackstone Group 541.0 2.4x n/a
9/12/2017 Ruby Fresh POM Wonderful n/a n/a n/a
9/11/2017 Moy Park Pilgrim's Pride 1,300.0 0.6x n/a
9/7/2017 The Body Shop International Natura Cosmetics 1,191.9 1.2x 46.3x
Source: Pitchbook
38
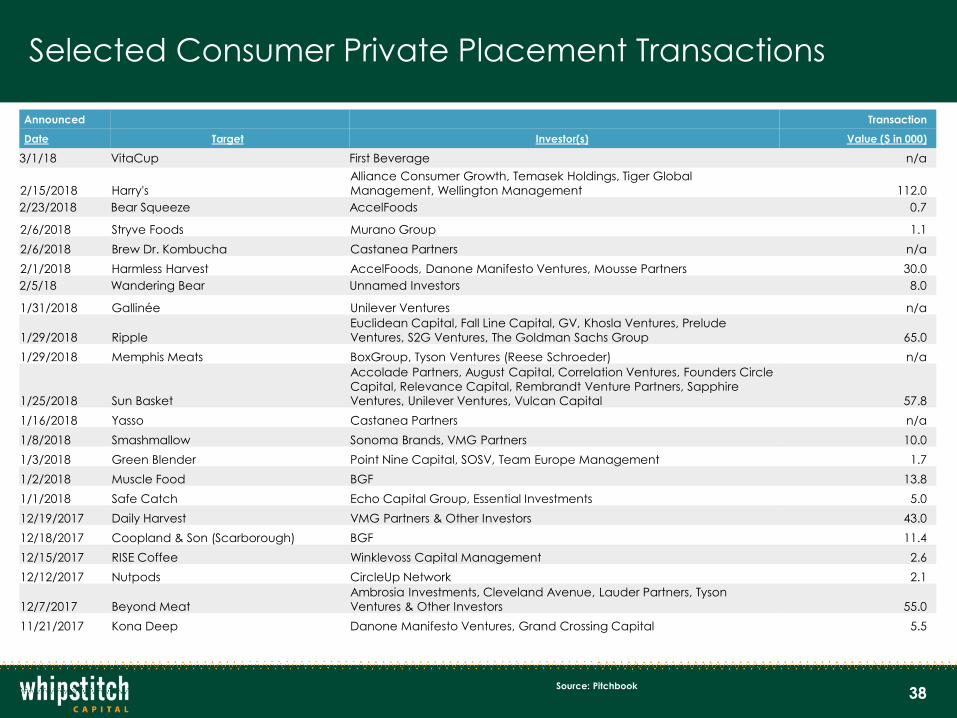
Selected Consumer Private Placement Transactions
Announced Transaction
Date Target Investor(s) Value ($ in 000)
3/1/18 VitaCup First Beverage n/a
2/15/2018 Harry's
Alliance Consumer Growth, Temasek Holdings, Tiger Global
Management, Wellington Management 112.0
2/23/2018 Bear Squeeze AccelFoods 0.7
2/6/2018 Stryve Foods Murano Group 1.1
2/6/2018 Brew Dr. Kombucha Castanea Partners n/a
2/1/2018 Harmless Harvest AccelFoods, Danone Manifesto Ventures, Mousse Partners 30.0
2/5/18 Wandering Bear Unnamed Investors 8.0
1/31/2018 Gallinée Unilever Ventures n/a
1/29/2018 Ripple
Euclidean Capital, Fall Line Capital, GV, Khosla Ventures, Prelude
Ventures, S2G Ventures, The Goldman Sachs Group 65.0
1/29/2018 Memphis Meats BoxGroup, Tyson Ventures (Reese Schroeder) n/a
1/25/2018 Sun Basket
Accolade Partners, August Capital, Correlation Ventures, Founders Circle
Capital, Relevance Capital, Rembrandt Venture Partners, Sapphire
Ventures, Unilever Ventures, Vulcan Capital 57.8
1/16/2018 Yasso Castanea Partners n/a
1/8/2018 Smashmallow Sonoma Brands, VMG Partners 10.0
1/3/2018 Green Blender Point Nine Capital, SOSV, Team Europe Management 1.7
1/2/2018 Muscle Food BGF 13.8
1/1/2018 Safe Catch Echo Capital Group, Essential Investments 5.0
12/19/2017 Daily Harvest VMG Partners & Other Investors 43.0
12/18/2017 Coopland & Son (Scarborough) BGF 11.4
12/15/2017 RISE Coffee Winklevoss Capital Management 2.6
12/12/2017 Nutpods CircleUp Network 2.1
12/7/2017 Beyond Meat
Ambrosia Investments, Cleveland Avenue, Lauder Partners, Tyson
Ventures & Other Investors 55.0
11/21/2017 Kona Deep Danone Manifesto Ventures, Grand Crossing Capital 5.5
Source: Pitchbook
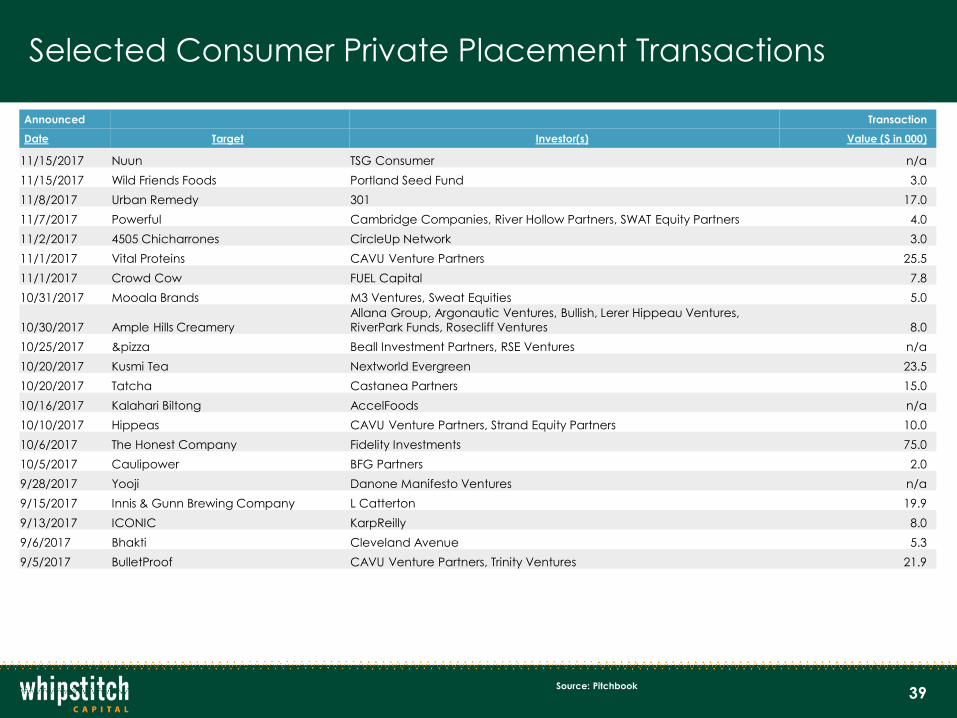
39
Selected Consumer Private Placement Transactions
Announced Transaction
Date Target Investor(s) Value ($ in 000)
11/15/2017 Nuun TSG Consumer n/a
11/15/2017 Wild Friends Foods Portland Seed Fund 3.0
11/8/2017 Urban Remedy 301 17.0
11/7/2017 Powerful Cambridge Companies, River Hollow Partners, SWAT Equity Partners 4.0
11/2/2017 4505 Chicharrones CircleUp Network 3.0
11/1/2017 Vital Proteins CAVU Venture Partners 25.5
11/1/2017 Crowd Cow FUEL Capital 7.8
10/31/2017 Mooala Brands M3 Ventures, Sweat Equities 5.0
10/30/2017 Ample Hills Creamery
Allana Group, Argonautic Ventures, Bullish, Lerer Hippeau Ventures,
RiverPark Funds, Rosecliff Ventures 8.0
10/25/2017 &pizza Beall Investment Partners, RSE Ventures n/a
10/20/2017 Kusmi Tea Nextworld Evergreen 23.5
10/20/2017 Tatcha Castanea Partners 15.0
10/16/2017 Kalahari Biltong AccelFoods n/a
10/10/2017 Hippeas CAVU Venture Partners, Strand Equity Partners 10.0
10/6/2017 The Honest Company Fidelity Investments 75.0
10/5/2017 Caulipower BFG Partners 2.0
9/28/2017 Yooji Danone Manifesto Ventures n/a
9/15/2017 Innis & Gunn Brewing Company L Catterton 19.9
9/13/2017 ICONIC KarpReilly 8.0
9/6/2017 Bhakti Cleveland Avenue 5.3
9/5/2017 BulletProof CAVU Venture Partners, Trinity Ventures 21.9
Source: Pitchbook

40
Contents
▪ Whipstitch Capital Overview
▪ Healthy Living: Industry Overview and Deal Update /
Whipstitch Capital’s Top 11 Healthy Living Consumer Trends
▪ Food & Beverage M&A and Private Placement Deal Data
▪ SPINS Market Update: Produced for
Whipstitch’s Industry Analysis
41
Key Trends InThe Natural Products Industry
March 2018
42
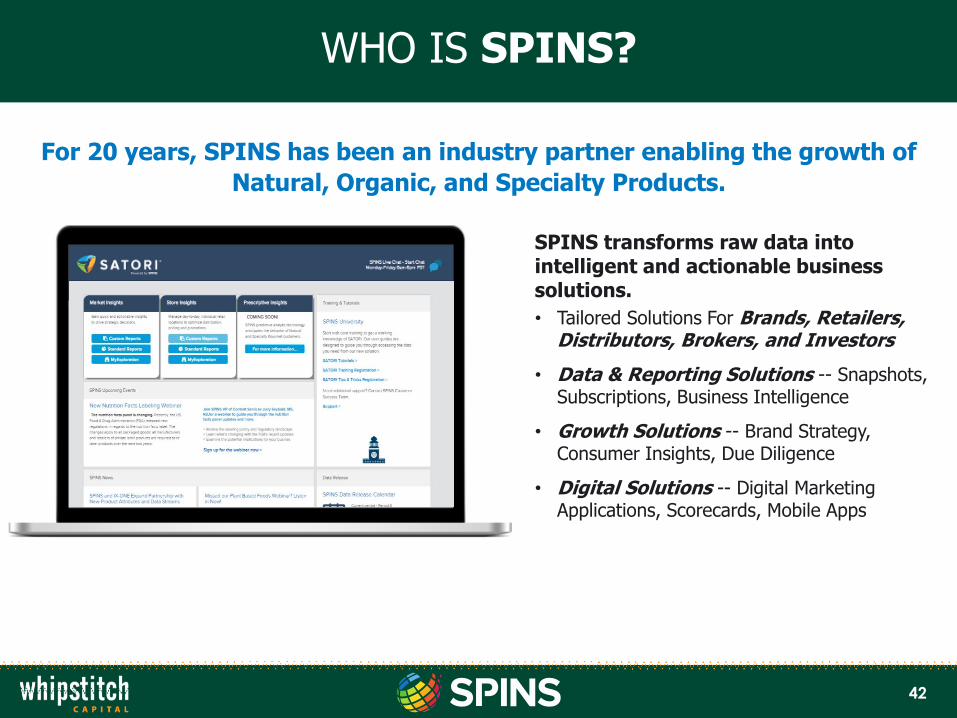
WHO IS SPINS?
For 20 years, SPINS has been an industry partner enabling the growth of
Natural, Organic, and Specialty Products.
SPINS transforms raw data into intelligent and actionable business solutions.
• Tailored Solutions For Brands, Retailers, Distributors, Brokers, and Investors
• Data & Reporting Solutions -- Snapshots,Subscriptions, Business Intelligence
• Growth Solutions -- Brand Strategy, Consumer Insights, Due Diligence
• Digital Solutions -- Digital Marketing Applications, Scorecards, Mobile Apps
43
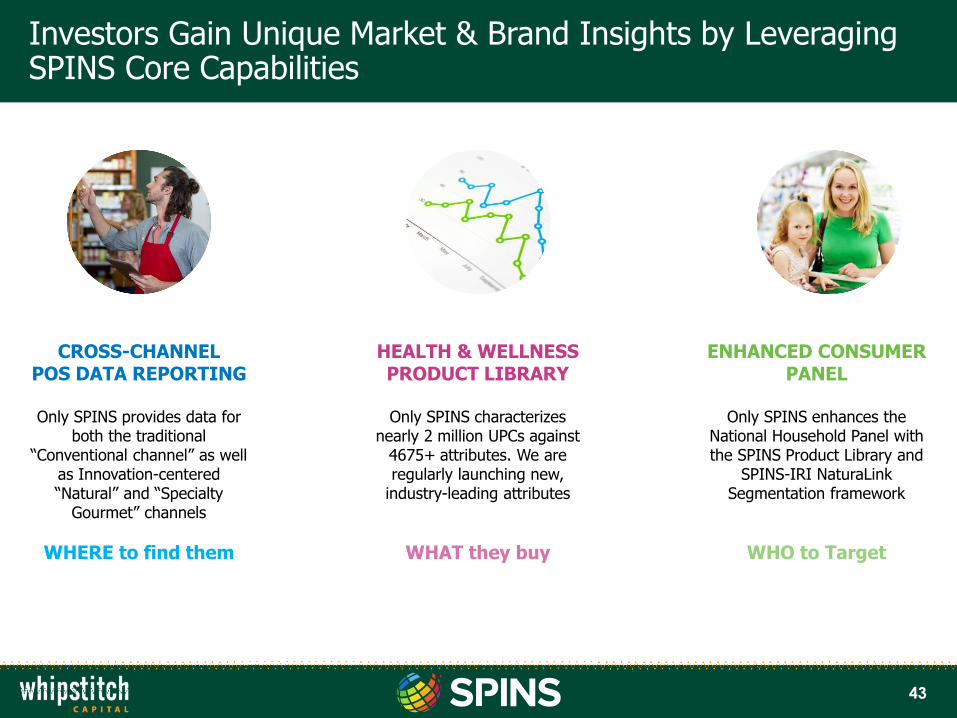
Investors Gain Unique Market & Brand Insights by Leveraging SPINS Core Capabilities
CROSS-CHANNEL POS DATA REPORTING
Only SPINS provides data for both the traditional
“Conventional channel” as well as Innovation-centered “Natural” and “Specialty
Gourmet” channels
WHERE to find them
HEALTH & WELLNESSPRODUCT LIBRARY
Only SPINS characterizes nearly 2 million UPCs against
4675+ attributes. We are regularly launching new,
industry-leading attributes
WHAT they buy
ENHANCED CONSUMER PANEL
Only SPINS enhances the National Household Panel with the SPINS Product Library and
SPINS-IRI NaturaLink Segmentation framework
WHO to Target
44
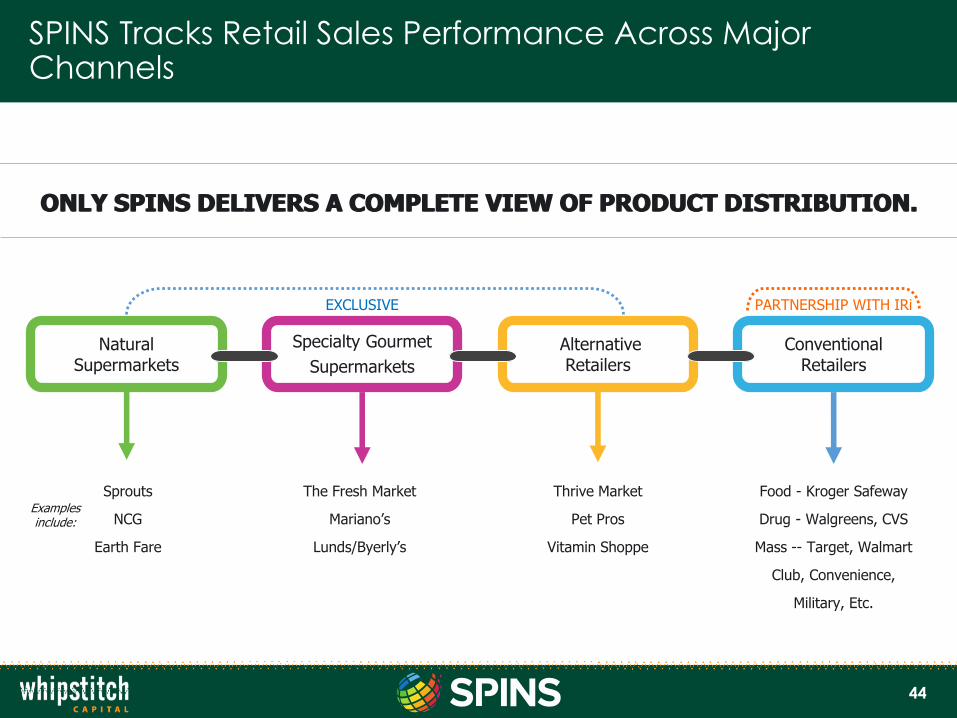
SPINS Tracks Retail Sales Performance Across Major Channels
ONLY SPINS DELIVERS A COMPLETE VIEW OF PRODUCT DISTRIBUTION.
PARTNERSHIP WITH IRiEXCLUSIVE
Food - Kroger Safeway
Drug - Walgreens, CVS
Mass -- Target, Walmart
Club, Convenience,
Military, Etc.
Conventional Retailers
Specialty Gourmet
Supermarkets
Alternative Retailers
Natural Supermarkets
Examples include:
ONLY SPINS DELIVERS A COMPLETE VIEW OF PRODUCT DISTRIBUTION.
The Fresh Market
Mariano’s
Lunds/Byerly’s
Thrive Market
Pet Pros
Vitamin Shoppe
Sprouts
NCG
Earth Fare
45
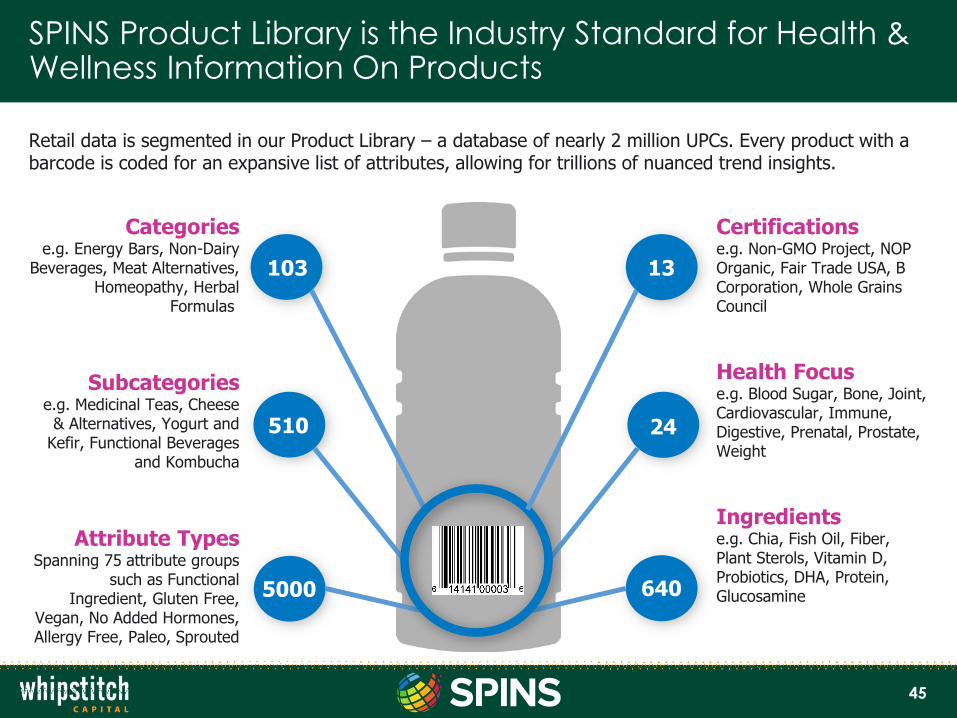
SPINS Product Library is the Industry Standard for Health & Wellness Information On Products
Categoriese.g. Energy Bars, Non-Dairy
Beverages, Meat Alternatives, Homeopathy, Herbal
Formulas
Subcategoriese.g. Medicinal Teas, Cheese
& Alternatives, Yogurt and Kefir, Functional Beverages
and Kombucha
Attribute TypesSpanning 75 attribute groups
such as Functional Ingredient, Gluten Free,
Vegan, No Added Hormones, Allergy Free, Paleo, Sprouted
Certificationse.g. Non-GMO Project, NOP Organic, Fair Trade USA, B Corporation, Whole Grains Council
Health Focuse.g. Blood Sugar, Bone, Joint, Cardiovascular, Immune, Digestive, Prenatal, Prostate, Weight
Ingredientse.g. Chia, Fish Oil, Fiber, Plant Sterols, Vitamin D, Probiotics, DHA, Protein, Glucosamine
Retail data is segmented in our Product Library – a database of nearly 2 million UPCs. Every product with a barcode is coded for an expansive list of attributes, allowing for trillions of nuanced trend insights.
5000
510
103 13
24
640

46
Through SPINS, Investors Can See That Natural Products Outpace the Growth of Mainstream Brands
• SPINS recognizes how brands are positioned to both consumers and retailers. • SPINS brand positioning is critical to understanding buying behavior and identifying growth opportunities
in the health & wellness sector.
Natural Positioned Products Specialty Positioned ProductsConventional Positioned
Products
$56BDollar Sales Dollar Growth
+7.7% $82BDollar Sales Dollar Growth
+3.7% $497BDollar Sales Dollar Growth
+0.2%
Total U.S. Retail Dollar Sales – Natural, Specialty Gourmet, Conventional MULO Channels, 52 Weeks Ending 12/31/17
47
Who Is The Natural Consumer?
48
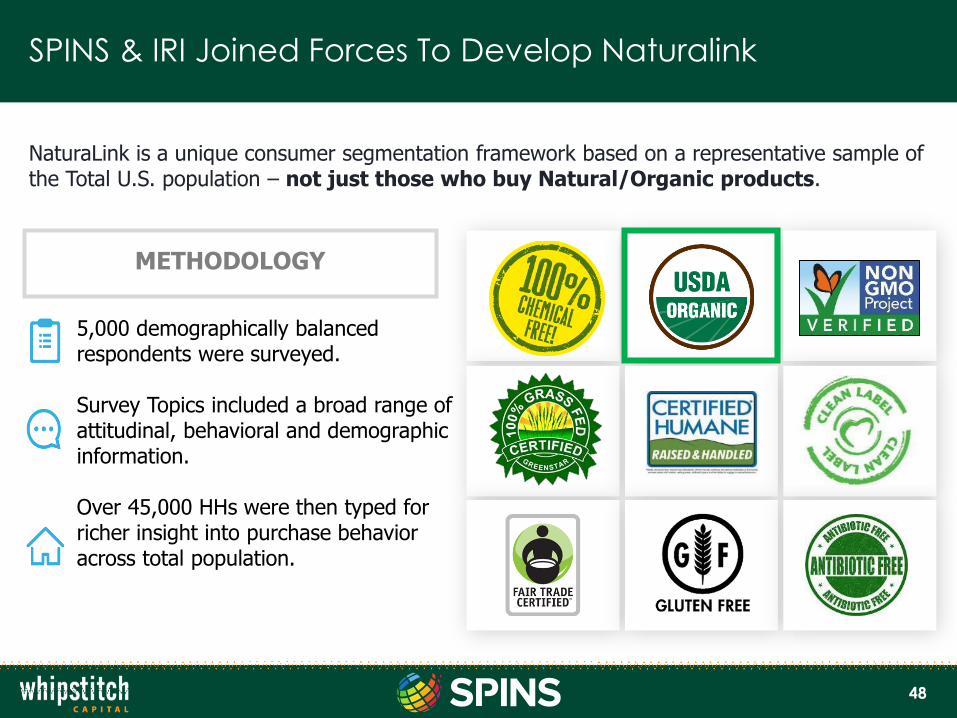
SPINS & IRI Joined Forces To Develop Naturalink
NaturaLink is a unique consumer segmentation framework based on a representative sample of the Total U.S. population – not just those who buy Natural/Organic products.
5,000 demographically balanced respondents were surveyed.
Survey Topics included a broad range of attitudinal, behavioral and demographic information.
Over 45,000 HHs were then typed for richer insight into purchase behavior across total population.
METHODOLOGY
49
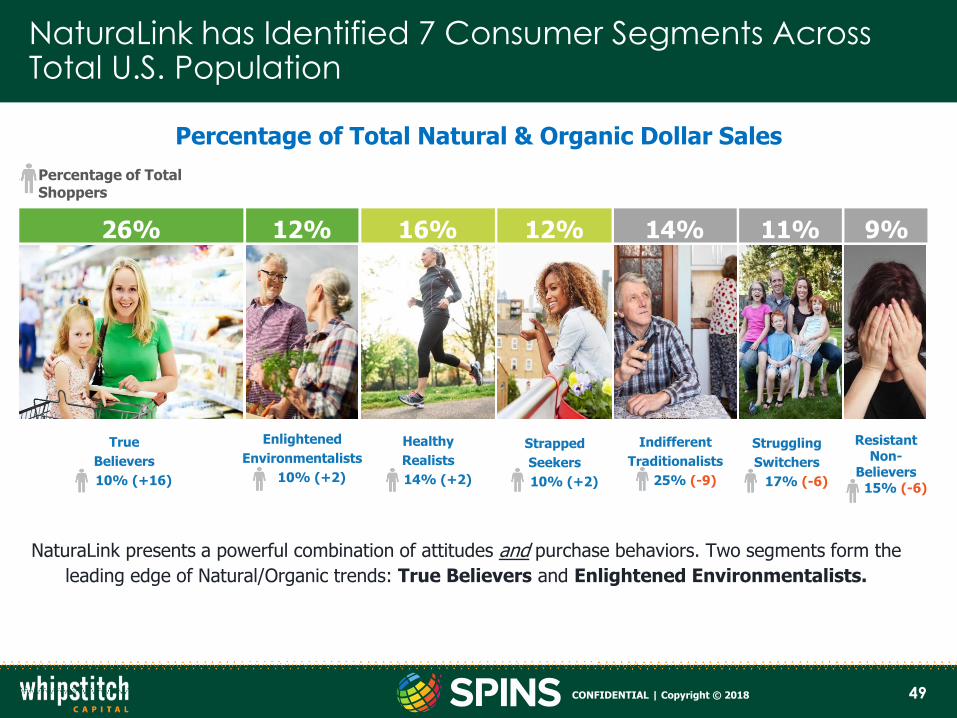
NaturaLink has Identified 7 Consumer Segments Across Total U.S. Population
26%
Percentage of Total Natural & Organic Dollar Sales
12% 16% 12% 14% 11% 9%
ResistantNon-
Believers15% (-6)
True
Believers
10% (+16)
Enlightened
Environmentalists
10% (+2)
Healthy
Realists
14% (+2)
Strapped
Seekers
10% (+2)
Indifferent
Traditionalists
25% (-9)
Struggling
Switchers
17% (-6)
NaturaLink presents a powerful combination of attitudes and purchase behaviors. Two segments form the
leading edge of Natural/Organic trends: True Believers and Enlightened Environmentalists.
Percentage of Total Shoppers
CONFIDENTIAL | Copyright © 2018
50
Two of these Segments are Especially Important for Natural & Organic Focused Brands and Retailers
True Believers
Enlightened Environmentalists
Healthy Realists
Strapped Seekers
Indifferent Traditionalists
Struggling Switchers
Resistant Non-Believers
SPINS NaturaLink Segment
Co
re
% Total Conventional
$ Sales
% TotalNPI
$ Sales
% Total Buyers
These 2 “Core Natural”
segments account for
~20% of buyers and ~40% of
Natural Product purchases
15%8%
16%
16%
10%
18%
26%
18%
26%
9%
8%
9%
13%
15%
14%
10%
16%
9%
9%
26%
9%
All Outlets, Total US, 52 Weeks Ending 12/25/16CONFIDENTIAL | Copyright © 2017
50
51
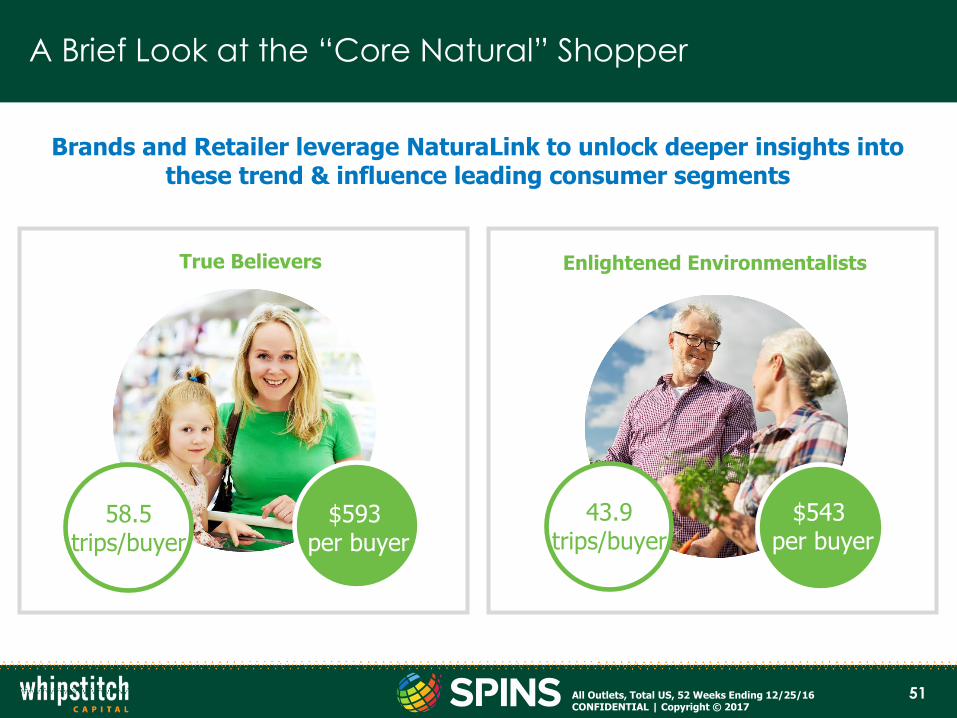
A Brief Look at the “Core Natural” Shopper
True Believers Enlightened Environmentalists
58.5trips/buyer
$593per buyer
43.9trips/buyer
$543per buyer
Brands and Retailer leverage NaturaLink to unlock deeper insights into these trend & influence leading consumer segments
All Outlets, Total US, 52 Weeks Ending 12/25/16CONFIDENTIAL | Copyright © 2017
52
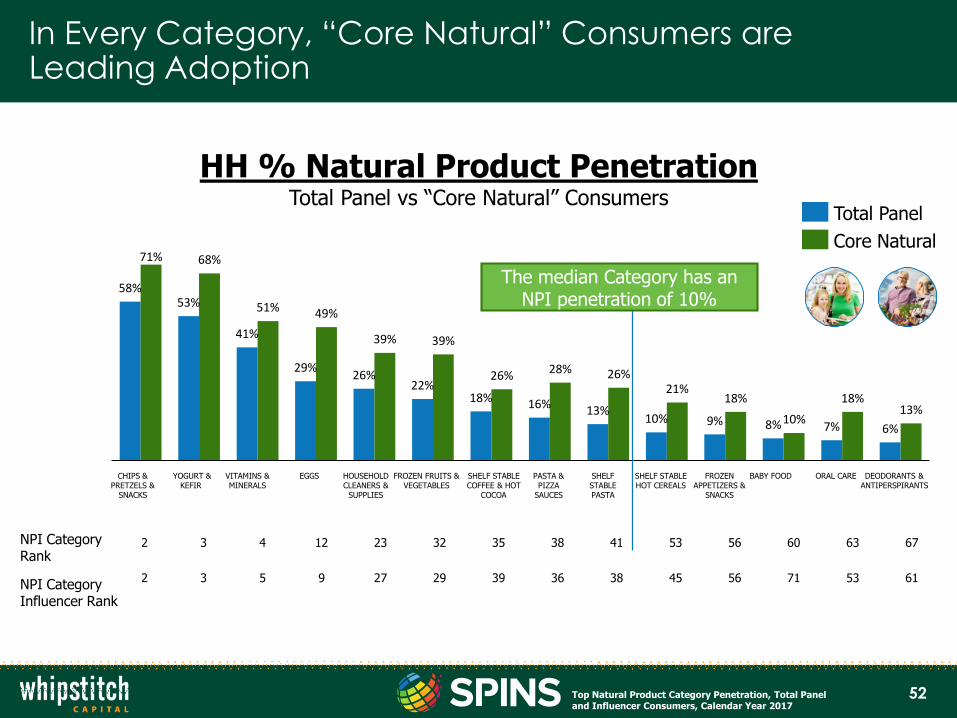
In Every Category, “Core Natural” Consumers are Leading Adoption
2 3 4 12 23 32 35 38 41 53 56 60 63 67
2 3 5 9 27 29 39 36 38 45 56 71 53 61
58%53%
41%
29%26%
22%18% 16% 13%
10% 9% 8% 7% 6%
71% 68%
51% 49%
39% 39%
26% 28% 26%21%
18%
10%
18%13%
NPI CategoryRank
NPI CategoryInfluencer Rank
HH % Natural Product PenetrationTotal Panel vs “Core Natural” Consumers
SHELF STABLE COFFEE & HOT
COCOA
FROZEN FRUITS & VEGETABLES
CHIPS & PRETZELS &
SNACKS
YOGURT & KEFIR
VITAMINS & MINERALS
EGGS HOUSEHOLD CLEANERS &
SUPPLIES
PASTA & PIZZA
SAUCES
SHELF STABLE PASTA
DEODORANTS & ANTIPERSPIRANTS
SHELF STABLE HOT CEREALS
FROZEN APPETIZERS &
SNACKS
BABY FOOD ORAL CARE
The median Category has an NPI penetration of 10%
Total Panel
Core Natural
Top Natural Product Category Penetration, Total Panel and Influencer Consumers, Calendar Year 2017

53
What Drives the Natural Consumer?
✓ Personal Health Factors• Clean labeled & minimally processed• Functional ingredients• Low sugar, sodium, etc.
✓ Environmental Factors• Non-GMO• Fair Trade • Demeter Certified Biodynamic
✓ Animal Welfare Factors• Animal Welfare • No Antibiotics Added• Grass Fed• No Added Hormones• Cage Free, Free Range, & Pasture Raised
54
Disruption of the Retail Landscape
55
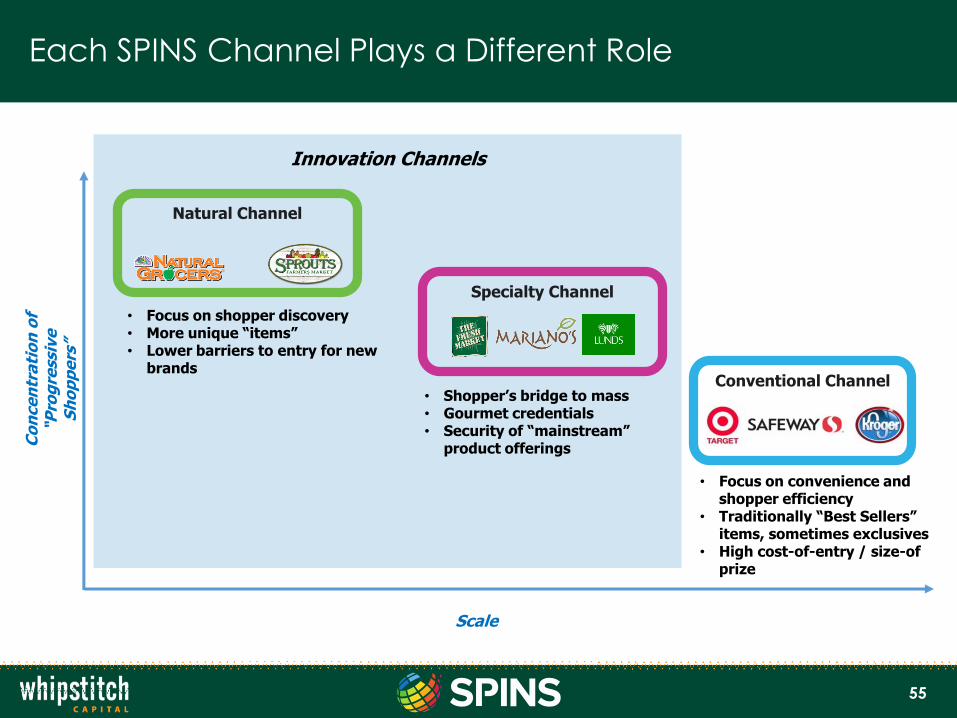
Each SPINS Channel Plays a Different Role
• Focus on convenience and shopper efficiency
• Traditionally “Best Sellers” items, sometimes exclusives
• High cost-of-entry / size-of prize
Co
nce
ntr
ati
on
of
“Pro
gre
ssiv
e
Sh
op
pe
rs”
Scale
• Focus on shopper discovery• More unique “items”• Lower barriers to entry for new
brands
• Shopper’s bridge to mass• Gourmet credentials• Security of “mainstream”
product offerings
Innovation Channels
Natural Channel
Specialty Channel
Conventional Channel
56
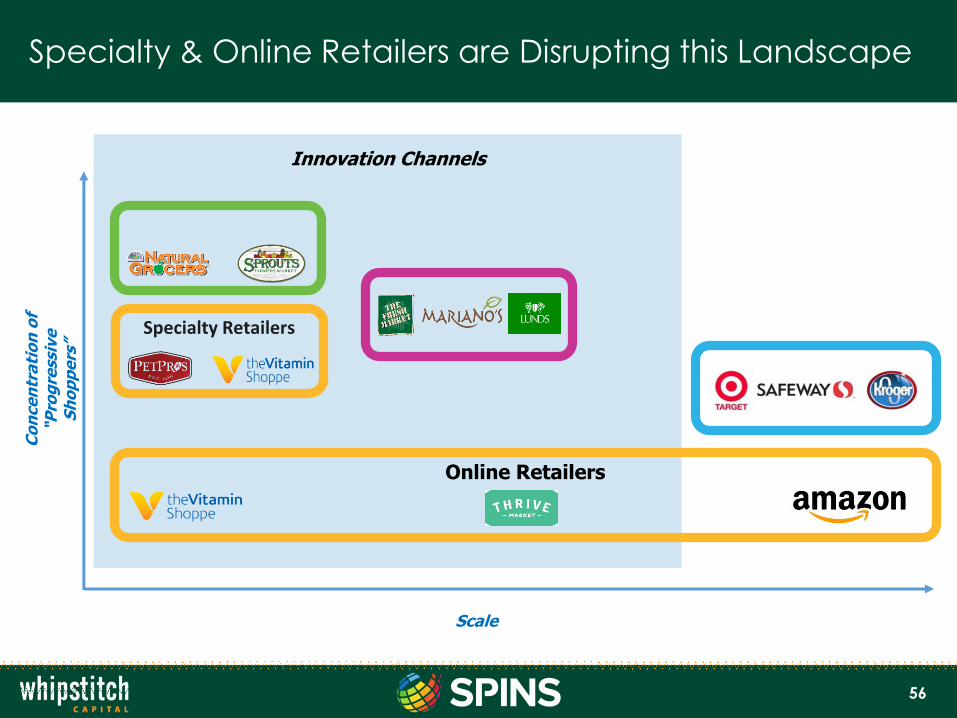
Specialty & Online Retailers are Disrupting this LandscapeC
on
ce
ntr
ati
on
of
“Pro
gre
ssiv
e
Sh
op
pe
rs”
Scale
Innovation Channels
Specialty Retailers
Online Retailers
57
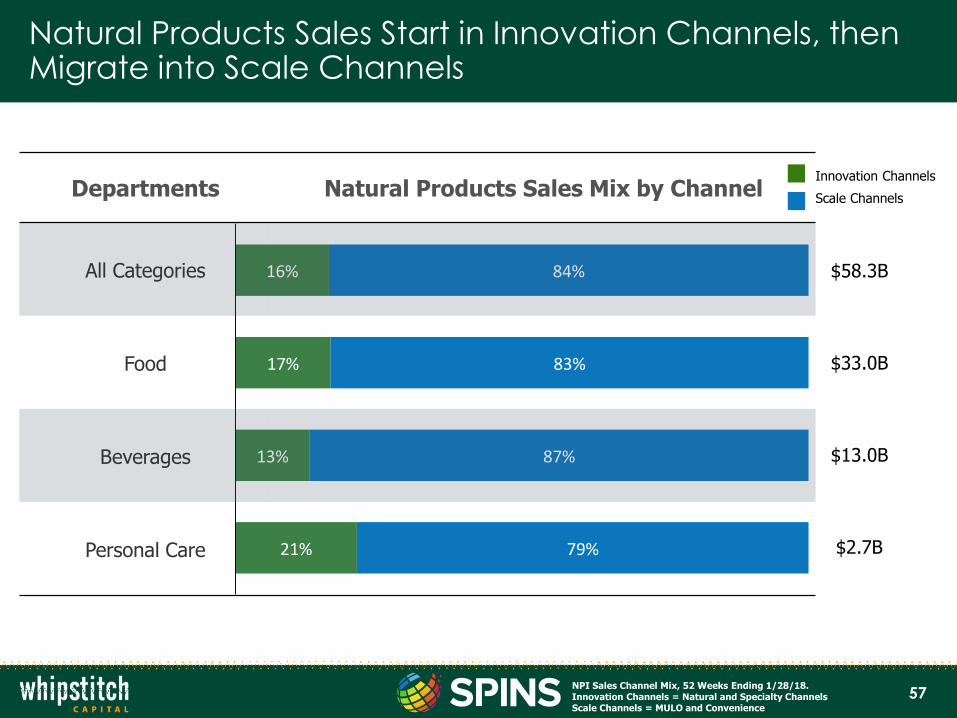
Natural Products Sales Start in Innovation Channels, then Migrate into Scale Channels
16%
17%
13%
21%
84%
83%
87%
79%
$58.3B
$13.0B
$33.0B
$2.7B
Departments Natural Products Sales Mix by Channel
All Categories
Food
Beverages
Personal Care
Innovation Channels
Scale Channels
NPI Sales Channel Mix, 52 Weeks Ending 1/28/18. Innovation Channels = Natural and Specialty ChannelsScale Channels = MULO and Convenience

58
Food Department Deep-dive Shows Which Categories are More/Less Developed in Scale Channels
8%
9%
9%
10%
11%
11%
12%
34%
34%
34%
39%
44%
46%
52%
92%
91%
91%
90%
89%
89%
88%
66%
66%
66%
61%
56%
54%
48%
Selected Food Categories Natural Products Sales Mix by Channel
SHELF STABLE BABY FOOD
SHELF STABLE WELLNESS BARS & GELS
SHELF STABLE DESSERTS & DESSERT TOPPINGS
FROZEN PLANT BASED MEAT ALTERNATIVES
REFRIGERATED EGGS
FROZEN DESSERTS
REFRIGERATED YOGURT & KEFIR
SHELF STABLE PASTA
SHELF STABLE CANDY
REFRIGERATED CONDIMENTS
SHELF STABLE MEAT POULTRY & SEAFOOD
REFRIGERATED ENTREES
SHELF STABLE PICKLES & OLIVES
REFRIGERATED PASTA & PIZZA SAUCES
Innovation Channels
Scale Channels
Sca
ling
cate
gories
Innova
ting
cate
gories
Food NPI Sales Channel Mix, 52 Weeks Ending 1/28/18. Innovation Channels = Natural and Specialty ChannelsScale Channels = MULO and Convenience
59
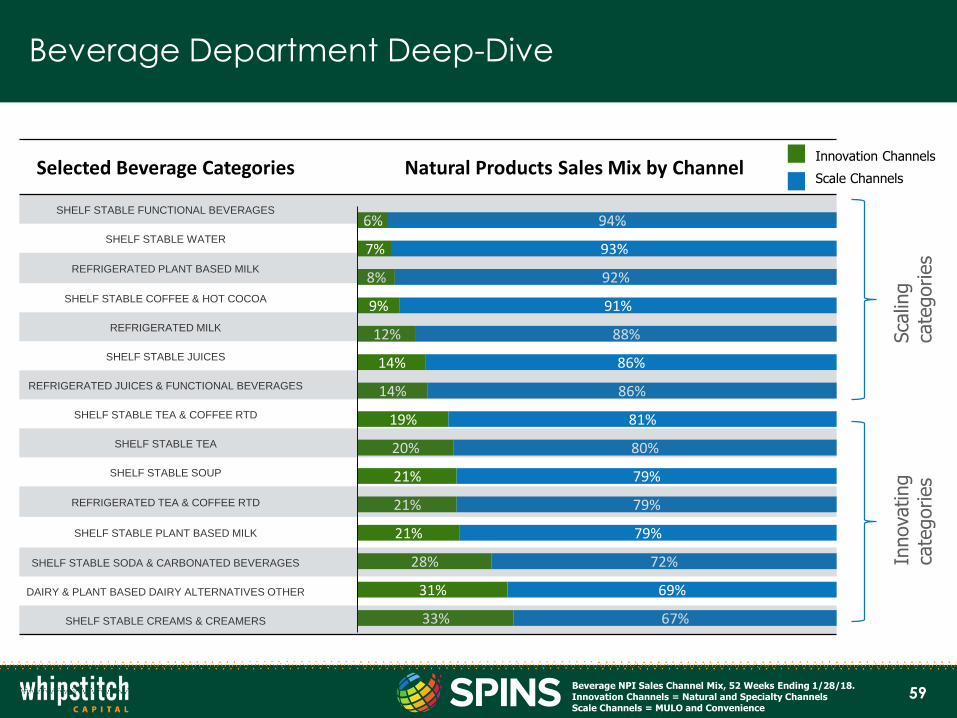
Beverage Department Deep-Dive
6%
7%
8%
9%
12%
14%
14%
19%
20%
21%
21%
21%
28%
31%
33%
94%
93%
92%
91%
88%
86%
86%
81%
80%
79%
79%
79%
72%
69%
67%
Selected Beverage Categories Natural Products Sales Mix by Channel
SHELF STABLE FUNCTIONAL BEVERAGES
SHELF STABLE WATER
REFRIGERATED PLANT BASED MILK
SHELF STABLE COFFEE & HOT COCOA
REFRIGERATED MILK
SHELF STABLE JUICES
REFRIGERATED JUICES & FUNCTIONAL BEVERAGES
SHELF STABLE TEA & COFFEE RTD
SHELF STABLE TEA
SHELF STABLE SOUP
REFRIGERATED TEA & COFFEE RTD
SHELF STABLE PLANT BASED MILK
SHELF STABLE SODA & CARBONATED BEVERAGES
DAIRY & PLANT BASED DAIRY ALTERNATIVES OTHER
SHELF STABLE CREAMS & CREAMERS
Innovation Channels
Scale Channels
Sca
ling
cate
gories
Innova
ting
cate
gories
Beverage NPI Sales Channel Mix, 52 Weeks Ending 1/28/18. Innovation Channels = Natural and Specialty ChannelsScale Channels = MULO and Convenience
60
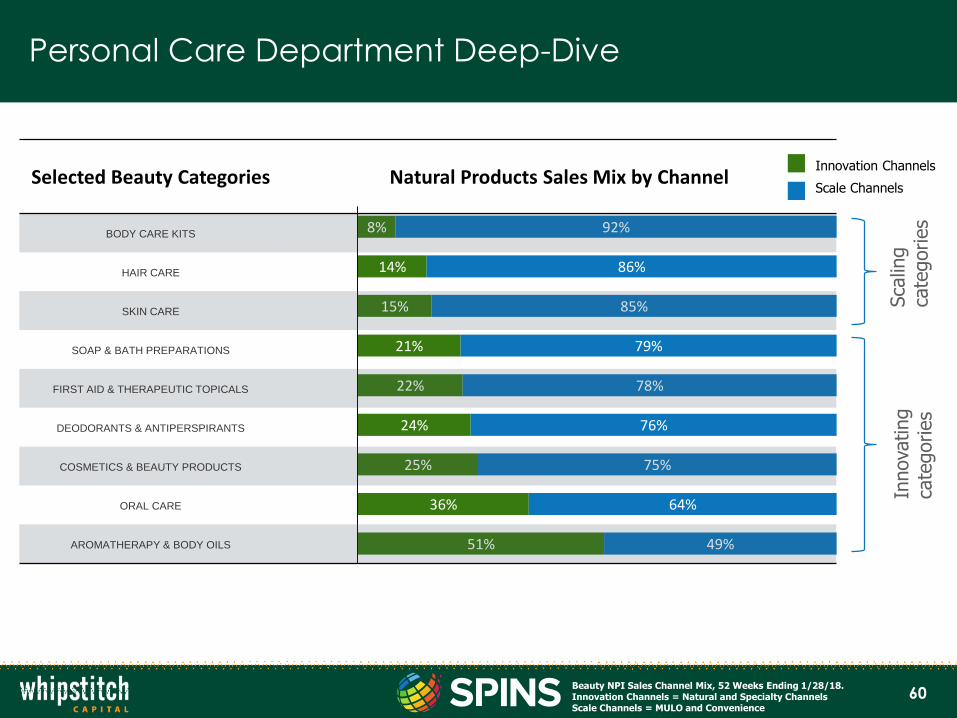
Personal Care Department Deep-Dive
8%
14%
15%
21%
22%
24%
25%
36%
51%
92%
86%
85%
79%
78%
76%
75%
64%
49%
Selected Beauty Categories Natural Products Sales Mix by Channel
BODY CARE KITS
HAIR CARE
SKIN CARE
SOAP & BATH PREPARATIONS
FIRST AID & THERAPEUTIC TOPICALS
DEODORANTS & ANTIPERSPIRANTS
COSMETICS & BEAUTY PRODUCTS
ORAL CARE
AROMATHERAPY & BODY OILS
Innovation Channels
Scale Channels
Sca
ling
cate
gories
Innova
ting
cate
gories
Beauty NPI Sales Channel Mix, 52 Weeks Ending 1/28/18. Innovation Channels = Natural and Specialty ChannelsScale Channels = MULO and Convenience
61
Brand Innovation & Segmentation
62
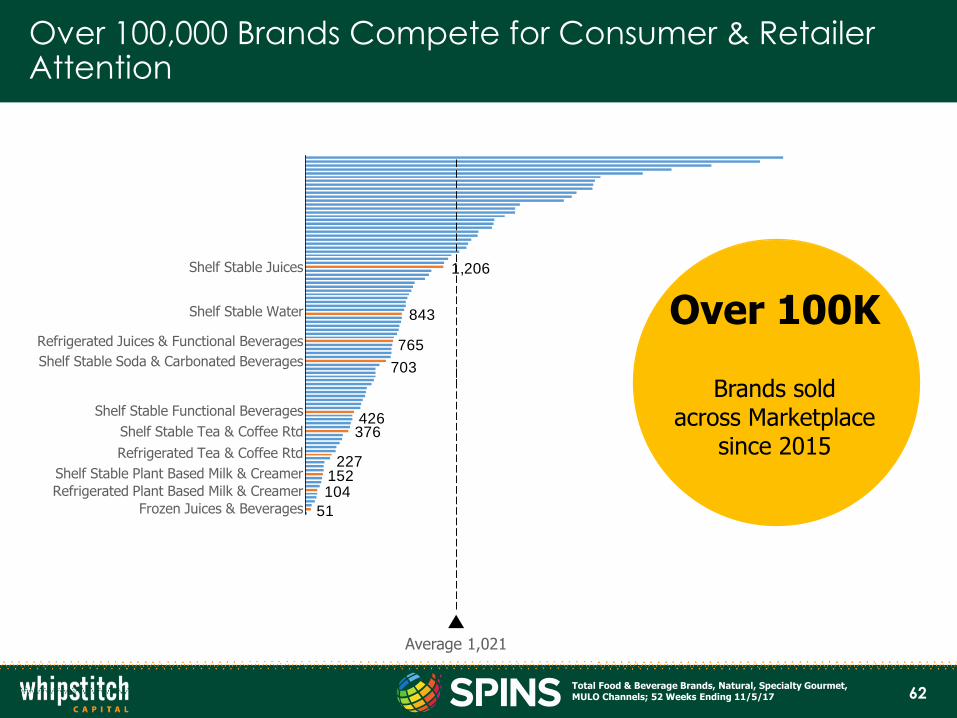
Over 100,000 Brands Compete for Consumer & Retailer Attention
51
104152
227
376426
703
765
843
1,206
Shelf Stable Water
Shelf Stable Juices
Refrigerated Juices & Functional Beverages
Shelf Stable Soda & Carbonated Beverages
Shelf Stable Functional Beverages
Shelf Stable Tea & Coffee Rtd
Shelf Stable Plant Based Milk & Creamer
Refrigerated Tea & Coffee Rtd
Refrigerated Plant Based Milk & Creamer
Frozen Juices & Beverages
Average 1,021
Over 100K
Brands sold across Marketplace
since 2015
Total Food & Beverage Brands, Natural, Specialty Gourmet, MULO Channels; 52 Weeks Ending 11/5/17
63
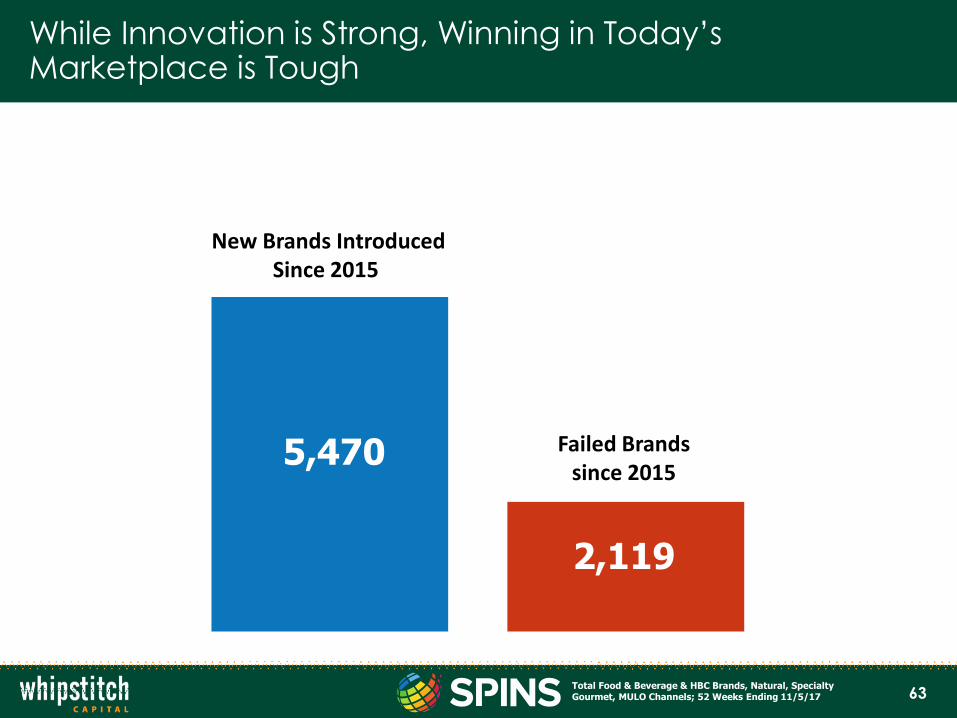
While Innovation is Strong, Winning in Today’s Marketplace is Tough
5,470Failed Brands
since 2015
New Brands Introduced Since 2015
5,470
2,119
Total Food & Beverage & HBC Brands, Natural, Specialty Gourmet, MULO Channels; 52 Weeks Ending 11/5/17
64
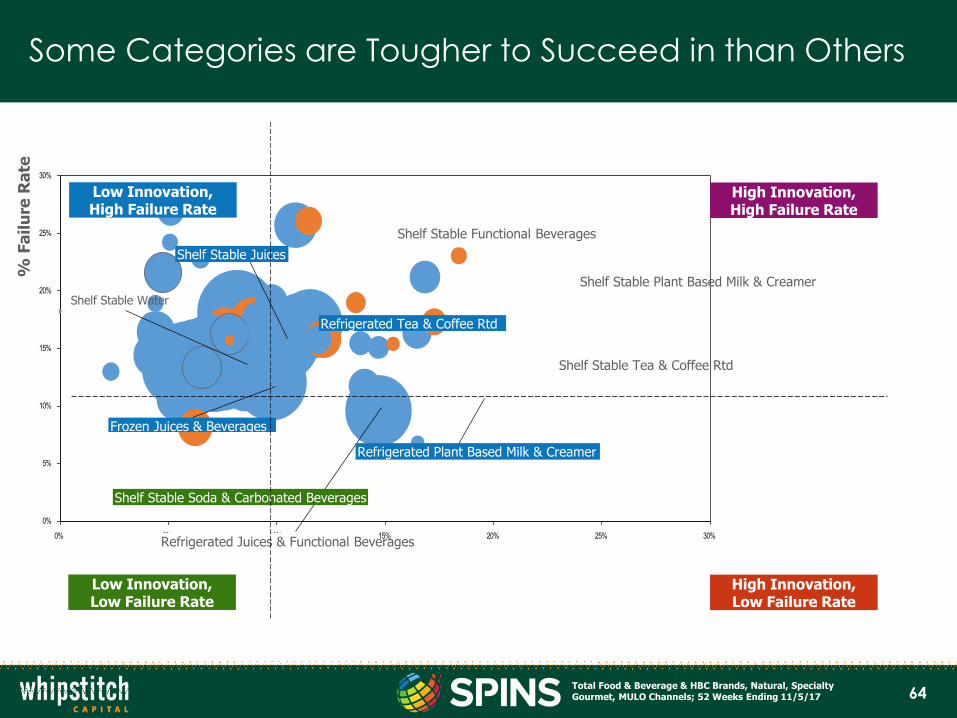
Some Categories are Tougher to Succeed in than Others
0%
5%
10%
15%
20%
25%
30%
0% 5% 10% 15% 20% 25% 30%
% F
ail
ure
Ra
te
Shelf Stable Soda & Carbonated Beverages
Frozen Juices & Beverages
Refrigerated Plant Based Milk & Creamer
Refrigerated Tea & Coffee Rtd
Shelf Stable Functional Beverages
Refrigerated Juices & Functional Beverages
Shelf Stable Water
Shelf Stable Plant Based Milk & Creamer
Shelf Stable Juices
Shelf Stable Tea & Coffee Rtd
Low Innovation,High Failure Rate
High Innovation,High Failure Rate
Low Innovation,Low Failure Rate
High Innovation,Low Failure Rate
Total Food & Beverage & HBC Brands, Natural, Specialty Gourmet, MULO Channels; 52 Weeks Ending 11/5/17
65
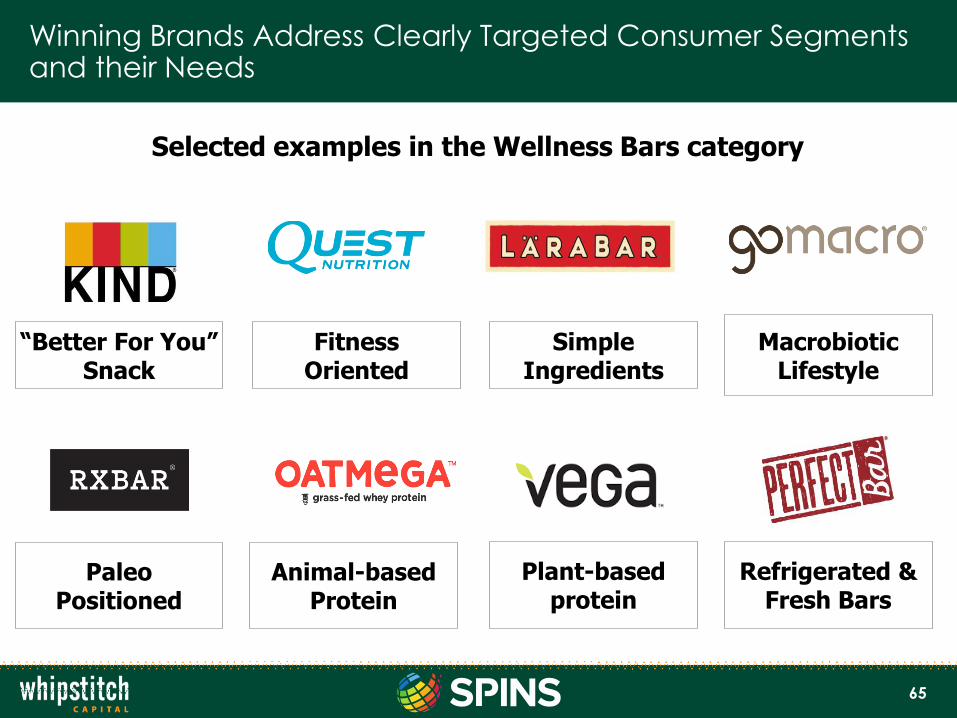
Winning Brands Address Clearly Targeted Consumer Segments and their Needs
Selected examples in the Wellness Bars category
Fitness Oriented
Simple Ingredients
“Better For You” Snack
Refrigerated & Fresh Bars
Paleo Positioned
Animal-based Protein
Macrobiotic Lifestyle
Plant-based protein
66
Financial Partners Group
Find, Analyze, and Invest in Winning Brands
67
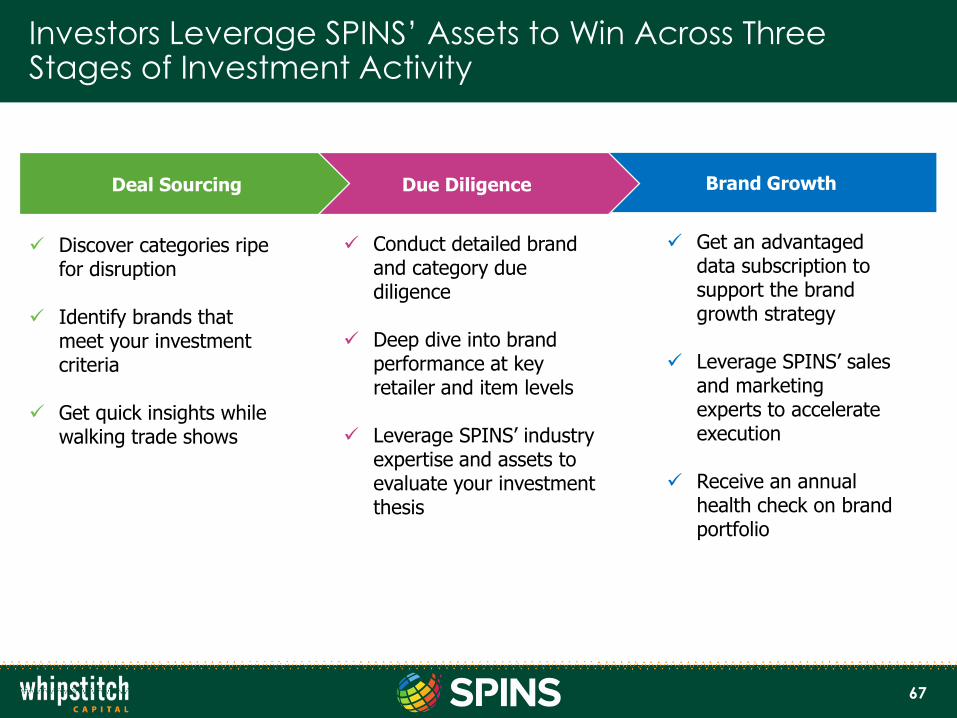
Investors Leverage SPINS’ Assets to Win Across Three Stages of Investment Activity
Brand GrowthDue DiligenceDeal Sourcing
✓ Discover categories ripe for disruption
✓ Identify brands that meet your investment criteria
✓ Get quick insights while walking trade shows
✓ Get an advantaged data subscription to support the brand growth strategy
✓ Leverage SPINS’ sales and marketing experts to accelerate execution
✓ Receive an annual health check on brand portfolio
✓ Conduct detailed brand and category due diligence
✓ Deep dive into brand performance at key retailer and item levels
✓ Leverage SPINS’ industry expertise and assets to evaluate your investment thesis
68
• Comprehensive database all
categories, channels, brands
• Analyze & identify disruptive
categories and trends
• Apply your investment
criteria against SPINS’ entire
database to find brands that
fit
• View an brand snapshot
with attribute profile and
cross-channel sales
performance
• Dive deeper into brand sales
performance, including all
metrics & regional data
• Set-up multiple watch lists of
high-potential brands to
monitor
Discover and track investment opportunities using SPINS’ proprietary insights and data.
INVESTMENTINSIGHTS SUITE

69
• Lookup brands based on
Exhibitor name or Booth
number
• View three brand
dashboards
- Channel mix
- Category mix
- 3yr sales trend
• Favorite brands of high
interest for further analysis
• Take notes on what you
learn in meetings
• NEW:
- Convenience channel
- Take a photo feature
- Company search
Research brands live on the trade show floor to understand their channel mix, category mix, three-year sales trend, and performance by channel.
BRAND INSIGHTS
MOBILE APP
70
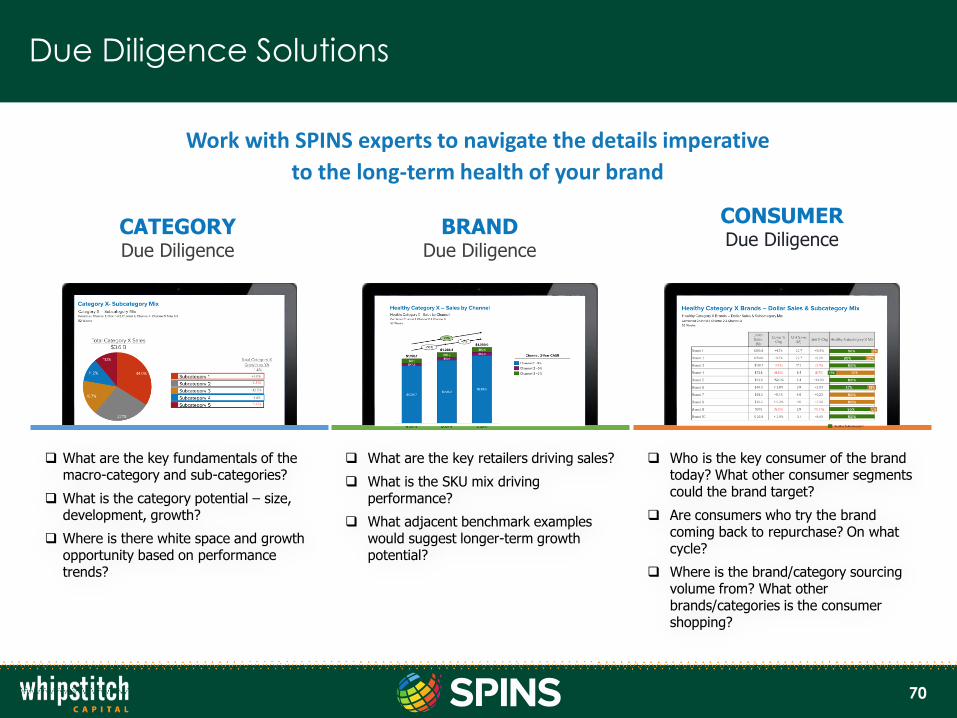
Due Diligence Solutions
Work with SPINS experts to navigate the details imperative
to the long-term health of your brand
CATEGORYDue Diligence
BRANDDue Diligence
CONSUMERDue Diligence
What are the key retailers driving sales?
What is the SKU mix driving performance?
What adjacent benchmark examples would suggest longer-term growth potential?
What are the key fundamentals of the macro-category and sub-categories?
What is the category potential – size, development, growth?
Where is there white space and growth opportunity based on performance trends?
Who is the key consumer of the brand today? What other consumer segments could the brand target?
Are consumers who try the brand coming back to repurchase? On what cycle?
Where is the brand/category sourcing volume from? What other brands/categories is the consumer shopping?

71
Whipstitch Contact Information
72
Greg Ucich, Senior Associate
Tim Sousa, Senior Associate
Natalie Cira, Associate
Dominic Mangano, Associate
Kaye Pezzini, Director of Marketing & Brand
Development
Steve Gentili, Analyst
Mike Burgmaier, Co-Founder & Managing
Director
Nicolas McCoy, Co-Founder & Managing
Director