health status of factory workers
TRANSCRIPT
7/27/2019 Health Status of Factory Workers
http://slidepdf.com/reader/full/health-status-of-factory-workers 1/29
By-
Aaron Desai (22)
Varun Desai (23) Nidhi Dhamecha (24)
Namrata Dosapaty (26)
Roma Gandhi (28)
7/27/2019 Health Status of Factory Workers
http://slidepdf.com/reader/full/health-status-of-factory-workers 2/29
The risk factors in textile industries.
Physical, biological, chemical, ergonomic,
Work place environment.
The dependence on technologies in industry has resulted in high
accident rates, occupational diseases, and unhealthy working
environments.
Most workers are illiterate and are unaware about the health hazards and
the preventive techniques.

7/27/2019 Health Status of Factory Workers
http://slidepdf.com/reader/full/health-status-of-factory-workers 3/29
What is the status of health of 100 factory workers employed at 2different factories and their level of knowledge about the prevention of health hazards and use of protective devices?
To study the profile of health of factory workers.
To assess the level of knowledge and practice about the use of protectivedevices and measures to prevent occupational hazards.
To investigate the factors effecting occupational health and safety intextile industry
To study the correlation among different factors.
To make appropriate recommendations to the factory owners and the
workers.

7/27/2019 Health Status of Factory Workers
http://slidepdf.com/reader/full/health-status-of-factory-workers 4/29
Study design : cross sectional
Subjects : 100 factory workers
Inclusion criteria : workers associated with
production
Exclusion criteria : office staff
Sampling technique : random sampling
Consent : informed verbal consent

7/27/2019 Health Status of Factory Workers
http://slidepdf.com/reader/full/health-status-of-factory-workers 5/29
After the completion of P.S.B.H workshop the project was
selected considering its importance.
Its format was discussed by our group and a relevant
questionnaire was prepared and reviewed by our Facilitator.Then permission was obtained from the factory owners and the
questionnaires were filled from workers.
Then analysis of the data was done by using SPSS software and
the results were obtained and reviewed by our facilitator.
The appropriate recommendations have been made.

7/27/2019 Health Status of Factory Workers
http://slidepdf.com/reader/full/health-status-of-factory-workers 6/29

7/27/2019 Health Status of Factory Workers
http://slidepdf.com/reader/full/health-status-of-factory-workers 7/29
74% of workers live in the urban areas.
Only 6% workers are illiterate, 28% have received primary education, 43% received secondary education, 17% receivedhigher secondary education, 6% are graduate.
85% of workers are working 12 hours a day.
On average workers have an experience of about 10 years
Only 24% of workers have taken special training for their work in institutions like ATIRA. Rest of workers have learned their
work from senior workers.
All workers are ESIS beneficiary.
Only 3% workers have any history of injury.
7/27/2019 Health Status of Factory Workers
http://slidepdf.com/reader/full/health-status-of-factory-workers 8/29
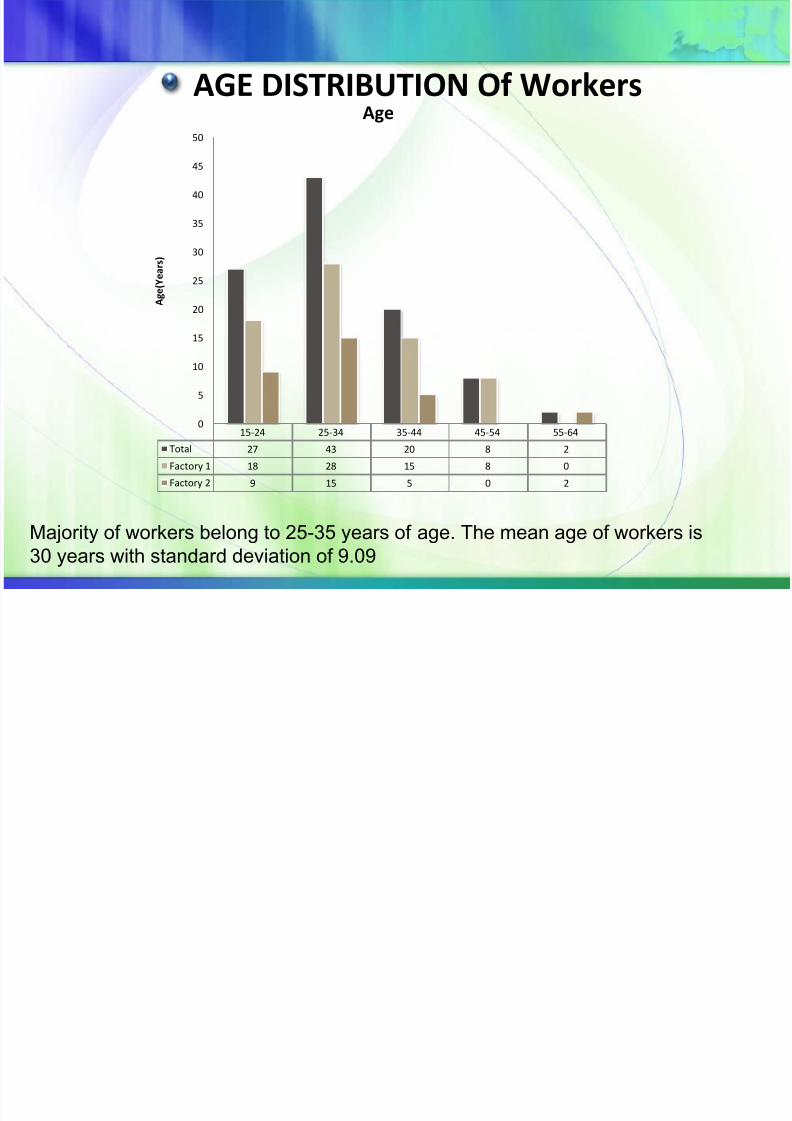
AGE DISTRIBUTION Of Workers
15-24 25-34 35-44 45-54 55-64
Total 27 43 20 8 2
Factory 1 18 28 15 8 0
Factory 2 9 15 5 0 2
0
5
10
15
20
25
30
35
40
45
50
A g e ( Y e
a r s )
Age
Majority of workers belong to 25-35 years of age. The mean age of workers is
30 years with standard deviation of 9.09
7/27/2019 Health Status of Factory Workers
http://slidepdf.com/reader/full/health-status-of-factory-workers 9/29
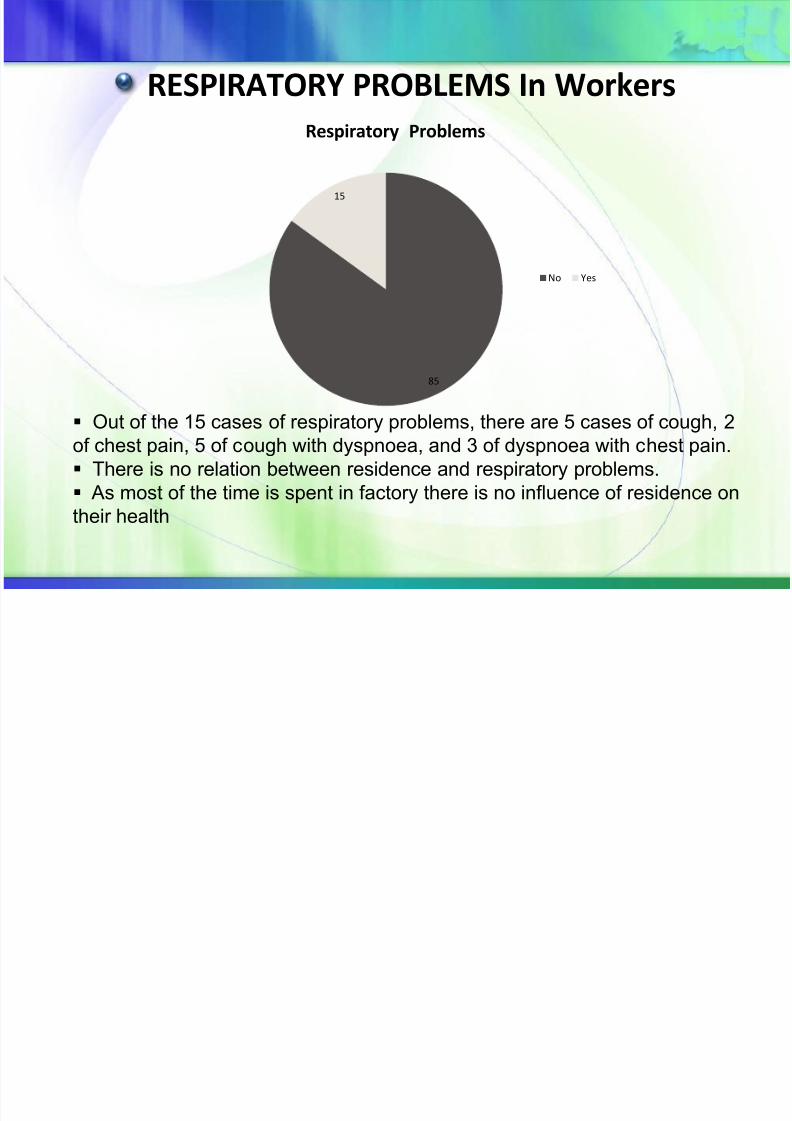
RESPIRATORY PROBLEMS In Workers
85
15
Respiratory Problems
No Yes
Out of the 15 cases of respiratory problems, there are 5 cases of cough, 2of chest pain, 5 of cough with dyspnoea, and 3 of dyspnoea with chest pain.
There is no relation between residence and respiratory problems.
As most of the time is spent in factory there is no influence of residence on
their health
7/27/2019 Health Status of Factory Workers
http://slidepdf.com/reader/full/health-status-of-factory-workers 10/29
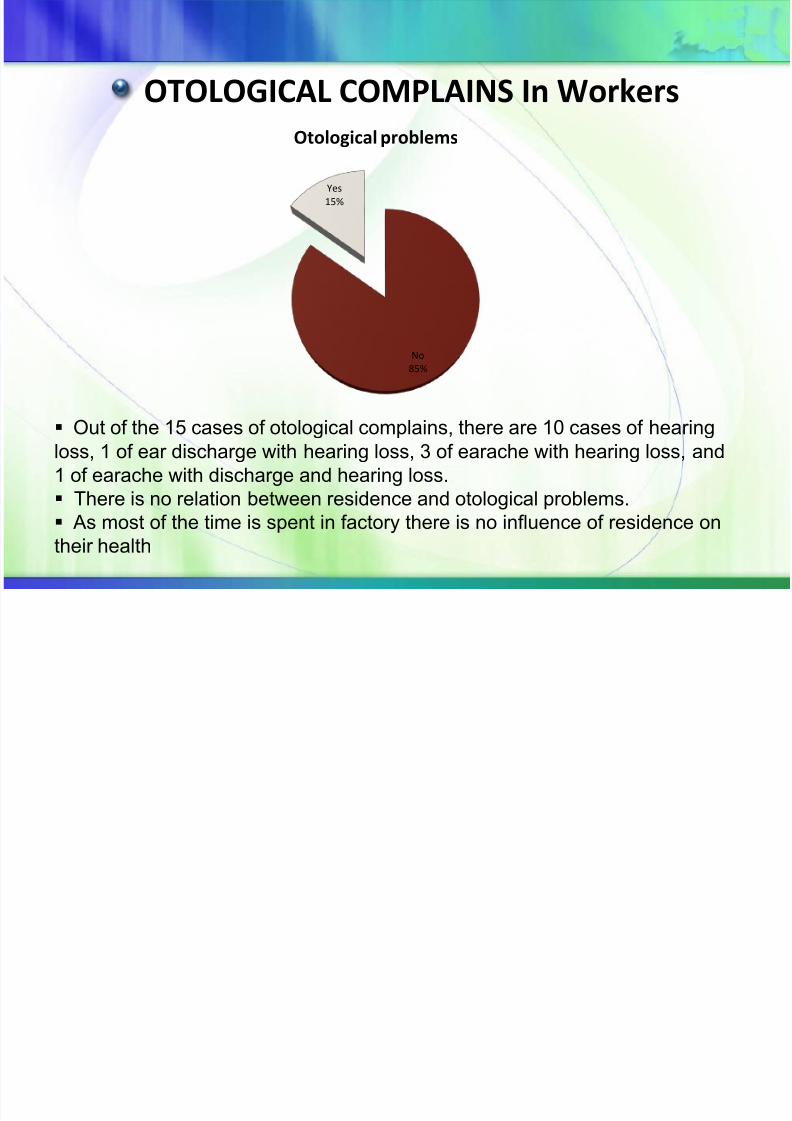
OTOLOGICAL COMPLAINS In Workers
No
85%
Yes
15%
Otological problems
Out of the 15 cases of otological complains, there are 10 cases of hearing
loss, 1 of ear discharge with hearing loss, 3 of earache with hearing loss, and
1 of earache with discharge and hearing loss.
There is no relation between residence and otological problems.
As most of the time is spent in factory there is no influence of residence on
their health
7/27/2019 Health Status of Factory Workers
http://slidepdf.com/reader/full/health-status-of-factory-workers 11/29
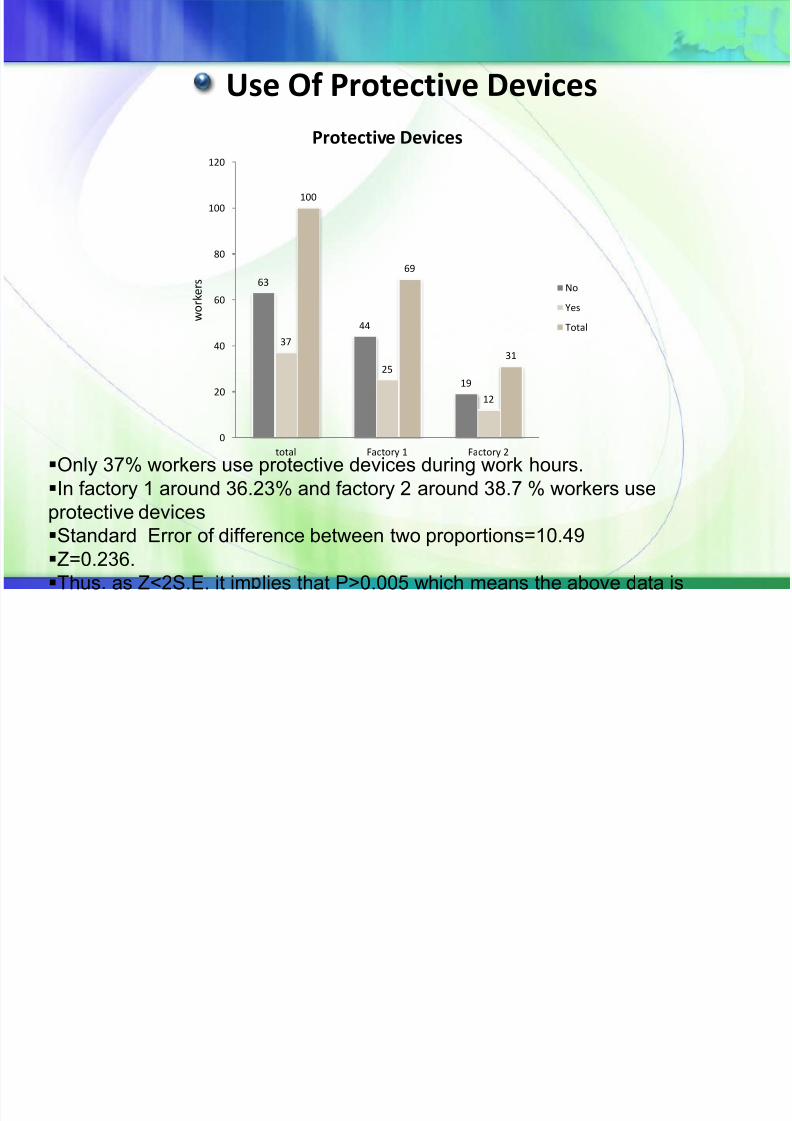
Use Of Protective Devices
63
44
19
37
25
12
100
69
31
0
20
40
60
80
100
120
total Factory 1 Factory 2
w o r k e r s
Protective Devices
No
Yes
Total
Only 37% workers use protective devices during work hours.
In factory 1 around 36.23% and factory 2 around 38.7 % workers use
protective devices
Standard Error of difference between two proportions=10.49
Z=0.236.Thus as Z<2S.E. it im lies that P>0.005 which means the above data is

7/27/2019 Health Status of Factory Workers
http://slidepdf.com/reader/full/health-status-of-factory-workers 12/29
Awareness About Rights
93
65
28
74 3
100
69
31
0
20
40
60
80
100
120
total Factory 1 Factory 2
w o r k e r s
Right Awareness
No
Yes
Total
Less than 10% workers are aware of their rights.
In factory 1 around 5.8% and factory 2 around 9.7 % workers are aware
about their rights.
Standard Error of difference between two proportions=4.168
Z=0.931.
Thus, as Z<2S.E. it implies that P>0.005 which means the above data is

7/27/2019 Health Status of Factory Workers
http://slidepdf.com/reader/full/health-status-of-factory-workers 13/29
Awareness About Health Hazards
61
39
22
39
30
9
100
69
31
0
20
40
60
80
100
120
Total Factory 1 Factory 2
w o r k e r s
Awareness about health hazards
No
Yes
Total
39% workers are aware about health hazards of their work.
In factory 1 around 43.5% and factory 2 around 29 % workers are aware about
health hazards.
Standard Error of difference between two proportions=10.1
Z=1.43.
Thus, as Z<2S.E. it implies that P>0.005 which means the above data is
7/27/2019 Health Status of Factory Workers
http://slidepdf.com/reader/full/health-status-of-factory-workers 14/29
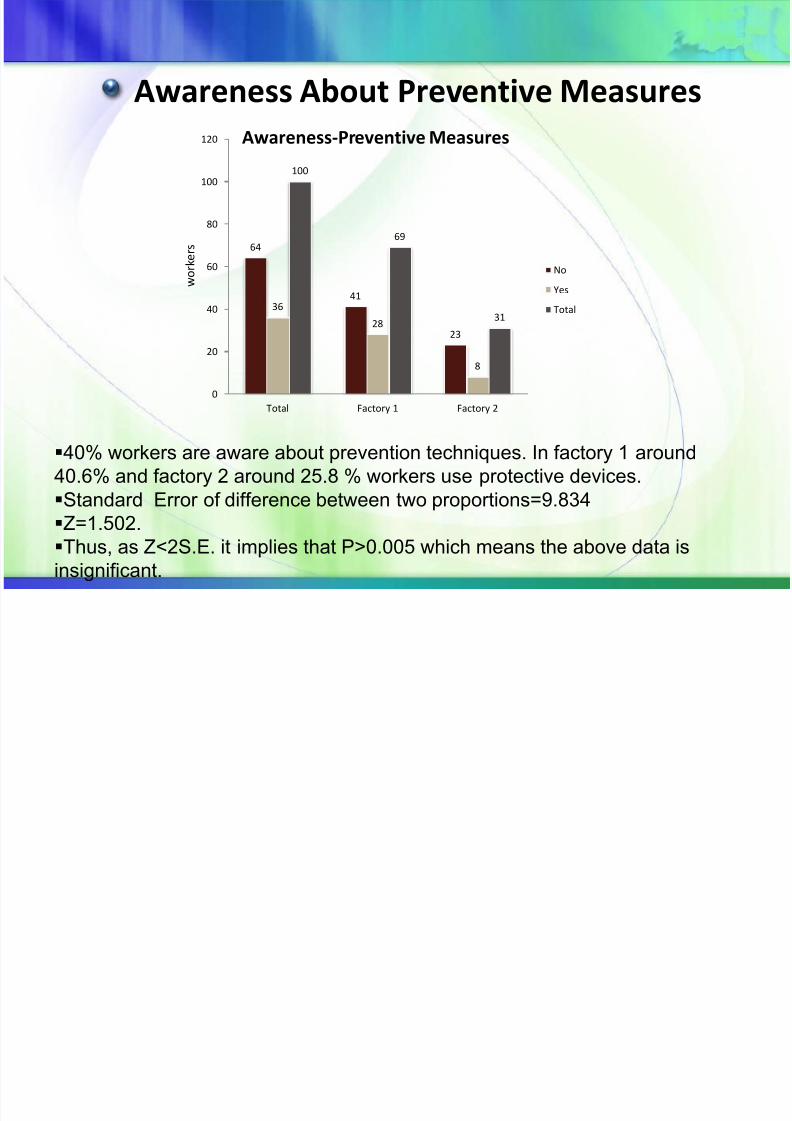
Awareness About Preventive Measures
64
41
23
36
28
8
100
69
31
0
20
40
60
80
100
120
Total Factory 1 Factory 2
w o r k e r s
Awareness-Preventive Measures
No
Yes
Total
40% workers are aware about prevention techniques. In factory 1 around
40.6% and factory 2 around 25.8 % workers use protective devices.
Standard Error of difference between two proportions=9.834
Z=1.502.
Thus, as Z<2S.E. it implies that P>0.005 which means the above data isinsignificant.
7/27/2019 Health Status of Factory Workers
http://slidepdf.com/reader/full/health-status-of-factory-workers 15/29
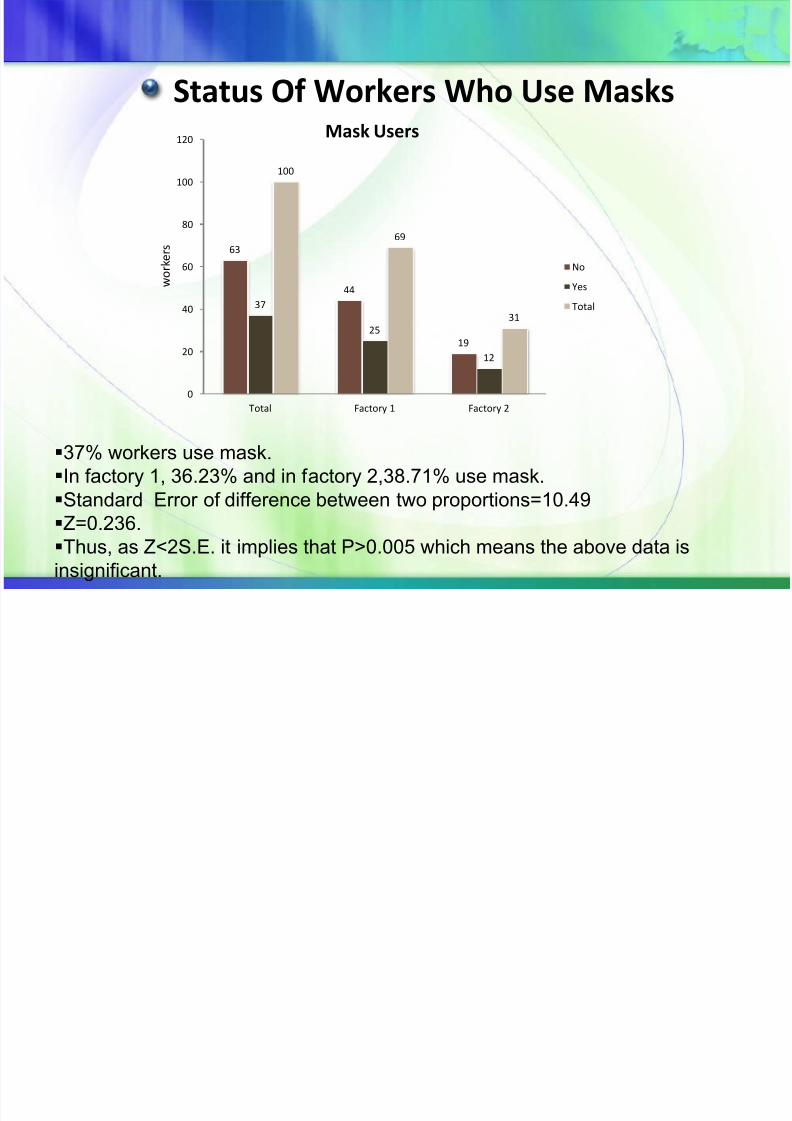
Status Of Workers Who Use Masks
63
44
19
37
25
12
100
69
31
0
20
40
60
80
100
120
Total Factory 1 Factory 2
w o r k e r s
Mask Users
No
Yes
Total
37% workers use mask.
In factory 1, 36.23% and in factory 2,38.71% use mask.
Standard Error of difference between two proportions=10.49
Z=0.236.
Thus, as Z<2S.E. it implies that P>0.005 which means the above data isinsignificant.

7/27/2019 Health Status of Factory Workers
http://slidepdf.com/reader/full/health-status-of-factory-workers 16/29
Status Of Workers Who Use Ear Plugs
87
58
29
13 11
2
100
69
31
0
20
40
60
80
100
120
Total Factory 1 Factory 2
W o r k e r s
Ear Plugs' Users
No
Yes
Total
13% workers use ear plugs.
In factory 1, 15.94% and in factory 2, 6.45% of workers use earplugs.
Standard Error of difference between two proportions=10.49
Z=0.236.
Thus, as Z<2S.E. it implies that P>0.005 which means the above data is
insignificant.

7/27/2019 Health Status of Factory Workers
http://slidepdf.com/reader/full/health-status-of-factory-workers 17/29
Use Of Protective Devices In Workers In
Relation To Their Level Of Education
0 1
8
18
7
324
28
43
17
6
0
5
10
15
20
25
30
35
40
45
50
Illiterate Just literate Primary Secondary Higher
secondary
Graduate
w
o
r
k
e
r
s
level of education
Protective Devices
Yes
total
At df =5 chi-square=3.273 and P=0.658
P>0.05 so chances of occurring this event by chance is more.
Thus there is no relation between level of education and use of protectivedevices.

7/27/2019 Health Status of Factory Workers
http://slidepdf.com/reader/full/health-status-of-factory-workers 18/29
Awareness Of Rights In Workers In Relation To
Their Level Of Education
1 0 02 2 22
4
28
43
17
6
0
5
10
15
20
25
3035
40
45
50
Illiterate Just literate Primary Secondary Higher
secondary
Graduate
w
o
r
k
e
r
s
level of education
Right Awareness
Yes
total
At df=5 chi-square=15.438 and P=0.009
Thus the data is highly significant and shows that the awareness about rights
increases at higher levels of education.

7/27/2019 Health Status of Factory Workers
http://slidepdf.com/reader/full/health-status-of-factory-workers 19/29
Comparison Of History Of Injury Against
Training Of Workers
74
23
2 1
0
10
20
30
40
50
60
70
80
No Yes
w
or
k
e
r
s
training
Comparison of Injury and training in
workers
History Of Injury No
History Of Injury Yes
Only 3% have history of injury.
At df =1 chi-square=0.148 and P=0.701
P>0.05 so chances of occurring this event by chance is more. Thus there
is no relationship between history of injury and training of workers as
accidents occur due to negligence on the part of workers.
7/27/2019 Health Status of Factory Workers
http://slidepdf.com/reader/full/health-status-of-factory-workers 20/29
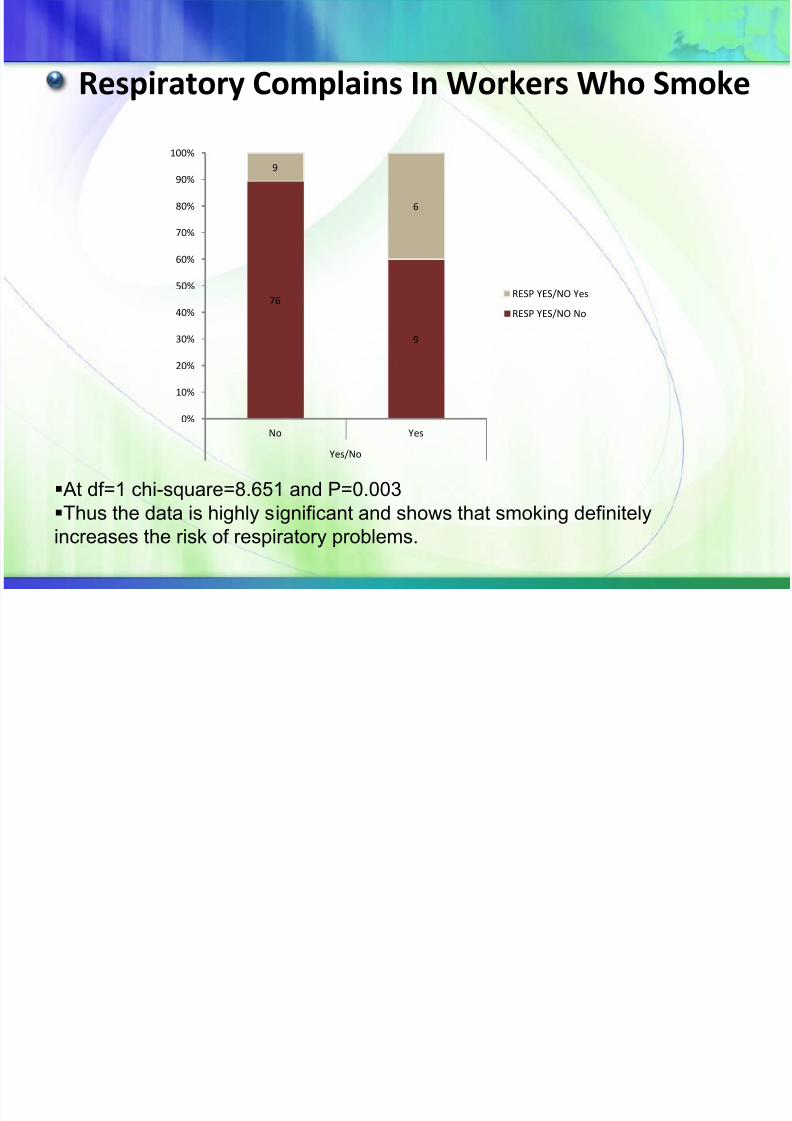
Respiratory Complains In Workers Who Smoke
76
9
9
6
0%
10%
20%
30%
40%
50%
60%
70%
80%
90%
100%
No Yes
Yes/No
RESP YES/NO Yes
RESP YES/NO No
At df=1 chi-square=8.651 and P=0.003
Thus the data is highly significant and shows that smoking definitely
increases the risk of respiratory problems.

7/27/2019 Health Status of Factory Workers
http://slidepdf.com/reader/full/health-status-of-factory-workers 21/29
Respiratory Complains In Workers In RelationTo Years Of Experience
37
30
76
5
01 1
6
4
12
0
5
10
15
20
25
30
35
40
1 - 5 6 - 10 11 - 15 16 - 20 21 - 25 26 - 30
w
o
r
k
e
r
s
years of experience
Respiratory problems
No
Yes
At df=1 chi-square=8.651 and P=0.003
Thus the data is highly significant and shows that respiratory problems
increase with increase in years of work.
7/27/2019 Health Status of Factory Workers
http://slidepdf.com/reader/full/health-status-of-factory-workers 22/29
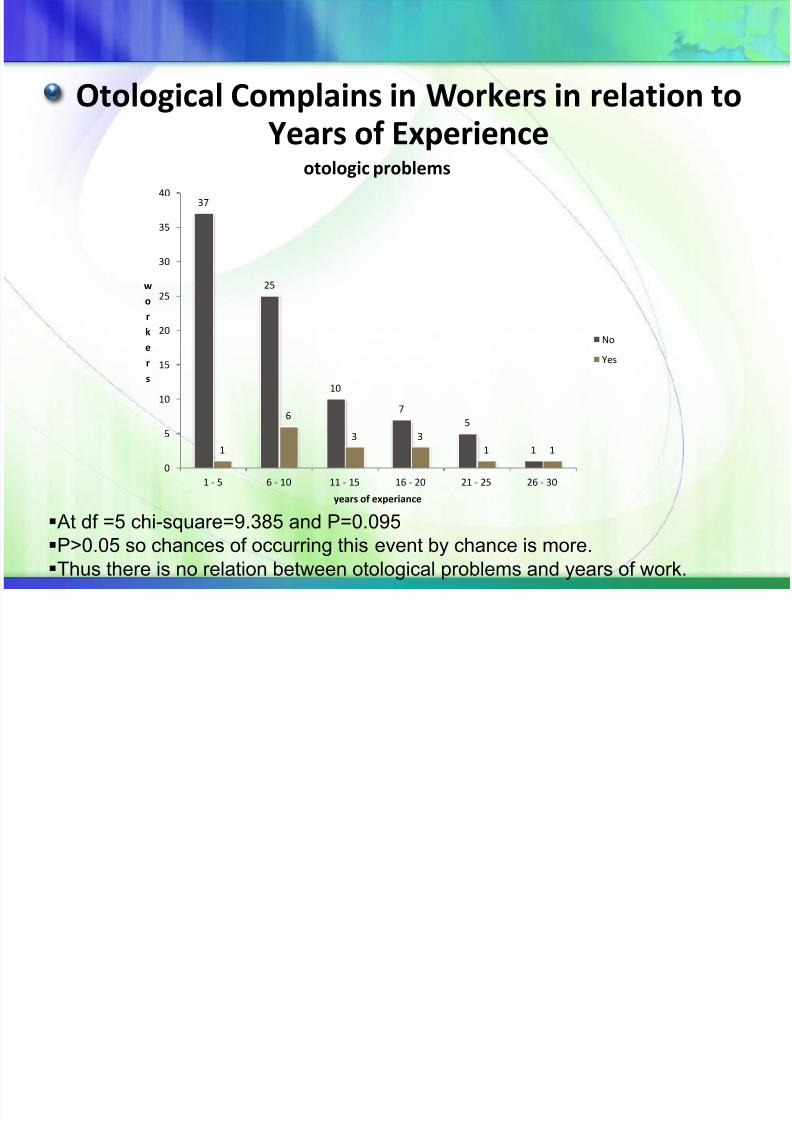
Otological Complains in Workers in relation to
Years of Experience
37
25
10
7
5
11
6
3 3
1 1
0
5
10
15
20
25
30
35
40
1 - 5 6 - 10 11 - 15 16 - 20 21 - 25 26 - 30
w
o
r
k
e
r
s
years of experiance
otologic problems
No
Yes
At df =5 chi-square=9.385 and P=0.095
P>0.05 so chances of occurring this event by chance is more.Thus there is no relation between otological problems and years of work.

7/27/2019 Health Status of Factory Workers
http://slidepdf.com/reader/full/health-status-of-factory-workers 23/29
Otological Complains in Workers VS use of Ear
Plugs
73
1214
10
10
20
30
40
50
60
70
80
No Yes
Ear Plugs
w
o
r
k
e
r
s
Otologic Problems
No
Yes
At df =1 chi-square=0.626 and P=0.429
P>0.05 so chances of occurring this event by chance is more.
Thus there is no relation between Otological problems and use of ear
7/27/2019 Health Status of Factory Workers
http://slidepdf.com/reader/full/health-status-of-factory-workers 24/29
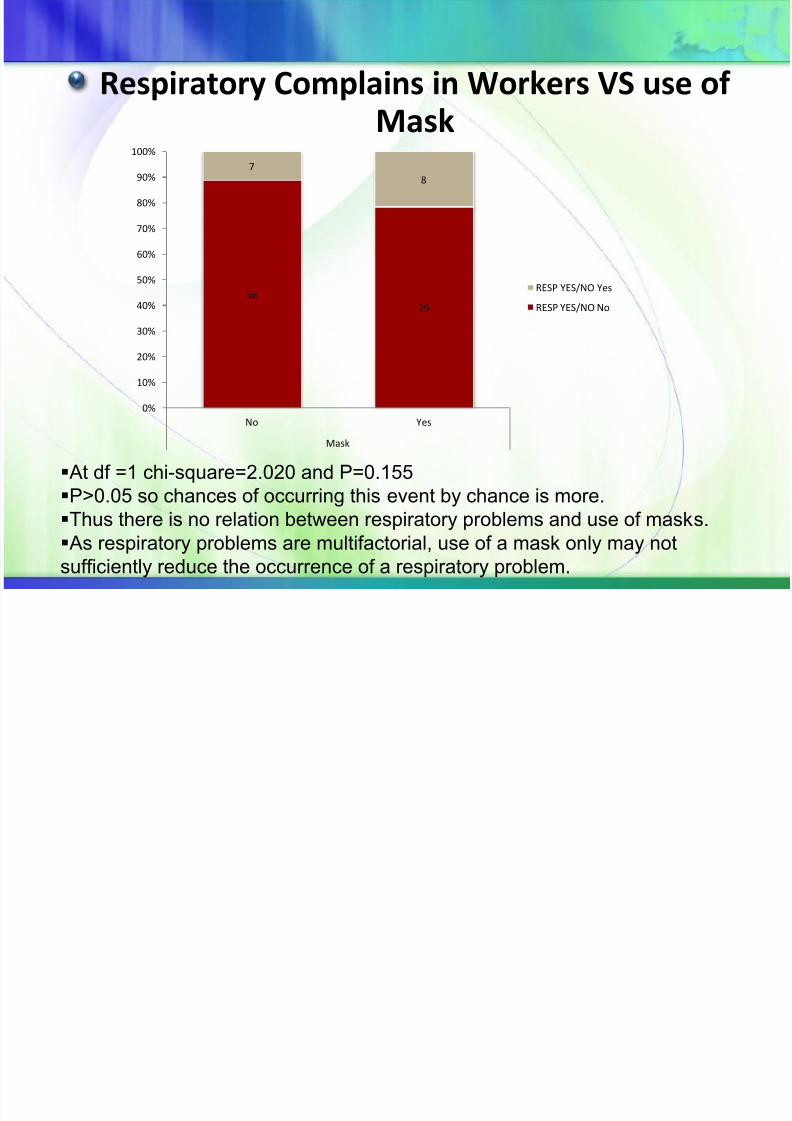
Respiratory Complains in Workers VS use of
Mask
56
29
7
8
0%
10%
20%
30%
40%
50%
60%
70%
80%
90%
100%
No Yes
Mask
RESP YES/NO Yes
RESP YES/NO No
At df =1 chi-square=2.020 and P=0.155
P>0.05 so chances of occurring this event by chance is more.
Thus there is no relation between respiratory problems and use of masks.
As respiratory problems are multifactorial, use of a mask only may not
sufficiently reduce the occurrence of a respiratory problem.

7/27/2019 Health Status of Factory Workers
http://slidepdf.com/reader/full/health-status-of-factory-workers 25/29
The workers should receive training in specific institutions. The training periodshould comprise a minimum 1 month duration. The workers should beallowed to operate machinery only after thorough training.
Provision of Leaves as per the laws.
The periods of work of adult workers in a factory each day shall be so fixed that no period shall exceed five hours and that no worker shall work for more thanfive hours before he has had an interval for rest of at least half an hour.
Prohibition of overlapping shifts
Work shall not be carried on in any factory by means of a system of shifts
so arranged that more than one relay of workers is engaged in work of thesame kind at the same time.
The duration of working hours should be reduced from 12 hrs to 8 hrs a day.
7/27/2019 Health Status of Factory Workers
http://slidepdf.com/reader/full/health-status-of-factory-workers 26/29
There should be regular medical check up of workers as follows:
The workers should be examined by qualified doctors and enquired about any health problems.
The factory owners should make provisions for regular medical check up.
Such health check up can be carried out at an interval of 3 months.
the factory can maintain the data regarding their health.
Protective devices like masks, gloves, aprons etc. should beprovided to the workers and workers should be encouraged to usethem regularly and continuously throughout the working hours.
The workers should be aware of their rights. The factory ownersshould conduct sessions regarding right awareness.

7/27/2019 Health Status of Factory Workers
http://slidepdf.com/reader/full/health-status-of-factory-workers 27/29
SAMPLE SIZE
CLINICAL EXAMINATION AND
INVESTIGATIONS
INTERVENTION
FOLLOW UP

7/27/2019 Health Status of Factory Workers
http://slidepdf.com/reader/full/health-status-of-factory-workers 28/29
The study carried amongst the factory workers of twodifferent textiles showed the following results:
Only 24% of workers have taken special training for their work ininstitutions like ATIRA.Rest of workers have learned their work from senior workers.85% workers are working for 12 hours a day.15% workers have some kind of respiratory problems.15% workers have some kind of otological problems.
3% workers have history of injury during work.40% workers are aware about health hazards of their work.40% workers are aware about prevention techniques.On average workers have an experience of about 10 years.All workers are ESIS beneficiary.
7/27/2019 Health Status of Factory Workers
http://slidepdf.com/reader/full/health-status-of-factory-workers 29/29
Only 37% workers use protective devices during work hours.
Less than 10% workers are aware of their rights like duration of
work per day, compensation in case of any injury, provision ofleaves, provision of protective devices etc.
The awareness about rights increases at higher levels ofeducation.
Smoking definitely increases the risk of respiratory problems.
Respiratory problems increase with increase in years of work.