health & safety performance indicators - isnetworld · health & safety performance...
TRANSCRIPT
Health & SafetyPerformance Indicators
An ISN Publication
ISN Report No. 1302 ISN.com
Contractor Group Benchmarking , U.S. All Industries, Comprehensive
2012 Data
© 2013 ISN
Contractor Group Benchmarking Report, U.S., 2012 Data // All Industries, ComprehensiveISNetworld.com // Report No. 1302 1
About ISN
Established in 2001, ISN® is a global leader in contractor and supplier management. We support over 320 Owner Clients in capital-intensive and public sector industries to help manage over 50,000 contractors and suppliers with operations in more than 75 countries. We are headquartered in Dallas, Texas, with additional offices in Calgary, Sydney, London, Los Angeles and New York.
ISN takes pride in leading efforts to improve the efficiency and effectiveness of contractor management systems and in serving as a forum for sharing industry best practices among our members.
Our innovative online contractor management database, ISNetworld, is constantly evolving to meet ever-changing corporate and legislative requirements while reducing unnecessary duplication associated with traditional contractor procurement processes.
Our Review and Verification Services (RAVS®) group is comprised of specialized professionals with expertise in health, safety, environmental, procurement, quality and other compliance requirements. RAVS® adds a level of due diligence to the information gathered from contractors and suppliers.
ISNetworld’s dynamic and configurable functionality allows Owner Clients to measure the key performance metrics relevant to them, promoting transparency, clear communication and sustainable operations. ISN provides an opportunity for Owner Clients to improve their risk management processes and to connect with safe and reliable contractors. By identifying contractors and suppliers who meet both client-specific and legislative standards, Owner Clients are able to drive tangible and sustained performance improvements while strengthening their relationships with their contractors and suppliers.
For more information, visit ISN.com, contact ISN at +1 214 303 4900 or email [email protected].

Contractor Group Benchmarking Report, U.S., 2012 Data // All Industries, ComprehensiveISNetworld.com // Report No. 1302 2
Table of Contents
About ISN .............................................................................................................................................................. 1
Preface...................................................................................................................................................................3
Table 1: 2012 Injury and Illness Rates by NAICS Code ....................................................................4
Table 2: 2012 Injury and Illness Rates by ISN Work Type ............................................................ 19
Appendix 1: Definitions ...............................................................................................................................45
Appendix 2: Incident Rate Calculations .............................................................................................46
Appendix 3: Analysis Procedure Summary .....................................................................................49
DisclaimerThe contents of this publication represent an aggregate data compilation and are intended for informational and general guidance purposes only. This publication is not intended, and does not constitute any advice, recommen-dation or proposal of a particular course of action, by or on behalf of ISN Software Corporation (“ISN”), to any user hereof. While efforts have been made to ensure the accuracy of the information contained in the publication, the information is not exhaustive and may contain both material and immaterial errors. ISN does not warrant or represent the accuracy or completeness of any information herein. ISN disclaims any losses, however arising, as a result of a user’s reliance on the contents of this publication. Before relying on any such material or data, users should carefully make their own assessment as to its accuracy, currency, completeness and relevance for their purposes, and should obtain any appropriate professional advice relevant to their particular circumstances. Any access or use of any information or material contained in this publication is at your own risk and constitutes agreement to the terms of this disclaimer.
Contractor Group Benchmarking Report, U.S., 2012 Data // All Industries, ComprehensiveISNetworld.com // Report No. 1302 3
Preface
ISN gathers and manages a comprehensive range of health, safety and environmental (HSE) performance data from contractors and suppliers in capital-intensive industries. In addition to HSE, procurement, quality and compliance information, annual and quarterly HSE perfor-mance statistics are collected through ISN’s web-based system, ISNetworld, then reviewed and verified by ISN’s Review and Verification Services (RAVS) for accuracy and completion.
The main purpose of this publication is to provide ISNetworld member contractors, suppliers and Owner Clients pertinent HSE performance information useful for benchmarking their organization’s performance against industry peers.
Collectively, approximately 50,000 contractors and suppliers actively report information through ISNetworld, representing nearly 11 billion work hours of activity in 2012 alone. A rich source of data such as this provides an opportunity for developing industry-specific bench-marking statistics that are unique for their quality, insight and comprehensiveness.
Industry specific performance indicator publications are available for a number of indus-tries, including Oil & Gas, Chemical, Utilities & Power Generation, Manufacturing*, Mining, Pharmaceuticals and Facilities Management. This publication specifically covers information pertinent to all industries for the year 2012.
The health and safety Key Performance Indicators (KPIs) collected and presented in this report include:
• Total Recordable Incident Rate (TRIR)• Total Nonfatal Recordable Incident Rate (Nonfatal TRIR)• Days Away, Restricted or Job Transfer Rate (DART)• Fatality Rate Per 100,000 Employees• Total Number of Fatalities• Incident Severity (In Days)
These KPIs are organized into two tables: Table 1 provides detailed health and safety performance indicators aggregated by NAICS code. For added granularity, Table 2 provides performance indicators grouped by ISN Work Type designation. All values in this publication are aggregated to preserve the anonymity of contractor and supplier companies. Appendices 1 through 3 provide definitions, calculations and analysis procedures.
It is ISN’s hope that users will find the publication useful for benchmarking their HSE perfor-mance against that of their peers and for driving continuous health and safety performance improvement efforts in the workplace.
*Manufacturing includes Steel, Fertilizer Products, Wood and Paper, Food and Agriculture industries.
Contractor Group Benchmarking Report, U.S., 2012 Data // All Industries, ComprehensiveISNetworld.com // Report No. 1302 4
Table 12012 Injury and Illness Rates,
by NAICS Code
Contractor Group Benchmarking Report, U.S., 2012 Data // All Industries, ComprehensiveISNetworld.com // Report No. 1302 5
[a] North American Industry Classifi cation System—United States, 2007. Totals for each NAICS code are based on all records classifi ed at a more disaggregated level and may include data for industries not shown separately. For example, calculations presented for two-digit NAICS codes will include all records with any of the three, four, fi ve and six-digit NAICS codes that are subsumed in the two-digit NAICS classifi cation.
[b] The injury and illness rates represent the number of injuries and illnesses per 100 full-time workers. See Appendix 2 on Incident Rate Calculations. [c] The fatality rate represents the number of fatalities per 100,000 full-time workers. See Appendix 2 on Fatality Rate Calculations.[d] The incident severity (in days) represents the number of days away from work per recordable incident. See Appendix 2 on Incident Severity (In Days) Calculations.
- Indicates that the data are suppressed because there are fewer than 10 contractors reporting for the cell.* Indicates that the difference between the rate computed using all valid records and that computed using only those records excluding the highest 0.5th percentile extreme values is greater than or equal to 10%. See sections 3 and 5 of Appendix 3 for more information.** Indicates that the reported fatality rate is greater than or equal to 100.† Indicates that the largest contractor in the corresponding NAICS Code contributes more than 70% of the Total Exposure Hours of all contractors in that NAICS Code.
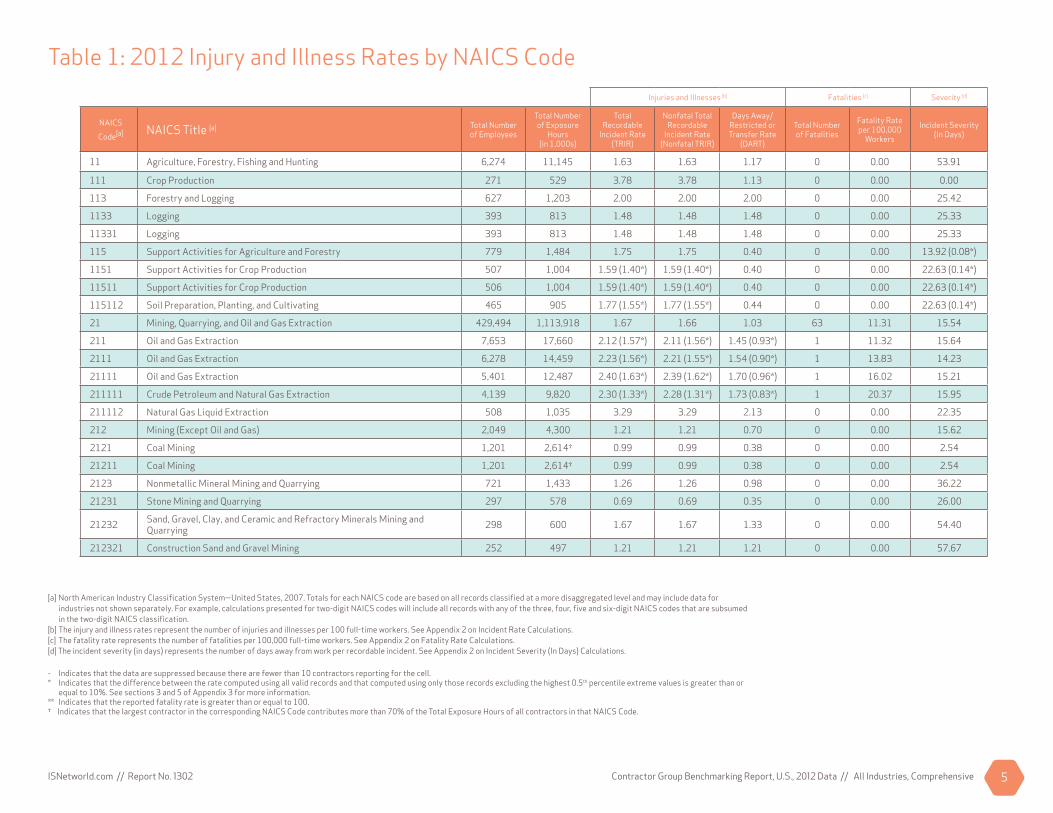
Table 1: 2012 Injury and Illness Rates by NAICS CodeInjuries and Illnesses [b] Fatalities [c] Severity [d]
NAICS
Code[a] NAICS Title [a] Total Number of Employees
Total Number of Exposure
Hours(in 1,000s)
Total Recordable
Incident Rate (TRIR)
Nonfatal Total Recordable
Incident Rate (Nonfatal TRIR)
Days Away/ Restricted or Transfer Rate
(DART)
Total Number of Fatalities
Fatality Rate per 100,000
Workers
Incident Severity (In Days)
11 Agriculture, Forestry, Fishing and Hunting 6,274 11,145 1.63 1.63 1.17 0 0.00 53.91
111 Crop Production 271 529 3.78 3.78 1.13 0 0.00 0.00
113 Forestry and Logging 627 1,203 2.00 2.00 2.00 0 0.00 25.42
1133 Logging 393 813 1.48 1.48 1.48 0 0.00 25.33
11331 Logging 393 813 1.48 1.48 1.48 0 0.00 25.33
115 Support Activities for Agriculture and Forestry 779 1,484 1.75 1.75 0.40 0 0.00 13.92 (0.08*)
1151 Support Activities for Crop Production 507 1,004 1.59 (1.40*) 1.59 (1.40*) 0.40 0 0.00 22.63 (0.14*)
11511 Support Activities for Crop Production 506 1,004 1.59 (1.40*) 1.59 (1.40*) 0.40 0 0.00 22.63 (0.14*)
115112 Soil Preparation, Planting, and Cultivating 465 905 1.77 (1.55*) 1.77 (1.55*) 0.44 0 0.00 22.63 (0.14*)
21 Mining, Quarrying, and Oil and Gas Extraction 429,494 1,113,918 1.67 1.66 1.03 63 11.31 15.54
211 Oil and Gas Extraction 7,653 17,660 2.12 (1.57*) 2.11 (1.56*) 1.45 (0.93*) 1 11.32 15.64
2111 Oil and Gas Extraction 6,278 14,459 2.23 (1.56*) 2.21 (1.55*) 1.54 (0.90*) 1 13.83 14.23
21111 Oil and Gas Extraction 5,401 12,487 2.40 (1.63*) 2.39 (1.62*) 1.70 (0.96*) 1 16.02 15.21
211111 Crude Petroleum and Natural Gas Extraction 4,139 9,820 2.30 (1.33*) 2.28 (1.31*) 1.73 (0.83*) 1 20.37 15.95
211112 Natural Gas Liquid Extraction 508 1,035 3.29 3.29 2.13 0 0.00 22.35
212 Mining (Except Oil and Gas) 2,049 4,300 1.21 1.21 0.70 0 0.00 15.62
2121 Coal Mining 1,201 2,614† 0.99 0.99 0.38 0 0.00 2.54
21211 Coal Mining 1,201 2,614† 0.99 0.99 0.38 0 0.00 2.54
2123 Nonmetallic Mineral Mining and Quarrying 721 1,433 1.26 1.26 0.98 0 0.00 36.22
21231 Stone Mining and Quarrying 297 578 0.69 0.69 0.35 0 0.00 26.00
21232 Sand, Gravel, Clay, and Ceramic and Refractory Minerals Mining and Quarrying 298 600 1.67 1.67 1.33 0 0.00 54.40
212321 Construction Sand and Gravel Mining 252 497 1.21 1.21 1.21 0 0.00 57.67

Contractor Group Benchmarking Report, U.S., 2012 Data // All Industries, ComprehensiveISNetworld.com // Report No. 1302 6
Table 1: 2012 Injury and Illness Rates by NAICS CodeInjuries and Illnesses [b] Fatalities [c] Severity [d]
NAICS
Code[a] NAICS Title [a] Total Number of Employees
Total Number of Exposure
Hours(in 1,000s)
Total Recordable
Incident Rate (TRIR)
Nonfatal Total Recordable
Incident Rate (Nonfatal TRIR)
Days Away/ Restricted or Transfer Rate
(DART)
Total Number of Fatalities
Fatality Rate per 100,000
Workers
Incident Severity (In Days)
213 Support Activities for Mining 418,674 1,089,043 1.67 1.65 1.02 62 11.39 15.54
2131 Support Activities for Mining 418,388 1,088,307 1.66 1.65 1.02 62 11.39 15.56
21311 Support Activities for Mining 418,388 1,088,307 1.66 1.65 1.02 62 11.39 15.56
213111 Drilling Oil and Gas Wells 82,543 182,879 2.09 2.07 1.31 14 15.31 18.96
213112 Support Activities for Oil and Gas Operations 332,820 898,423 1.58 1.57 0.96 48 10.69 14.55
22 Utilities 11,370 24,469 1.73 1.72 0.90 1 8.17 10.81
221 Utilities 10,096 22,832 1.53 1.52 0.80 1 8.76 10.13
2211 Electric Power Generation, Transmission and Distribution 6,111 13,390 1.52 1.51 0.81 1 14.94 9.32
22111 Electric Power Generation 4,596 10,072 1.31 1.31 0.60 0 0.00 6.24
221112 Fossil Fuel Electric Power Generation 2,900 6,523† 1.38 1.38 0.55 0 0.00 8.84
22112 Electric Power Transmission, Control, and Distribution 1,174 2,469 1.70 1.62 1.05 1 81.01 6.86
2212 Natural Gas Distribution 860 1,918 2.09 2.09 1.04 0 0.00 10.75
22121 Natural Gas Distribution 716 1,647 1.94 1.94 1.09 0 0.00 13.44
2213 Water, Sewage and Other Systems 3,120 7,513 1.41 1.41 0.72 0 0.00 11.45
22131 Water Supply and Irrigation Systems 2,488 6,129† 0.72 0.72 0.42 0 0.00 10.73
23 Construction 960,130 2,049,797 1.59 1.58 0.81 58 5.66 11.79
236 Construction of Buildings 107,599 224,889 1.66 1.66 0.83 6 5.34 9.22
2361 Residential Building Construction 1,239 2,551 3.92 3.84 2.90 1 78.39 9.34
23611 Residential Building Construction 1,229 2,532 3.95 3.87 2.92 1 78.99 9.34
236115 New Single-Family Housing Construction (Except Operative Builders) 601 1,129 2.48 2.30 1.24 1 ** 10.00
236118 Residential Remodelers 407 898 7.80 7.80 6.46 0 0.00 9.31
2362 Nonresidential Building Construction 105,910 221,407 1.63 1.63 0.80 5 4.52 9.13
23621 Industrial Building Construction 47,357 102,575 0.95 0.94 0.45 3 5.85 9.42
23622 Commercial and Institutional Building Construction 54,915 111,519 2.24 2.24 1.10 2 3.59 9.29
237 Heavy and Civil Engineering Construction 308,546 689,200 1.47 1.47 0.76 25 7.25 12.90
2371 Utility System Construction 210,411 476,515 1.43 1.42 0.74 20 8.39 13.57
23711 Water and Sewer Line and Related Structures Construction 16,816 32,658 2.66 2.65 1.51 2 12.25 13.50
23712 Oil and Gas Pipeline and Related Structures Construction 148,187 339,312 1.03 1.02 0.51 14 8.25 11.98
23713 Power and Communication Line and Related Structures Construction 41,636 96,455 2.36 2.35 1.21 4 8.29 16.06
2373 Highway, Street, and Bridge Construction 21,551 42,947 3.08 3.05 1.79 5 23.28 15.56
23731 Highway, Street, and Bridge Construction 20,209 40,659 3.11 3.09 1.80 5 24.59 15.66
Contractor Group Benchmarking Report, U.S., 2012 Data // All Industries, ComprehensiveISNetworld.com // Report No. 1302 7
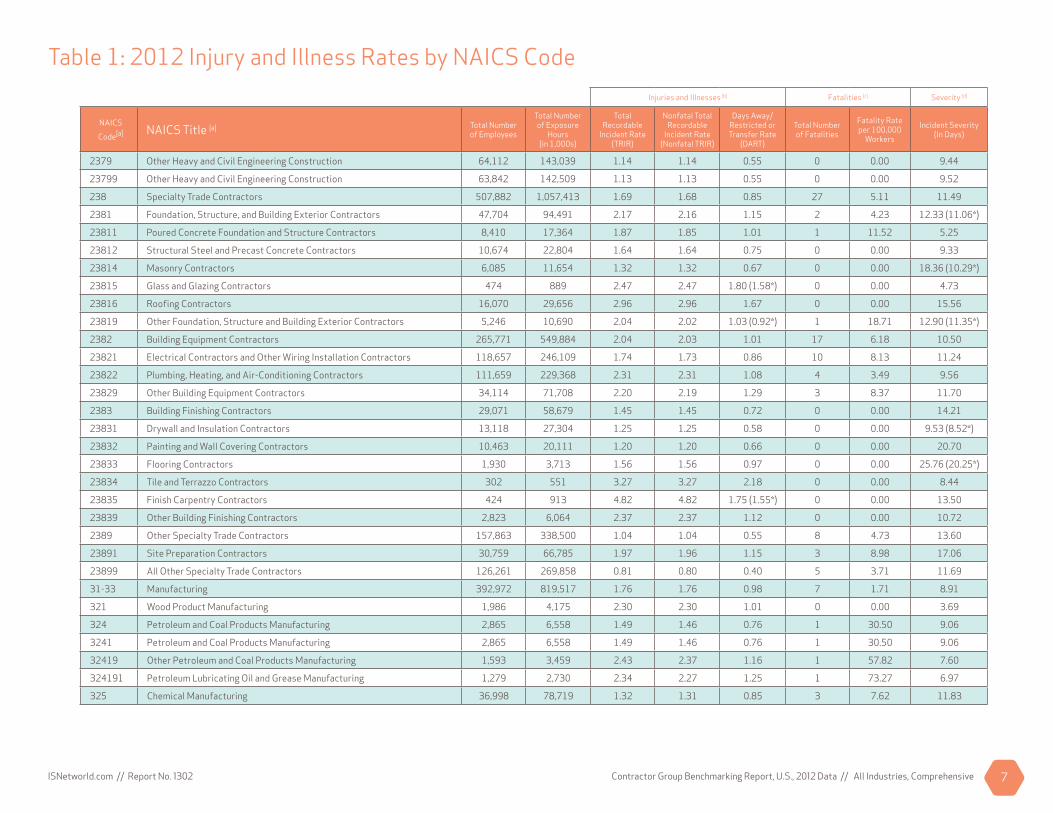
Table 1: 2012 Injury and Illness Rates by NAICS CodeInjuries and Illnesses [b] Fatalities [c] Severity [d]
NAICS
Code[a] NAICS Title [a] Total Number of Employees
Total Number of Exposure
Hours(in 1,000s)
Total Recordable
Incident Rate (TRIR)
Nonfatal Total Recordable
Incident Rate (Nonfatal TRIR)
Days Away/ Restricted or Transfer Rate
(DART)
Total Number of Fatalities
Fatality Rate per 100,000
Workers
Incident Severity (In Days)
2379 Other Heavy and Civil Engineering Construction 64,112 143,039 1.14 1.14 0.55 0 0.00 9.44
23799 Other Heavy and Civil Engineering Construction 63,842 142,509 1.13 1.13 0.55 0 0.00 9.52
238 Specialty Trade Contractors 507,882 1,057,413 1.69 1.68 0.85 27 5.11 11.49
2381 Foundation, Structure, and Building Exterior Contractors 47,704 94,491 2.17 2.16 1.15 2 4.23 12.33 (11.06*)
23811 Poured Concrete Foundation and Structure Contractors 8,410 17,364 1.87 1.85 1.01 1 11.52 5.25
23812 Structural Steel and Precast Concrete Contractors 10,674 22,804 1.64 1.64 0.75 0 0.00 9.33
23814 Masonry Contractors 6,085 11,654 1.32 1.32 0.67 0 0.00 18.36 (10.29*)
23815 Glass and Glazing Contractors 474 889 2.47 2.47 1.80 (1.58*) 0 0.00 4.73
23816 Roofi ng Contractors 16,070 29,656 2.96 2.96 1.67 0 0.00 15.56
23819 Other Foundation, Structure and Building Exterior Contractors 5,246 10,690 2.04 2.02 1.03 (0.92*) 1 18.71 12.90 (11.35*)
2382 Building Equipment Contractors 265,771 549,884 2.04 2.03 1.01 17 6.18 10.50
23821 Electrical Contractors and Other Wiring Installation Contractors 118,657 246,109 1.74 1.73 0.86 10 8.13 11.24
23822 Plumbing, Heating, and Air-Conditioning Contractors 111,659 229,368 2.31 2.31 1.08 4 3.49 9.56
23829 Other Building Equipment Contractors 34,114 71,708 2.20 2.19 1.29 3 8.37 11.70
2383 Building Finishing Contractors 29,071 58,679 1.45 1.45 0.72 0 0.00 14.21
23831 Drywall and Insulation Contractors 13,118 27,304 1.25 1.25 0.58 0 0.00 9.53 (8.52*)
23832 Painting and Wall Covering Contractors 10,463 20,111 1.20 1.20 0.66 0 0.00 20.70
23833 Flooring Contractors 1,930 3,713 1.56 1.56 0.97 0 0.00 25.76 (20.25*)
23834 Tile and Terrazzo Contractors 302 551 3.27 3.27 2.18 0 0.00 8.44
23835 Finish Carpentry Contractors 424 913 4.82 4.82 1.75 (1.55*) 0 0.00 13.50
23839 Other Building Finishing Contractors 2,823 6,064 2.37 2.37 1.12 0 0.00 10.72
2389 Other Specialty Trade Contractors 157,863 338,500 1.04 1.04 0.55 8 4.73 13.60
23891 Site Preparation Contractors 30,759 66,785 1.97 1.96 1.15 3 8.98 17.06
23899 All Other Specialty Trade Contractors 126,261 269,858 0.81 0.80 0.40 5 3.71 11.69
31-33 Manufacturing 392,972 819,517 1.76 1.76 0.98 7 1.71 8.91
321 Wood Product Manufacturing 1,986 4,175 2.30 2.30 1.01 0 0.00 3.69
324 Petroleum and Coal Products Manufacturing 2,865 6,558 1.49 1.46 0.76 1 30.50 9.06
3241 Petroleum and Coal Products Manufacturing 2,865 6,558 1.49 1.46 0.76 1 30.50 9.06
32419 Other Petroleum and Coal Products Manufacturing 1,593 3,459 2.43 2.37 1.16 1 57.82 7.60
324191 Petroleum Lubricating Oil and Grease Manufacturing 1,279 2,730 2.34 2.27 1.25 1 73.27 6.97
325 Chemical Manufacturing 36,998 78,719 1.32 1.31 0.85 3 7.62 11.83
Contractor Group Benchmarking Report, U.S., 2012 Data // All Industries, ComprehensiveISNetworld.com // Report No. 1302 8
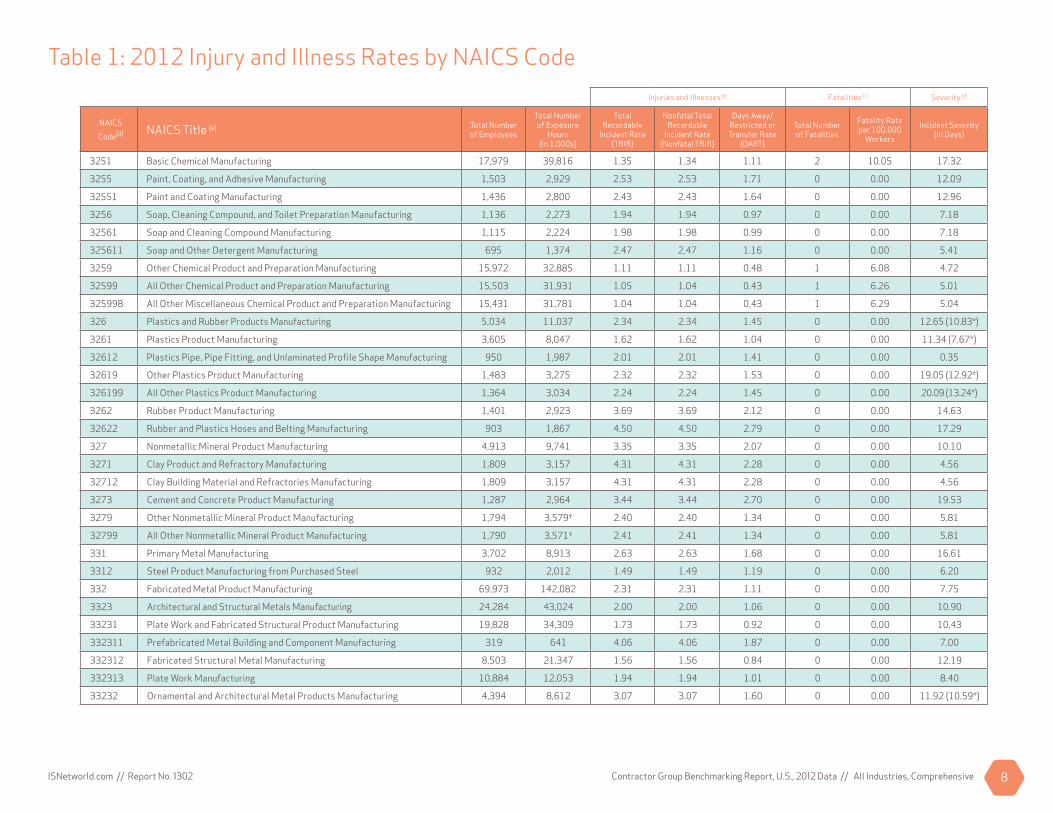
Table 1: 2012 Injury and Illness Rates by NAICS CodeInjuries and Illnesses [b] Fatalities [c] Severity [d]
NAICS
Code[a] NAICS Title [a] Total Number of Employees
Total Number of Exposure
Hours(in 1,000s)
Total Recordable
Incident Rate (TRIR)
Nonfatal Total Recordable
Incident Rate (Nonfatal TRIR)
Days Away/ Restricted or Transfer Rate
(DART)
Total Number of Fatalities
Fatality Rate per 100,000
Workers
Incident Severity (In Days)
3251 Basic Chemical Manufacturing 17,979 39,816 1.35 1.34 1.11 2 10.05 17.32
3255 Paint, Coating, and Adhesive Manufacturing 1,503 2,929 2.53 2.53 1.71 0 0.00 12.09
32551 Paint and Coating Manufacturing 1,436 2,800 2.43 2.43 1.64 0 0.00 12.96
3256 Soap, Cleaning Compound, and Toilet Preparation Manufacturing 1,136 2,273 1.94 1.94 0.97 0 0.00 7.18
32561 Soap and Cleaning Compound Manufacturing 1,115 2,224 1.98 1.98 0.99 0 0.00 7.18
325611 Soap and Other Detergent Manufacturing 695 1,374 2.47 2.47 1.16 0 0.00 5.41
3259 Other Chemical Product and Preparation Manufacturing 15,972 32,885 1.11 1.11 0.48 1 6.08 4.72
32599 All Other Chemical Product and Preparation Manufacturing 15,503 31,931 1.05 1.04 0.43 1 6.26 5.01
325998 All Other Miscellaneous Chemical Product and Preparation Manufacturing 15,431 31,781 1.04 1.04 0.43 1 6.29 5.04
326 Plastics and Rubber Products Manufacturing 5,034 11,037 2.34 2.34 1.45 0 0.00 12.65 (10.83*)
3261 Plastics Product Manufacturing 3,605 8,047 1.62 1.62 1.04 0 0.00 11.34 (7.67*)
32612 Plastics Pipe, Pipe Fitting, and Unlaminated Profi le Shape Manufacturing 950 1,987 2.01 2.01 1.41 0 0.00 0.35
32619 Other Plastics Product Manufacturing 1,483 3,275 2.32 2.32 1.53 0 0.00 19.05 (12.92*)
326199 All Other Plastics Product Manufacturing 1,364 3,034 2.24 2.24 1.45 0 0.00 20.09 (13.24*)
3262 Rubber Product Manufacturing 1,401 2,923 3.69 3.69 2.12 0 0.00 14.63
32622 Rubber and Plastics Hoses and Belting Manufacturing 903 1,867 4.50 4.50 2.79 0 0.00 17.29
327 Nonmetallic Mineral Product Manufacturing 4,913 9,741 3.35 3.35 2.07 0 0.00 10.10
3271 Clay Product and Refractory Manufacturing 1,809 3,157 4.31 4.31 2.28 0 0.00 4.56
32712 Clay Building Material and Refractories Manufacturing 1,809 3,157 4.31 4.31 2.28 0 0.00 4.56
3273 Cement and Concrete Product Manufacturing 1,287 2,964 3.44 3.44 2.70 0 0.00 19.53
3279 Other Nonmetallic Mineral Product Manufacturing 1,794 3,579† 2.40 2.40 1.34 0 0.00 5.81
32799 All Other Nonmetallic Mineral Product Manufacturing 1,790 3,571† 2.41 2.41 1.34 0 0.00 5.81
331 Primary Metal Manufacturing 3,702 8,913 2.63 2.63 1.68 0 0.00 16.61
3312 Steel Product Manufacturing from Purchased Steel 932 2,012 1.49 1.49 1.19 0 0.00 6.20
332 Fabricated Metal Product Manufacturing 69,973 142,082 2.31 2.31 1.11 0 0.00 7.75
3323 Architectural and Structural Metals Manufacturing 24,284 43,024 2.00 2.00 1.06 0 0.00 10.90
33231 Plate Work and Fabricated Structural Product Manufacturing 19,828 34,309 1.73 1.73 0.92 0 0.00 10.43
332311 Prefabricated Metal Building and Component Manufacturing 319 641 4.06 4.06 1.87 0 0.00 7.00
332312 Fabricated Structural Metal Manufacturing 8,503 21,347 1.56 1.56 0.84 0 0.00 12.19
332313 Plate Work Manufacturing 10,884 12,053 1.94 1.94 1.01 0 0.00 8.40
33232 Ornamental and Architectural Metal Products Manufacturing 4,394 8,612 3.07 3.07 1.60 0 0.00 11.92 (10.59*)
Contractor Group Benchmarking Report, U.S., 2012 Data // All Industries, ComprehensiveISNetworld.com // Report No. 1302 9
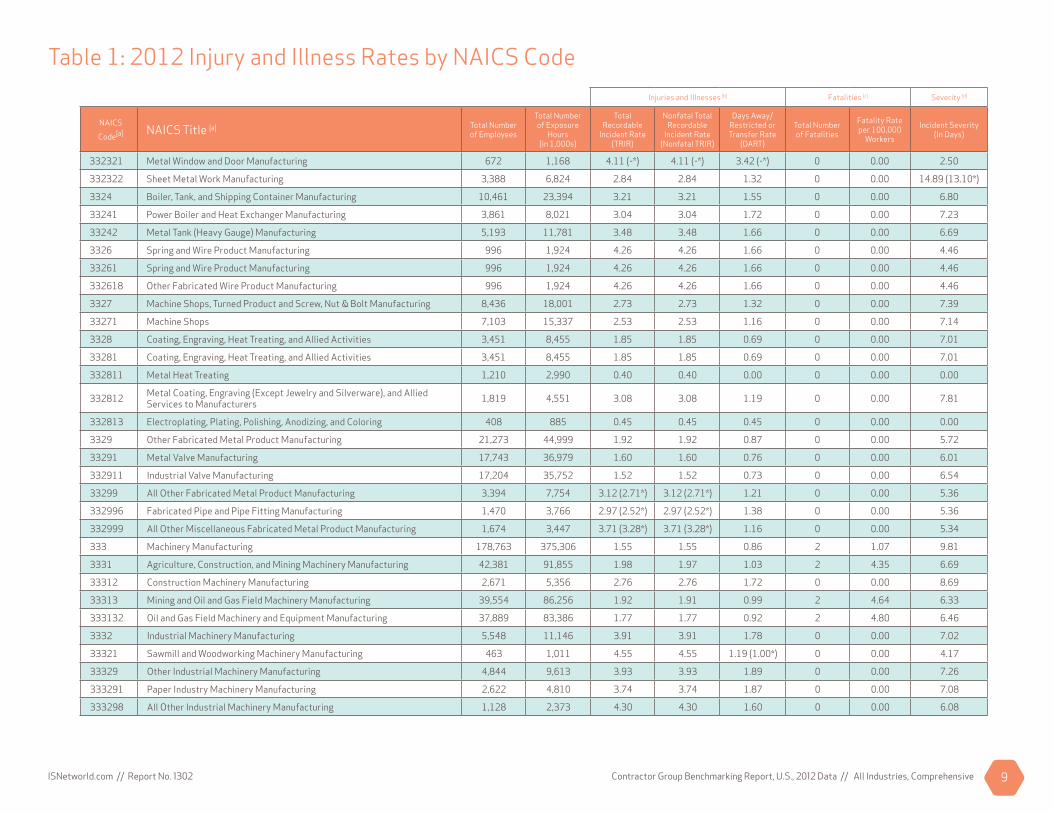
Table 1: 2012 Injury and Illness Rates by NAICS CodeInjuries and Illnesses [b] Fatalities [c] Severity [d]
NAICS
Code[a] NAICS Title [a] Total Number of Employees
Total Number of Exposure
Hours(in 1,000s)
Total Recordable
Incident Rate (TRIR)
Nonfatal Total Recordable
Incident Rate (Nonfatal TRIR)
Days Away/ Restricted or Transfer Rate
(DART)
Total Number of Fatalities
Fatality Rate per 100,000
Workers
Incident Severity (In Days)
332321 Metal Window and Door Manufacturing 672 1,168 4.11 (-*) 4.11 (-*) 3.42 (-*) 0 0.00 2.50
332322 Sheet Metal Work Manufacturing 3,388 6,824 2.84 2.84 1.32 0 0.00 14.89 (13.10*)
3324 Boiler, Tank, and Shipping Container Manufacturing 10,461 23,394 3.21 3.21 1.55 0 0.00 6.80
33241 Power Boiler and Heat Exchanger Manufacturing 3,861 8,021 3.04 3.04 1.72 0 0.00 7.23
33242 Metal Tank (Heavy Gauge) Manufacturing 5,193 11,781 3.48 3.48 1.66 0 0.00 6.69
3326 Spring and Wire Product Manufacturing 996 1,924 4.26 4.26 1.66 0 0.00 4.46
33261 Spring and Wire Product Manufacturing 996 1,924 4.26 4.26 1.66 0 0.00 4.46
332618 Other Fabricated Wire Product Manufacturing 996 1,924 4.26 4.26 1.66 0 0.00 4.46
3327 Machine Shops, Turned Product and Screw, Nut & Bolt Manufacturing 8,436 18,001 2.73 2.73 1.32 0 0.00 7.39
33271 Machine Shops 7,103 15,337 2.53 2.53 1.16 0 0.00 7.14
3328 Coating, Engraving, Heat Treating, and Allied Activities 3,451 8,455 1.85 1.85 0.69 0 0.00 7.01
33281 Coating, Engraving, Heat Treating, and Allied Activities 3,451 8,455 1.85 1.85 0.69 0 0.00 7.01
332811 Metal Heat Treating 1,210 2,990 0.40 0.40 0.00 0 0.00 0.00
332812 Metal Coating, Engraving (Except Jewelry and Silverware), and Allied Services to Manufacturers 1,819 4,551 3.08 3.08 1.19 0 0.00 7.81
332813 Electroplating, Plating, Polishing, Anodizing, and Coloring 408 885 0.45 0.45 0.45 0 0.00 0.00
3329 Other Fabricated Metal Product Manufacturing 21,273 44,999 1.92 1.92 0.87 0 0.00 5.72
33291 Metal Valve Manufacturing 17,743 36,979 1.60 1.60 0.76 0 0.00 6.01
332911 Industrial Valve Manufacturing 17,204 35,752 1.52 1.52 0.73 0 0.00 6.54
33299 All Other Fabricated Metal Product Manufacturing 3,394 7,754 3.12 (2.71*) 3.12 (2.71*) 1.21 0 0.00 5.36
332996 Fabricated Pipe and Pipe Fitting Manufacturing 1,470 3,766 2.97 (2.52*) 2.97 (2.52*) 1.38 0 0.00 5.36
332999 All Other Miscellaneous Fabricated Metal Product Manufacturing 1,674 3,447 3.71 (3.28*) 3.71 (3.28*) 1.16 0 0.00 5.34
333 Machinery Manufacturing 178,763 375,306 1.55 1.55 0.86 2 1.07 9.81
3331 Agriculture, Construction, and Mining Machinery Manufacturing 42,381 91,855 1.98 1.97 1.03 2 4.35 6.69
33312 Construction Machinery Manufacturing 2,671 5,356 2.76 2.76 1.72 0 0.00 8.69
33313 Mining and Oil and Gas Field Machinery Manufacturing 39,554 86,256 1.92 1.91 0.99 2 4.64 6.33
333132 Oil and Gas Field Machinery and Equipment Manufacturing 37,889 83,386 1.77 1.77 0.92 2 4.80 6.46
3332 Industrial Machinery Manufacturing 5,548 11,146 3.91 3.91 1.78 0 0.00 7.02
33321 Sawmill and Woodworking Machinery Manufacturing 463 1,011 4.55 4.55 1.19 (1.00*) 0 0.00 4.17
33329 Other Industrial Machinery Manufacturing 4,844 9,613 3.93 3.93 1.89 0 0.00 7.26
333291 Paper Industry Machinery Manufacturing 2,622 4,810 3.74 3.74 1.87 0 0.00 7.08
333298 All Other Industrial Machinery Manufacturing 1,128 2,373 4.30 4.30 1.60 0 0.00 6.08
Contractor Group Benchmarking Report, U.S., 2012 Data // All Industries, ComprehensiveISNetworld.com // Report No. 1302 10
Table 1: 2012 Injury and Illness Rates by NAICS CodeInjuries and Illnesses [b] Fatalities [c] Severity [d]
NAICS
Code[a] NAICS Title [a] Total Number of Employees
Total Number of Exposure
Hours(in 1,000s)
Total Recordable
Incident Rate (TRIR)
Nonfatal Total Recordable
Incident Rate (Nonfatal TRIR)
Days Away/ Restricted or Transfer Rate
(DART)
Total Number of Fatalities
Fatality Rate per 100,000
Workers
Incident Severity (In Days)
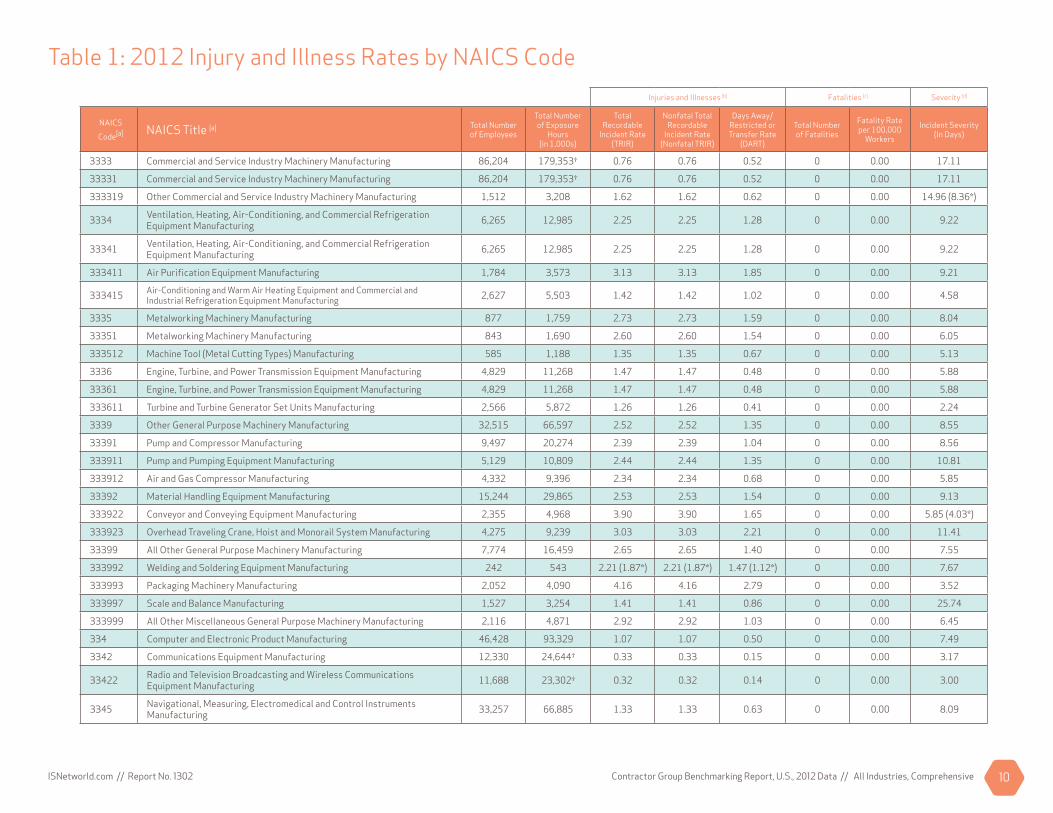
3333 Commercial and Service Industry Machinery Manufacturing 86,204 179,353† 0.76 0.76 0.52 0 0.00 17.11
33331 Commercial and Service Industry Machinery Manufacturing 86,204 179,353† 0.76 0.76 0.52 0 0.00 17.11
333319 Other Commercial and Service Industry Machinery Manufacturing 1,512 3,208 1.62 1.62 0.62 0 0.00 14.96 (8.36*)
3334 Ventilation, Heating, Air-Conditioning, and Commercial Refrigeration Equipment Manufacturing 6,265 12,985 2.25 2.25 1.28 0 0.00 9.22
33341 Ventilation, Heating, Air-Conditioning, and Commercial Refrigeration Equipment Manufacturing 6,265 12,985 2.25 2.25 1.28 0 0.00 9.22
333411 Air Purifi cation Equipment Manufacturing 1,784 3,573 3.13 3.13 1.85 0 0.00 9.21
333415 Air-Conditioning and Warm Air Heating Equipment and Commercial and Industrial Refrigeration Equipment Manufacturing 2,627 5,503 1.42 1.42 1.02 0 0.00 4.58
3335 Metalworking Machinery Manufacturing 877 1,759 2.73 2.73 1.59 0 0.00 8.04
33351 Metalworking Machinery Manufacturing 843 1,690 2.60 2.60 1.54 0 0.00 6.05
333512 Machine Tool (Metal Cutting Types) Manufacturing 585 1,188 1.35 1.35 0.67 0 0.00 5.13
3336 Engine, Turbine, and Power Transmission Equipment Manufacturing 4,829 11,268 1.47 1.47 0.48 0 0.00 5.88
33361 Engine, Turbine, and Power Transmission Equipment Manufacturing 4,829 11,268 1.47 1.47 0.48 0 0.00 5.88
333611 Turbine and Turbine Generator Set Units Manufacturing 2,566 5,872 1.26 1.26 0.41 0 0.00 2.24
3339 Other General Purpose Machinery Manufacturing 32,515 66,597 2.52 2.52 1.35 0 0.00 8.55
33391 Pump and Compressor Manufacturing 9,497 20,274 2.39 2.39 1.04 0 0.00 8.56
333911 Pump and Pumping Equipment Manufacturing 5,129 10,809 2.44 2.44 1.35 0 0.00 10.81
333912 Air and Gas Compressor Manufacturing 4,332 9,396 2.34 2.34 0.68 0 0.00 5.85
33392 Material Handling Equipment Manufacturing 15,244 29,865 2.53 2.53 1.54 0 0.00 9.13
333922 Conveyor and Conveying Equipment Manufacturing 2,355 4,968 3.90 3.90 1.65 0 0.00 5.85 (4.03*)
333923 Overhead Traveling Crane, Hoist and Monorail System Manufacturing 4,275 9,239 3.03 3.03 2.21 0 0.00 11.41
33399 All Other General Purpose Machinery Manufacturing 7,774 16,459 2.65 2.65 1.40 0 0.00 7.55
333992 Welding and Soldering Equipment Manufacturing 242 543 2.21 (1.87*) 2.21 (1.87*) 1.47 (1.12*) 0 0.00 7.67
333993 Packaging Machinery Manufacturing 2,052 4,090 4.16 4.16 2.79 0 0.00 3.52
333997 Scale and Balance Manufacturing 1,527 3,254 1.41 1.41 0.86 0 0.00 25.74
333999 All Other Miscellaneous General Purpose Machinery Manufacturing 2,116 4,871 2.92 2.92 1.03 0 0.00 6.45
334 Computer and Electronic Product Manufacturing 46,428 93,329 1.07 1.07 0.50 0 0.00 7.49
3342 Communications Equipment Manufacturing 12,330 24,644† 0.33 0.33 0.15 0 0.00 3.17
33422 Radio and Television Broadcasting and Wireless Communications Equipment Manufacturing 11,688 23,302† 0.32 0.32 0.14 0 0.00 3.00
3345 Navigational, Measuring, Electromedical and Control Instruments Manufacturing 33,257 66,885 1.33 1.33 0.63 0 0.00 8.09

Contractor Group Benchmarking Report, U.S., 2012 Data // All Industries, ComprehensiveISNetworld.com // Report No. 1302 11
Table 1: 2012 Injury and Illness Rates by NAICS CodeInjuries and Illnesses [b] Fatalities [c] Severity [d]
NAICS
Code[a] NAICS Title [a] Total Number of Employees
Total Number of Exposure
Hours(in 1,000s)
Total Recordable
Incident Rate (TRIR)
Nonfatal Total Recordable
Incident Rate (Nonfatal TRIR)
Days Away/ Restricted or Transfer Rate
(DART)
Total Number of Fatalities
Fatality Rate per 100,000
Workers
Incident Severity (In Days)
33451 Navigational, Measuring, Electromedical and Control Instruments Manufacturing 33,185 66,753 1.33 1.33 0.63 0 0.00 8.09
334513 Instruments and Related Products Manufacturing for Measuring, Displaying, and Controlling Industrial Process Variables 10,303 21,455 1.04 1.04 0.49 0 0.00 5.43
334515 Instrument Manufacturing for Measuring and Testing Electricity and Electrical Signals 3,110 6,110† 2.68 2.68 1.05 0 0.00 5.51
334516 Analytical Laboratory Instrument Manufacturing 16,587 32,360 1.25 1.25 0.62 0 0.00 11.17
334519 Other Measuring and Controlling Device Manufacturing 2,237 4,936 1.30 1.30 0.85 0 0.00 8.00
335 Electrical Equipment, Appliance, and Component Manufacturing 15,651 33,421 2.06 2.06 1.07 1 5.98 7.03
3353 Electrical Equipment Manufacturing 12,902 27,884 2.02 2.01 0.99 1 7.17 7.32
33531 Electrical Equipment Manufacturing 12,879 27,847 2.02 2.01 0.99 1 7.18 7.32
335311 Power, Distribution, and Specialty Transformer Manufacturing 1,875 4,075 3.29 3.24 0.98 1 49.08 7.93
335312 Motor and Generator Manufacturing 4,304 9,330 3.02 3.02 1.67 0 0.00 5.01 (3.90*)
335313 Switchgear and Switchboard Apparatus Manufacturing 882 1,986 2.52 2.52 1.61 0 0.00 10.12
335314 Relay and Industrial Control Manufacturing 5,622 12,085 0.73 0.73 0.36 0 0.00 12.25
3359 Other Electrical Equipment and Component Manufacturing 2,620 5,275 2.31 2.31 1.40 0 0.00 5.85
33599 All Other Electrical Equipment and Component Manufacturing 1,227 2,535 1.34 1.34 0.71 0 0.00 4.12
335999 All Other Miscellaneous Electrical Equipment and Component Manufacturing 590 1,111 1.62 1.62 0.54 0 0.00 3.56
336 Transportation Equipment Manufacturing 7,584 18,740† 2.28 2.28 1.46 0 0.00 10.52
3362 Motor Vehicle Body and Trailer Manufacturing 659 1,155† 0.87 0.87 0.52 0 0.00 13.80
33621 Motor Vehicle Body and Trailer Manufacturing 659 1,155† 0.87 0.87 0.52 0 0.00 13.80
336211 Motor Vehicle Body Manufacturing 121 163 2.45 2.45 2.45 0 0.00 34.50
3365 Railroad Rolling Stock Manufacturing 5,667 14,853† 2.07 2.07 1.32 0 0.00 11.65
33651 Railroad Rolling Stock Manufacturing 5,636 14,782† 2.08 2.08 1.33 0 0.00 11.65
339 Miscellaneous Manufacturing 5,566 11,667 1.75 1.75 0.94 0 0.00 7.77
3399 Other Miscellaneous Manufacturing 5,255 11,014 1.78 1.78 0.94 0 0.00 7.96
33999 All Other Miscellaneous Manufacturing 4,170 8,948 1.70 1.70 1.05 0 0.00 7.75
339991 Gasket, Packing, and Sealing Device Manufacturing 3,555 7,725 1.68 1.68 1.17 0 0.00 9.02
339999 All Other Miscellaneous Manufacturing 615 1,223 1.80 1.80 0.33 (0.16*) 0 0.00 0.27
42 Wholesale Trade 206,069 431,749 2.16 2.16 1.38 6 2.78 8.90
423 Merchant Wholesalers, Durable Goods 106,633 222,448 2.29 2.29 1.29 3 2.70 8.67
4233 Lumber and Other Construction Materials Merchant Wholesalers 787 1,608 3.36 (-*) 3.36 (-*) 1.49 (-*) 0 0.00 6.07
Contractor Group Benchmarking Report, U.S., 2012 Data // All Industries, ComprehensiveISNetworld.com // Report No. 1302 12
Table 1: 2012 Injury and Illness Rates by NAICS CodeInjuries and Illnesses [b] Fatalities [c] Severity [d]
NAICS
Code[a] NAICS Title [a] Total Number of Employees
Total Number of Exposure
Hours(in 1,000s)
Total Recordable
Incident Rate (TRIR)
Nonfatal Total Recordable
Incident Rate (Nonfatal TRIR)
Days Away/ Restricted or Transfer Rate
(DART)
Total Number of Fatalities
Fatality Rate per 100,000
Workers
Incident Severity (In Days)
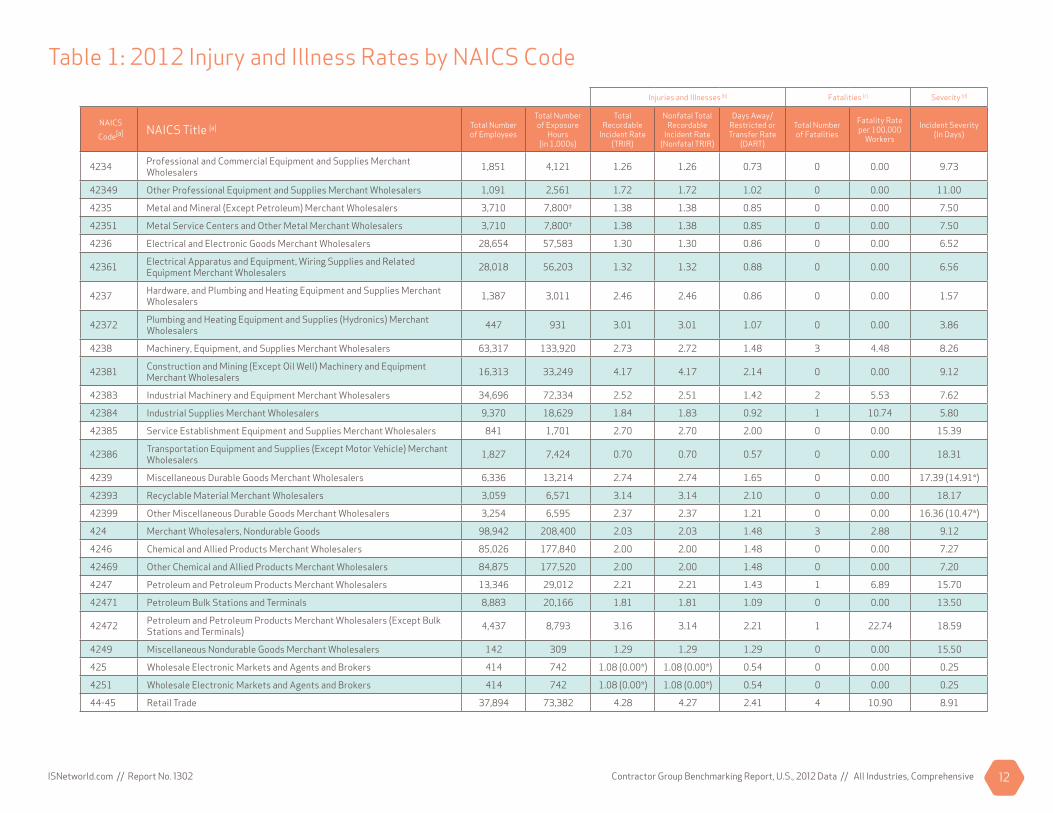
4234 Professional and Commercial Equipment and Supplies Merchant Wholesalers 1,851 4,121 1.26 1.26 0.73 0 0.00 9.73
42349 Other Professional Equipment and Supplies Merchant Wholesalers 1,091 2,561 1.72 1.72 1.02 0 0.00 11.00
4235 Metal and Mineral (Except Petroleum) Merchant Wholesalers 3,710 7,800† 1.38 1.38 0.85 0 0.00 7.50
42351 Metal Service Centers and Other Metal Merchant Wholesalers 3,710 7,800† 1.38 1.38 0.85 0 0.00 7.50
4236 Electrical and Electronic Goods Merchant Wholesalers 28,654 57,583 1.30 1.30 0.86 0 0.00 6.52
42361 Electrical Apparatus and Equipment, Wiring Supplies and Related Equipment Merchant Wholesalers 28,018 56,203 1.32 1.32 0.88 0 0.00 6.56
4237 Hardware, and Plumbing and Heating Equipment and Supplies Merchant Wholesalers 1,387 3,011 2.46 2.46 0.86 0 0.00 1.57
42372 Plumbing and Heating Equipment and Supplies (Hydronics) Merchant Wholesalers 447 931 3.01 3.01 1.07 0 0.00 3.86
4238 Machinery, Equipment, and Supplies Merchant Wholesalers 63,317 133,920 2.73 2.72 1.48 3 4.48 8.26
42381 Construction and Mining (Except Oil Well) Machinery and Equipment Merchant Wholesalers 16,313 33,249 4.17 4.17 2.14 0 0.00 9.12
42383 Industrial Machinery and Equipment Merchant Wholesalers 34,696 72,334 2.52 2.51 1.42 2 5.53 7.62
42384 Industrial Supplies Merchant Wholesalers 9,370 18,629 1.84 1.83 0.92 1 10.74 5.80
42385 Service Establishment Equipment and Supplies Merchant Wholesalers 841 1,701 2.70 2.70 2.00 0 0.00 15.39
42386 Transportation Equipment and Supplies (Except Motor Vehicle) Merchant Wholesalers 1,827 7,424 0.70 0.70 0.57 0 0.00 18.31
4239 Miscellaneous Durable Goods Merchant Wholesalers 6,336 13,214 2.74 2.74 1.65 0 0.00 17.39 (14.91*)
42393 Recyclable Material Merchant Wholesalers 3,059 6,571 3.14 3.14 2.10 0 0.00 18.17
42399 Other Miscellaneous Durable Goods Merchant Wholesalers 3,254 6,595 2.37 2.37 1.21 0 0.00 16.36 (10.47*)
424 Merchant Wholesalers, Nondurable Goods 98,942 208,400 2.03 2.03 1.48 3 2.88 9.12
4246 Chemical and Allied Products Merchant Wholesalers 85,026 177,840 2.00 2.00 1.48 0 0.00 7.27
42469 Other Chemical and Allied Products Merchant Wholesalers 84,875 177,520 2.00 2.00 1.48 0 0.00 7.20
4247 Petroleum and Petroleum Products Merchant Wholesalers 13,346 29,012 2.21 2.21 1.43 1 6.89 15.70
42471 Petroleum Bulk Stations and Terminals 8,883 20,166 1.81 1.81 1.09 0 0.00 13.50
42472 Petroleum and Petroleum Products Merchant Wholesalers (Except Bulk Stations and Terminals) 4,437 8,793 3.16 3.14 2.21 1 22.74 18.59
4249 Miscellaneous Nondurable Goods Merchant Wholesalers 142 309 1.29 1.29 1.29 0 0.00 15.50
425 Wholesale Electronic Markets and Agents and Brokers 414 742 1.08 (0.00*) 1.08 (0.00*) 0.54 0 0.00 0.25
4251 Wholesale Electronic Markets and Agents and Brokers 414 742 1.08 (0.00*) 1.08 (0.00*) 0.54 0 0.00 0.25
44-45 Retail Trade 37,894 73,382 4.28 4.27 2.41 4 10.90 8.91
Contractor Group Benchmarking Report, U.S., 2012 Data // All Industries, ComprehensiveISNetworld.com // Report No. 1302 13
Table 1: 2012 Injury and Illness Rates by NAICS CodeInjuries and Illnesses [b] Fatalities [c] Severity [d]
NAICS
Code[a] NAICS Title [a] Total Number of Employees
Total Number of Exposure
Hours(in 1,000s)
Total Recordable
Incident Rate (TRIR)
Nonfatal Total Recordable
Incident Rate (Nonfatal TRIR)
Days Away/ Restricted or Transfer Rate
(DART)
Total Number of Fatalities
Fatality Rate per 100,000
Workers
Incident Severity (In Days)
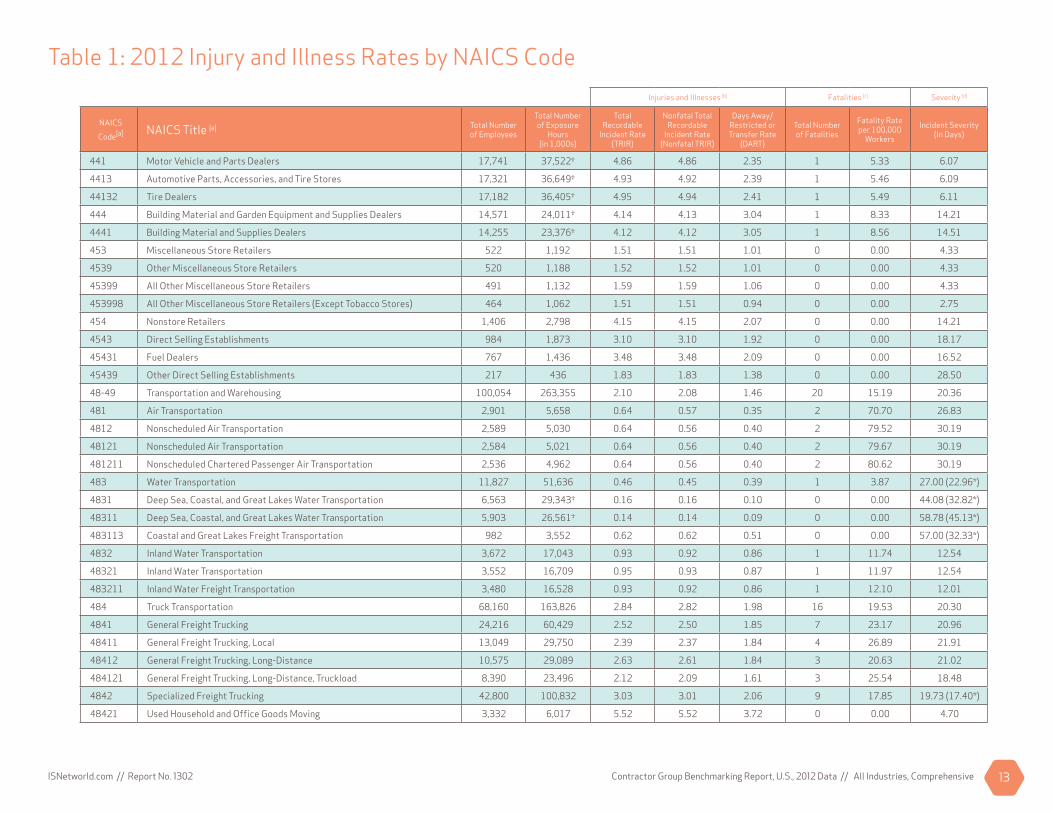
441 Motor Vehicle and Parts Dealers 17,741 37,522† 4.86 4.86 2.35 1 5.33 6.07
4413 Automotive Parts, Accessories, and Tire Stores 17,321 36,649† 4.93 4.92 2.39 1 5.46 6.09
44132 Tire Dealers 17,182 36,405† 4.95 4.94 2.41 1 5.49 6.11
444 Building Material and Garden Equipment and Supplies Dealers 14,571 24,011† 4.14 4.13 3.04 1 8.33 14.21
4441 Building Material and Supplies Dealers 14,255 23,376† 4.12 4.12 3.05 1 8.56 14.51
453 Miscellaneous Store Retailers 522 1,192 1.51 1.51 1.01 0 0.00 4.33
4539 Other Miscellaneous Store Retailers 520 1,188 1.52 1.52 1.01 0 0.00 4.33
45399 All Other Miscellaneous Store Retailers 491 1,132 1.59 1.59 1.06 0 0.00 4.33
453998 All Other Miscellaneous Store Retailers (Except Tobacco Stores) 464 1,062 1.51 1.51 0.94 0 0.00 2.75
454 Nonstore Retailers 1,406 2,798 4.15 4.15 2.07 0 0.00 14.21
4543 Direct Selling Establishments 984 1,873 3.10 3.10 1.92 0 0.00 18.17
45431 Fuel Dealers 767 1,436 3.48 3.48 2.09 0 0.00 16.52
45439 Other Direct Selling Establishments 217 436 1.83 1.83 1.38 0 0.00 28.50
48-49 Transportation and Warehousing 100,054 263,355 2.10 2.08 1.46 20 15.19 20.36
481 Air Transportation 2,901 5,658 0.64 0.57 0.35 2 70.70 26.83
4812 Nonscheduled Air Transportation 2,589 5,030 0.64 0.56 0.40 2 79.52 30.19
48121 Nonscheduled Air Transportation 2,584 5,021 0.64 0.56 0.40 2 79.67 30.19
481211 Nonscheduled Chartered Passenger Air Transportation 2,536 4,962 0.64 0.56 0.40 2 80.62 30.19
483 Water Transportation 11,827 51,636 0.46 0.45 0.39 1 3.87 27.00 (22.96*)
4831 Deep Sea, Coastal, and Great Lakes Water Transportation 6,563 29,343† 0.16 0.16 0.10 0 0.00 44.08 (32.82*)
48311 Deep Sea, Coastal, and Great Lakes Water Transportation 5,903 26,561† 0.14 0.14 0.09 0 0.00 58.78 (45.13*)
483113 Coastal and Great Lakes Freight Transportation 982 3,552 0.62 0.62 0.51 0 0.00 57.00 (32.33*)
4832 Inland Water Transportation 3,672 17,043 0.93 0.92 0.86 1 11.74 12.54
48321 Inland Water Transportation 3,552 16,709 0.95 0.93 0.87 1 11.97 12.54
483211 Inland Water Freight Transportation 3,480 16,528 0.93 0.92 0.86 1 12.10 12.01
484 Truck Transportation 68,160 163,826 2.84 2.82 1.98 16 19.53 20.30
4841 General Freight Trucking 24,216 60,429 2.52 2.50 1.85 7 23.17 20.96
48411 General Freight Trucking, Local 13,049 29,750 2.39 2.37 1.84 4 26.89 21.91
48412 General Freight Trucking, Long-Distance 10,575 29,089 2.63 2.61 1.84 3 20.63 21.02
484121 General Freight Trucking, Long-Distance, Truckload 8,390 23,496 2.12 2.09 1.61 3 25.54 18.48
4842 Specialized Freight Trucking 42,800 100,832 3.03 3.01 2.06 9 17.85 19.73 (17.40*)
48421 Used Household and Offi ce Goods Moving 3,332 6,017 5.52 5.52 3.72 0 0.00 4.70

Contractor Group Benchmarking Report, U.S., 2012 Data // All Industries, ComprehensiveISNetworld.com // Report No. 1302 14
Table 1: 2012 Injury and Illness Rates by NAICS CodeInjuries and Illnesses [b] Fatalities [c] Severity [d]
NAICS
Code[a] NAICS Title [a] Total Number of Employees
Total Number of Exposure
Hours(in 1,000s)
Total Recordable
Incident Rate (TRIR)
Nonfatal Total Recordable
Incident Rate (Nonfatal TRIR)
Days Away/ Restricted or Transfer Rate
(DART)
Total Number of Fatalities
Fatality Rate per 100,000
Workers
Incident Severity (In Days)
48422 Specialized Freight (Except Used Goods) Trucking, Local 30,497 73,567 2.99 2.97 2.04 8 21.75 22.16 (19.26*)
48423 Specialized Freight (Except Used Goods) Trucking, Long-Distance 8,041 19,464 2.27 2.27 1.54 0 0.00 20.19
486 Pipeline Transportation 1,326 3,169 2.90 2.90 2.27 0 0.00 20.46
4869 Other Pipeline Transportation 738 1,599 3.63 3.63 3.13 0 0.00 23.17
48699 All Other Pipeline Transportation 284 552 1.45 1.45 1.45 0 0.00 30.50
488 Support Activities for Transportation 12,923 32,533 1.20 1.20 0.77 1 6.15 18.34
4882 Support Activities for Rail Transportation 4,078 8,582 1.84 1.84 0.86 0 0.00 17.61
48821 Support Activities for Rail Transportation 2,996 6,147 1.27 1.27 0.36 0 0.00 12.49
4883 Support Activities for Water Transportation 6,091 17,083 0.71 0.70 0.52 1 11.71 20.28
48832 Marine Cargo Handling 3,227 7,571 0.40 0.40 0.29 (0.24*) 0 0.00 23.20
48833 Navigational Services to Shipping 471 1,124 2.85 2.85 2.31 0 0.00 32.56
48839 Other Support Activities for Water Transportation 2,180 7,924 0.35 0.35 0.25 0 0.00 19.36
4884 Support Activities for Road Transportation 1,672 4,408† 2.13 2.13 1.77 0 0.00 20.28
48849 Other Support Activities for Road Transportation 1,657 4,370† 2.15 2.15 1.79 0 0.00 20.28
4885 Freight Transportation Arrangement 569 1,139 1.23 1.23 0.70 0 0.00 0.00
493 Warehousing and Storage 1,950 4,384 0.87 0.87 0.59 0 0.00 20.21
4931 Warehousing and Storage 1,950 4,384 0.87 0.87 0.59 0 0.00 20.21
51 Information 12,899 28,372† 0.52 0.52 0.13 0 0.00 6.07
517 Telecommunications 2,783 7,039 0.85 0.85 0.45 0 0.00 14.97
5174 Satellite Telecommunications 1,042 2,253 1.07 1.07 0.62 0 0.00 26.83
51741 Satellite Telecommunications 1,042 2,253 1.07 1.07 0.62 0 0.00 26.83
5179 Other Telecommunications 332 691 1.16 1.16 0.29 0 0.00 0.25
51791 Other Telecommunications 332 691 1.16 1.16 0.29 0 0.00 0.25
53 Real Estate and Rental and Leasing 47,287 111,445 1.71 1.70 1.14 4 7.18 14.79
531 Real Estate 1,654 3,194 1.44 1.44 0.63 0 0.00 10.17
5313 Activities Related to Real Estate 943 1,827 1.53 1.53 0.55 0 0.00 13.57
53139 Other Activities Related to Real Estate 655 1,375 0.00 0.00 0.00 0 0.00 0.00
532 Rental and Leasing Services 45,633 108,251 1.72 1.71 1.16 4 7.39 14.90
5323 General Rental Centers 266 570 3.86 3.86 2.80 0 0.00 0.00
5324 Commercial and Industrial Machinery and Equipment Rental and Leasing 44,046 105,077 1.72 1.71 1.16 4 7.61 15.11
53241 Construction, Transportation, Mining, and Forestry Machinery and Equipment Rental and Leasing 25,827 61,695 1.53 1.52 1.06 2 6.48 13.76
Contractor Group Benchmarking Report, U.S., 2012 Data // All Industries, ComprehensiveISNetworld.com // Report No. 1302 15
Table 1: 2012 Injury and Illness Rates by NAICS CodeInjuries and Illnesses [b] Fatalities [c] Severity [d]
NAICS
Code[a] NAICS Title [a] Total Number of Employees
Total Number of Exposure
Hours(in 1,000s)
Total Recordable
Incident Rate (TRIR)
Nonfatal Total Recordable
Incident Rate (Nonfatal TRIR)
Days Away/ Restricted or Transfer Rate
(DART)
Total Number of Fatalities
Fatality Rate per 100,000
Workers
Incident Severity (In Days)
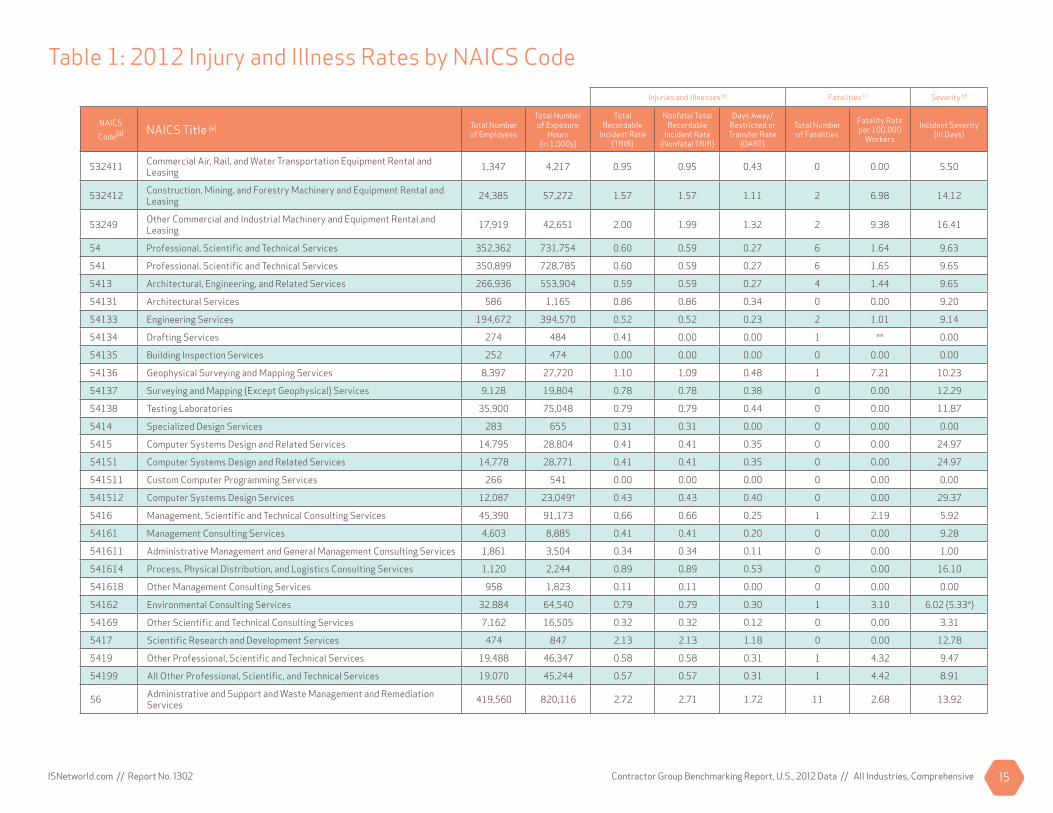
532411 Commercial Air, Rail, and Water Transportation Equipment Rental and Leasing 1,347 4,217 0.95 0.95 0.43 0 0.00 5.50
532412 Construction, Mining, and Forestry Machinery and Equipment Rental and Leasing 24,385 57,272 1.57 1.57 1.11 2 6.98 14.12
53249 Other Commercial and Industrial Machinery and Equipment Rental and Leasing 17,919 42,651 2.00 1.99 1.32 2 9.38 16.41
54 Professional, Scientifi c and Technical Services 352,362 731,754 0.60 0.59 0.27 6 1.64 9.63
541 Professional, Scientifi c and Technical Services 350,899 728,785 0.60 0.59 0.27 6 1.65 9.65
5413 Architectural, Engineering, and Related Services 266,936 553,904 0.59 0.59 0.27 4 1.44 9.65
54131 Architectural Services 586 1,165 0.86 0.86 0.34 0 0.00 9.20
54133 Engineering Services 194,672 394,570 0.52 0.52 0.23 2 1.01 9.14
54134 Drafting Services 274 484 0.41 0.00 0.00 1 ** 0.00
54135 Building Inspection Services 252 474 0.00 0.00 0.00 0 0.00 0.00
54136 Geophysical Surveying and Mapping Services 8,397 27,720 1.10 1.09 0.48 1 7.21 10.23
54137 Surveying and Mapping (Except Geophysical) Services 9,128 19,804 0.78 0.78 0.38 0 0.00 12.29
54138 Testing Laboratories 35,900 75,048 0.79 0.79 0.44 0 0.00 11.87
5414 Specialized Design Services 283 655 0.31 0.31 0.00 0 0.00 0.00
5415 Computer Systems Design and Related Services 14,795 28,804 0.41 0.41 0.35 0 0.00 24.97
54151 Computer Systems Design and Related Services 14,778 28,771 0.41 0.41 0.35 0 0.00 24.97
541511 Custom Computer Programming Services 266 541 0.00 0.00 0.00 0 0.00 0.00
541512 Computer Systems Design Services 12,087 23,049† 0.43 0.43 0.40 0 0.00 29.37
5416 Management, Scientifi c and Technical Consulting Services 45,390 91,173 0.66 0.66 0.25 1 2.19 5.92
54161 Management Consulting Services 4,603 8,885 0.41 0.41 0.20 0 0.00 9.28
541611 Administrative Management and General Management Consulting Services 1,861 3,504 0.34 0.34 0.11 0 0.00 1.00
541614 Process, Physical Distribution, and Logistics Consulting Services 1,120 2,244 0.89 0.89 0.53 0 0.00 16.10
541618 Other Management Consulting Services 958 1,823 0.11 0.11 0.00 0 0.00 0.00
54162 Environmental Consulting Services 32,884 64,540 0.79 0.79 0.30 1 3.10 6.02 (5.33*)
54169 Other Scientifi c and Technical Consulting Services 7,162 16,505 0.32 0.32 0.12 0 0.00 3.31
5417 Scientifi c Research and Development Services 474 847 2.13 2.13 1.18 0 0.00 12.78
5419 Other Professional, Scientifi c and Technical Services 19,488 46,347 0.58 0.58 0.31 1 4.32 9.47
54199 All Other Professional, Scientifi c, and Technical Services 19,070 45,244 0.57 0.57 0.31 1 4.42 8.91
56 Administrative and Support and Waste Management and Remediation Services 419,560 820,116 2.72 2.71 1.72 11 2.68 13.92

Contractor Group Benchmarking Report, U.S., 2012 Data // All Industries, ComprehensiveISNetworld.com // Report No. 1302 16
Table 1: 2012 Injury and Illness Rates by NAICS CodeInjuries and Illnesses [b] Fatalities [c] Severity [d]
NAICS
Code[a] NAICS Title [a] Total Number of Employees
Total Number of Exposure
Hours(in 1,000s)
Total Recordable
Incident Rate (TRIR)
Nonfatal Total Recordable
Incident Rate (Nonfatal TRIR)
Days Away/ Restricted or Transfer Rate
(DART)
Total Number of Fatalities
Fatality Rate per 100,000
Workers
Incident Severity (In Days)
561 Administrative and Support Services 347,974 663,930 2.85 2.85 1.81 8 2.41 13.23
5612 Facilities Support Services 29,367 50,376 3.22 3.22 2.09 1 3.97 9.16
56121 Facilities Support Services 29,366 50,375 3.22 3.22 2.09 1 3.97 9.16
5613 Employment Services 24,720 46,239 0.67 0.67 0.34 0 0.00 18.34
56132 Temporary Help Services 24,275 45,370 0.68 0.68 0.35 0 0.00 18.34
5616 Investigation and Security Services 110,438 214,398 1.30 1.30 0.64 3 2.80 15.06
56161 Investigation, Guard, and Armored Car Services 96,434 186,885 1.26 1.25 0.60 2 2.14 16.24
561612 Security Guards and Patrol Services 96,427 186,869 1.26 1.25 0.60 2 2.14 16.24
56162 Security Systems Services 14,004 27,513 1.64 1.63 0.94 1 7.27 8.92
561621 Security Systems Services (Except Locksmiths) 13,757 27,022 1.62 1.61 0.95 1 7.40 8.91
561622 Locksmiths 149 298 1.34 1.34 0.67 0 0.00 12.00
5617 Services to Buildings and Dwellings 171,004 325,571 4.18 4.17 2.79 4 2.46 13.05
56171 Exterminating and Pest Control Services 26,309 53,454 7.14 7.13 3.94 2 7.48 14.54
56172 Janitorial Services 99,525 180,969 3.15 3.15 2.50 0 0.00 15.41
56173 Landscaping Services 41,939 84,643 4.63 4.63 2.77 2 4.73 7.62
56179 Other Services to Buildings and Dwellings 3,228 6,498 2.31 2.31 1.48 0 0.00 27.25 (23.95*)
5619 Other Support Services 11,254 23,515 2.39 2.39 1.51 0 0.00 17.15
56199 All Other Support Services 11,188 23,369 2.40 2.40 1.51 0 0.00 17.15
562 Waste Management and Remediation Services 71,507 156,078 2.15 2.15 1.32 3 3.84 17.79
5621 Waste Collection 25,466 60,003 2.69 2.69 1.71 1 3.33 21.86
56211 Waste Collection 24,987 59,283 2.65 2.65 1.72 1 3.37 22.13
562111 Solid Waste Collection 16,108 39,448† 2.35 2.34 1.46 1 5.07 30.49
562112 Hazardous Waste Collection 7,588 16,717 3.19 3.19 2.18 0 0.00 8.92 (7.40*)
562119 Other Waste Collection 577 1,490 2.42 2.42 1.61 0 0.00 25.50
5622 Waste Treatment and Disposal 6,672 14,674 1.89 1.89 1.12 0 0.00 22.23
56221 Waste Treatment and Disposal 6,652 14,622 1.90 1.90 1.12 0 0.00 22.23
562211 Hazardous Waste Treatment and Disposal 4,939 10,644† 1.82 1.82 1.09 0 0.00 26.08
562212 Solid Waste Landfi ll 1,030 2,388 1.93 1.93 1.09 0 0.00 9.78
562219 Other Nonhazardous Waste Treatment and Disposal 592 1,346 2.38 2.38 1.63 0 0.00 20.94
5629 Remediation and Other Waste Management Services 37,846 78,172 1.82 1.82 1.09 2 5.12 12.41
56291 Remediation Services 27,013 53,828 1.71 1.71 1.01 0 0.00 12.54

Contractor Group Benchmarking Report, U.S., 2012 Data // All Industries, ComprehensiveISNetworld.com // Report No. 1302 17
Table 1: 2012 Injury and Illness Rates by NAICS Code
[a] North American Industry Classifi cation System—United States, 2007. Totals for each NAICS code are based on all records classifi ed at a more disaggregated level and may include data for industries not shown separately. For example, calculations presented for two-digit NAICS codes will include all records with any of the three, four, fi ve and six-digit NAICS codes that are subsumed in the two-digit NAICS classifi cation.
[b] The injury and illness rates represent the number of injuries and illnesses per 100 full-time workers. See Appendix 2 on Incident Rate Calculations. [c] The fatality rate represents the number of fatalities per 100,000 full-time workers. See Appendix 2 on Fatality Rate Calculations.[d] The incident severity (in days) represents the number of days away from work per recordable incident. See Appendix 2 on Incident Severity (In Days) Calculations.
- Indicates that the data are suppressed because there are fewer than 10 contractors reporting for the cell.* Indicates that the difference between the rate computed using all valid records and that computed using only those records excluding the highest 0.5th percentile extreme values is greater than or equal to 10%. See sections 3 and 5 of Appendix 3 for more information.** Indicates that the reported fatality rate is greater than or equal to 100.† Indicates that the largest contractor in the corresponding NAICS Code contributes more than 70% of the Total Exposure Hours of all contractors in that NAICS Code.
Injuries and Illnesses [b] Fatalities [c] Severity [d]
NAICS
Code[a] NAICS Title [a] Total Number of Employees
Total Number of Exposure
Hours(in 1,000s)
Total Recordable
Incident Rate (TRIR)
Nonfatal Total Recordable
Incident Rate (Nonfatal TRIR)
Days Away/ Restricted or Transfer Rate
(DART)
Total Number of Fatalities
Fatality Rate per 100,000
Workers
Incident Severity (In Days)
56299 All Other Waste Management Services 10,456 23,595 2.04 2.03 1.24 2 16.95 12.55 (11.23*)
562991 Septic Tank and Related Services 2,149 5,225 4.02 3.98 2.76 1 38.28 12.94
562998 All Other Miscellaneous Waste Management Services 7,905 17,479 1.51 1.50 0.81 1 11.44 12.62 (10.18*)
61 Educational Services 2,406 3,971† 0.40 0.40 0.30 0 0.00 6.13
611 Educational Services 2,406 3,971† 0.40 0.40 0.30 0 0.00 6.13
62 Health Care and Social Assistance 2,749 6,029 0.53 0.53 0.13 0 0.00 2.94
621 Ambulatory Health Care Services 1,993 4,382 0.55 0.55 0.18 0 0.00 3.92
72 Accommodation and Food Services 14,683 33,308 1.53 1.53 0.64 0 0.00 13.76
722 Food Services and Drinking Places 14,301 32,491 1.51 1.51 0.62 0 0.00 13.97
7223 Special Food Services 14,243 32,406 1.50 1.50 0.61 0 0.00 14.07
72231 Food Service Contractors 12,823 28,447 1.67 1.67 0.67 0 0.00 13.64
81 Other Services (Except Public Administration) 180,409 360,767 2.26 2.26 1.32 4 2.22 11.32
811 Repair and Maintenance 142,794 294,975 1.96 1.96 1.09 3 2.03 10.97
8111 Automotive Repair and Maintenance 1,957 4,325 2.87 2.87 1.71 0 0.00 2.97
8112 Electronic and Precision Equipment Repair and Maintenance 5,031 10,073 1.43 1.43 0.85 0 0.00 14.94 (10.66*)
81121 Electronic and Precision Equipment Repair and Maintenance 4,999 10,004 1.42 1.42 0.86 0 0.00 15.15 (10.81*)
811212 Computer and Offi ce Machine Repair and Maintenance 1,119 2,260 0.80 0.80 0.62 0 0.00 22.67
811213 Communication Equipment Repair and Maintenance 1,284 2,655† 1.21 1.21 0.60 0 0.00 15.81
811219 Other Electronic and Precision Equipment Repair and Maintenance 2,426 4,719 1.78 1.78 1.14 0 0.00 14.74 (7.23*)
8113 Commercial and Industrial Machinery and Equipment (Except Automotive and Electronic) Repair and Maintenance 134,649 278,381 1.96 1.96 1.08 3 2.16 10.98
81131 Commercial and Industrial Machinery and Equipment (Except Automotive and Electronic) Repair and Maintenance 129,740 268,124 1.94 1.94 1.06 3 2.24 10.93
8114 Personal and Household Goods Repair and Maintenance 307 492 0.00 0.00 0.00 0 0.00 0.00
Contractor Group Benchmarking Report, U.S., 2012 Data // All Industries, ComprehensiveISNetworld.com // Report No. 1302 18
[a] North American Industry Classifi cation System—United States, 2007. Totals for each NAICS code are based on all records classifi ed at a more disaggregated level and may include data for industries not shown separately. For example, calculations presented for two-digit NAICS codes will include all records with any of the three, four, fi ve and six-digit NAICS codes that are subsumed in the two-digit NAICS classifi cation.
[b] The injury and illness rates represent the number of injuries and illnesses per 100 full-time workers. See Appendix 2 on Incident Rate Calculations. [c] The fatality rate represents the number of fatalities per 100,000 full-time workers. See Appendix 2 on Fatality Rate Calculations.[d] The incident severity (in days) represents the number of days away from work per recordable incident. See Appendix 2 on Incident Severity (In Days) Calculations.
- Indicates that the data are suppressed because there are fewer than 10 contractors reporting for the cell.* Indicates that the difference between the rate computed using all valid records and that computed using only those records excluding the highest 0.5th percentile extreme values is greater than or equal to 10%. See sections 3 and 5 of Appendix 3 for more information.** Indicates that the reported fatality rate is greater than or equal to 100.† Indicates that the largest contractor in the corresponding NAICS Code contributes more than 70% of the Total Exposure Hours of all contractors in that NAICS Code.
Table 1: 2012 Injury and Illness Rates by NAICS CodeInjuries and Illnesses [b] Fatalities [c] Severity [d]
NAICS
Code[a] NAICS Title [a] Total Number of Employees
Total Number of Exposure
Hours(in 1,000s)
Total Recordable
Incident Rate (TRIR)
Nonfatal Total Recordable
Incident Rate (Nonfatal TRIR)
Days Away/ Restricted or Transfer Rate
(DART)
Total Number of Fatalities
Fatality Rate per 100,000
Workers
Incident Severity (In Days)
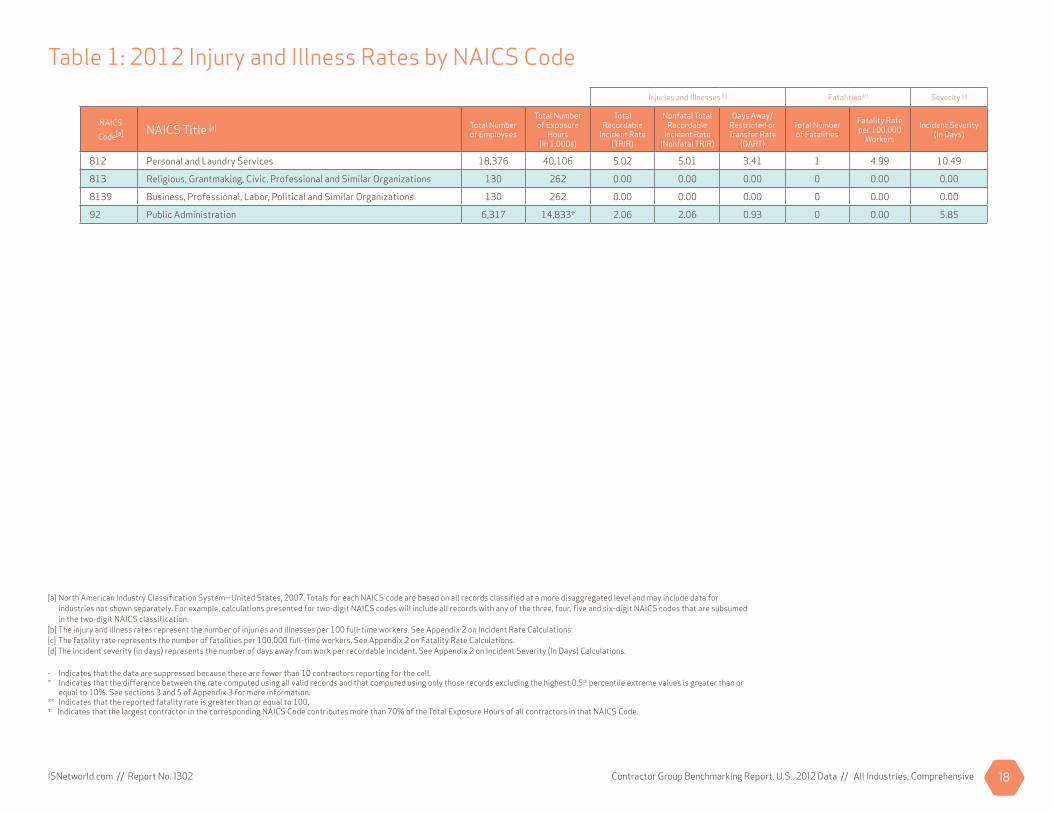
812 Personal and Laundry Services 18,376 40,106 5.02 5.01 3.41 1 4.99 10.49
813 Religious, Grantmaking, Civic, Professional and Similar Organizations 130 262 0.00 0.00 0.00 0 0.00 0.00
8139 Business, Professional, Labor, Political and Similar Organizations 130 262 0.00 0.00 0.00 0 0.00 0.00
92 Public Administration 6,317 14,833† 2.06 2.06 0.93 0 0.00 5.85
Contractor Group Benchmarking Report, U.S., 2012 Data // All Industries, ComprehensiveISNetworld.com // Report No. 1302 19
Table 22012 Injury and Illness Rates,
by ISN Work Type
Contractor Group Benchmarking Report, U.S., 2012 Data // All Industries, ComprehensiveISNetworld.com // Report No. 1302 20
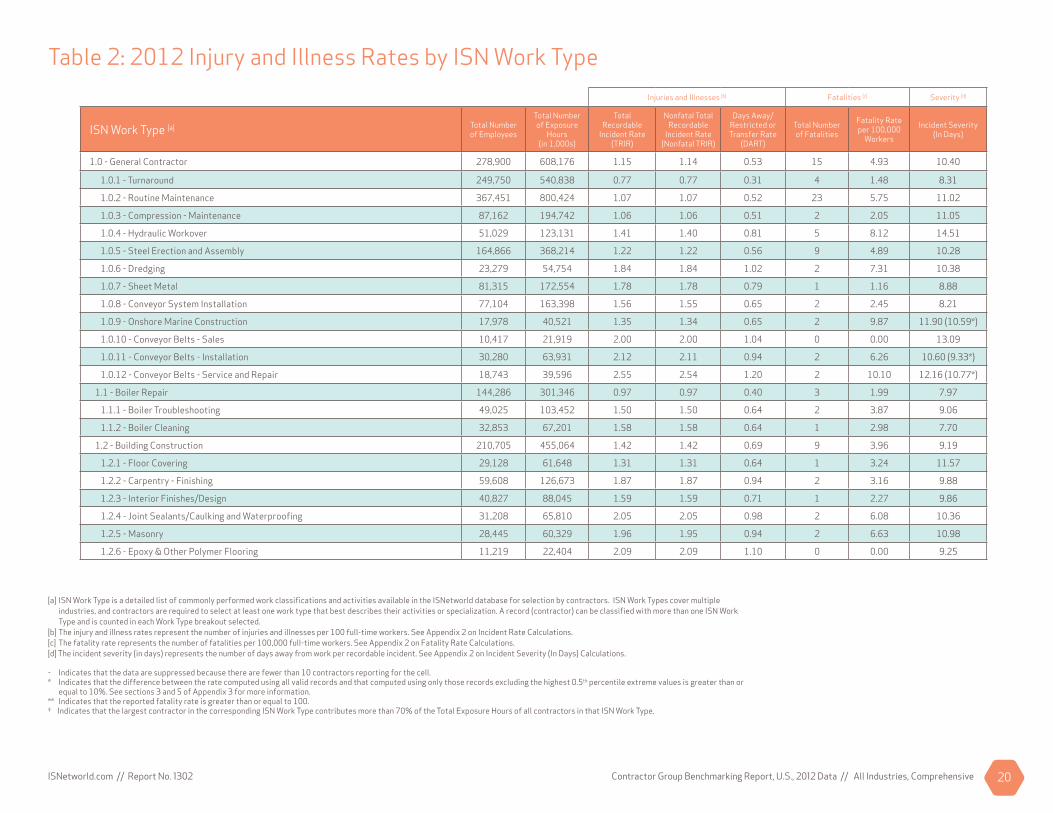
[a] ISN Work Type is a detailed list of commonly performed work classifi cations and activities available in the ISNetworld database for selection by contractors. ISN Work Types cover multiple industries, and contractors are required to select at least one work type that best describes their activities or specialization. A record (contractor) can be classifi ed with more than one ISN Work Type and is counted in each Work Type breakout selected.
[b] The injury and illness rates represent the number of injuries and illnesses per 100 full-time workers. See Appendix 2 on Incident Rate Calculations. [c] The fatality rate represents the number of fatalities per 100,000 full-time workers. See Appendix 2 on Fatality Rate Calculations.[d] The incident severity (in days) represents the number of days away from work per recordable incident. See Appendix 2 on Incident Severity (In Days) Calculations.
- Indicates that the data are suppressed because there are fewer than 10 contractors reporting for the cell.* Indicates that the difference between the rate computed using all valid records and that computed using only those records excluding the highest 0.5th percentile extreme values is greater than or equal to 10%. See sections 3 and 5 of Appendix 3 for more information.** Indicates that the reported fatality rate is greater than or equal to 100.† Indicates that the largest contractor in the corresponding ISN Work Type contributes more than 70% of the Total Exposure Hours of all contractors in that ISN Work Type.
Table 2: 2012 Injury and Illness Rates by ISN Work TypeInjuries and Illnesses [b] Fatalities [c] Severity [d]
ISN Work Type [a] Total Number of Employees
Total Number of Exposure
Hours(in 1,000s)
Total Recordable
Incident Rate (TRIR)
Nonfatal Total Recordable
Incident Rate (Nonfatal TRIR)
Days Away/ Restricted or Transfer Rate
(DART)
Total Number of Fatalities
Fatality Rate per 100,000
Workers
Incident Severity (In Days)
1.0 - General Contractor 278,900 608,176 1.15 1.14 0.53 15 4.93 10.40
1.0.1 - Turnaround 249,750 540,838 0.77 0.77 0.31 4 1.48 8.31
1.0.2 - Routine Maintenance 367,451 800,424 1.07 1.07 0.52 23 5.75 11.02
1.0.3 - Compression - Maintenance 87,162 194,742 1.06 1.06 0.51 2 2.05 11.05
1.0.4 - Hydraulic Workover 51,029 123,131 1.41 1.40 0.81 5 8.12 14.51
1.0.5 - Steel Erection and Assembly 164,866 368,214 1.22 1.22 0.56 9 4.89 10.28
1.0.6 - Dredging 23,279 54,754 1.84 1.84 1.02 2 7.31 10.38
1.0.7 - Sheet Metal 81,315 172,554 1.78 1.78 0.79 1 1.16 8.88
1.0.8 - Conveyor System Installation 77,104 163,398 1.56 1.55 0.65 2 2.45 8.21
1.0.9 - Onshore Marine Construction 17,978 40,521 1.35 1.34 0.65 2 9.87 11.90 (10.59*)
1.0.10 - Conveyor Belts - Sales 10,417 21,919 2.00 2.00 1.04 0 0.00 13.09
1.0.11 - Conveyor Belts - Installation 30,280 63,931 2.12 2.11 0.94 2 6.26 10.60 (9.33*)
1.0.12 - Conveyor Belts - Service and Repair 18,743 39,596 2.55 2.54 1.20 2 10.10 12.16 (10.77*)
1.1 - Boiler Repair 144,286 301,346 0.97 0.97 0.40 3 1.99 7.97
1.1.1 - Boiler Troubleshooting 49,025 103,452 1.50 1.50 0.64 2 3.87 9.06
1.1.2 - Boiler Cleaning 32,853 67,201 1.58 1.58 0.64 1 2.98 7.70
1.2 - Building Construction 210,705 455,064 1.42 1.42 0.69 9 3.96 9.19
1.2.1 - Floor Covering 29,128 61,648 1.31 1.31 0.64 1 3.24 11.57
1.2.2 - Carpentry - Finishing 59,608 126,673 1.87 1.87 0.94 2 3.16 9.88
1.2.3 - Interior Finishes/Design 40,827 88,045 1.59 1.59 0.71 1 2.27 9.86
1.2.4 - Joint Sealants/Caulking and Waterproofi ng 31,208 65,810 2.05 2.05 0.98 2 6.08 10.36
1.2.5 - Masonry 28,445 60,329 1.96 1.95 0.94 2 6.63 10.98
1.2.6 - Epoxy & Other Polymer Flooring 11,219 22,404 2.09 2.09 1.10 0 0.00 9.25
Contractor Group Benchmarking Report, U.S., 2012 Data // All Industries, ComprehensiveISNetworld.com // Report No. 1302 21
Table 2: 2012 Injury and Illness Rates by ISN Work TypeInjuries and Illnesses [b] Fatalities [c] Severity [d]
ISN Work Type [a] Total Number of Employees
Total Number of Exposure
Hours(in 1,000s)
Total Recordable
Incident Rate (TRIR)
Nonfatal Total Recordable
Incident Rate (Nonfatal TRIR)
Days Away/ Restricted or Transfer Rate
(DART)
Total Number of Fatalities
Fatality Rate per 100,000
Workers
Incident Severity (In Days)
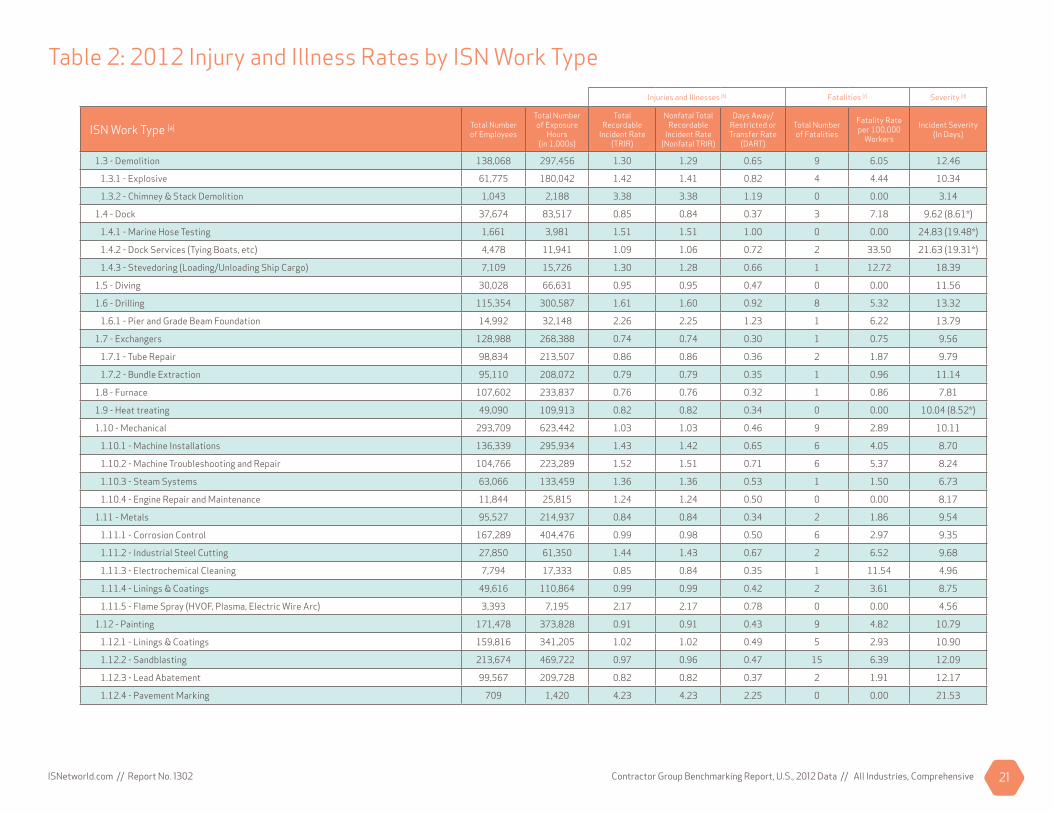
1.3 - Demolition 138,068 297,456 1.30 1.29 0.65 9 6.05 12.46
1.3.1 - Explosive 61,775 180,042 1.42 1.41 0.82 4 4.44 10.34
1.3.2 - Chimney & Stack Demolition 1,043 2,188 3.38 3.38 1.19 0 0.00 3.14
1.4 - Dock 37,674 83,517 0.85 0.84 0.37 3 7.18 9.62 (8.61*)
1.4.1 - Marine Hose Testing 1,661 3,981 1.51 1.51 1.00 0 0.00 24.83 (19.48*)
1.4.2 - Dock Services (Tying Boats, etc) 4,478 11,941 1.09 1.06 0.72 2 33.50 21.63 (19.31*)
1.4.3 - Stevedoring (Loading/Unloading Ship Cargo) 7,109 15,726 1.30 1.28 0.66 1 12.72 18.39
1.5 - Diving 30,028 66,631 0.95 0.95 0.47 0 0.00 11.56
1.6 - Drilling 115,354 300,587 1.61 1.60 0.92 8 5.32 13.32
1.6.1 - Pier and Grade Beam Foundation 14,992 32,148 2.26 2.25 1.23 1 6.22 13.79
1.7 - Exchangers 128,988 268,388 0.74 0.74 0.30 1 0.75 9.56
1.7.1 - Tube Repair 98,834 213,507 0.86 0.86 0.36 2 1.87 9.79
1.7.2 - Bundle Extraction 95,110 208,072 0.79 0.79 0.35 1 0.96 11.14
1.8 - Furnace 107,602 233,837 0.76 0.76 0.32 1 0.86 7.81
1.9 - Heat treating 49,090 109,913 0.82 0.82 0.34 0 0.00 10.04 (8.52*)
1.10 - Mechanical 293,709 623,442 1.03 1.03 0.46 9 2.89 10.11
1.10.1 - Machine Installations 136,339 295,934 1.43 1.42 0.65 6 4.05 8.70
1.10.2 - Machine Troubleshooting and Repair 104,766 223,289 1.52 1.51 0.71 6 5.37 8.24
1.10.3 - Steam Systems 63,066 133,459 1.36 1.36 0.53 1 1.50 6.73
1.10.4 - Engine Repair and Maintenance 11,844 25,815 1.24 1.24 0.50 0 0.00 8.17
1.11 - Metals 95,527 214,937 0.84 0.84 0.34 2 1.86 9.54
1.11.1 - Corrosion Control 167,289 404,476 0.99 0.98 0.50 6 2.97 9.35
1.11.2 - Industrial Steel Cutting 27,850 61,350 1.44 1.43 0.67 2 6.52 9.68
1.11.3 - Electrochemical Cleaning 7,794 17,333 0.85 0.84 0.35 1 11.54 4.96
1.11.4 - Linings & Coatings 49,616 110,864 0.99 0.99 0.42 2 3.61 8.75
1.11.5 - Flame Spray (HVOF, Plasma, Electric Wire Arc) 3,393 7,195 2.17 2.17 0.78 0 0.00 4.56
1.12 - Painting 171,478 373,828 0.91 0.91 0.43 9 4.82 10.79
1.12.1 - Linings & Coatings 159,816 341,205 1.02 1.02 0.49 5 2.93 10.90
1.12.2 - Sandblasting 213,674 469,722 0.97 0.96 0.47 15 6.39 12.09
1.12.3 - Lead Abatement 99,567 209,728 0.82 0.82 0.37 2 1.91 12.17
1.12.4 - Pavement Marking 709 1,420 4.23 4.23 2.25 0 0.00 21.53
Contractor Group Benchmarking Report, U.S., 2012 Data // All Industries, ComprehensiveISNetworld.com // Report No. 1302 22
Table 2: 2012 Injury and Illness Rates by ISN Work TypeInjuries and Illnesses [b] Fatalities [c] Severity [d]
ISN Work Type [a] Total Number of Employees
Total Number of Exposure
Hours(in 1,000s)
Total Recordable
Incident Rate (TRIR)
Nonfatal Total Recordable
Incident Rate (Nonfatal TRIR)
Days Away/ Restricted or Transfer Rate
(DART)
Total Number of Fatalities
Fatality Rate per 100,000
Workers
Incident Severity (In Days)
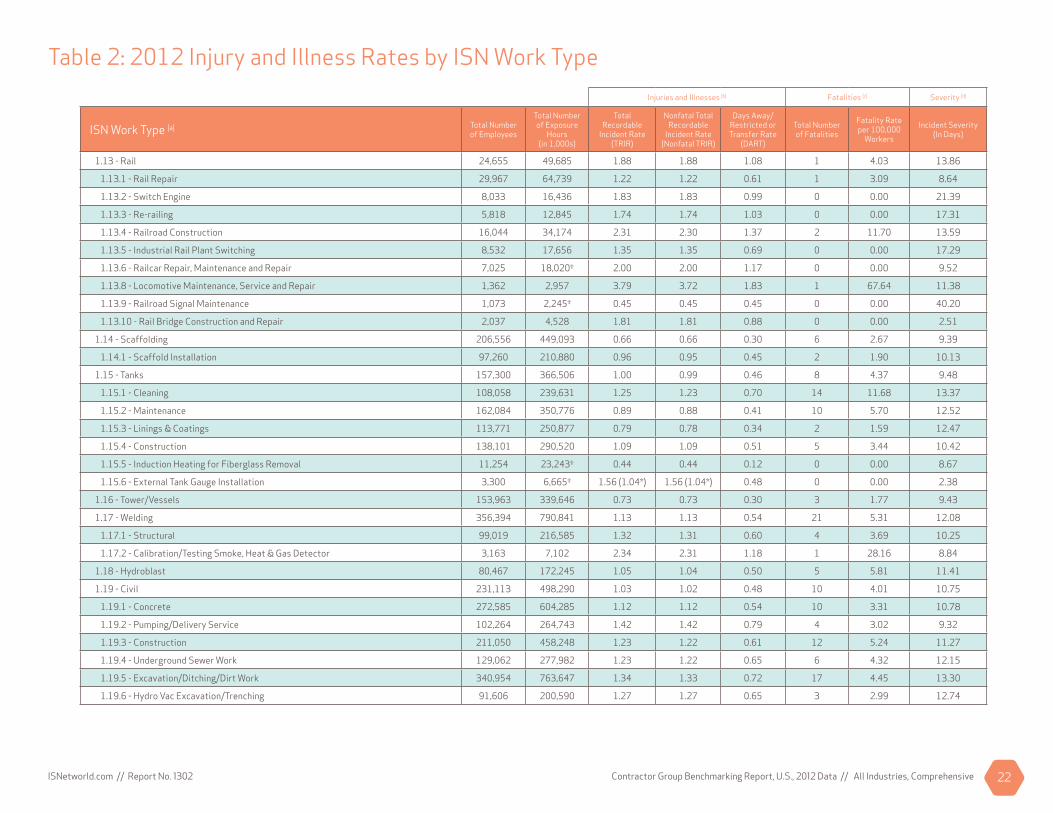
1.13 - Rail 24,655 49,685 1.88 1.88 1.08 1 4.03 13.86
1.13.1 - Rail Repair 29,967 64,739 1.22 1.22 0.61 1 3.09 8.64
1.13.2 - Switch Engine 8,033 16,436 1.83 1.83 0.99 0 0.00 21.39
1.13.3 - Re-railing 5,818 12,845 1.74 1.74 1.03 0 0.00 17.31
1.13.4 - Railroad Construction 16,044 34,174 2.31 2.30 1.37 2 11.70 13.59
1.13.5 - Industrial Rail Plant Switching 8,532 17,656 1.35 1.35 0.69 0 0.00 17.29
1.13.6 - Railcar Repair, Maintenance and Repair 7,025 18,020† 2.00 2.00 1.17 0 0.00 9.52
1.13.8 - Locomotive Maintenance, Service and Repair 1,362 2,957 3.79 3.72 1.83 1 67.64 11.38
1.13.9 - Railroad Signal Maintenance 1,073 2,245† 0.45 0.45 0.45 0 0.00 40.20
1.13.10 - Rail Bridge Construction and Repair 2,037 4,528 1.81 1.81 0.88 0 0.00 2.51
1.14 - Scaffolding 206,556 449,093 0.66 0.66 0.30 6 2.67 9.39
1.14.1 - Scaffold Installation 97,260 210,880 0.96 0.95 0.45 2 1.90 10.13
1.15 - Tanks 157,300 366,506 1.00 0.99 0.46 8 4.37 9.48
1.15.1 - Cleaning 108,058 239,631 1.25 1.23 0.70 14 11.68 13.37
1.15.2 - Maintenance 162,084 350,776 0.89 0.88 0.41 10 5.70 12.52
1.15.3 - Linings & Coatings 113,771 250,877 0.79 0.78 0.34 2 1.59 12.47
1.15.4 - Construction 138,101 290,520 1.09 1.09 0.51 5 3.44 10.42
1.15.5 - Induction Heating for Fiberglass Removal 11,254 23,243† 0.44 0.44 0.12 0 0.00 8.67
1.15.6 - External Tank Gauge Installation 3,300 6,665† 1.56 (1.04*) 1.56 (1.04*) 0.48 0 0.00 2.38
1.16 - Tower/Vessels 153,963 339,646 0.73 0.73 0.30 3 1.77 9.43
1.17 - Welding 356,394 790,841 1.13 1.13 0.54 21 5.31 12.08
1.17.1 - Structural 99,019 216,585 1.32 1.31 0.60 4 3.69 10.25
1.17.2 - Calibration/Testing Smoke, Heat & Gas Detector 3,163 7,102 2.34 2.31 1.18 1 28.16 8.84
1.18 - Hydroblast 80,467 172,245 1.05 1.04 0.50 5 5.81 11.41
1.19 - Civil 231,113 498,290 1.03 1.02 0.48 10 4.01 10.75
1.19.1 - Concrete 272,585 604,285 1.12 1.12 0.54 10 3.31 10.78
1.19.2 - Pumping/Delivery Service 102,264 264,743 1.42 1.42 0.79 4 3.02 9.32
1.19.3 - Construction 211,050 458,248 1.23 1.22 0.61 12 5.24 11.27
1.19.4 - Underground Sewer Work 129,062 277,982 1.23 1.22 0.65 6 4.32 12.15
1.19.5 - Excavation/Ditching/Dirt Work 340,954 763,647 1.34 1.33 0.72 17 4.45 13.30
1.19.6 - Hydro Vac Excavation/Trenching 91,606 200,590 1.27 1.27 0.65 3 2.99 12.74

Contractor Group Benchmarking Report, U.S., 2012 Data // All Industries, ComprehensiveISNetworld.com // Report No. 1302 23
Table 2: 2012 Injury and Illness Rates by ISN Work TypeInjuries and Illnesses [b] Fatalities [c] Severity [d]
ISN Work Type [a] Total Number of Employees
Total Number of Exposure
Hours(in 1,000s)
Total Recordable
Incident Rate (TRIR)
Nonfatal Total Recordable
Incident Rate (Nonfatal TRIR)
Days Away/ Restricted or Transfer Rate
(DART)
Total Number of Fatalities
Fatality Rate per 100,000
Workers
Incident Severity (In Days)
1.19.7 - Boring 72,642 161,272 1.58 1.57 0.89 6 7.44 14.35
1.19.8 - Precast Concrete 41,465 86,185 1.89 1.89 1.03 1 2.32 12.95
1.19.9 - Air Vac Excavation/Trenching 27,486 59,350 1.71 1.70 0.95 2 6.74 10.36
1.19.10 - Concrete Cutting 11,870 25,037 1.25 1.25 0.48 0 0.00 10.89
1.19.11 - Concrete Core Drilling/Boring 1,569 3,249 1.91 1.91 0.92 (0.81*) 0 0.00 27.68 (21.40*)
1.20 - Cooling Tower 107,217 228,226 1.16 1.16 0.50 4 3.51 9.78
1.21 - Flare Repairs 75,643 170,099 0.63 0.63 0.27 1 1.18 9.38
1.22 - Precipitator 61,601 128,983 0.97 0.97 0.38 2 3.10 8.02
1.23 - Industrial Cleaning 55,477 117,611 1.65 1.64 1.06 4 6.80 9.69
1.23.1 - Steam/Hydroblast Cleaning 36,182 78,489 1.53 1.52 0.88 4 10.19 11.95
1.23.2 - Cleaning Using Explosives 3,819 8,252 0.75 0.75 0.41 0 0.00 14.58
1.23.3 - Overhead Cleaning 5,063 9,503 1.81 1.81 0.93 0 0.00 11.65 (9.67*)
1.23.4 - Dust Collection System 9,962 22,320 1.89 1.89 0.76 0 0.00 7.28
1.23.5 - Industrial Oven Cleaning 3,215 7,013 1.60 1.57 0.66 1 28.52 3.13
1.23.6 - CO2/Dry Blast Cleaning 7,681 16,070 1.36 1.36 0.75 0 0.00 5.87
1.23.7 - Food Process Sanitation 12,328 22,736† 4.42 4.42 3.40 0 0.00 4.28
1.24 - Pipeline Construction/Maintenance 282,654 632,303 1.15 1.14 0.57 20 6.33 13.11
1.24.1 - Coatings Repair 139,277 303,345 0.97 0.97 0.44 6 3.96 10.31
1.24.2 - Pipeline/Internal HDPE Lining (including installation) 41,336 94,251 1.70 1.69 0.83 4 8.49 10.95
1.24.3 - Case Cutting 36,267 80,049 1.37 1.37 0.68 2 5.00 13.40
1.24.4 - General Contractor - DOT Covered Tasks 146,413 333,912 1.37 1.36 0.69 15 8.98 12.15
1.24.5 - Install Liners 21,136 45,750 1.65 1.64 0.86 2 8.74 11.29
1.24.6 - Piggable Pressure Isolation 3,561 7,906 1.77 1.75 0.94 1 25.30 13.61
1.24.7 - Dewatering Service 1,835 3,373 2.96 2.96 1.48 0 0.00 8.70
1.24.8 - Meter Skids 8,977 19,814 1.16 1.16 0.41 0 0.00 1.91
1.24.9 - Pipe Thread Inspection 1,371 2,680 1.34 1.34 0.97 0 0.00 9.28
1.25 - Steaming/Hot Oiler 12,231 26,618 1.13 1.13 0.56 0 0.00 13.47
1.26 - Line Locating 80,624 180,120 1.34 1.34 0.64 4 4.44 11.47
1.27 - Pumping Services 89,831 248,992 1.58 1.57 0.89 7 5.62 10.10
1.27.1 - Lease Operator/Pumper 22,862 69,858† 1.56 1.56 0.88 1 2.86 8.03
1.27.2 - Water Transfer 12,057 27,641 2.00 1.98 1.19 2 14.47 10.92

Contractor Group Benchmarking Report, U.S., 2012 Data // All Industries, ComprehensiveISNetworld.com // Report No. 1302 24
Table 2: 2012 Injury and Illness Rates by ISN Work TypeInjuries and Illnesses [b] Fatalities [c] Severity [d]
ISN Work Type [a] Total Number of Employees
Total Number of Exposure
Hours(in 1,000s)
Total Recordable
Incident Rate (TRIR)
Nonfatal Total Recordable
Incident Rate (Nonfatal TRIR)
Days Away/ Restricted or Transfer Rate
(DART)
Total Number of Fatalities
Fatality Rate per 100,000
Workers
Incident Severity (In Days)
1.27.3 - Pump Supply and Repair 17,116 36,424 1.80 1.80 0.87 1 5.49 6.21
1.28 - Nitrogen 33,394 88,615 1.52 1.52 0.81 0 0.00 9.91
1.28.1 - Nitrogen - Industrial 8,866 18,618 1.17 1.17 0.50 0 0.00 25.90
1.28.2 - Nitrogen - Pipeline 12,660 27,161 1.63 1.63 1.00 0 0.00 27.62
1.28.3 - Nitrogen - Oilfi eld 17,929 37,133 1.48 1.47 0.82 1 5.39 20.08
1.28.4 - Oxygen 2,493 5,461 1.14 1.14 0.40 0 0.00 7.58 (0.47*)
1.28.5 - Oxygen - Industrial 3,180 6,765 1.33 1.33 0.35 0 0.00 5.18 (0.27*)
1.28.6 - Oxygen - Pipeline 6,709 14,219 1.34 1.34 0.53 0 0.00 11.60 (9.37*)
1.28.7 - Oxygen - Oilfi eld 1,143 2,409 2.41 2.41 0.66 0 0.00 13.45
1.29 - Piling 96,156 206,905 1.16 1.16 0.57 7 6.77 11.01
1.29.1 - Deep Foundation 23,659 48,770 2.06 2.06 1.11 1 4.10 10.97
1.30 - Right-of-Way 67,103 148,460 1.19 1.18 0.58 2 2.69 10.19
1.30.1 - Acquisition & Land Rights 33,115 69,943 0.65 0.65 0.31 0 0.00 6.16
1.31 - Degassing & Vapor Control 10,318 23,308 1.10 1.10 0.38 0 0.00 8.64
1.32 - Rigging 200,489 481,860 1.21 1.20 0.61 6 2.49 9.54
1.33 - Electrical 154,468 330,274 1.29 1.29 0.58 12 7.27 10.57
1.33.1 - Plant Wiring 110,540 240,098 1.22 1.22 0.54 7 5.83 10.54
1.33.2 - Machine Wiring 107,054 229,858 1.16 1.16 0.52 7 6.09 9.49
1.33.3 - Electrical Trouble Shooting 111,729 240,588 1.29 1.28 0.58 6 4.99 10.58
1.33.4 - Voice Data Wiring 38,096 80,187 1.85 1.85 0.87 2 4.99 12.68
1.33.5 - Lighting Installation and Repair 89,125 194,417 1.24 1.23 0.57 5 5.14 11.85
1.33.6 - Industrial 111,647 240,042 1.15 1.14 0.50 9 7.50 9.92
1.33.7 - Energized Electrical Equipment Cleaning 19,694 42,647 2.05 2.05 0.90 1 4.69 11.37
1.33.8 - Overhead Utility Services 53,018 115,653 1.99 1.98 0.95 4 6.92 14.96
1.33.9 - Underground Utility Services 60,602 132,412 1.97 1.96 0.97 5 7.55 14.36
1.34 - Iron Work 47,278 102,617 1.55 1.55 0.69 2 3.90 8.87 (7.76*)
1.35 - Water Well Services 10,272 22,346 1.46 1.45 0.72 1 8.95 14.57 (12.25*)
1.35.1 - Water Well Drilling 5,744 12,709 2.38 2.36 1.43 1 15.74 19.70
1.35.2 - Water Well Pumps 5,141 12,363 2.64 2.62 1.65 1 16.18 13.38 (11.29*)
1.36 - Engineering Procurement and Construction (EPC) 33,923 70,872 1.09 1.09 0.51 1 2.82 9.77
1.37 - General Contractor - Ammonia Refrigeration 1,627 3,348 1.79 1.79 1.31 0 0.00 15.73

Contractor Group Benchmarking Report, U.S., 2012 Data // All Industries, ComprehensiveISNetworld.com // Report No. 1302 25
Table 2: 2012 Injury and Illness Rates by ISN Work TypeInjuries and Illnesses [b] Fatalities [c] Severity [d]
ISN Work Type [a] Total Number of Employees
Total Number of Exposure
Hours(in 1,000s)
Total Recordable
Incident Rate (TRIR)
Nonfatal Total Recordable
Incident Rate (Nonfatal TRIR)
Days Away/ Restricted or Transfer Rate
(DART)
Total Number of Fatalities
Fatality Rate per 100,000
Workers
Incident Severity (In Days)
1.37.1 - Ammonia Refrigeration - Installation 1,804 3,704 2.00 2.00 1.24 0 0.00 12.76
1.37.2 - Ammonia Refrigeration - Maintenance/Repair 1,858 3,835 1.77 1.77 1.15 0 0.00 13.88
1.38 - General Contractor - Working in Tunnels 1,584 3,283 2.68 2.68 1.34 0 0.00 11.48
1.39 - General Contractor - Fabrication 7,442 16,235 2.35 2.35 1.23 0 0.00 9.06
1.40 - General Contractor - Chimney & Stack Construction & Maintenance 1,180 2,635 3.26 3.26 1.67 0 0.00 9.58
1.41 - General Contractor - Specialized Rigging and Lifting (Without Use of Cranes) 4,462 9,283 2.43 2.43 1.25 0 0.00 8.36
2.0 - Machining 72,243 160,576 1.53 1.53 0.70 2 2.49 9.60
2.1 - Bolting 102,495 219,943 0.85 0.85 0.33 1 0.91 7.97
2.2 - Field 74,352 162,074 1.00 1.00 0.41 1 1.23 8.74
2.3 - Hot Tap 82,187 184,770 0.90 0.90 0.39 3 3.25 9.87 (8.25*)
2.4 - Leak Repair 52,166 116,508 1.33 1.33 0.62 3 5.15 10.88 (9.56*)
2.4.1 - Metal Stitching, Casting Repair and Thread Repair 6,235 13,332 2.04 2.04 1.05 0 0.00 7.26
2.5 - Compressor/Turbine 56,674 126,000 1.24 1.24 0.52 0 0.00 10.68
2.6 - Valve Repair 84,261 185,884 1.37 1.37 0.61 0 0.00 8.11
2.6.1 - Control 60,529 132,318 1.18 1.18 0.55 1 1.51 8.73
2.6.2 - Safety/Relief 50,049 109,651 1.25 1.25 0.57 0 0.00 9.14
2.6.3 - Inspection & Testing 24,788 54,542 1.52 1.51 0.70 1 3.67 8.91 (7.91*)
2.7 - Cold Cutting 69,295 154,131 1.01 1.00 0.48 1 1.30 11.65
2.8 - Pumps & Blowers 55,008 119,105 1.57 1.56 0.73 2 3.36 9.40
2.9 - Inplace Boring of Machine Sideframes 7,769 16,762 1.92 1.92 0.89 0 0.00 11.57
2.10 - Onsite Machine Shop Work 22,027 49,405 1.79 1.79 0.89 2 8.10 9.60
3.0 - Instrumentation & Electrical 212,468 462,366 1.04 1.04 0.45 6 2.60 9.58
3.1 - Analyzers 93,921 200,283 1.00 1.00 0.46 3 3.00 9.88
3.2 - Electric 192,603 415,918 1.16 1.16 0.53 10 4.81 11.40
3.2.1 - Batteries 142,520 306,807 1.03 1.02 0.49 8 5.22 10.28
3.2.2 - Generator 240,329 508,191 1.28 1.28 0.66 17 6.69 10.88
3.2.3 - Motors 170,180 366,862 1.25 1.24 0.61 9 4.91 10.28
3.2.4 - Motor Operated Valve 156,726 338,157 1.04 1.04 0.50 6 3.55 10.20
3.2.5 - Program Logic Control 158,613 343,801 1.08 1.07 0.51 6 3.49 9.89
3.2.6 - Polelines 89,492 190,329 1.26 1.25 0.61 8 8.41 11.87
3.2.7 - Precipitator 59,565 128,918 1.06 1.05 0.52 2 3.10 11.44
Contractor Group Benchmarking Report, U.S., 2012 Data // All Industries, ComprehensiveISNetworld.com // Report No. 1302 26
Table 2: 2012 Injury and Illness Rates by ISN Work TypeInjuries and Illnesses [b] Fatalities [c] Severity [d]
ISN Work Type [a] Total Number of Employees
Total Number of Exposure
Hours(in 1,000s)
Total Recordable
Incident Rate (TRIR)
Nonfatal Total Recordable
Incident Rate (Nonfatal TRIR)
Days Away/ Restricted or Transfer Rate
(DART)
Total Number of Fatalities
Fatality Rate per 100,000
Workers
Incident Severity (In Days)
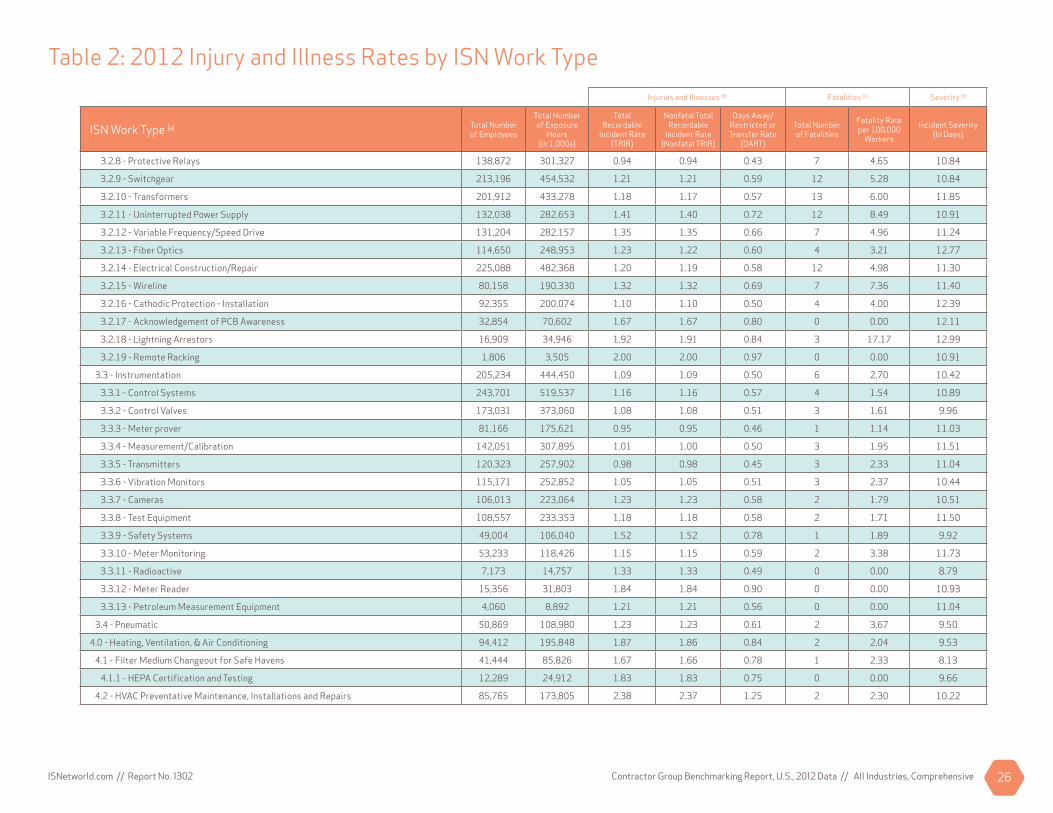
3.2.8 - Protective Relays 138,872 301,327 0.94 0.94 0.43 7 4.65 10.84
3.2.9 - Switchgear 213,196 454,532 1.21 1.21 0.59 12 5.28 10.84
3.2.10 - Transformers 201,912 433,278 1.18 1.17 0.57 13 6.00 11.85
3.2.11 - Uninterrupted Power Supply 132,038 282,653 1.41 1.40 0.72 12 8.49 10.91
3.2.12 - Variable Frequency/Speed Drive 131,204 282,157 1.35 1.35 0.66 7 4.96 11.24
3.2.13 - Fiber Optics 114,650 248,953 1.23 1.22 0.60 4 3.21 12.77
3.2.14 - Electrical Construction/Repair 225,088 482,368 1.20 1.19 0.58 12 4.98 11.30
3.2.15 - Wireline 80,158 190,330 1.32 1.32 0.69 7 7.36 11.40
3.2.16 - Cathodic Protection - Installation 92,355 200,074 1.10 1.10 0.50 4 4.00 12.39
3.2.17 - Acknowledgement of PCB Awareness 32,854 70,602 1.67 1.67 0.80 0 0.00 12.11
3.2.18 - Lightning Arrestors 16,909 34,946 1.92 1.91 0.84 3 17.17 12.99
3.2.19 - Remote Racking 1,806 3,505 2.00 2.00 0.97 0 0.00 10.91
3.3 - Instrumentation 205,234 444,450 1.09 1.09 0.50 6 2.70 10.42
3.3.1 - Control Systems 243,701 519,537 1.16 1.16 0.57 4 1.54 10.89
3.3.2 - Control Valves 173,031 373,060 1.08 1.08 0.51 3 1.61 9.96
3.3.3 - Meter prover 81,166 175,621 0.95 0.95 0.46 1 1.14 11.03
3.3.4 - Measurement/Calibration 142,051 307,895 1.01 1.00 0.50 3 1.95 11.51
3.3.5 - Transmitters 120,323 257,902 0.98 0.98 0.45 3 2.33 11.04
3.3.6 - Vibration Monitors 115,171 252,852 1.05 1.05 0.51 3 2.37 10.44
3.3.7 - Cameras 106,013 223,064 1.23 1.23 0.58 2 1.79 10.51
3.3.8 - Test Equipment 108,557 233,353 1.18 1.18 0.58 2 1.71 11.50
3.3.9 - Safety Systems 49,004 106,040 1.52 1.52 0.78 1 1.89 9.92
3.3.10 - Meter Monitoring 53,233 118,426 1.15 1.15 0.59 2 3.38 11.73
3.3.11 - Radioactive 7,173 14,757 1.33 1.33 0.49 0 0.00 8.79
3.3.12 - Meter Reader 15,356 31,803 1.84 1.84 0.90 0 0.00 10.93
3.3.13 - Petroleum Measurement Equipment 4,060 8,892 1.21 1.21 0.56 0 0.00 11.04
3.4 - Pneumatic 50,869 108,980 1.23 1.23 0.61 2 3.67 9.50
4.0 - Heating, Ventilation, & Air Conditioning 94,412 195,848 1.87 1.86 0.84 2 2.04 9.53
4.1 - Filter Medium Changeout for Safe Havens 41,444 85,826 1.67 1.66 0.78 1 2.33 8.13
4.1.1 - HEPA Certifi cation and Testing 12,289 24,912 1.83 1.83 0.75 0 0.00 9.66
4.2 - HVAC Preventative Maintenance, Installations and Repairs 85,765 173,805 2.38 2.37 1.25 2 2.30 10.22
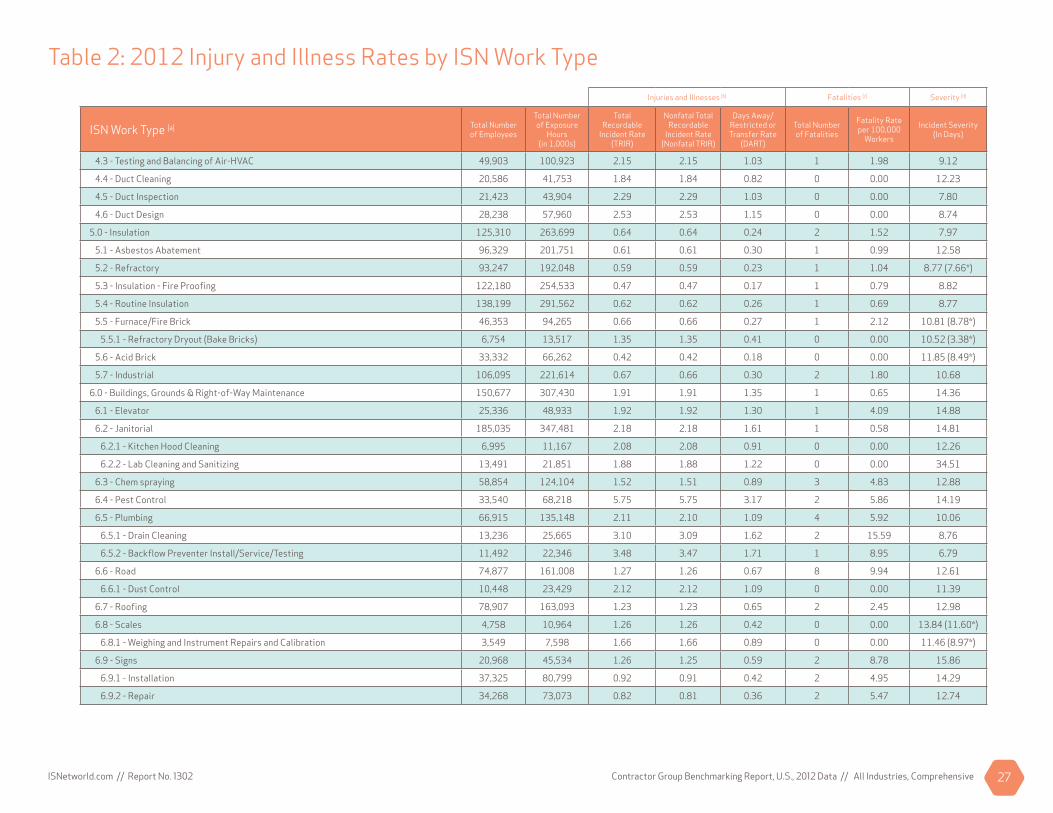
Contractor Group Benchmarking Report, U.S., 2012 Data // All Industries, ComprehensiveISNetworld.com // Report No. 1302 27
Table 2: 2012 Injury and Illness Rates by ISN Work TypeInjuries and Illnesses [b] Fatalities [c] Severity [d]
ISN Work Type [a] Total Number of Employees
Total Number of Exposure
Hours(in 1,000s)
Total Recordable
Incident Rate (TRIR)
Nonfatal Total Recordable
Incident Rate (Nonfatal TRIR)
Days Away/ Restricted or Transfer Rate
(DART)
Total Number of Fatalities
Fatality Rate per 100,000
Workers
Incident Severity (In Days)
4.3 - Testing and Balancing of Air-HVAC 49,903 100,923 2.15 2.15 1.03 1 1.98 9.12
4.4 - Duct Cleaning 20,586 41,753 1.84 1.84 0.82 0 0.00 12.23
4.5 - Duct Inspection 21,423 43,904 2.29 2.29 1.03 0 0.00 7.80
4.6 - Duct Design 28,238 57,960 2.53 2.53 1.15 0 0.00 8.74
5.0 - Insulation 125,310 263,699 0.64 0.64 0.24 2 1.52 7.97
5.1 - Asbestos Abatement 96,329 201,751 0.61 0.61 0.30 1 0.99 12.58
5.2 - Refractory 93,247 192,048 0.59 0.59 0.23 1 1.04 8.77 (7.66*)
5.3 - Insulation - Fire Proofi ng 122,180 254,533 0.47 0.47 0.17 1 0.79 8.82
5.4 - Routine Insulation 138,199 291,562 0.62 0.62 0.26 1 0.69 8.77
5.5 - Furnace/Fire Brick 46,353 94,265 0.66 0.66 0.27 1 2.12 10.81 (8.78*)
5.5.1 - Refractory Dryout (Bake Bricks) 6,754 13,517 1.35 1.35 0.41 0 0.00 10.52 (3.38*)
5.6 - Acid Brick 33,332 66,262 0.42 0.42 0.18 0 0.00 11.85 (8.49*)
5.7 - Industrial 106,095 221,614 0.67 0.66 0.30 2 1.80 10.68
6.0 - Buildings, Grounds & Right-of-Way Maintenance 150,677 307,430 1.91 1.91 1.35 1 0.65 14.36
6.1 - Elevator 25,336 48,933 1.92 1.92 1.30 1 4.09 14.88
6.2 - Janitorial 185,035 347,481 2.18 2.18 1.61 1 0.58 14.81
6.2.1 - Kitchen Hood Cleaning 6,995 11,167 2.08 2.08 0.91 0 0.00 12.26
6.2.2 - Lab Cleaning and Sanitizing 13,491 21,851 1.88 1.88 1.22 0 0.00 34.51
6.3 - Chem spraying 58,854 124,104 1.52 1.51 0.89 3 4.83 12.88
6.4 - Pest Control 33,540 68,218 5.75 5.75 3.17 2 5.86 14.19
6.5 - Plumbing 66,915 135,148 2.11 2.10 1.09 4 5.92 10.06
6.5.1 - Drain Cleaning 13,236 25,665 3.10 3.09 1.62 2 15.59 8.76
6.5.2 - Backfl ow Preventer Install/Service/Testing 11,492 22,346 3.48 3.47 1.71 1 8.95 6.79
6.6 - Road 74,877 161,008 1.27 1.26 0.67 8 9.94 12.61
6.6.1 - Dust Control 10,448 23,429 2.12 2.12 1.09 0 0.00 11.39
6.7 - Roofi ng 78,907 163,093 1.23 1.23 0.65 2 2.45 12.98
6.8 - Scales 4,758 10,964 1.26 1.26 0.42 0 0.00 13.84 (11.60*)
6.8.1 - Weighing and Instrument Repairs and Calibration 3,549 7,598 1.66 1.66 0.89 0 0.00 11.46 (8.97*)
6.9 - Signs 20,968 45,534 1.26 1.25 0.59 2 8.78 15.86
6.9.1 - Installation 37,325 80,799 0.92 0.91 0.42 2 4.95 14.29
6.9.2 - Repair 34,268 73,073 0.82 0.81 0.36 2 5.47 12.74

Contractor Group Benchmarking Report, U.S., 2012 Data // All Industries, ComprehensiveISNetworld.com // Report No. 1302 28
Table 2: 2012 Injury and Illness Rates by ISN Work TypeInjuries and Illnesses [b] Fatalities [c] Severity [d]
ISN Work Type [a] Total Number of Employees
Total Number of Exposure
Hours(in 1,000s)
Total Recordable
Incident Rate (TRIR)
Nonfatal Total Recordable
Incident Rate (Nonfatal TRIR)
Days Away/ Restricted or Transfer Rate
(DART)
Total Number of Fatalities
Fatality Rate per 100,000
Workers
Incident Severity (In Days)
6.9.3 - Digital 2,672 5,504 1.85 1.82 0.84 1 36.34 8.02
6.10 - Appliances 10,590 21,702 1.54 1.53 1.02 1 9.22 9.92
6.11 - Mowing and Groundcare 173,028 356,266 2.48 2.48 1.69 9 5.05 11.80
6.11.1 - Tree Trimming/Clearing and Wood Grinding 83,277 177,947 1.50 1.49 0.78 6 6.74 13.42
6.12 - Fence Installation and Repair 88,349 193,060 1.22 1.22 0.60 8 8.29 13.07
6.13 - Locks 30,565 61,888 1.40 1.39 0.74 3 9.69 7.43
6.14 - Door Repair 29,458 59,219 1.45 1.44 0.81 2 6.75 9.51
6.14.1 - Overhead Door Installation/Repair 8,768 18,161 2.72 2.71 1.44 1 11.01 10.35 (8.87*)
6.15 - Surveying 97,266 200,579 0.80 0.80 0.32 0 0.00 10.47
6.15.1 - Leak Surveying 9,042 19,350 1.43 1.43 0.73 0 0.00 18.03
6.15.2 - Topographic 43,838 96,066 0.82 0.81 0.32 1 2.08 6.54
6.15.3 - Boundary 28,106 59,141 0.88 0.88 0.40 0 0.00 7.07
6.16 - Dock Plate and Dock Lock Preventative Maintenance/Repair 12,189 22,073 2.94 2.93 1.63 1 9.06 15.93
6.17 - Snow Plowing/Removal 38,032 75,981 4.44 4.43 2.72 2 5.26 6.48
6.18 - Glass Repair 3,632 6,383 2.51 2.51 1.32 0 0.00 8.54
6.19 - Medical Gas Piping-Repair 5,661 12,017 2.63 2.63 1.28 0 0.00 13.77
6.20 - Structural Repair 16,264 38,563 1.72 1.71 0.76 1 5.19 10.53
6.21 - Irrigation Sprinkler Installation/Repair 17,470 37,206 1.37 1.37 0.65 0 0.00 7.65
6.22 - Cooking Equipment Repair & Maintenance 1,652 4,007 2.84 2.84 1.55 0 0.00 4.28
6.23 - Refrigeration Equipment Repair & Maintenance 6,492 13,405 3.88 3.88 2.09 0 0.00 9.23
6.24 - Interior Landscaping 2,123 3,690 2.60 2.60 1.30 0 0.00 9.67
6.25 - Logging 2,250 5,089 1.93 1.89 1.10 1 39.30 4.67
6.26 - Curtainwalls 968 1,969 1.42 1.42 0.81 (0.71*) 0 0.00 34.79
7.0 - Drilling 111,602 271,361 1.69 1.68 0.97 8 5.90 13.73
7.1 - Directional 132,903 353,968 1.73 1.72 1.02 13 7.35 12.99
7.2 - Tongs - Power Drill Pipe 33,034 98,556 1.78 1.76 1.05 6 12.18 9.70
7.3 - Tongs - Casing 73,771 216,065 1.64 1.63 0.99 10 9.26 11.80
7.4 - Hot Oil Services 61,040 180,068 1.56 1.55 0.93 4 4.44 11.69
7.5 - Fluids 74,099 217,513 1.48 1.47 0.90 5 4.60 10.42
7.6 - Rat and Mouse Hole 33,978 102,329 1.66 1.65 0.99 5 9.77 8.08
7.7 - Reverse Circulation and Rotary Drilling 28,928 72,127 2.00 1.99 1.20 5 13.86 13.76

Contractor Group Benchmarking Report, U.S., 2012 Data // All Industries, ComprehensiveISNetworld.com // Report No. 1302 29
Table 2: 2012 Injury and Illness Rates by ISN Work TypeInjuries and Illnesses [b] Fatalities [c] Severity [d]
ISN Work Type [a] Total Number of Employees
Total Number of Exposure
Hours(in 1,000s)
Total Recordable
Incident Rate (TRIR)
Nonfatal Total Recordable
Incident Rate (Nonfatal TRIR)
Days Away/ Restricted or Transfer Rate
(DART)
Total Number of Fatalities
Fatality Rate per 100,000
Workers
Incident Severity (In Days)
7.8 - Coalbed Methane Drilling 749 1,587 3.66 3.66 2.14 0 0.00 30.14
7.9 - Control of Solids in Drilling Fluids 26,563 81,109 1.52 1.51 0.84 1 2.47 8.00
7.10 - Rig Up Service 22,702 64,336† 1.49 1.48 1.04 2 6.22 15.69
8.0 - Original Equipment Manufacturer 89,884 197,319 2.15 2.15 1.01 3 3.04 6.52
8.1 - Design & Manufacturer Lubrication Systems 2,702 5,895 3.02 2.99 1.42 1 33.93 7.94
8.2 - Manufacturing Electronic Controls and/or Pilots 6,360 13,361 3.56 3.56 1.71 0 0.00 7.37
8.3 - Fiberglass Products 1,248 2,429 1.32 1.32 1.07 0 0.00 17.50
8.4 - Heat Exchangers 10,067 21,802 3.44 3.44 1.87 0 0.00 9.96
8.5 - Pressure vessels 12,705 28,593 3.41 3.41 1.64 0 0.00 9.65
8.7 - Power Transmission Products 4,455 9,761 2.05 2.05 1.00 0 0.00 12.77 (8.13*)
8.8 - Overhead Crane Manufacturing 2,830 6,274 3.19 3.19 2.26 0 0.00 9.52
8.9 - Wellhead Equipment 5,033 11,375 3.78 3.78 1.88 0 0.00 6.39
8.10 - Above Ground Storage Tanks 9,398 20,673 1.34 1.34 0.53 0 0.00 5.37
9.0 - Inspection 133,956 310,807 1.11 1.11 0.54 1 0.64 8.78
9.1 - Cathodic Protection 80,627 175,309 0.91 0.90 0.45 1 1.14 9.52
9.1.1 - Rectifi er 6,735 14,364 1.16 1.16 0.60 0 0.00 6.23 (4.11*)
9.2 - Aerial Patrol 4,756 10,279 0.49 0.49 0.21 0 0.00 0.20
9.2.1 - Charter Helicopter Service 3,420 7,742 0.62 0.62 0.44 0 0.00 14.63
9.2.2 - Aerial Photography/Surveying 6,666 15,724 0.56 0.56 0.24 0 0.00 6.07
9.2.5 - Remote Stack Emission Testing 41,890 83,517 0.68 0.68 0.30 0 0.00 12.60
9.3 - Tanks 83,242 178,712 0.61 0.61 0.26 1 1.12 9.47
9.3.1 - Gauging 34,577 75,668 0.87 0.86 0.44 2 5.29 10.31
9.3.2 - Sampling 31,325 67,847 0.78 0.78 0.41 1 2.95 11.02
9.3.3 - Strapping 18,051 39,232 0.65 0.65 0.35 1 5.10 8.93
9.4 - Non-Destructive Testing 160,798 364,576 0.90 0.90 0.46 3 1.65 9.24
9.4.1 - Thermographic Testing 8,430 17,500 1.51 1.51 0.83 0 0.00 10.67
9.4.2 - Ground Penetrating Radar 2,834 5,902 0.54 0.54 0.20 0 0.00 10.38
9.4.3 - Inspection Service, Visual (Other than Construction/Fabrication) 19,826 41,799 1.01 1.00 0.40 1 4.78 9.21
9.5 - Infrared 38,213 81,622 1.04 1.04 0.51 1 2.45 11.88 (10.69*)
9.6 - Eddy Current 38,307 81,220 0.66 0.66 0.33 0 0.00 14.70 (12.85*)
9.7 - Civil 108,738 237,926 0.55 0.55 0.23 2 1.68 8.44
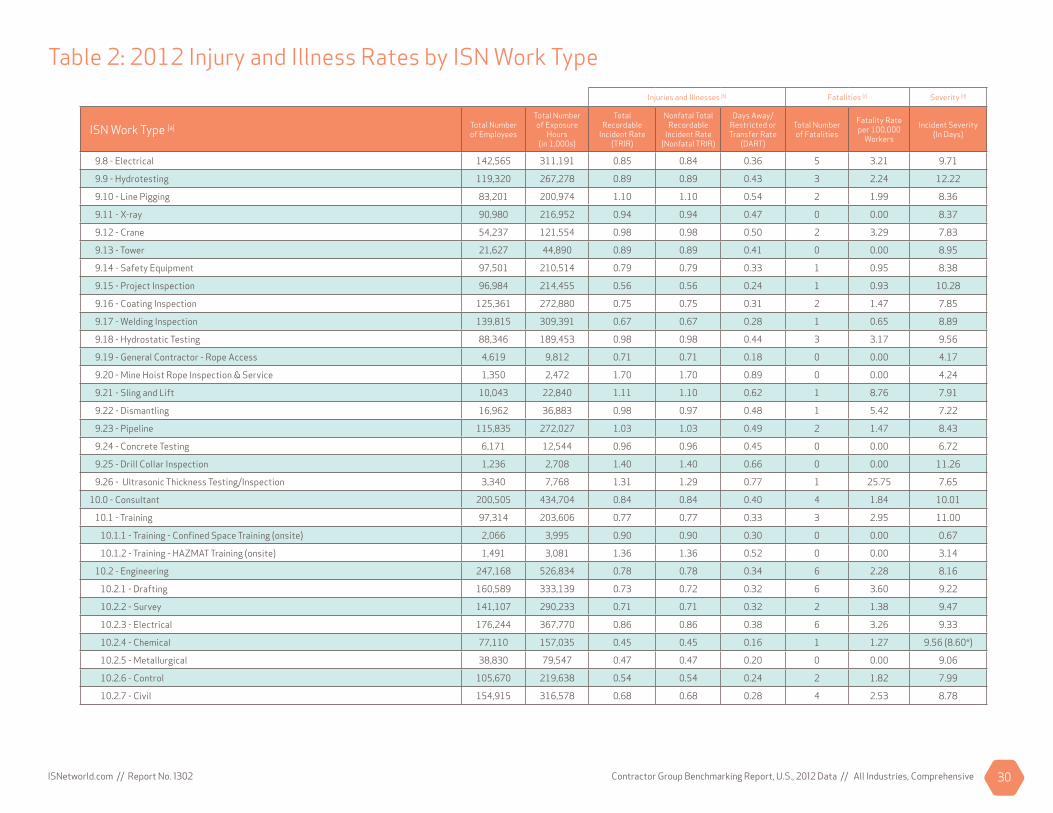
Contractor Group Benchmarking Report, U.S., 2012 Data // All Industries, ComprehensiveISNetworld.com // Report No. 1302 30
Table 2: 2012 Injury and Illness Rates by ISN Work TypeInjuries and Illnesses [b] Fatalities [c] Severity [d]
ISN Work Type [a] Total Number of Employees
Total Number of Exposure
Hours(in 1,000s)
Total Recordable
Incident Rate (TRIR)
Nonfatal Total Recordable
Incident Rate (Nonfatal TRIR)
Days Away/ Restricted or Transfer Rate
(DART)
Total Number of Fatalities
Fatality Rate per 100,000
Workers
Incident Severity (In Days)
9.8 - Electrical 142,565 311,191 0.85 0.84 0.36 5 3.21 9.71
9.9 - Hydrotesting 119,320 267,278 0.89 0.89 0.43 3 2.24 12.22
9.10 - Line Pigging 83,201 200,974 1.10 1.10 0.54 2 1.99 8.36
9.11 - X-ray 90,980 216,952 0.94 0.94 0.47 0 0.00 8.37
9.12 - Crane 54,237 121,554 0.98 0.98 0.50 2 3.29 7.83
9.13 - Tower 21,627 44,890 0.89 0.89 0.41 0 0.00 8.95
9.14 - Safety Equipment 97,501 210,514 0.79 0.79 0.33 1 0.95 8.38
9.15 - Project Inspection 96,984 214,455 0.56 0.56 0.24 1 0.93 10.28
9.16 - Coating Inspection 125,361 272,880 0.75 0.75 0.31 2 1.47 7.85
9.17 - Welding Inspection 139,815 309,391 0.67 0.67 0.28 1 0.65 8.89
9.18 - Hydrostatic Testing 88,346 189,453 0.98 0.98 0.44 3 3.17 9.56
9.19 - General Contractor - Rope Access 4,619 9,812 0.71 0.71 0.18 0 0.00 4.17
9.20 - Mine Hoist Rope Inspection & Service 1,350 2,472 1.70 1.70 0.89 0 0.00 4.24
9.21 - Sling and Lift 10,043 22,840 1.11 1.10 0.62 1 8.76 7.91
9.22 - Dismantling 16,962 36,883 0.98 0.97 0.48 1 5.42 7.22
9.23 - Pipeline 115,835 272,027 1.03 1.03 0.49 2 1.47 8.43
9.24 - Concrete Testing 6,171 12,544 0.96 0.96 0.45 0 0.00 6.72
9.25 - Drill Collar Inspection 1,236 2,708 1.40 1.40 0.66 0 0.00 11.26
9.26 - Ultrasonic Thickness Testing/Inspection 3,340 7,768 1.31 1.29 0.77 1 25.75 7.65
10.0 - Consultant 200,505 434,704 0.84 0.84 0.40 4 1.84 10.01
10.1 - Training 97,314 203,606 0.77 0.77 0.33 3 2.95 11.00
10.1.1 - Training - Confi ned Space Training (onsite) 2,066 3,995 0.90 0.90 0.30 0 0.00 0.67
10.1.2 - Training - HAZMAT Training (onsite) 1,491 3,081 1.36 1.36 0.52 0 0.00 3.14
10.2 - Engineering 247,168 526,834 0.78 0.78 0.34 6 2.28 8.16
10.2.1 - Drafting 160,589 333,139 0.73 0.72 0.32 6 3.60 9.22
10.2.2 - Survey 141,107 290,233 0.71 0.71 0.32 2 1.38 9.47
10.2.3 - Electrical 176,244 367,770 0.86 0.86 0.38 6 3.26 9.33
10.2.4 - Chemical 77,110 157,035 0.45 0.45 0.16 1 1.27 9.56 (8.60*)
10.2.5 - Metallurgical 38,830 79,547 0.47 0.47 0.20 0 0.00 9.06
10.2.6 - Control 105,670 219,638 0.54 0.54 0.24 2 1.82 7.99
10.2.7 - Civil 154,915 316,578 0.68 0.68 0.28 4 2.53 8.78
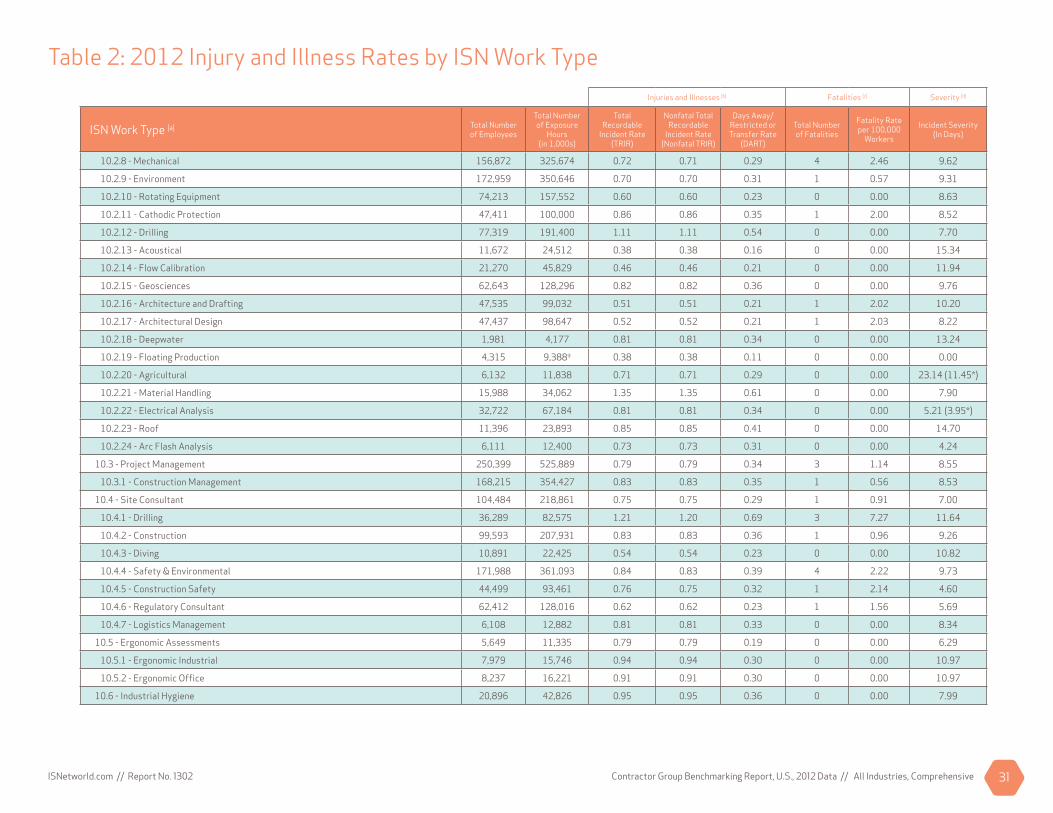
Contractor Group Benchmarking Report, U.S., 2012 Data // All Industries, ComprehensiveISNetworld.com // Report No. 1302 31
Table 2: 2012 Injury and Illness Rates by ISN Work TypeInjuries and Illnesses [b] Fatalities [c] Severity [d]
ISN Work Type [a] Total Number of Employees
Total Number of Exposure
Hours(in 1,000s)
Total Recordable
Incident Rate (TRIR)
Nonfatal Total Recordable
Incident Rate (Nonfatal TRIR)
Days Away/ Restricted or Transfer Rate
(DART)
Total Number of Fatalities
Fatality Rate per 100,000
Workers
Incident Severity (In Days)
10.2.8 - Mechanical 156,872 325,674 0.72 0.71 0.29 4 2.46 9.62
10.2.9 - Environment 172,959 350,646 0.70 0.70 0.31 1 0.57 9.31
10.2.10 - Rotating Equipment 74,213 157,552 0.60 0.60 0.23 0 0.00 8.63
10.2.11 - Cathodic Protection 47,411 100,000 0.86 0.86 0.35 1 2.00 8.52
10.2.12 - Drilling 77,319 191,400 1.11 1.11 0.54 0 0.00 7.70
10.2.13 - Acoustical 11,672 24,512 0.38 0.38 0.16 0 0.00 15.34
10.2.14 - Flow Calibration 21,270 45,829 0.46 0.46 0.21 0 0.00 11.94
10.2.15 - Geosciences 62,643 128,296 0.82 0.82 0.36 0 0.00 9.76
10.2.16 - Architecture and Drafting 47,535 99,032 0.51 0.51 0.21 1 2.02 10.20
10.2.17 - Architectural Design 47,437 98,647 0.52 0.52 0.21 1 2.03 8.22
10.2.18 - Deepwater 1,981 4,177 0.81 0.81 0.34 0 0.00 13.24
10.2.19 - Floating Production 4,315 9,388† 0.38 0.38 0.11 0 0.00 0.00
10.2.20 - Agricultural 6,132 11,838 0.71 0.71 0.29 0 0.00 23.14 (11.45*)
10.2.21 - Material Handling 15,988 34,062 1.35 1.35 0.61 0 0.00 7.90
10.2.22 - Electrical Analysis 32,722 67,184 0.81 0.81 0.34 0 0.00 5.21 (3.95*)
10.2.23 - Roof 11,396 23,893 0.85 0.85 0.41 0 0.00 14.70
10.2.24 - Arc Flash Analysis 6,111 12,400 0.73 0.73 0.31 0 0.00 4.24
10.3 - Project Management 250,399 525,889 0.79 0.79 0.34 3 1.14 8.55
10.3.1 - Construction Management 168,215 354,427 0.83 0.83 0.35 1 0.56 8.53
10.4 - Site Consultant 104,484 218,861 0.75 0.75 0.29 1 0.91 7.00
10.4.1 - Drilling 36,289 82,575 1.21 1.20 0.69 3 7.27 11.64
10.4.2 - Construction 99,593 207,931 0.83 0.83 0.36 1 0.96 9.26
10.4.3 - Diving 10,891 22,425 0.54 0.54 0.23 0 0.00 10.82
10.4.4 - Safety & Environmental 171,988 361,093 0.84 0.83 0.39 4 2.22 9.73
10.4.5 - Construction Safety 44,499 93,461 0.76 0.75 0.32 1 2.14 4.60
10.4.6 - Regulatory Consultant 62,412 128,016 0.62 0.62 0.23 1 1.56 5.69
10.4.7 - Logistics Management 6,108 12,882 0.81 0.81 0.33 0 0.00 8.34
10.5 - Ergonomic Assessments 5,649 11,335 0.79 0.79 0.19 0 0.00 6.29
10.5.1 - Ergonomic Industrial 7,979 15,746 0.94 0.94 0.30 0 0.00 10.97
10.5.2 - Ergonomic Offi ce 8,237 16,221 0.91 0.91 0.30 0 0.00 10.97
10.6 - Industrial Hygiene 20,896 42,826 0.95 0.95 0.36 0 0.00 7.99
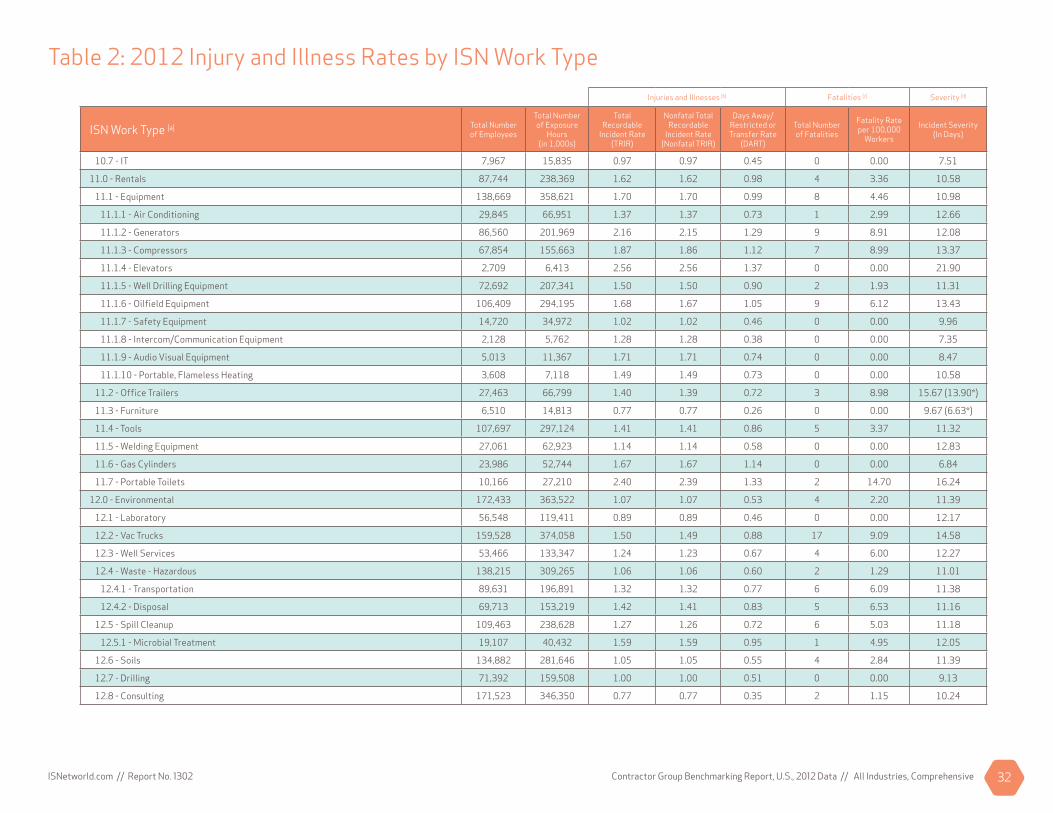
Contractor Group Benchmarking Report, U.S., 2012 Data // All Industries, ComprehensiveISNetworld.com // Report No. 1302 32
Table 2: 2012 Injury and Illness Rates by ISN Work TypeInjuries and Illnesses [b] Fatalities [c] Severity [d]
ISN Work Type [a] Total Number of Employees
Total Number of Exposure
Hours(in 1,000s)
Total Recordable
Incident Rate (TRIR)
Nonfatal Total Recordable
Incident Rate (Nonfatal TRIR)
Days Away/ Restricted or Transfer Rate
(DART)
Total Number of Fatalities
Fatality Rate per 100,000
Workers
Incident Severity (In Days)
10.7 - IT 7,967 15,835 0.97 0.97 0.45 0 0.00 7.51
11.0 - Rentals 87,744 238,369 1.62 1.62 0.98 4 3.36 10.58
11.1 - Equipment 138,669 358,621 1.70 1.70 0.99 8 4.46 10.98
11.1.1 - Air Conditioning 29,845 66,951 1.37 1.37 0.73 1 2.99 12.66
11.1.2 - Generators 86,560 201,969 2.16 2.15 1.29 9 8.91 12.08
11.1.3 - Compressors 67,854 155,663 1.87 1.86 1.12 7 8.99 13.37
11.1.4 - Elevators 2,709 6,413 2.56 2.56 1.37 0 0.00 21.90
11.1.5 - Well Drilling Equipment 72,692 207,341 1.50 1.50 0.90 2 1.93 11.31
11.1.6 - Oilfi eld Equipment 106,409 294,195 1.68 1.67 1.05 9 6.12 13.43
11.1.7 - Safety Equipment 14,720 34,972 1.02 1.02 0.46 0 0.00 9.96
11.1.8 - Intercom/Communication Equipment 2,128 5,762 1.28 1.28 0.38 0 0.00 7.35
11.1.9 - Audio Visual Equipment 5,013 11,367 1.71 1.71 0.74 0 0.00 8.47
11.1.10 - Portable, Flameless Heating 3,608 7,118 1.49 1.49 0.73 0 0.00 10.58
11.2 - Offi ce Trailers 27,463 66,799 1.40 1.39 0.72 3 8.98 15.67 (13.90*)
11.3 - Furniture 6,510 14,813 0.77 0.77 0.26 0 0.00 9.67 (6.63*)
11.4 - Tools 107,697 297,124 1.41 1.41 0.86 5 3.37 11.32
11.5 - Welding Equipment 27,061 62,923 1.14 1.14 0.58 0 0.00 12.83
11.6 - Gas Cylinders 23,986 52,744 1.67 1.67 1.14 0 0.00 6.84
11.7 - Portable Toilets 10,166 27,210 2.40 2.39 1.33 2 14.70 16.24
12.0 - Environmental 172,433 363,522 1.07 1.07 0.53 4 2.20 11.39
12.1 - Laboratory 56,548 119,411 0.89 0.89 0.46 0 0.00 12.17
12.2 - Vac Trucks 159,528 374,058 1.50 1.49 0.88 17 9.09 14.58
12.3 - Well Services 53,466 133,347 1.24 1.23 0.67 4 6.00 12.27
12.4 - Waste - Hazardous 138,215 309,265 1.06 1.06 0.60 2 1.29 11.01
12.4.1 - Transportation 89,631 196,891 1.32 1.32 0.77 6 6.09 11.38
12.4.2 - Disposal 69,713 153,219 1.42 1.41 0.83 5 6.53 11.16
12.5 - Spill Cleanup 109,463 238,628 1.27 1.26 0.72 6 5.03 11.18
12.5.1 - Microbial Treatment 19,107 40,432 1.59 1.59 0.95 1 4.95 12.05
12.6 - Soils 134,882 281,646 1.05 1.05 0.55 4 2.84 11.39
12.7 - Drilling 71,392 159,508 1.00 1.00 0.51 0 0.00 9.13
12.8 - Consulting 171,523 346,350 0.77 0.77 0.35 2 1.15 10.24

Contractor Group Benchmarking Report, U.S., 2012 Data // All Industries, ComprehensiveISNetworld.com // Report No. 1302 33
Table 2: 2012 Injury and Illness Rates by ISN Work TypeInjuries and Illnesses [b] Fatalities [c] Severity [d]
ISN Work Type [a] Total Number of Employees
Total Number of Exposure
Hours(in 1,000s)
Total Recordable
Incident Rate (TRIR)
Nonfatal Total Recordable
Incident Rate (Nonfatal TRIR)
Days Away/ Restricted or Transfer Rate
(DART)
Total Number of Fatalities
Fatality Rate per 100,000
Workers
Incident Severity (In Days)
12.8.1 - Permitting 105,743 213,865 0.71 0.71 0.30 0 0.00 8.82
12.8.2 - Asbestos Survey 10,203 20,833 1.40 1.40 0.80 0 0.00 15.88
12.8.3 - Mold Assessment/Sampling 846 1,653 1.45 1.45 0.61 0 0.00 4.58
12.9 - Environmental Remediation 173,409 361,137 1.19 1.18 0.64 5 2.77 11.80
12.10 - Environmental Site Assessment 148,521 307,168 0.85 0.85 0.39 1 0.65 10.40
12.11 - Laboratory Analysis/Mobile 28,444 57,734 0.72 0.72 0.30 0 0.00 10.87
12.12 - Waste Services-Treatment (Including Water) 71,945 155,284 1.24 1.24 0.73 1 1.29 11.36
12.12.1 - Water Treatment 26,633 56,054 1.41 1.41 0.77 0 0.00 12.18
12.12.2 - Resin Restoration 2,636 5,469 1.76 1.76 0.80 0 0.00 9.33
12.13 - Waste Services - Disposal Non-Hazardous 99,801 226,021 1.58 1.58 0.97 6 5.31 16.98
12.14 - Emergency Response 75,560 160,433 1.37 1.37 0.84 2 2.49 11.11
12.14.1 - Radiation 3,405 7,175 1.62 1.62 0.86 0 0.00 13.03
12.15 - Emissions Testing 74,362 151,920 0.57 0.57 0.23 0 0.00 9.90
12.16 - Pit Lining 30,038 66,562 1.25 1.24 0.73 3 9.01 12.18
12.17 - Source/Air Pollution Testing 75,036 151,321 0.64 0.64 0.26 0 0.00 9.69
12.18 - Erosion Control 95,744 197,536 1.04 1.04 0.53 1 1.01 10.09
12.19 - Recontouring 29,834 61,774 0.98 0.98 0.48 1 3.24 10.50
12.20 - Site Reclamation 134,601 283,523 1.04 1.03 0.51 4 2.82 11.46
12.20.1 - Restorative Planting Services 13,843 28,078 1.19 1.19 0.60 0 0.00 15.39
12.20.2 - Mold Abatement/Remediation 1,388 2,815 3.84 3.84 2.84 0 0.00 10.83
12.20.3 - Water/Flood Damage Remediation 1,392 2,876 3.69 3.69 2.99 0 0.00 21.00
12.21 - Supply & Installation of Secondary Containment 33,856 72,346 1.19 1.18 0.61 2 5.53 14.35
12.22 - Supply & Installation of Liner & Geotextile 21,606 45,203 1.21 1.20 0.63 2 8.85 13.47
12.23 - Acoustical 12,019 24,019 0.52 0.52 0.17 0 0.00 3.39
12.23.1 - Design 5,927 12,357 1.28 1.28 0.52 0 0.00 6.97
12.23.2 - Construction 8,721 17,298 1.32 1.32 0.68 0 0.00 5.97
12.23.3 - Manufacturing 604 1,212 3.96 (2.71*) 3.96 (2.71*) 2.31 0 0.00 12.42
12.24 - Recycling 25,883 60,053 2.38 2.37 1.54 1 3.33 21.90
12.24.1 - Computer Components/Lighting Components 3,094 6,963 1.64 1.64 0.98 0 0.00 14.42
12.24.2 - Scrap Metal 8,035 16,914 2.10 2.10 1.36 0 0.00 15.85
12.24.3 - Material Management 3,406 7,024 1.37 1.37 0.80 0 0.00 15.23
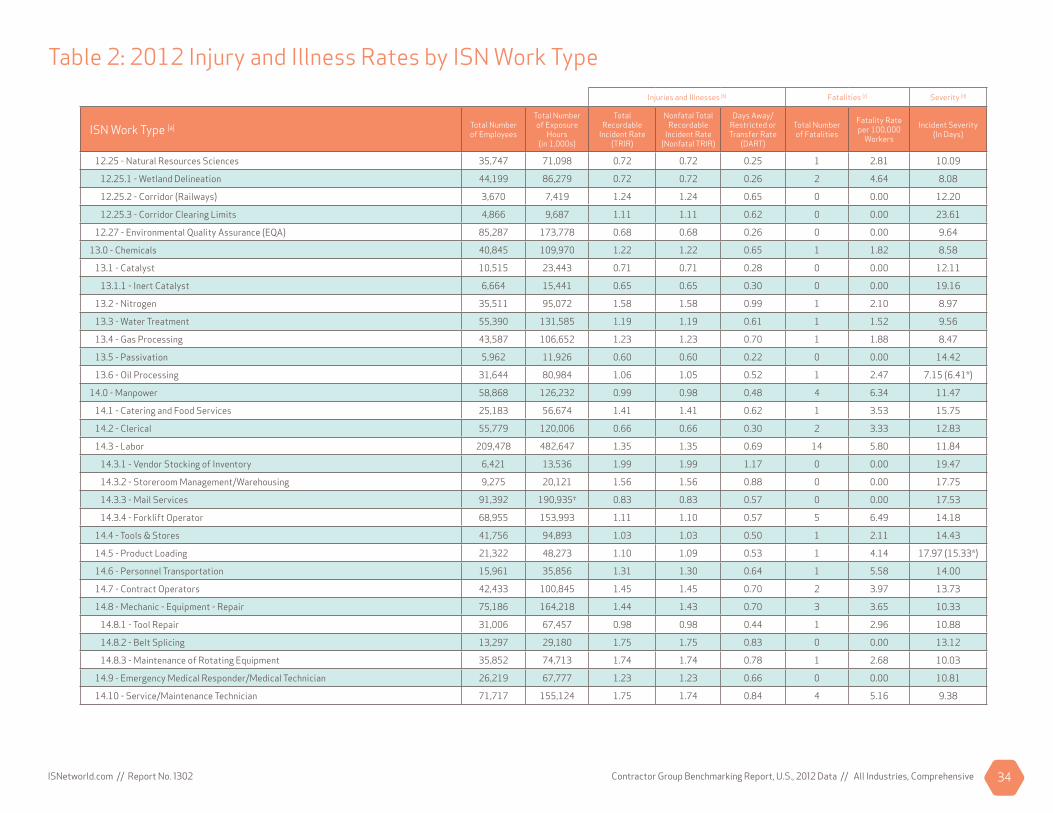
Contractor Group Benchmarking Report, U.S., 2012 Data // All Industries, ComprehensiveISNetworld.com // Report No. 1302 34
Table 2: 2012 Injury and Illness Rates by ISN Work TypeInjuries and Illnesses [b] Fatalities [c] Severity [d]
ISN Work Type [a] Total Number of Employees
Total Number of Exposure
Hours(in 1,000s)
Total Recordable
Incident Rate (TRIR)
Nonfatal Total Recordable
Incident Rate (Nonfatal TRIR)
Days Away/ Restricted or Transfer Rate
(DART)
Total Number of Fatalities
Fatality Rate per 100,000
Workers
Incident Severity (In Days)
12.25 - Natural Resources Sciences 35,747 71,098 0.72 0.72 0.25 1 2.81 10.09
12.25.1 - Wetland Delineation 44,199 86,279 0.72 0.72 0.26 2 4.64 8.08
12.25.2 - Corridor (Railways) 3,670 7,419 1.24 1.24 0.65 0 0.00 12.20
12.25.3 - Corridor Clearing Limits 4,866 9,687 1.11 1.11 0.62 0 0.00 23.61
12.27 - Environmental Quality Assurance (EQA) 85,287 173,778 0.68 0.68 0.26 0 0.00 9.64
13.0 - Chemicals 40,845 109,970 1.22 1.22 0.65 1 1.82 8.58
13.1 - Catalyst 10,515 23,443 0.71 0.71 0.28 0 0.00 12.11
13.1.1 - Inert Catalyst 6,664 15,441 0.65 0.65 0.30 0 0.00 19.16
13.2 - Nitrogen 35,511 95,072 1.58 1.58 0.99 1 2.10 8.97
13.3 - Water Treatment 55,390 131,585 1.19 1.19 0.61 1 1.52 9.56
13.4 - Gas Processing 43,587 106,652 1.23 1.23 0.70 1 1.88 8.47
13.5 - Passivation 5,962 11,926 0.60 0.60 0.22 0 0.00 14.42
13.6 - Oil Processing 31,644 80,984 1.06 1.05 0.52 1 2.47 7.15 (6.41*)
14.0 - Manpower 58,868 126,232 0.99 0.98 0.48 4 6.34 11.47
14.1 - Catering and Food Services 25,183 56,674 1.41 1.41 0.62 1 3.53 15.75
14.2 - Clerical 55,779 120,006 0.66 0.66 0.30 2 3.33 12.83
14.3 - Labor 209,478 482,647 1.35 1.35 0.69 14 5.80 11.84
14.3.1 - Vendor Stocking of Inventory 6,421 13,536 1.99 1.99 1.17 0 0.00 19.47
14.3.2 - Storeroom Management/Warehousing 9,275 20,121 1.56 1.56 0.88 0 0.00 17.75
14.3.3 - Mail Services 91,392 190,935† 0.83 0.83 0.57 0 0.00 17.53
14.3.4 - Forklift Operator 68,955 153,993 1.11 1.10 0.57 5 6.49 14.18
14.4 - Tools & Stores 41,756 94,893 1.03 1.03 0.50 1 2.11 14.43
14.5 - Product Loading 21,322 48,273 1.10 1.09 0.53 1 4.14 17.97 (15.33*)
14.6 - Personnel Transportation 15,961 35,856 1.31 1.30 0.64 1 5.58 14.00
14.7 - Contract Operators 42,433 100,845 1.45 1.45 0.70 2 3.97 13.73
14.8 - Mechanic - Equipment - Repair 75,186 164,218 1.44 1.43 0.70 3 3.65 10.33
14.8.1 - Tool Repair 31,006 67,457 0.98 0.98 0.44 1 2.96 10.88
14.8.2 - Belt Splicing 13,297 29,180 1.75 1.75 0.83 0 0.00 13.12
14.8.3 - Maintenance of Rotating Equipment 35,852 74,713 1.74 1.74 0.78 1 2.68 10.03
14.9 - Emergency Medical Responder/Medical Technician 26,219 67,777 1.23 1.23 0.66 0 0.00 10.81
14.10 - Service/Maintenance Technician 71,717 155,124 1.75 1.74 0.84 4 5.16 9.38
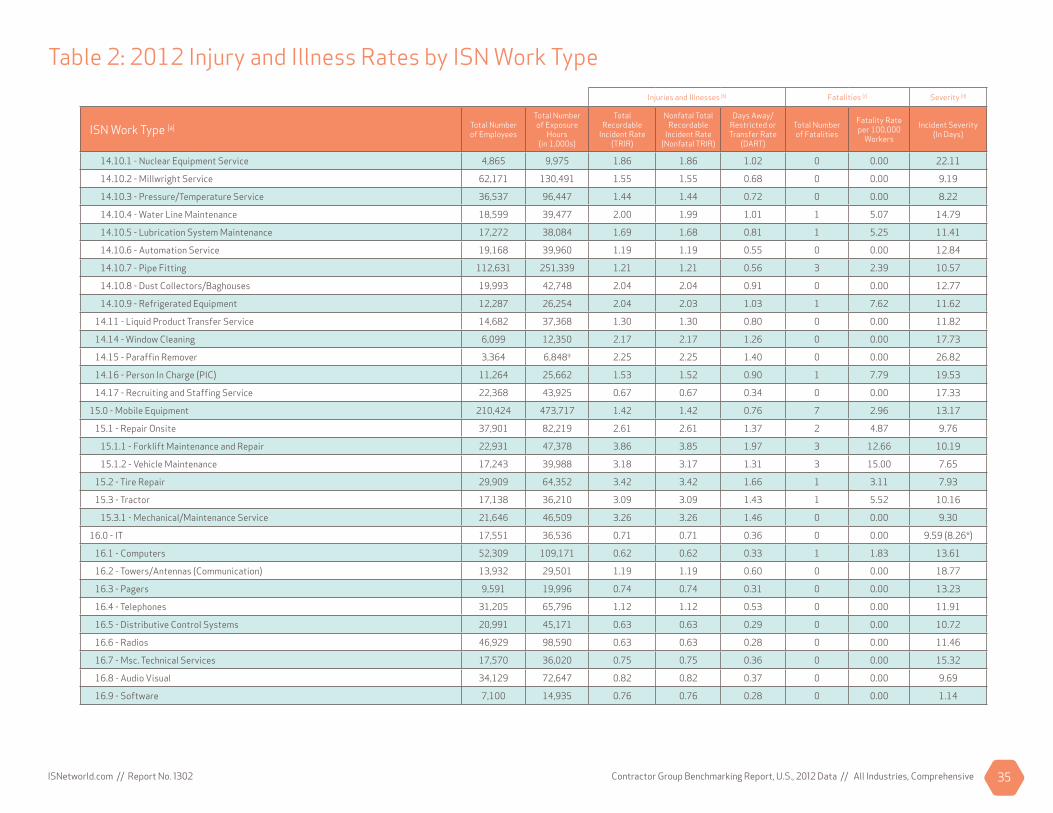
Contractor Group Benchmarking Report, U.S., 2012 Data // All Industries, ComprehensiveISNetworld.com // Report No. 1302 35
Table 2: 2012 Injury and Illness Rates by ISN Work TypeInjuries and Illnesses [b] Fatalities [c] Severity [d]
ISN Work Type [a] Total Number of Employees
Total Number of Exposure
Hours(in 1,000s)
Total Recordable
Incident Rate (TRIR)
Nonfatal Total Recordable
Incident Rate (Nonfatal TRIR)
Days Away/ Restricted or Transfer Rate
(DART)
Total Number of Fatalities
Fatality Rate per 100,000
Workers
Incident Severity (In Days)
14.10.1 - Nuclear Equipment Service 4,865 9,975 1.86 1.86 1.02 0 0.00 22.11
14.10.2 - Millwright Service 62,171 130,491 1.55 1.55 0.68 0 0.00 9.19
14.10.3 - Pressure/Temperature Service 36,537 96,447 1.44 1.44 0.72 0 0.00 8.22
14.10.4 - Water Line Maintenance 18,599 39,477 2.00 1.99 1.01 1 5.07 14.79
14.10.5 - Lubrication System Maintenance 17,272 38,084 1.69 1.68 0.81 1 5.25 11.41
14.10.6 - Automation Service 19,168 39,960 1.19 1.19 0.55 0 0.00 12.84
14.10.7 - Pipe Fitting 112,631 251,339 1.21 1.21 0.56 3 2.39 10.57
14.10.8 - Dust Collectors/Baghouses 19,993 42,748 2.04 2.04 0.91 0 0.00 12.77
14.10.9 - Refrigerated Equipment 12,287 26,254 2.04 2.03 1.03 1 7.62 11.62
14.11 - Liquid Product Transfer Service 14,682 37,368 1.30 1.30 0.80 0 0.00 11.82
14.14 - Window Cleaning 6,099 12,350 2.17 2.17 1.26 0 0.00 17.73
14.15 - Paraffi n Remover 3,364 6,848† 2.25 2.25 1.40 0 0.00 26.82
14.16 - Person In Charge (PIC) 11,264 25,662 1.53 1.52 0.90 1 7.79 19.53
14.17 - Recruiting and Staffi ng Service 22,368 43,925 0.67 0.67 0.34 0 0.00 17.33
15.0 - Mobile Equipment 210,424 473,717 1.42 1.42 0.76 7 2.96 13.17
15.1 - Repair Onsite 37,901 82,219 2.61 2.61 1.37 2 4.87 9.76
15.1.1 - Forklift Maintenance and Repair 22,931 47,378 3.86 3.85 1.97 3 12.66 10.19
15.1.2 - Vehicle Maintenance 17,243 39,988 3.18 3.17 1.31 3 15.00 7.65
15.2 - Tire Repair 29,909 64,352 3.42 3.42 1.66 1 3.11 7.93
15.3 - Tractor 17,138 36,210 3.09 3.09 1.43 1 5.52 10.16
15.3.1 - Mechanical/Maintenance Service 21,646 46,509 3.26 3.26 1.46 0 0.00 9.30
16.0 - IT 17,551 36,536 0.71 0.71 0.36 0 0.00 9.59 (8.26*)
16.1 - Computers 52,309 109,171 0.62 0.62 0.33 1 1.83 13.61
16.2 - Towers/Antennas (Communication) 13,932 29,501 1.19 1.19 0.60 0 0.00 18.77
16.3 - Pagers 9,591 19,996 0.74 0.74 0.31 0 0.00 13.23
16.4 - Telephones 31,205 65,796 1.12 1.12 0.53 0 0.00 11.91
16.5 - Distributive Control Systems 20,991 45,171 0.63 0.63 0.29 0 0.00 10.72
16.6 - Radios 46,929 98,590 0.63 0.63 0.28 0 0.00 11.46
16.7 - Msc. Technical Services 17,570 36,020 0.75 0.75 0.36 0 0.00 15.32
16.8 - Audio Visual 34,129 72,647 0.82 0.82 0.37 0 0.00 9.69
16.9 - Software 7,100 14,935 0.76 0.76 0.28 0 0.00 1.14

Contractor Group Benchmarking Report, U.S., 2012 Data // All Industries, ComprehensiveISNetworld.com // Report No. 1302 36
Table 2: 2012 Injury and Illness Rates by ISN Work TypeInjuries and Illnesses [b] Fatalities [c] Severity [d]
ISN Work Type [a] Total Number of Employees
Total Number of Exposure
Hours(in 1,000s)
Total Recordable
Incident Rate (TRIR)
Nonfatal Total Recordable
Incident Rate (Nonfatal TRIR)
Days Away/ Restricted or Transfer Rate
(DART)
Total Number of Fatalities
Fatality Rate per 100,000
Workers
Incident Severity (In Days)
16.9.1 - Software Installation & Repair 6,658 13,869 0.78 0.78 0.25 0 0.00 0.17
16.10 - Telecommunication 12,863 27,177 1.67 1.66 0.87 1 7.36 8.68
16.11 - Hardware Installation & Repair 13,519 27,914 1.66 1.66 1.05 0 0.00 6.89 (6.13*)
17.0 - Safety 71,660 155,327 0.80 0.80 0.40 0 0.00 15.79
17.1 - Fire Protection 72,677 156,911 1.07 1.07 0.52 2 2.55 9.54
17.1.1 - Fire Sprinkler Service 40,969 88,326 1.81 1.81 0.91 0 0.00 8.74
17.1.2 - Fire Sprinkler Installation, Inspection & Testing 34,742 73,718 1.83 1.82 0.92 1 2.71 8.56
17.1.3 - Fire Extinguisher Service 12,425 26,560 2.00 2.00 0.98 0 0.00 7.30
17.1.4 - Heavy Equipment Fire Suppression System 2,381 4,847 1.77 1.77 1.03 0 0.00 10.51
17.1.5 - Fireproofi ng/Firestopping 3,538 6,908† 0.72 0.72 0.32 0 0.00 11.64
17.2 - Emergency Response 45,448 113,347 1.07 1.07 0.56 1 1.76 8.49
17.2.2 - Emergency Transport Vehicles (Ground) 1,360 4,165 0.53 0.53 0.43 0 0.00 6.64
17.2.4 - EMS Services 15,651 33,369 0.40 0.40 0.07 0 0.00 3.57
17.3 - Security 150,435 284,245 1.27 1.26 0.61 3 2.11 14.37
17.3.1 - Traffi cking/Gate Guarding 102,584 188,868 1.27 1.26 0.51 3 3.18 16.68
17.3.2 - Security System Installations 32,114 64,460 1.55 1.55 0.75 1 3.10 8.06
17.3.3 - Cameras/Closed Circuit Television 29,178 58,194 1.48 1.47 0.71 1 3.44 7.31
17.3.4 - Outdoor Warning/Sirens 28,616 58,568 1.27 1.27 0.59 1 3.41 6.58
17.4 - FRC Onsite Delivery 9,939 23,043 0.76 0.76 0.37 0 0.00 5.84
17.5 - Medical Services 35,218 77,279 0.57 0.57 0.25 1 2.59 7.65
17.6 - Confi ned Space Attendant (Fire Watch/Hole Watch) 80,597 180,089 0.94 0.94 0.47 1 1.11 12.59
17.7 - Confi ned Space Rescue 33,996 77,326 0.93 0.92 0.43 2 5.17 9.14
17.8 - Fall Protection 37,672 83,903 0.98 0.97 0.48 3 7.15 10.23
17.9 - Access Platforms 13,901 29,296 0.82 0.82 0.31 0 0.00 15.78 (11.69*)
18.0 - Trucking/Transportation 251,320 621,446 1.56 1.55 0.92 17 5.47 14.97
18.1 - Hauling 203,835 498,465 1.95 1.94 1.18 39 15.65 18.41
18.1.1 - Water Trucks/Hauling 91,793 220,047 2.17 2.14 1.39 29 26.36 18.91
18.1.2 - Fresh Water Hauling 78,977 188,273 2.16 2.14 1.37 24 25.49 18.86
18.1.3 - Heavy Truck Hauling (Dump or Larger) 170,729 395,221 1.65 1.64 0.93 25 12.65 18.22
18.1.4 - Oversized/Heavy Materials 119,885 285,510 1.57 1.56 0.86 16 11.21 16.20
18.1.5 - Coke 4,752 10,712 1.40 1.40 0.84 0 0.00 11.68 (9.41*)

Contractor Group Benchmarking Report, U.S., 2012 Data // All Industries, ComprehensiveISNetworld.com // Report No. 1302 37
Table 2: 2012 Injury and Illness Rates by ISN Work TypeInjuries and Illnesses [b] Fatalities [c] Severity [d]
ISN Work Type [a] Total Number of Employees
Total Number of Exposure
Hours(in 1,000s)
Total Recordable
Incident Rate (TRIR)
Nonfatal Total Recordable
Incident Rate (Nonfatal TRIR)
Days Away/ Restricted or Transfer Rate
(DART)
Total Number of Fatalities
Fatality Rate per 100,000
Workers
Incident Severity (In Days)
18.2 - Freight 34,789 83,895 1.99 1.99 1.27 0 0.00 22.10
18.3 - Tank Truck 133,456 329,635 1.86 1.85 1.11 20 12.13 17.67
18.3.1 - Waste - Non Hazardous 118,429 292,185 1.89 1.87 1.14 19 13.01 17.64
18.4 - Navigation and Positioning 2,220 5,697 2.39 2.32 1.65 2 70.21 26.81
18.5 - Logistics 25,317 58,915 1.73 1.72 1.17 5 16.97 20.76
18.6 - Weigh Scale Service 2,271 5,317 2.22 2.22 1.47 0 0.00 19.08 (13.96*)
18.7 - Pick-up and Delivery Driver 56,493 125,240 2.10 2.10 1.44 3 4.79 14.72
18.8 - Tarping 8,445 21,505 3.05 3.05 1.92 0 0.00 22.20
19.0 - Down Hole Services 92,775 269,506 1.69 1.68 1.03 12 8.91 11.67
19.1 - Fishing (Down Hole Recovery) 123,919 343,223 1.47 1.46 0.86 8 4.66 10.53
19.2 - Pumper Svc. 123,131 349,473 1.50 1.49 0.89 7 4.01 10.03
19.3 - Seismic Operations 52,427 151,354 1.12 1.12 0.54 2 2.64 6.47
19.4 - Well Drilling (Workover/Completion) 143,288 393,738 1.63 1.62 0.98 12 6.10 12.07
19.5 - Wireline Service 140,399 392,066 1.47 1.47 0.86 9 4.59 10.32
19.6 - Consultant - Well Service 81,888 229,523 1.48 1.47 0.89 6 5.23 10.34
19.7 - Core Analysis 10,747 28,457† 2.04 2.02 1.36 3 21.08 10.84
19.8 - Well - Stimulation 60,276 167,784 1.85 1.84 1.06 7 8.34 10.76
19.9 - Stimulation - Acidizing 59,930 167,466 1.82 1.81 1.03 7 8.36 10.12
19.10 - Well - Control 71,801 205,055 1.54 1.53 0.94 6 5.85 11.01
19.11 - Well - Services 123,162 335,825 1.78 1.77 1.10 16 9.53 12.71
19.11.1 - Snubbing Coil Tubing 87,492 249,804 1.61 1.60 0.96 8 6.41 10.30
19.11.2 - Flowback Services 1,660 4,405 2.04 2.04 1.68 0 0.00 3.11
19.12 - Well - Production Testing 41,876 128,247 1.65 1.65 1.02 4 6.24 10.62
19.13 - Casing 68,422 204,809 1.69 1.68 1.07 8 7.81 11.42
19.14 - Plug and Abandonment 92,017 266,951 1.62 1.61 0.97 11 8.24 11.50
19.15 - Mudlogging 60,250 179,856 1.36 1.36 0.81 2 2.22 10.41
19.16 - Well Blowout Control 62,886 189,166 1.53 1.52 0.94 5 5.29 10.53
19.17 - Surface and Subsurface Safety System 64,639 192,431 1.52 1.51 0.93 7 7.28 10.49
19.18 - String Up Service 30,752 86,622 1.66 1.66 0.97 3 6.93 8.02
19.19 - Wellhead Service 64,298 191,318 1.57 1.56 0.97 7 7.32 10.36
19.20 - Logging Services 178 413 1.94 1.94 0.97 0 0.00 48.50
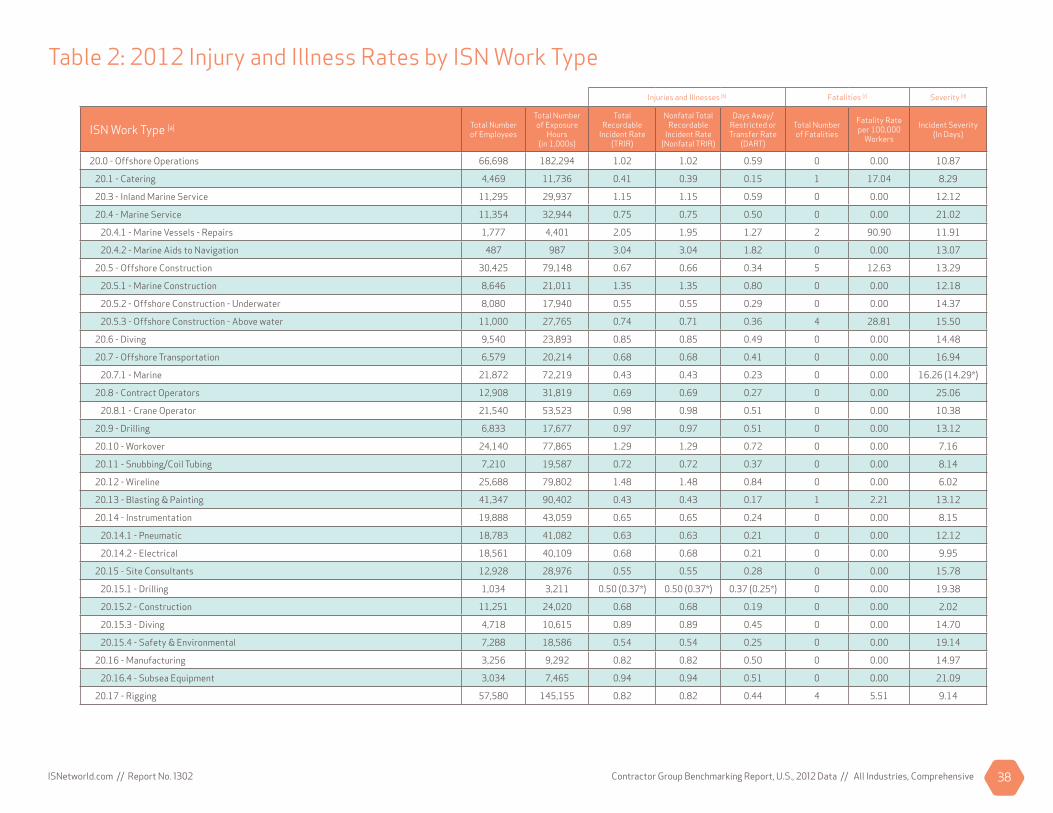
Contractor Group Benchmarking Report, U.S., 2012 Data // All Industries, ComprehensiveISNetworld.com // Report No. 1302 38
Table 2: 2012 Injury and Illness Rates by ISN Work TypeInjuries and Illnesses [b] Fatalities [c] Severity [d]
ISN Work Type [a] Total Number of Employees
Total Number of Exposure
Hours(in 1,000s)
Total Recordable
Incident Rate (TRIR)
Nonfatal Total Recordable
Incident Rate (Nonfatal TRIR)
Days Away/ Restricted or Transfer Rate
(DART)
Total Number of Fatalities
Fatality Rate per 100,000
Workers
Incident Severity (In Days)
20.0 - Offshore Operations 66,698 182,294 1.02 1.02 0.59 0 0.00 10.87
20.1 - Catering 4,469 11,736 0.41 0.39 0.15 1 17.04 8.29
20.3 - Inland Marine Service 11,295 29,937 1.15 1.15 0.59 0 0.00 12.12
20.4 - Marine Service 11,354 32,944 0.75 0.75 0.50 0 0.00 21.02
20.4.1 - Marine Vessels - Repairs 1,777 4,401 2.05 1.95 1.27 2 90.90 11.91
20.4.2 - Marine Aids to Navigation 487 987 3.04 3.04 1.82 0 0.00 13.07
20.5 - Offshore Construction 30,425 79,148 0.67 0.66 0.34 5 12.63 13.29
20.5.1 - Marine Construction 8,646 21,011 1.35 1.35 0.80 0 0.00 12.18
20.5.2 - Offshore Construction - Underwater 8,080 17,940 0.55 0.55 0.29 0 0.00 14.37
20.5.3 - Offshore Construction - Above water 11,000 27,765 0.74 0.71 0.36 4 28.81 15.50
20.6 - Diving 9,540 23,893 0.85 0.85 0.49 0 0.00 14.48
20.7 - Offshore Transportation 6,579 20,214 0.68 0.68 0.41 0 0.00 16.94
20.7.1 - Marine 21,872 72,219 0.43 0.43 0.23 0 0.00 16.26 (14.29*)
20.8 - Contract Operators 12,908 31,819 0.69 0.69 0.27 0 0.00 25.06
20.8.1 - Crane Operator 21,540 53,523 0.98 0.98 0.51 0 0.00 10.38
20.9 - Drilling 6,833 17,677 0.97 0.97 0.51 0 0.00 13.12
20.10 - Workover 24,140 77,865 1.29 1.29 0.72 0 0.00 7.16
20.11 - Snubbing/Coil Tubing 7,210 19,587 0.72 0.72 0.37 0 0.00 8.14
20.12 - Wireline 25,688 79,802 1.48 1.48 0.84 0 0.00 6.02
20.13 - Blasting & Painting 41,347 90,402 0.43 0.43 0.17 1 2.21 13.12
20.14 - Instrumentation 19,888 43,059 0.65 0.65 0.24 0 0.00 8.15
20.14.1 - Pneumatic 18,783 41,082 0.63 0.63 0.21 0 0.00 12.12
20.14.2 - Electrical 18,561 40,109 0.68 0.68 0.21 0 0.00 9.95
20.15 - Site Consultants 12,928 28,976 0.55 0.55 0.28 0 0.00 15.78
20.15.1 - Drilling 1,034 3,211 0.50 (0.37*) 0.50 (0.37*) 0.37 (0.25*) 0 0.00 19.38
20.15.2 - Construction 11,251 24,020 0.68 0.68 0.19 0 0.00 2.02
20.15.3 - Diving 4,718 10,615 0.89 0.89 0.45 0 0.00 14.70
20.15.4 - Safety & Environmental 7,288 18,586 0.54 0.54 0.25 0 0.00 19.14
20.16 - Manufacturing 3,256 9,292 0.82 0.82 0.50 0 0.00 14.97
20.16.4 - Subsea Equipment 3,034 7,465 0.94 0.94 0.51 0 0.00 21.09
20.17 - Rigging 57,580 145,155 0.82 0.82 0.44 4 5.51 9.14

Contractor Group Benchmarking Report, U.S., 2012 Data // All Industries, ComprehensiveISNetworld.com // Report No. 1302 39
Table 2: 2012 Injury and Illness Rates by ISN Work TypeInjuries and Illnesses [b] Fatalities [c] Severity [d]
ISN Work Type [a] Total Number of Employees
Total Number of Exposure
Hours(in 1,000s)
Total Recordable
Incident Rate (TRIR)
Nonfatal Total Recordable
Incident Rate (Nonfatal TRIR)
Days Away/ Restricted or Transfer Rate
(DART)
Total Number of Fatalities
Fatality Rate per 100,000
Workers
Incident Severity (In Days)
20.18 - Underwater Acoustics 2,364 6,869 0.87 0.87 0.47 0 0.00 2.03
20.19 - Remote Operated Vehicles 3,474 9,759 0.70 0.70 0.35 0 0.00 5.41
20.21 - Rentals - Living Quarters 1,083 2,895 1.59 1.52 1.17 1 69.08 26.04
21.0 - Retail (Petroleum Products Distribution) 16,958 42,299 2.16 2.14 1.35 4 18.91 11.11
21.1 - General Contracting 23,283 50,810 1.30 1.29 0.59 2 7.87 11.20
21.2 - Tank & Piping (UST) 19,740 46,872 1.78 1.77 0.92 2 8.53 10.93
21.3 - Tank & Piping (UST) Maintenance 15,212 37,163 1.72 1.71 0.91 2 10.76 14.98
21.4 - Service Station Maintenance 1,856 3,761 2.07 2.07 1.44 0 0.00 7.54
21.5 - Canopies/Awnings & Installation 3,672 7,959 1.36 1.31 0.80 2 50.26 4.44
21.6 - Materials/Geotechnical Testing 13,008 23,511 1.06 1.06 0.46 0 0.00 12.48
21.7 - Signage 1,188 2,448 2.12 2.12 1.31 0 0.00 10.73
21.8 - Tank Tightness Testing (UST) 3,558 7,687 1.04 1.04 0.81 0 0.00 18.68
21.9 - Car Wash (Install, Maintenance/Repair) 1,047 2,163 2.96 2.96 2.50 0 0.00 7.06
21.10 - Electrical Construction 19,297 40,691 1.80 1.80 0.89 0 0.00 9.38
21.11 - Consulting Engineer 23,846 48,043 0.71 0.71 0.29 0 0.00 6.25
21.12 - Asphalt Paving 18,694 37,818 2.43 2.41 1.43 4 21.15 9.84
21.13 - Engineering Design 13,706 29,937 0.67 0.67 0.36 0 0.00 14.36
21.14 - Stage II Vapor Recovery 2,269 4,814 0.83 0.83 0.58 0 0.00 17.25
21.15 - Inspector Services 5,879 12,468 1.24 1.24 0.56 0 0.00 4.60
21.16 - HVAC 11,913 24,608 1.96 1.96 0.97 0 0.00 11.24
21.17 - Dispensers and Related Accessories 1,240 2,523 2.22 2.22 1.43 0 0.00 10.32
21.18 - Tank & Vessel Cleaning 14,870 32,250 1.35 1.34 0.71 1 6.20 15.26 (13.11*)
21.19 - Soil Boring/Load Analysis 4,643 9,811 0.77 0.77 0.47 0 0.00 20.34
21.20 - Septic System Pump Out 1,649 3,692 2.28 2.28 1.41 0 0.00 15.12
21.21 - Landscaping & Mowing 12,903 21,997 2.48 2.47 1.50 1 9.09 15.82
21.22 - Security Fire Protection 21,483 43,264 1.59 1.59 0.79 1 4.62 6.85
21.23 - Water / Sewer Piping Construction 18,162 36,840 2.11 2.10 1.14 2 10.86 9.25
21.24 - Underground Storage Tank Removal 8,184 17,840 1.55 1.52 1.01 2 22.42 8.19 (7.07*)
21.25 - Cathodic Protection - Materials 9,664 21,020 1.19 1.18 0.58 1 9.51 11.51 (10.15*)
21.26 - Drilling - Tubular Goods & Accessories 7,114 18,439 2.45 2.43 1.38 2 21.69 7.80
21.27 - Civil Construction for Concrete Paving 20,297 41,678 2.03 2.03 1.04 2 9.60 7.54
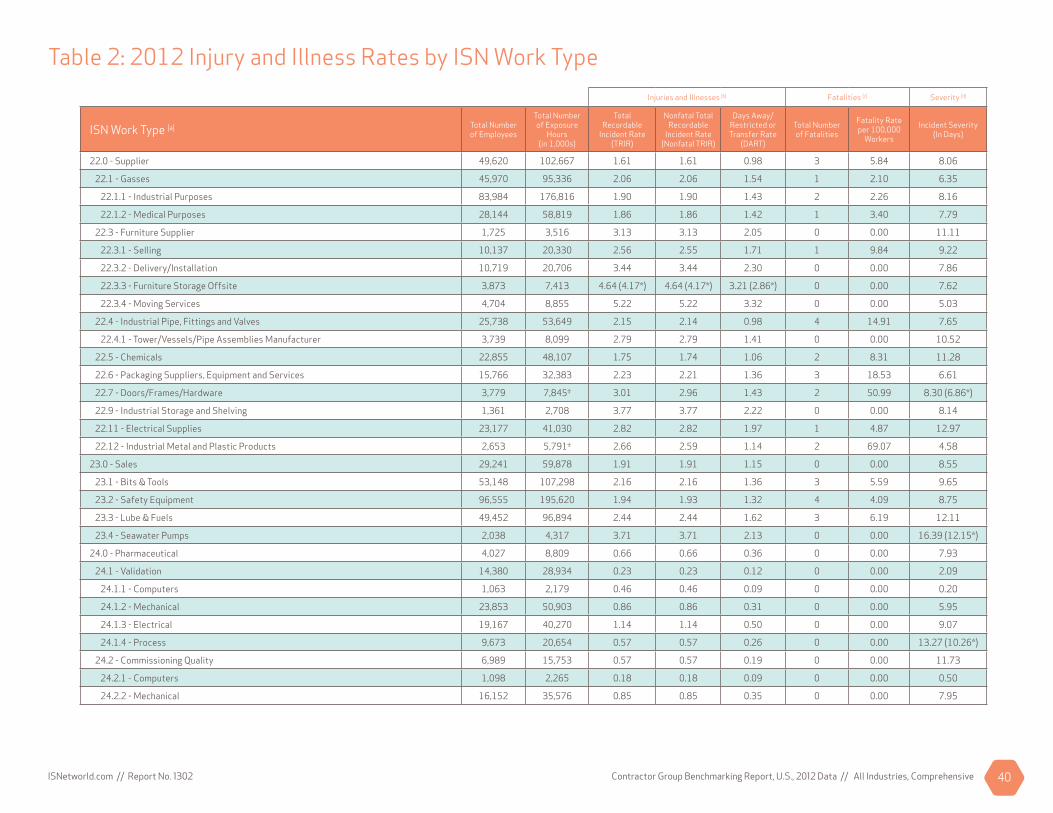
Contractor Group Benchmarking Report, U.S., 2012 Data // All Industries, ComprehensiveISNetworld.com // Report No. 1302 40
Table 2: 2012 Injury and Illness Rates by ISN Work TypeInjuries and Illnesses [b] Fatalities [c] Severity [d]
ISN Work Type [a] Total Number of Employees
Total Number of Exposure
Hours(in 1,000s)
Total Recordable
Incident Rate (TRIR)
Nonfatal Total Recordable
Incident Rate (Nonfatal TRIR)
Days Away/ Restricted or Transfer Rate
(DART)
Total Number of Fatalities
Fatality Rate per 100,000
Workers
Incident Severity (In Days)
22.0 - Supplier 49,620 102,667 1.61 1.61 0.98 3 5.84 8.06
22.1 - Gasses 45,970 95,336 2.06 2.06 1.54 1 2.10 6.35
22.1.1 - Industrial Purposes 83,984 176,816 1.90 1.90 1.43 2 2.26 8.16
22.1.2 - Medical Purposes 28,144 58,819 1.86 1.86 1.42 1 3.40 7.79
22.3 - Furniture Supplier 1,725 3,516 3.13 3.13 2.05 0 0.00 11.11
22.3.1 - Selling 10,137 20,330 2.56 2.55 1.71 1 9.84 9.22
22.3.2 - Delivery/Installation 10,719 20,706 3.44 3.44 2.30 0 0.00 7.86
22.3.3 - Furniture Storage Offsite 3,873 7,413 4.64 (4.17*) 4.64 (4.17*) 3.21 (2.86*) 0 0.00 7.62
22.3.4 - Moving Services 4,704 8,855 5.22 5.22 3.32 0 0.00 5.03
22.4 - Industrial Pipe, Fittings and Valves 25,738 53,649 2.15 2.14 0.98 4 14.91 7.65
22.4.1 - Tower/Vessels/Pipe Assemblies Manufacturer 3,739 8,099 2.79 2.79 1.41 0 0.00 10.52
22.5 - Chemicals 22,855 48,107 1.75 1.74 1.06 2 8.31 11.28
22.6 - Packaging Suppliers, Equipment and Services 15,766 32,383 2.23 2.21 1.36 3 18.53 6.61
22.7 - Doors/Frames/Hardware 3,779 7,845† 3.01 2.96 1.43 2 50.99 8.30 (6.86*)
22.9 - Industrial Storage and Shelving 1,361 2,708 3.77 3.77 2.22 0 0.00 8.14
22.11 - Electrical Supplies 23,177 41,030 2.82 2.82 1.97 1 4.87 12.97
22.12 - Industrial Metal and Plastic Products 2,653 5,791† 2.66 2.59 1.14 2 69.07 4.58
23.0 - Sales 29,241 59,878 1.91 1.91 1.15 0 0.00 8.55
23.1 - Bits & Tools 53,148 107,298 2.16 2.16 1.36 3 5.59 9.65
23.2 - Safety Equipment 96,555 195,620 1.94 1.93 1.32 4 4.09 8.75
23.3 - Lube & Fuels 49,452 96,894 2.44 2.44 1.62 3 6.19 12.11
23.4 - Seawater Pumps 2,038 4,317 3.71 3.71 2.13 0 0.00 16.39 (12.15*)
24.0 - Pharmaceutical 4,027 8,809 0.66 0.66 0.36 0 0.00 7.93
24.1 - Validation 14,380 28,934 0.23 0.23 0.12 0 0.00 2.09
24.1.1 - Computers 1,063 2,179 0.46 0.46 0.09 0 0.00 0.20
24.1.2 - Mechanical 23,853 50,903 0.86 0.86 0.31 0 0.00 5.95
24.1.3 - Electrical 19,167 40,270 1.14 1.14 0.50 0 0.00 9.07
24.1.4 - Process 9,673 20,654 0.57 0.57 0.26 0 0.00 13.27 (10.26*)
24.2 - Commissioning Quality 6,989 15,753 0.57 0.57 0.19 0 0.00 11.73
24.2.1 - Computers 1,098 2,265 0.18 0.18 0.09 0 0.00 0.50
24.2.2 - Mechanical 16,152 35,576 0.85 0.85 0.35 0 0.00 7.95

Contractor Group Benchmarking Report, U.S., 2012 Data // All Industries, ComprehensiveISNetworld.com // Report No. 1302 41
Table 2: 2012 Injury and Illness Rates by ISN Work TypeInjuries and Illnesses [b] Fatalities [c] Severity [d]
ISN Work Type [a] Total Number of Employees
Total Number of Exposure
Hours(in 1,000s)
Total Recordable
Incident Rate (TRIR)
Nonfatal Total Recordable
Incident Rate (Nonfatal TRIR)
Days Away/ Restricted or Transfer Rate
(DART)
Total Number of Fatalities
Fatality Rate per 100,000
Workers
Incident Severity (In Days)
24.2.3 - Electrical 28,273 58,321 0.85 0.85 0.32 0 0.00 6.30
24.2.4 - Process 9,453 20,286 0.56 0.56 0.26 0 0.00 8.61
24.4 - Msc. Technical Services 6,939 13,853 0.61 0.61 0.32 0 0.00 15.04
25.0 - Labs/Cleanrooms 8,036 15,556 1.61 1.61 0.76 0 0.00 15.51
25.1 - Cleanroom Certifi cation 3,720 7,762 1.06 1.06 0.33 0 0.00 12.40
25.1.1 - Particle Counts 3,155 7,287 0.69 0.69 0.38 0 0.00 26.14
25.2 - Testing and Balancing 7,565 16,665 1.30 1.30 0.68 0 0.00 12.11 (10.67*)
25.3 - Contamination Control 4,828 10,157 1.04 1.04 0.67 0 0.00 35.10
25.4 - BioSafety Cabinet Certifi cation 3,164 7,314 0.68 0.68 0.41 0 0.00 30.10
25.5 - Cleanroom Installation 3,577 7,084 1.95 (1.68*) 1.95 (1.68*) 0.90 0 0.00 10.25
25.6 - Sampling Services 38,331 78,543 0.69 0.69 0.35 0 0.00 11.22
25.8 - Lab Instruments 12,365 24,321 0.95 0.95 0.50 0 0.00 7.78
26.0 - Energy 14,225 32,179 1.52 1.52 0.76 0 0.00 11.30
26.1 - Electrical Generation 36,872 76,623 1.02 1.02 0.47 1 2.61 8.66
26.2 - Steam Generation 13,486 27,127 1.02 1.02 0.46 0 0.00 9.63
27.0 - Heavy Equipment 114,946 264,685 1.54 1.53 0.74 2 1.51 13.08
27.1 - Sales 16,437 33,233 5.04 5.04 2.06 1 6.02 6.47
27.2 - Service/Repair 33,351 69,809 3.48 3.48 1.53 0 0.00 6.97
27.2.1 - Shatterproof Windows 1,945 3,893 4.68 4.68 1.95 0 0.00 6.54
27.3 - Operation 98,606 231,954 1.55 1.54 0.83 3 2.59 16.46
27.4 - Rentals 21,421 47,006 4.00 4.00 1.74 0 0.00 7.25
27.5 - Inspection 14,993 32,774 2.95 2.95 1.32 0 0.00 8.12
28.0 - Fixed Cranes 31,236 67,044 1.63 1.62 0.87 1 2.98 12.36
28.1 - Rentals 3,043 6,679 2.96 2.96 2.01 0 0.00 14.24
28.1.1 - Overhead and Gantry 3,050 6,912 3.53 3.53 2.11 0 0.00 12.22
28.1.2 - Rentals - Tower 467 970 1.44 (1.25*) 1.44 (1.25*) 1.24 (1.04*) 0 0.00 26.14
28.2 - Operator/Rigger 16,951 36,990 1.61 1.60 0.85 2 10.81 11.08
28.2.1 - Operator/Rigger - Overhead & Gantry 9,834 21,466 2.00 2.00 1.06 0 0.00 8.46
28.2.2 - Operator/Rigger - Tower 5,458 12,823† 1.05 1.05 0.34 0 0.00 3.39
28.2.3 - Operator/Rigger - Derrick 8,839 19,652 1.05 1.04 0.45 1 10.18 7.32 (5.73*)
28.3 - Service / Repair 6,996 15,368 2.07 2.06 1.43 1 13.01 12.21
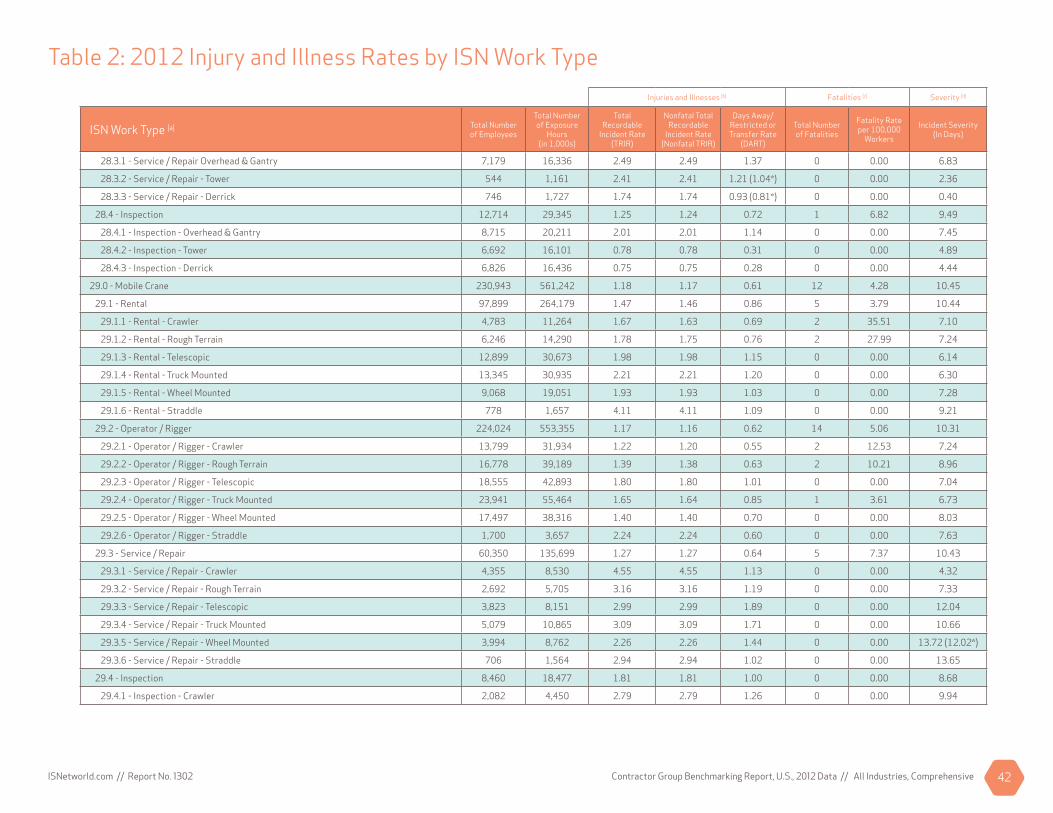
Contractor Group Benchmarking Report, U.S., 2012 Data // All Industries, ComprehensiveISNetworld.com // Report No. 1302 42
Table 2: 2012 Injury and Illness Rates by ISN Work TypeInjuries and Illnesses [b] Fatalities [c] Severity [d]
ISN Work Type [a] Total Number of Employees
Total Number of Exposure
Hours(in 1,000s)
Total Recordable
Incident Rate (TRIR)
Nonfatal Total Recordable
Incident Rate (Nonfatal TRIR)
Days Away/ Restricted or Transfer Rate
(DART)
Total Number of Fatalities
Fatality Rate per 100,000
Workers
Incident Severity (In Days)
28.3.1 - Service / Repair Overhead & Gantry 7,179 16,336 2.49 2.49 1.37 0 0.00 6.83
28.3.2 - Service / Repair - Tower 544 1,161 2.41 2.41 1.21 (1.04*) 0 0.00 2.36
28.3.3 - Service / Repair - Derrick 746 1,727 1.74 1.74 0.93 (0.81*) 0 0.00 0.40
28.4 - Inspection 12,714 29,345 1.25 1.24 0.72 1 6.82 9.49
28.4.1 - Inspection - Overhead & Gantry 8,715 20,211 2.01 2.01 1.14 0 0.00 7.45
28.4.2 - Inspection - Tower 6,692 16,101 0.78 0.78 0.31 0 0.00 4.89
28.4.3 - Inspection - Derrick 6,826 16,436 0.75 0.75 0.28 0 0.00 4.44
29.0 - Mobile Crane 230,943 561,242 1.18 1.17 0.61 12 4.28 10.45
29.1 - Rental 97,899 264,179 1.47 1.46 0.86 5 3.79 10.44
29.1.1 - Rental - Crawler 4,783 11,264 1.67 1.63 0.69 2 35.51 7.10
29.1.2 - Rental - Rough Terrain 6,246 14,290 1.78 1.75 0.76 2 27.99 7.24
29.1.3 - Rental - Telescopic 12,899 30,673 1.98 1.98 1.15 0 0.00 6.14
29.1.4 - Rental - Truck Mounted 13,345 30,935 2.21 2.21 1.20 0 0.00 6.30
29.1.5 - Rental - Wheel Mounted 9,068 19,051 1.93 1.93 1.03 0 0.00 7.28
29.1.6 - Rental - Straddle 778 1,657 4.11 4.11 1.09 0 0.00 9.21
29.2 - Operator / Rigger 224,024 553,355 1.17 1.16 0.62 14 5.06 10.31
29.2.1 - Operator / Rigger - Crawler 13,799 31,934 1.22 1.20 0.55 2 12.53 7.24
29.2.2 - Operator / Rigger - Rough Terrain 16,778 39,189 1.39 1.38 0.63 2 10.21 8.96
29.2.3 - Operator / Rigger - Telescopic 18,555 42,893 1.80 1.80 1.01 0 0.00 7.04
29.2.4 - Operator / Rigger - Truck Mounted 23,941 55,464 1.65 1.64 0.85 1 3.61 6.73
29.2.5 - Operator / Rigger - Wheel Mounted 17,497 38,316 1.40 1.40 0.70 0 0.00 8.03
29.2.6 - Operator / Rigger - Straddle 1,700 3,657 2.24 2.24 0.60 0 0.00 7.63
29.3 - Service / Repair 60,350 135,699 1.27 1.27 0.64 5 7.37 10.43
29.3.1 - Service / Repair - Crawler 4,355 8,530 4.55 4.55 1.13 0 0.00 4.32
29.3.2 - Service / Repair - Rough Terrain 2,692 5,705 3.16 3.16 1.19 0 0.00 7.33
29.3.3 - Service / Repair - Telescopic 3,823 8,151 2.99 2.99 1.89 0 0.00 12.04
29.3.4 - Service / Repair - Truck Mounted 5,079 10,865 3.09 3.09 1.71 0 0.00 10.66
29.3.5 - Service / Repair - Wheel Mounted 3,994 8,762 2.26 2.26 1.44 0 0.00 13.72 (12.02*)
29.3.6 - Service / Repair - Straddle 706 1,564 2.94 2.94 1.02 0 0.00 13.65
29.4 - Inspection 8,460 18,477 1.81 1.81 1.00 0 0.00 8.68
29.4.1 - Inspection - Crawler 2,082 4,450 2.79 2.79 1.26 0 0.00 9.94
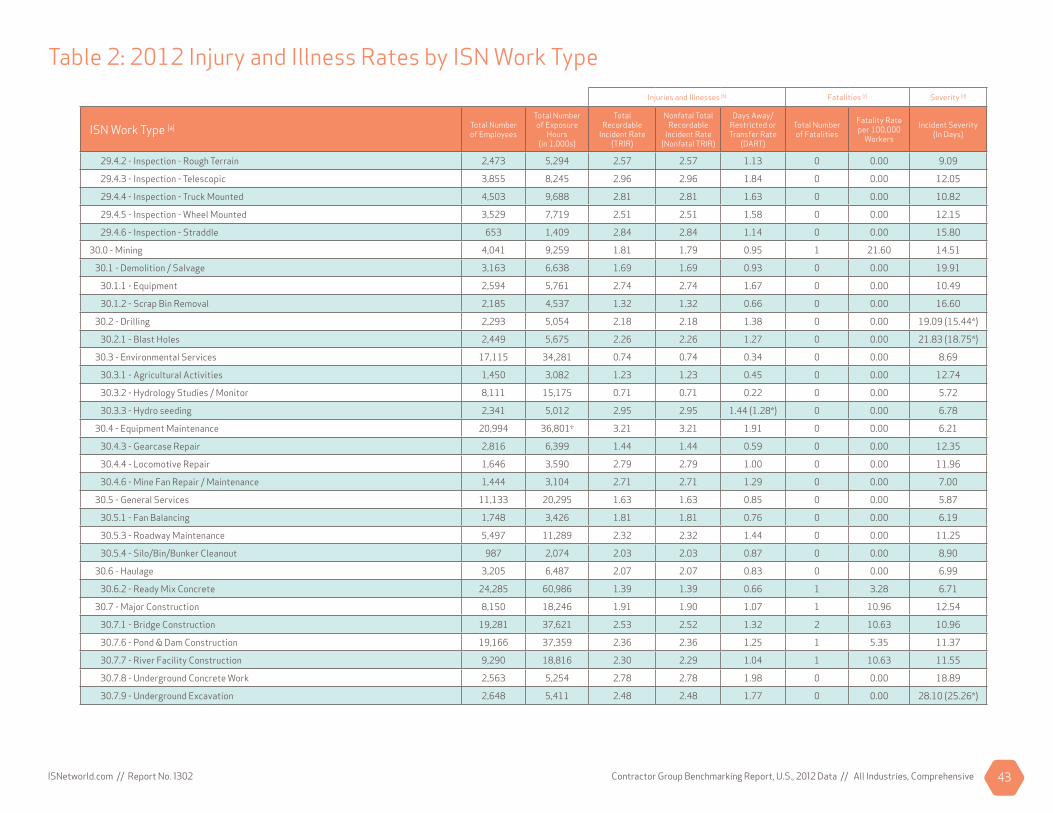
Contractor Group Benchmarking Report, U.S., 2012 Data // All Industries, ComprehensiveISNetworld.com // Report No. 1302 43
Table 2: 2012 Injury and Illness Rates by ISN Work TypeInjuries and Illnesses [b] Fatalities [c] Severity [d]
ISN Work Type [a] Total Number of Employees
Total Number of Exposure
Hours(in 1,000s)
Total Recordable
Incident Rate (TRIR)
Nonfatal Total Recordable
Incident Rate (Nonfatal TRIR)
Days Away/ Restricted or Transfer Rate
(DART)
Total Number of Fatalities
Fatality Rate per 100,000
Workers
Incident Severity (In Days)
29.4.2 - Inspection - Rough Terrain 2,473 5,294 2.57 2.57 1.13 0 0.00 9.09
29.4.3 - Inspection - Telescopic 3,855 8,245 2.96 2.96 1.84 0 0.00 12.05
29.4.4 - Inspection - Truck Mounted 4,503 9,688 2.81 2.81 1.63 0 0.00 10.82
29.4.5 - Inspection - Wheel Mounted 3,529 7,719 2.51 2.51 1.58 0 0.00 12.15
29.4.6 - Inspection - Straddle 653 1,409 2.84 2.84 1.14 0 0.00 15.80
30.0 - Mining 4,041 9,259 1.81 1.79 0.95 1 21.60 14.51
30.1 - Demolition / Salvage 3,163 6,638 1.69 1.69 0.93 0 0.00 19.91
30.1.1 - Equipment 2,594 5,761 2.74 2.74 1.67 0 0.00 10.49
30.1.2 - Scrap Bin Removal 2,185 4,537 1.32 1.32 0.66 0 0.00 16.60
30.2 - Drilling 2,293 5,054 2.18 2.18 1.38 0 0.00 19.09 (15.44*)
30.2.1 - Blast Holes 2,449 5,675 2.26 2.26 1.27 0 0.00 21.83 (18.75*)
30.3 - Environmental Services 17,115 34,281 0.74 0.74 0.34 0 0.00 8.69
30.3.1 - Agricultural Activities 1,450 3,082 1.23 1.23 0.45 0 0.00 12.74
30.3.2 - Hydrology Studies / Monitor 8,111 15,175 0.71 0.71 0.22 0 0.00 5.72
30.3.3 - Hydro seeding 2,341 5,012 2.95 2.95 1.44 (1.28*) 0 0.00 6.78
30.4 - Equipment Maintenance 20,994 36,801† 3.21 3.21 1.91 0 0.00 6.21
30.4.3 - Gearcase Repair 2,816 6,399 1.44 1.44 0.59 0 0.00 12.35
30.4.4 - Locomotive Repair 1,646 3,590 2.79 2.79 1.00 0 0.00 11.96
30.4.6 - Mine Fan Repair / Maintenance 1,444 3,104 2.71 2.71 1.29 0 0.00 7.00
30.5 - General Services 11,133 20,295 1.63 1.63 0.85 0 0.00 5.87
30.5.1 - Fan Balancing 1,748 3,426 1.81 1.81 0.76 0 0.00 6.19
30.5.3 - Roadway Maintenance 5,497 11,289 2.32 2.32 1.44 0 0.00 11.25
30.5.4 - Silo/Bin/Bunker Cleanout 987 2,074 2.03 2.03 0.87 0 0.00 8.90
30.6 - Haulage 3,205 6,487 2.07 2.07 0.83 0 0.00 6.99
30.6.2 - Ready Mix Concrete 24,285 60,986 1.39 1.39 0.66 1 3.28 6.71
30.7 - Major Construction 8,150 18,246 1.91 1.90 1.07 1 10.96 12.54
30.7.1 - Bridge Construction 19,281 37,621 2.53 2.52 1.32 2 10.63 10.96
30.7.6 - Pond & Dam Construction 19,166 37,359 2.36 2.36 1.25 1 5.35 11.37
30.7.7 - River Facility Construction 9,290 18,816 2.30 2.29 1.04 1 10.63 11.55
30.7.8 - Underground Concrete Work 2,563 5,254 2.78 2.78 1.98 0 0.00 18.89
30.7.9 - Underground Excavation 2,648 5,411 2.48 2.48 1.77 0 0.00 28.10 (25.26*)
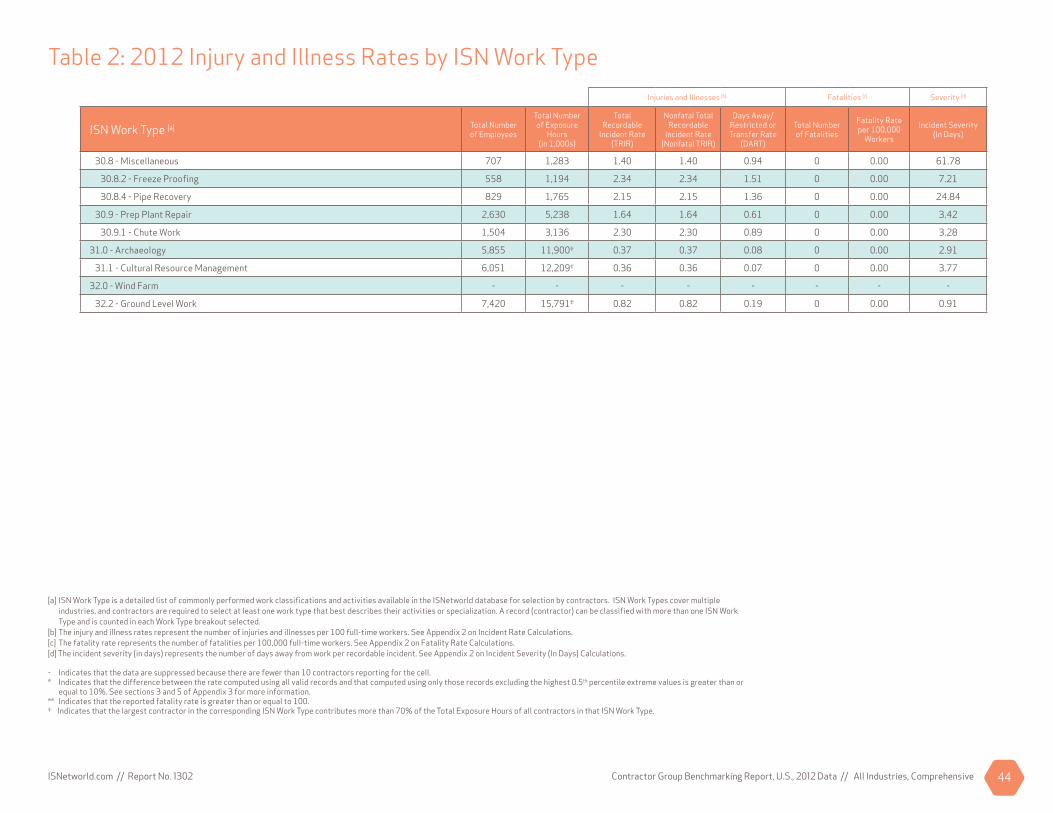
Contractor Group Benchmarking Report, U.S., 2012 Data // All Industries, ComprehensiveISNetworld.com // Report No. 1302 44
[a] ISN Work Type is a detailed list of commonly performed work classifi cations and activities available in the ISNetworld database for selection by contractors. ISN Work Types cover multiple industries, and contractors are required to select at least one work type that best describes their activities or specialization. A record (contractor) can be classifi ed with more than one ISN Work Type and is counted in each Work Type breakout selected.
[b] The injury and illness rates represent the number of injuries and illnesses per 100 full-time workers. See Appendix 2 on Incident Rate Calculations. [c] The fatality rate represents the number of fatalities per 100,000 full-time workers. See Appendix 2 on Fatality Rate Calculations.[d] The incident severity (in days) represents the number of days away from work per recordable incident. See Appendix 2 on Incident Severity (In Days) Calculations.
- Indicates that the data are suppressed because there are fewer than 10 contractors reporting for the cell.* Indicates that the difference between the rate computed using all valid records and that computed using only those records excluding the highest 0.5th percentile extreme values is greater than or equal to 10%. See sections 3 and 5 of Appendix 3 for more information.** Indicates that the reported fatality rate is greater than or equal to 100.† Indicates that the largest contractor in the corresponding ISN Work Type contributes more than 70% of the Total Exposure Hours of all contractors in that ISN Work Type.
Table 2: 2012 Injury and Illness Rates by ISN Work TypeInjuries and Illnesses [b] Fatalities [c] Severity [d]
ISN Work Type [a] Total Number of Employees
Total Number of Exposure
Hours(in 1,000s)
Total Recordable
Incident Rate (TRIR)
Nonfatal Total Recordable
Incident Rate (Nonfatal TRIR)
Days Away/ Restricted or Transfer Rate
(DART)
Total Number of Fatalities
Fatality Rate per 100,000
Workers
Incident Severity (In Days)
30.8 - Miscellaneous 707 1,283 1.40 1.40 0.94 0 0.00 61.78
30.8.2 - Freeze Proofi ng 558 1,194 2.34 2.34 1.51 0 0.00 7.21
30.8.4 - Pipe Recovery 829 1,765 2.15 2.15 1.36 0 0.00 24.84
30.9 - Prep Plant Repair 2,630 5,238 1.64 1.64 0.61 0 0.00 3.42
30.9.1 - Chute Work 1,504 3,136 2.30 2.30 0.89 0 0.00 3.28
31.0 - Archaeology 5,855 11,900† 0.37 0.37 0.08 0 0.00 2.91
31.1 - Cultural Resource Management 6,051 12,209† 0.36 0.36 0.07 0 0.00 3.77
32.0 - Wind Farm - - - - - - - -
32.2 - Ground Level Work 7,420 15,791† 0.82 0.82 0.19 0 0.00 0.91

Contractor Group Benchmarking Report, U.S., 2012 Data // All Industries, ComprehensiveISNetworld.com // Report No. 1302 45
1 http://www.census.gov/naics2 ISNetworld.com 3 http://www.osha.gov/pls/oshaweb/owastand.display_standard_group?p_toc_level=1&p_part_number=1904
Appendix 1: Definitions
North American Industry Classification System (NAICS) Code: The standard statistical classification codes underlying all establishment-based Federal economic statistics, classified by industry for the United States, Mexico and Canada. Under NAICS, a specific industry is represented by a two, three, four, five or six-digit numeric code. See the U.S. Census Bureau’s NAICS Web site1 for more information.
ISN Work Type: A detailed list of commonly performed work classifications and activities available in the ISNetworld2 database for selection by contractors. ISN Work Types cover multiple industries, and contractors are required to select at least one work type that best describes their activities or specialization.
Recordable Injury and Illness: An occupational injury or illness that requires medical treatment more than simple first aid and must be recorded and reported under the U.S. Occupational Safety and Health Administration (OSHA) recordkeeping requirements. See 29 CFR Part 19043 for OSHA recordkeeping requirements and definitions.
Days Away Injury and Illness: A recordable injury or illness resulting in one or more days away from work.
Restricted Activity Injury and Illness: A recordable injury or illness resulting in restrictions or limitations on an injured worker’s work activities.
Job Transfer Injury and Illness: A recordable injury or illness necessitating the transfer of an injured worker to a different job.
Incident Severity (In Days): Average number of days away from work as a result of each record able injury or illness.
1.
2.
3.
4.
5.
6.
7.
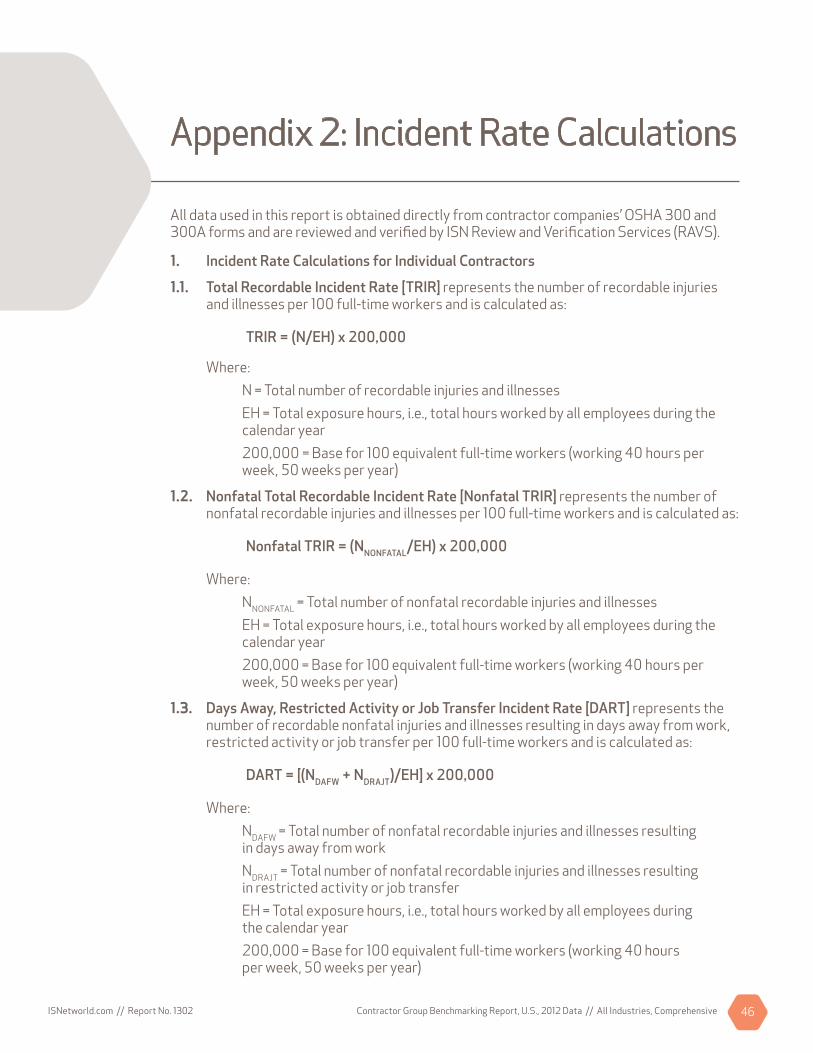
Contractor Group Benchmarking Report, U.S., 2012 Data // All Industries, ComprehensiveISNetworld.com // Report No. 1302 46
All data used in this report is obtained directly from contractor companies’ OSHA 300 and 300A forms and are reviewed and verified by ISN Review and Verification Services (RAVS).
1. Incident Rate Calculations for Individual Contractors
1.1. Total Recordable Incident Rate [TRIR] represents the number of recordable injuries and illnesses per 100 full-time workers and is calculated as:
TRIR = (N/EH) x 200,000
Where:N = Total number of recordable injuries and illnessesEH = Total exposure hours, i.e., total hours worked by all employees during the calendar year200,000 = Base for 100 equivalent full-time workers (working 40 hours per week, 50 weeks per year)
1.2. Nonfatal Total Recordable Incident Rate [Nonfatal TRIR] represents the number of nonfatal recordable injuries and illnesses per 100 full-time workers and is calculated as:
Nonfatal TRIR = (NNONFATAL/EH) x 200,000
Where: NNONFATAL = Total number of nonfatal recordable injuries and illnessesEH = Total exposure hours, i.e., total hours worked by all employees during the calendar year200,000 = Base for 100 equivalent full-time workers (working 40 hours per week, 50 weeks per year)
1.3. Days Away, Restricted Activity or Job Transfer Incident Rate [DART] represents the number of recordable nonfatal injuries and illnesses resulting in days away from work, restricted activity or job transfer per 100 full-time workers and is calculated as:
DART = [(NDAFW + NDRAJT)/EH] x 200,000
Where:NDAFW = Total number of nonfatal recordable injuries and illnesses resulting in days away from workNDRAJT = Total number of nonfatal recordable injuries and illnesses resulting in restricted activity or job transferEH = Total exposure hours, i.e., total hours worked by all employees during the calendar year200,000 = Base for 100 equivalent full-time workers (working 40 hours per week, 50 weeks per year)
Appendix 2: Incident Rate Calculations

Contractor Group Benchmarking Report, U.S., 2012 Data // All Industries, ComprehensiveISNetworld.com // Report No. 1302 47
4 Includes only the injuries and illnesses used to calculate the specified rate: for TRIR, N is the total number of injuries and illnesses; for Nonfatal TRIR, N is the total number of nonfatal injuries and illnesses; for DART, N is the total number of nonfatal injuries and illnesses resulting in days away from work plus the total number of nonfatal injuries and illnesses resulting in restricted activity or job transfer; for Fatality Rate, N is the total number of fatal work injuries.
1.4. Fatality Rate represents the number of fatal work injuries per 100,000 full-time workers and is calculated as:
Fatality Rate = (NFATAL/EH) x 200,000,000
Where:
NFATAL = Total number of fatal work injuries
EH = Total exposure hours, i.e., total hours worked by all employees during the calendar year
200,000,000 = Base for 100,000 equivalent full-time workers (working 40 hours per week, 50 weeks per year)
1.5. Incident Severity (In Days) represents the number of days away from work per recordable incident and is calculated as:
Incident Severity (In Days) = (NDAYS/N)
Where:
NDAYS = Total number of days away from work
N = Total number of recordable injuries and illnesses
2. Incident Rate Calculations for Groups of Contractors (for a NAICS code or ISN Work Type Group)
2.1. TRIR, Nonfatal TRIR, DART, and Fatality Rate are calculated by summing the exposure hours and numbers of injuries and illnesses across all contractors in the group before computing the rate. The calculation for a group of contractors will be:
RATE = (�i N/ �i EH) x BASE INTEGER
Where:
RATE = one of the four rates presented above: TRIR, Nonfatal TRIR, DART, or Fatality Rate. Represents an exposure hour weighted rate.
∑iN=N1+ N2+...+Nn, where N4 is equal to the total number of recordable injuries and illnesses for a contractor, and the summation formula is the sum of the values of the n contractors in the group (i.e., the sum of the total number of recordable injuries and illnesses across all contractors in the group).
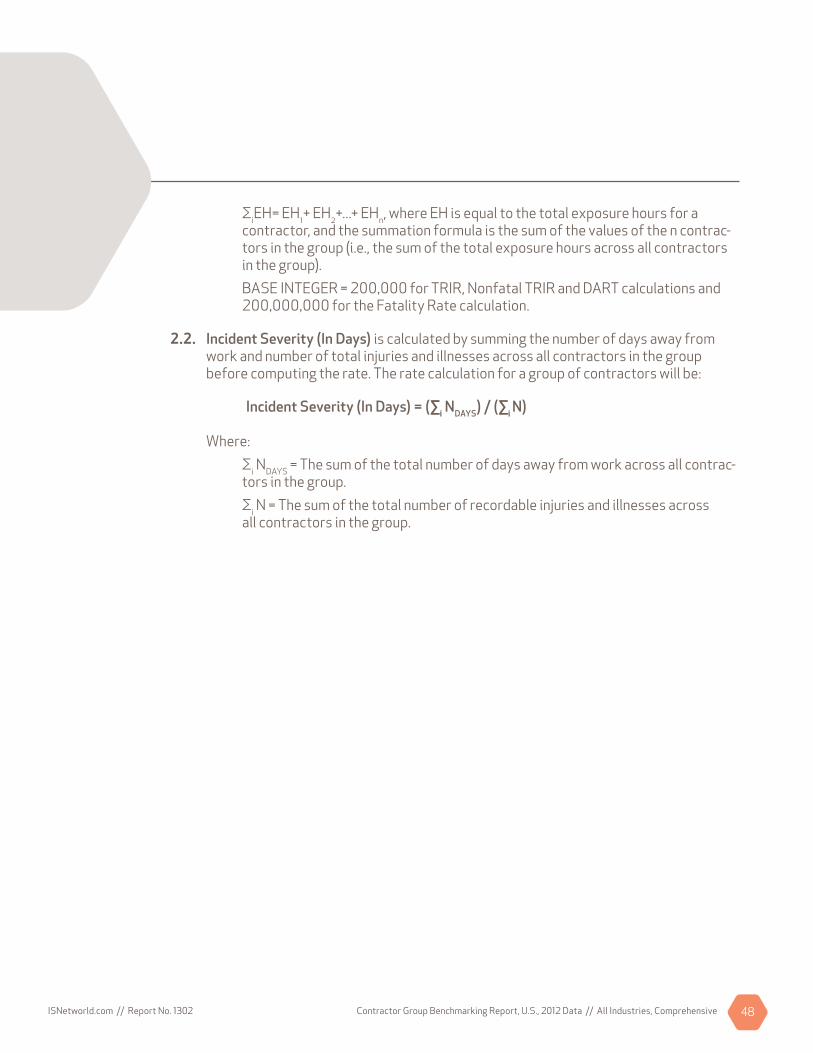
Contractor Group Benchmarking Report, U.S., 2012 Data // All Industries, ComprehensiveISNetworld.com // Report No. 1302 48
∑iEH= EH1+ EH2+...+ EHn, where EH is equal to the total exposure hours for a contractor, and the summation formula is the sum of the values of the n contrac-tors in the group (i.e., the sum of the total exposure hours across all contractors in the group).
BASE INTEGER = 200,000 for TRIR, Nonfatal TRIR and DART calculations and 200,000,000 for the Fatality Rate calculation.
2.2. Incident Severity (In Days) is calculated by summing the number of days away from work and number of total injuries and illnesses across all contractors in the group before computing the rate. The rate calculation for a group of contractors will be:
Incident Severity (In Days) = (�i NDAYS) / (�i N)
Where:
∑i NDAYS = The sum of the total number of days away from work across all contrac-tors in the group.
∑i N = The sum of the total number of recordable injuries and illnesses across all contractors in the group.
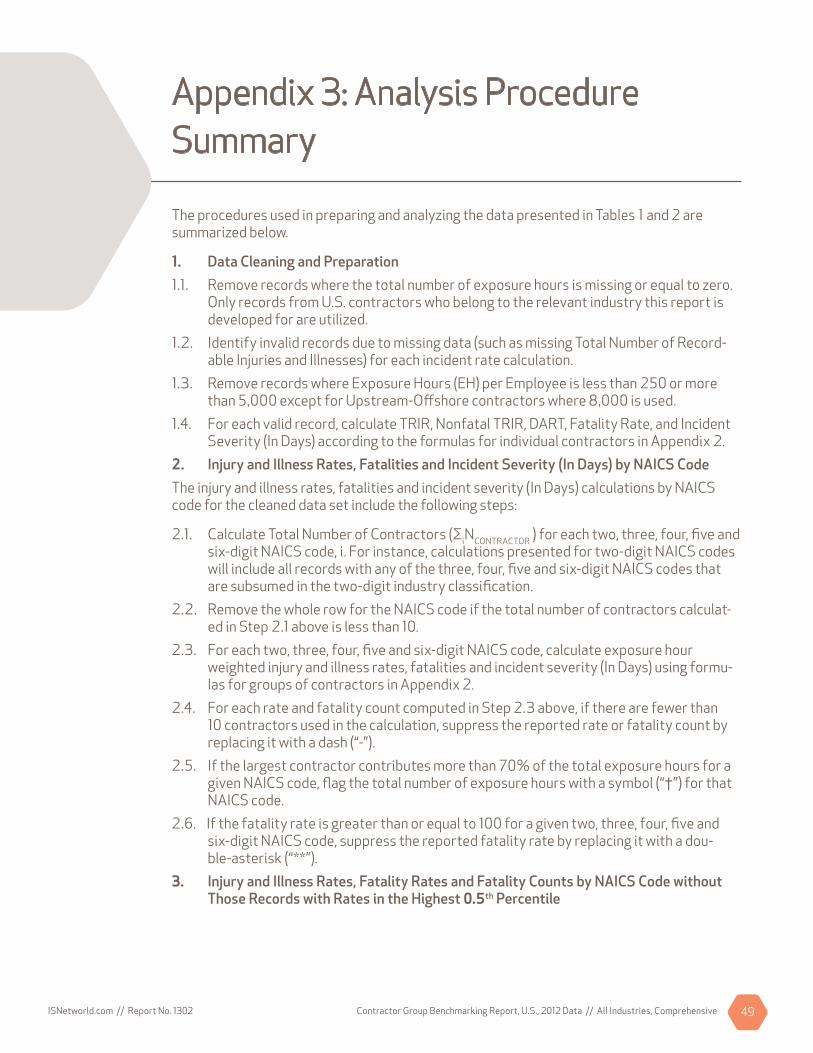
Contractor Group Benchmarking Report, U.S., 2012 Data // All Industries, ComprehensiveISNetworld.com // Report No. 1302 49
Appendix 3: Analysis Procedure Summary
The procedures used in preparing and analyzing the data presented in Tables 1 and 2 are summarized below.
1. Data Cleaning and Preparation1.1. Remove records where the total number of exposure hours is missing or equal to zero.
Only records from U.S. contractors who belong to the relevant industry this report is developed for are utilized.
1.2. Identify invalid records due to missing data (such as missing Total Number of Record-able Injuries and Illnesses) for each incident rate calculation.
1.3. Remove records where Exposure Hours (EH) per Employee is less than 250 or more than 5,000 except for Upstream-Offshore contractors where 8,000 is used.
1.4. For each valid record, calculate TRIR, Nonfatal TRIR, DART, Fatality Rate, and Incident Severity (In Days) according to the formulas for individual contractors in Appendix 2.
2. Injury and Illness Rates, Fatalities and Incident Severity (In Days) by NAICS CodeThe injury and illness rates, fatalities and incident severity (In Days) calculations by NAICS code for the cleaned data set include the following steps:
2.1. Calculate Total Number of Contractors (∑iNCONTRACTOR ) for each two, three, four, five and six-digit NAICS code, i. For instance, calculations presented for two-digit NAICS codes will include all records with any of the three, four, five and six-digit NAICS codes that are subsumed in the two-digit industry classification.
2.2. Remove the whole row for the NAICS code if the total number of contractors calculat-ed in Step 2.1 above is less than 10.
2.3. For each two, three, four, five and six-digit NAICS code, calculate exposure hour weighted injury and illness rates, fatalities and incident severity (In Days) using formu-las for groups of contractors in Appendix 2.
2.4. For each rate and fatality count computed in Step 2.3 above, if there are fewer than 10 contractors used in the calculation, suppress the reported rate or fatality count by replacing it with a dash (“-”).
2.5. If the largest contractor contributes more than 70% of the total exposure hours for a given NAICS code, flag the total number of exposure hours with a symbol (“†”) for that NAICS code.
2.6. If the fatality rate is greater than or equal to 100 for a given two, three, four, five and six-digit NAICS code, suppress the reported fatality rate by replacing it with a dou-ble-asterisk (“**”).
3. Injury and Illness Rates, Fatality Rates and Fatality Counts by NAICS Code without Those Records with Rates in the Highest 0.5th Percentile

Contractor Group Benchmarking Report, U.S., 2012 Data // All Industries, ComprehensiveISNetworld.com // Report No. 1302 50
When the number of records for a given NAICS code is small, extreme observations may unduly influence the reported rates and counts. Thus, Tables 1 and 2 also include the results of a sensitivity analysis conducted to evaluate the effect of those records with rates in the highest 0.5th percentile. The analysis steps include the following:
3.1. For each rate computed previously in Step 1, calculate rates for each NAICS Code by excluding contractors that are in the highest 0.5th percentile of the entire dataset using the steps outlined in Step 2.
3.2. Calculate the percentage difference between the injury and illness rate from Step 2.3 and 3.1 for each two, three, four, five and six-digit NAICS code.
3.3. Identify those rates that show a 10 percent or greater difference with an asterisk (“*”). For example, a table entry of 2.3 (1.8*) implies that 2.3 is the rate calculated with the entire dataset considered; 1.8 is the rate calculated with the highest 0.5th percentile extreme values removed; the difference between 2.3 and 1.8 is greater than or equal to 10 percent.
4. Injury and Illness Rates, Fatalities and Incident Severity (In Days) by ISN Work TypeThe injury and illness rates, fatalities and incident severity (In Days) calculations by ISN Work Type for the cleaned data set include the following steps:
4.1. Calculate Total Number of Contractors (∑jNCONTRACTOR ) for each ISN Work Type, j. This is simply a count of the number of contractors that fall into the work type designation. A contractor can be categorized as more than one work type and thus may be included in the counts for numerous work types. However, unlike the calculations for NAICS codes, higher level work types do not include contractors at a more disaggregated level. For example, calculations presented for work type 1.0 – General Contractor do not include records in any of the work types at a lower level (e.g. 1.0.1 – Turnaround or 1.0.2 – Rou-tine Maintenance).
4.2. Remove the whole row for the work type if the total number of contractors calculated in Step 4.1 above is fewer than 10, unless the work type has sub-work types with greater than or equal to 10 contractors.
4.3. For each ISN work type, calculate exposure hour weighted injury and illness rates, fatalities and incident severity (In Days) using formulas for groups of contractors in Appendix 2.
4.4. For each rate and fatality count computed in Step 4.3, if there are fewer than 10 contractors used in the calculation, suppress the reported rate or fatality count by replacing it with a dash (“-”).
4.5. If the largest contractor contributes more than 70% of the total exposure hours for a given ISN work type, flag the total number of exposure hours with a symbol (“†”) for that ISN work type.
4.6. If the fatality rate is greater than or equal to 100 for a given ISN work type, suppress the reported fatality rate by replacing it with a double-asterisk (“**”).

Contractor Group Benchmarking Report, U.S., 2012 Data // All Industries, ComprehensiveISNetworld.com // Report No. 1302 51
5. Injury and Illness Rates, Fatality Rates and Fatality Counts by ISN Work Type without Those Records with Rates in the Highest 0.5th Percentile
When the number of records for a given ISN work type is small, extreme observations may unduly influence the reported rates and counts. Thus, Tables 1 and 2 also include the results of a sensitivity analysis conducted to evaluate the effect of those records with rates in the highest 0.5th percentile. The analysis steps include the following:
5.1. For each rate computed previously in Step 1, calculate rates for each ISN Work Type by excluding contractors that are in the highest 0.5th percentile of the entire dataset using the steps outlined in Step 4.
5.2. Calculate the percentage difference between the injury and illness rate from Step 4.3 and 5.1 for each ISN Work Type.
5.3. Identify those rates that show a 10 percent or greater difference with an asterisk (“*”). For example, a table entry of 2.3 (1.8*) implies that 2.3 is the rate calculated with the entire dataset considered; 1.8 is the rate calculated with the highest 0.5th percentile extreme values removed; the difference between 2.3 and 1.8 is greater than or equal to 10 percent.
Copyright © 2013 ISN Software Corporation. All rights reserved.
Health & Safety Performance Indicators Contractor Group Benchmarking , U.S. All Industries, Comprehensive
2012 Data
An ISN Publication: No. 1302 September 2013
ISN®, ISNetworld®, RAVS® and the ISN hexagon logo® are registered trademarks of ISN Software Corporation (ISN).
The contents of this publication and analysis methods are exclusively owned by ISN Software Corporation and are protected by United States and international copyright law. This publication is intended solely for access and internal use by actively subscribed ISNetworld subscribing organizations and their active employees unless otherwise stipulated. No part of this publication may be (i) reproduced, distributed, displayed, stored in a retrieval system, or transmitted in any form or by any means, electronic, mechan-ical, photocopying, recording, or otherwise, (ii) sold or distributed for financial or other gain, or (iii) used for any other purpose than expressly set forth above without the prior written permission of ISN Software Corporation. Any trademark, copyright or other notice included in this publication may not be altered or removed.

For more information, contact ISN at +1 214 303 4900 or email [email protected]. ISNetworld.com
For questions, suggestions or additional information about this publication or ISN in general, contact ISN at 1-800-976-1303 or email [email protected].
ISNISNetworld.com
© 2013 ISN Software Corporation