female life expectancy, gender stratification, health status, and level … · 2011-01-14 ·...
TRANSCRIPT

Pergamon
PII: S0277-9536(96)00346-2
Soc. Sci. Med. Vol. 45, No. 2, pp. 305-317, 1997 © 1997 Elsevier Science Ltd
All rights reserved. Printed in Great Britain 0277-9536/97 $17.00 + 0.00
FEMALE LIFE EXPECTANCY, GENDER STRATIFICATION, HEALTH STATUS, AND LEVEL OF ECONOMIC
DEVELOPMENT: A CROSS-NATIONAL STUDY OF LESS DEVELOPED COUNTRIES
J O H N B. W I L L I A M S O N and U L R I K E B O E H M E R
Department of Sociology, Boston College, Chestnut Hill, MA 02167, U.S.A.
Abstract--A number of studies have attempted to account for cross-national differences in life expect- ancy, but relatively few have focused on female life expectancy, and even fewer on the relevance of pre- dictors linked to gender stratification theory. The present study seeks to assess the utility of gender stratification theory in accounting for cross-national differences in female life expectancy in less devel- oped countries. An incremental model building strategy is used to develop a final model that combines predictors linked to both industrialism theory and gender stratification theory. The analysis is based on multiple regression and cross-sectional samples that vary in size from 40 to 97 countries. Evidence is presented that several aspects of women's status have a positive effect on female life expectancy. Indi- cators of women's educational status, women'~ economic status, and women's reproductive autonomy all prove to be important predictors of female life expectancy. Analysis of interaction effects suggests that the strength of the effects of some aspects of women's economic status and the effect of some aspects of health status on female life expectancy vary with the level of economic development. A com- prehensive assessment of the relative strength of alternative measures of women's education is carried out, and evidence is presented that it does make a difference how the level of women's education is measured. © 1997 Elsevier Science Ltd
Key words life expectancy, mortality, women's status, education, gender inequality
INTRODUCTION
In recent years many studies have attempted to account for cross-national differences in life expect- ancy. Most focus on a measure that averages ~:he results for both genders (Lena and London, 1995; Hertz et al., 1994; Rogers and Wofford, 1989; Pendleton and Yang, 1985; Rodgers, 1979). However, even those that at tempt to account for differences in female life expectancy generally emphasize predictors linked to industrialism theory to the exclusion of those linked to gender stratifica- tion theory (Kattler and Williamson, 1988; Manton, 1984; Preston, 1975). Studies that make an effort to consider predictors linked to gender stratification theory, with few exceptions (Hunter, 1990), consider only one dimension of gender stratification, female education (Murray, 1987). No prior studies provide a detailed assessment of the relative importance of different dimensions of female education, nor do any such studies present detailed assessments of the relevance of a range of different dimensions of women's status.
In the present study we assess the impact of sev- eral different dimensions of women's status on female life expectancy using models that combine variables derived from industrialism theory with variables derived from a gender stratification per- spective. In our analysis of the relevance of female
education we consider a variety of different ways to operationalize the concept and find important differences in results depending on which alternative is selected. Because we view women's status as multidimensional, we also consider a number o f dimensions of women's status other than women's education, the most commonly used indicator of women's status.
THEORETICAL BACKGROUND
Industr ial ism theory
Many prior studies have emphasized predictors and explanations linked to industrialism theory. This theory specifies that the transition from a lower level of development to a higher level of development will be achieved when a country undergoes a number of structural changes linked to the process of industrialization (Wilensky, 1975; Wilensky and Lebeaux, 1965; Kerr et al., 1960). A higher level of economic development leads to an improved standard of living with better nutrition and advanced medical technology. Studies in this tradition commonly use variables such as percent urban, school enrollment (or some other education measure), and G D P per capita (Tolnay and Christenson, 1984; Brazzell and Gillespie, 1981; Van de Walle and Knodel, 1980). Theorists con-
305
306 John B. Williamson and Ulrike Boehmer
cerned with the status of women have been critical of much of the work in this theoretical tradition as it often omits any analysis of male/female differ- ences with respect to either the causes or the conse- quences of industrialization and economic development (Boserup, 1970 ; Ward, 1984; Hartmann, 1995).
Gender stratification theory
Theorists in the gender stratification theory tra- dition attempt to account for differences in privilege and power in society that are linked to inequality based on gender. Stratification based on gender shares some of the characteristics of other dimen- sions of inequality such as those based on class, caste and ethnicity. Gender stratification theorists point out that it is important to distinguish between measures of women's absolute status (such as female secondary school enrollment rate) and rela- tive status (such as ratio of female to male second- ary school enrollment rate). The relative status of women, the status women hold in comparison to men, is at the core of gender stratification theory (Mason, 1986). Although many dimensions of women's status and autonomy have been proposed in prior studies, it is possible, without doing too great an injustice to the literature, to group the var- ious indicators into four broad categories: (1) women's educational status, (2) women's political status, (3) women's economic status and (4) women's autonomy and independence. Each of these four areas are sites of construction and recon- struction of gender inequality in society. In the pre- sent study we consider indicators of women's status linked to each of these spheres.
Blumberg (1984) argues that women's economic power is the strongest predictor of women's overall
*The 97 countries in our sample can be grouped into the following five regions: (1) sub-Saharan Africa: Benin, Botswana, Burkina Faso, Burundi, Cameroon, Central African Republic, Chad, Congo, Cote d'Ivoire, Ethiopia, Ghana, Kenya, Lesotho, Madagascar, Malawi, Mali, Mauritania, Mauritius, Mozambique, Niger, Nigeria, Rwanda, Senegal, Sierra Leone, Tanzania, Togo, Uganda, Zambia, Zimbabwe; (2) East Asia, South Asia and Pacific: Bangladesh, Bhutan, China, India, Indonesia, Korea South Republic, Laos, Malaysia, Nepal, Pakistan, Papua New Guinea, Philippines, Sri Lanka, Thailand; (3) Europe and Central Asia: Armenia, Azerbaijan, Belarus, Bulgaria, Czechoslovakia, Estonia, Georgia, Greece, Hungary, Kazakhstan, Kyrgyzstan, Latvia, Lithuania, Moldova, Poland, Portugal, Romania, Russian Federation, Tajikistan, Turkey, Turkmenistan, Ukraine, Uzbekistan; (4) Middle East and North Africa: Algeria, Egypt Arabian Republic, Iran Islamic Republic, Jordan, Morocco, Oman, Saudi Arabia, Syrian Arab Republic, Tunisia; and (5) Americas: Argentina, Bolivia, Brazil, Chile, Colombia, Costa Rica, Dominican Republic, Ecuador, El Salvador, Guatemala, Haiti, Honduras, Jamaica, Mexico, Nicaragua, Panama, Paraguay, Peru, Puerto Rico, Trinidad and Tobago, Uruguay, Venezuela.
status. Prior research has established that the pro- cess of economic development has a profound impact on the economic status of women. In the less developed countries (LDCs) women often have less access than men to new economic resources as they become available in connection with the pro- cess of economic development. At the same time women often lose their traditional sources of econ- omic subsistence (Ward, 1983; Hartmann, 1995). Furthermore, recent studies suggest that the debt crisis in many LDCs often forces the government to implement structural adjustment policies which have different effects on women than on men (Sparr, 1994; Dalla Costa and Dalla Costa, 1995).
Caldwell's (1979) finding that mother's education is the single most important determinant of child survival has informed many studies of mortality and life expectancy. Caldwell (1979, 1986, 1993) suggests three reasons for the link. (1) With increas- ing education there tend to be changes in family roles giving women greater say with respect to the care of their children. (2) A more educated mother tends to be less fatalistic about her sick child. She tends to be more prone to seek medical treatment and more prone to make use of modern medical fa- cilities. (3) More highly educated mothers are gener- ally in a better position to demand the attention of health providers and more likely to ask for expla- nations as to the cause of a medical problem and what can be done to prevent it. Gender stratifica- tion theory suggests that such behavior would be even more likely in countries in which women have more autonomy, more political influence, and greater control over economic resources. Women who are in a position to control their reproductive lives, women who have access to good jobs, and women who have more autonomy and indepen- dence in the family, community, and nation are likely to live longer than women who are less empowered in these respects.
While the empirical literature links the absolute level of women's education to life expectancy and other measures of mortality, based on gender strati- fication theory there are theoretical reasons to believe that women's relative status as measured by the amount of education women have relative to the amount men have should also be an important predictor. As there tends to be a high correlation between women's and men's absolute education levels, evidence that a relative measure is an import- ant predictor of female life expectancy would offer stronger support for the gender stratification per- spective than would evidence pointing to the im- portance of the corresponding absolute measure.
METHODS
The sample for the present study is limited to the LDCs; it excludes the developed nations.* We have excluded the developed nations because we believe
Female life expectancy 307
the causal dynamics and models called for will dif- fer for those nations. We exclude the very small LDCs, those with 1991 populations of under one million (United Nations, 1992). For each model the sample is limited to those nations for which da,ta are available for both our dependent variable, female life expectancy, and the various predictors included. Had we limited all of our models to those countries for which we had no missing data for any of our variables, the sample would have been too small for multivariate analysis. To deal with this missing data problem we allow the sample size to vary from one model to another as a function of data availability; as a result the subsamples range in size from 40 to 97 countries. This has the advantage of making maximum use of the available data, but it also means that the reader must take into con- sideration this subsample variation when interpret- ing differences between models. In general when a model is based on a smaller sample, the poorer nations tend to be under sampled.
Our analysis is primarily based on cross-sectional multiple regression models in which we include at least 10 observations per predictor, To make 1:he most use of our data we have adopted an incremen- tal model building strategy. We begin with a model that includes just one predictor, level of econornic development. As we move through the paper we gradually increase the number of predictors included in our models. This allows us to assess and then set aside a number of potentially relewmt predictors that turn out to have weak effects in our preliminary models.
While the decision to exclude the developed nations from our sample does help reduce the l~et- erogeneity of our sample with respect to level of economic development, it still leaves a very wide range. In view of this, for all models presented we check for possible interaction between each predic- tor and our indicator of level of economic develop- ment. When we do find evidence of significant interaction, we evaluate the effect of specified l:.re- dictors at high, medium and low levels of economic development.
VARIABLE MEASUREMENT
Our dependent variable, female life expectanc) at birth, is taken from what we consider the best cur- rently available source (U.S. Bureau of the Census, 1994). Our measure of level of economic develop- ment (a variable linked to industrialism theory) is the logarithm of purchasing power of currencies estimates of gross domestic product per capita for 1991 (hereafter LGDP/C). This indicator is prefer- able to GDP per capita because it is based on an estimate of the goods and services a nation's GDP will buy when it is spent in the local economy instead of basing a country's GDP on the exchange rate of its currency to the U.S. dollar.
A major goal of this study is to present a detailed assessment of the relevance of predictors linked to gender stratification theory. We consider several in- dicators of women's status, many of which have been considered in prior studies. Rather than limit- ing our analysis to one or two of the strongest pre- dictors, we have decided to be more comprehensive; we include those used in prior studies as well as some new indicators that make sense to us. Using the typology mentioned earlier, the predictors we consider can be grouped into four categories: (1) measures of women's educational status, (2) measures of women's political status, (3) measures of women's economic status, and (4) measures of women's autonomy and independence.
We consider both absolute and relative measures of women's educational status. Our absolute measures are: female illiteracy (ILLITRCY-F), female primary school enrollment (EDUCI-F), and female secondary school enrollment (EDUC2-F). See Appendix A for the sources we have used and more information about these and all other vari- ables. Our r¢lative measures of women's educational status are based on a ratio of female to male enroll- ment at various educational levels. One measure is the ratio of female/male first level (primary school) education (EDUC1-F/M), a second is the ratio of female/male second level (secondary school) edu- cation (EDUC2-F/M), a third is the ratio of female/male third level (post-secondary school) edu- cation (EDUC3-F/M) and a fourth is the ratio of female to male total years of schooling (YRS- SCHL-F/M).
We measure female autonomy using four quite different indicators. One is a general measure of women's autonomy (GENDER-EQU); it is based on many factors including level of women's legal equality and equality in the family. Nations with greater gender equality score high on this indicator. Our second measure is average age at first marriage for women (AGE-MARRIED). Our argument is that women generally have less autonomy in those societies in which women marry early. As a third measure of women's autonomy we use contracep- tive prevalence (CONTRACPTN). We view this measure as an indicator of women's control over their reproductive behavior. Our argument is that contraceptive usage tends to be higher in those so- cieties in which women have more autonomy. Control over reproductive behavior is a particularly important domain of autonomy for women, and there is unlikely to be much control in societies with low contraceptive prevalence. In the context of this study crude birth rate (CBIRTHRTE) is used as an indicator of lack of control over reproductive behavior. Societies with low contraceptive preva- lence will generally have high crude birth rates. We have decided to include this indicator of women's lack of autonomy because the variable (CONTRACPTN) measures contraceptive use
308 John B. Williamson and Ulrike Boehmer
among married women only. The crude birth rate variable is not limited to married women.
We assess women's political status using two measures. One is an indicator of the number of years women have had the right to vote (SUFFRAGE-F) . Our argument is that women will generally have more political influence in those so- cieties in which they have had the right to vote longer. Over time the institutionalization of women's right to vote generally translates into greater political influence for women. Our second indicator is the percent of seats in the parliament held by women (PARLAM-F) . Our argument is that women will have more political influence in those societies in which they hold a greater pro- portion of the seats in the national parliament.
Women 's economic status is measured using three relative measures of women's participation in the economy. One measure is the ratio of the per- cent of women to the percent of men working in the agricultural sector (AGRIC-F/M) . Gender stra- tification theory would suggest that this variable should have a negative impact on female life expect- ancy. Those countries in which there are a high pro- portion of women relative to men in the agricultural sector are countries in which women have lower status as they are the same countries in which there are more men than women in the higher status industrial and service sector jobs. A second measure is the corresponding ratio within the industrial sector ( I N D U S T R Y - F / M ) , and a third is the corresponding ratio within the service sector (SERVICE-F/M). For these last two gender stratification theory measures we would hypothesize positive effects on female life expectancy as these are the higher status sectors of the economy relative to the agricultural sector.
In addition to the preceding women's status indi- cators we consider a number of other indicators that have been used with some success in prior stu- dies of cross-national variation in female life expect- ancy. These variables tap a number of factors related to political, economic, and social develop- ment. Based on prior studies of mortality or life ex- pectancy we would hypothesize that nations with the following characteristics will tend to have longer female life expectancy: those with a larger percent of the population living in urban areas (URBAN) (Florez and Hogan, 1990; Tolnay and Christenson, 1984), those in which a greater percent of the popu- lation has access to good sanitation
*We checked each of these seven models for interaction. In no model did we find significant interaction between LGDP/C and the education predictor.
tWe also compared the standardized partial regression coefficients (not presented here). This yielded a ranking of the predictors that was with a few minor exceptions the same as that based on the t-values. The value for YRS-SCHL-F/M was a bit lower than would have been expected based on the relative size of the t-values.
(SANITATION) (Gubhaju e t al. , 1991), those in which a greater percent of births are attended by a trained person (BIRTH-ATT) (Jayachandran and Jarvis, 1986), those in which the percent of the cen- tral government expenditures on housing, social security and welfare are greater (SOC W E L EXP) (Williamson, 1987), those with greater political and civil rights (POL R I G H T S and CIV RIGHTS) , and those with a smaller population per physician ratio (POP PHYS) (Hobbs and Kiggundu, 1992). These indicators can all be linked to a broad version of the industrialism perspective referred to as modern- ization theory.
RESULTS
While a number of prior studies tell us that women's education is an important predictor of female life expectancy and mortality more generally, it is rare for such studies to include more than one education related predictor. Some studies use a measure based on primary school enrollment, some a measure based on secondary school enrollment, and some a measure based on literacy rates. But how are we to know which of the various alterna- tives is the best predictor? To answer this question we present data in Table 1 that can be used to com- pare the predictive efficacy of seven alternative indi- cators of women's education levels. For each model in Table 1 the dependent variable is female life ex- pectancy at birth and there are two predictors, the control variable level of economic development (LGDP/C) and the various indicators of the edu- cational status of women taken one at a time. We include these education variables one at a time for three reasons: (1) it allows us to see which of these predictors have significant effects when controlling for LGDP/C; (2) it provides the information we need to decide which is the strongest predictor; and (3) it allows us to base each estimate on as large a sample as possible. However, this last benefit comes at a cost as each model is based on a slightly differ- ent sample which must be taken into consideration when comparing the various models.
For each of the seven models presented in Table 1 we find support for the gender stratification per- spective; that is, in each model the education related measure of women's status has a significant effect.* The effect of level of economic development (LGDP/C) is significant in every model (a finding consistent with industrialism theory), but results for this variable are presented for only one model, the model in which it is included alone (row 1). Having established that all of the predictors relating to edu- cational status are significant, it makes sense to ask which of these predictors is the best. One way to answer this question is to compare the relative size of the t-valuest; another is to compare the R 2 increase for each model when we add the education variable last (the last column on the right). One

Female life expectancy
Table 1. Impact of women's education on female life expectancy at birth. Additive I LGDP/C)
models controlling for level of economic
309
development
Predictors N b t-value R 2 R 2 increase
LGDP/C 97 11.67*** 17.17 0,76 ILLITRCY-F 67 -0.18"** -5 .85 0.84 0.08 EDUC1-F 73 0.08*** 2.72 0.79 0.02 EDUC2-F 70 0.17"** 4.61 0,82 0.06 EDUCI-F/M 80 0.13"** 2.79 0,78 0.02 EDUC2-F/M 67 0.09*** 4.46 0,84 0.05 EDUC3-F/M 70 0.09*** 4.47 0,81 0.06 YRS-SCHL-F/M 71 0.15"** 6.12 0,83 0.09
Effect estimates of ILL1TRCY-F and YRS-SCHL-F/M for same subsample: ILLITRCY-F 63 -0.17"** -5.57 0.83 0.09 YRS-SCHL-F/M 63 0.15*** 5.91 0,84 0.09
*** P < 0.01.
emphasizes the significance of the effects; the other the amount of variance added to a basic model that includes only level of economic development (LGDP/C). By either criteria we find that the two best predictors are female illiteracy rate ( ILLITRCY-F) and the ratio of female to male years of schooling (YRS-SCHL-F/M). The first is an absolute measure; the second is a relative measure. Based on the evidence presented in Table 1, a case can be made that YRS-SCHL-F/M is marginally superior. To make sure that the sn~,all difference between these two predictors is not clue to the slight differences in subsample, we ran two additional models in which we limited the analysis to the 63 countries for which we have data on both of these education predictors. These two models are presented in the last two rows of Table 1. Again the t-value and the R 2 value is larger for YRS-SCF.[L- F /M than it is for ILLITRCY-F. Based on these results, we have decided to work with YRS-SCHL- F /M rather than ILLITRCY-F as our educatiLon control in subsequent models; but it is also of note that the strength of the absolute measttre, ILLITRCY-F, is essentially the same.
Prior studies have often used years of schooling, school enrollment ratios, and literacy rates as if they were interchangeable (Menard, 1987, 1990). Our results suggest that YRS-SCHL-F/M adds at least as much to the R 2 as does ILLITRCY-F. Our reason for selecting YRS-SCHL-F/M rather than ILLITRCY-F is not based on its marginally larger t and R 2 values alone. Another reason is that the data for YRS-SCHL-F/M are probably more re- liable as the variable is easier to measure. For many of these countries it is likely we have a more accu- rate measure of the average number of years women and men spend in school than we have of literacy rates. We say this because literacy assess- ment calls for the administration of reading and writing tests. It is likely that in some if not many
*When a coefficient is significant at the P < 0.10 level, we refer to it as being marginally significant; an alternative would be to refer to such coefficients as being almost significant.
cases estimates for the country as a whole are based on tests applied to small and possibly unrepresenta- tive samples of the population.
Another and even more important reason for selecting YRS-SCHL-F/M as our education related women's status predictor is that it is a relative measure; it is an indicator of women's education relative to men's education. Relative measures, pre- dictors measuring women's status relative to that of men, are at the core of gender stratification theory. Evidence that the ratio of women's to men's edu- cation is an important predictor offers more com- pelling support for this theoretical perspective than does evidence that the absolute level of women's education is a strong predictor. The absolute measure can be interpreted as support for industri- alism theory as well as gender stratification theory; the relative measure offers support for the gender stratification theory, but not industrialism theory.
In Table 2 we check dimensions of women's sta- tus other than education. The reason for consider- ing these models is to find out whether these other aspects of women's status have effects on female life expectancy after we control for level of develop- ment. These other dimensions of women's status are: (1) women's autonomy as measured by women's age at marriage (AGE-MARRIED) , use of contraception (CONTRACPTN), crude birth rate (CBIRTHRTE), and an overall gender equality measure (GENDER-EQU); (2) women's political status as measured by women's right to vote ( S U F F R A G E - F ) and parliamentary seats held by women (PARLAM-F); and (3) women's economic status as measured by women's relative economic activity in the industrial sector ( INDUSTRY-F/M) , the service sector (SERVICE-F/M), and the agricul- tural sector (AGRIC-F/M).
The first nine models presented in Table 2 each include two predictors, the predictor listed in the table and the control variable LGDP/C which is significant in every equation, but not presented. In these additive models our results suggest that seven out of the nine measures of women's status have significant effects on female life expectancy; only one is not at least marginally significant.* Female
310 John B. Williamson and Ulrike Boehmer
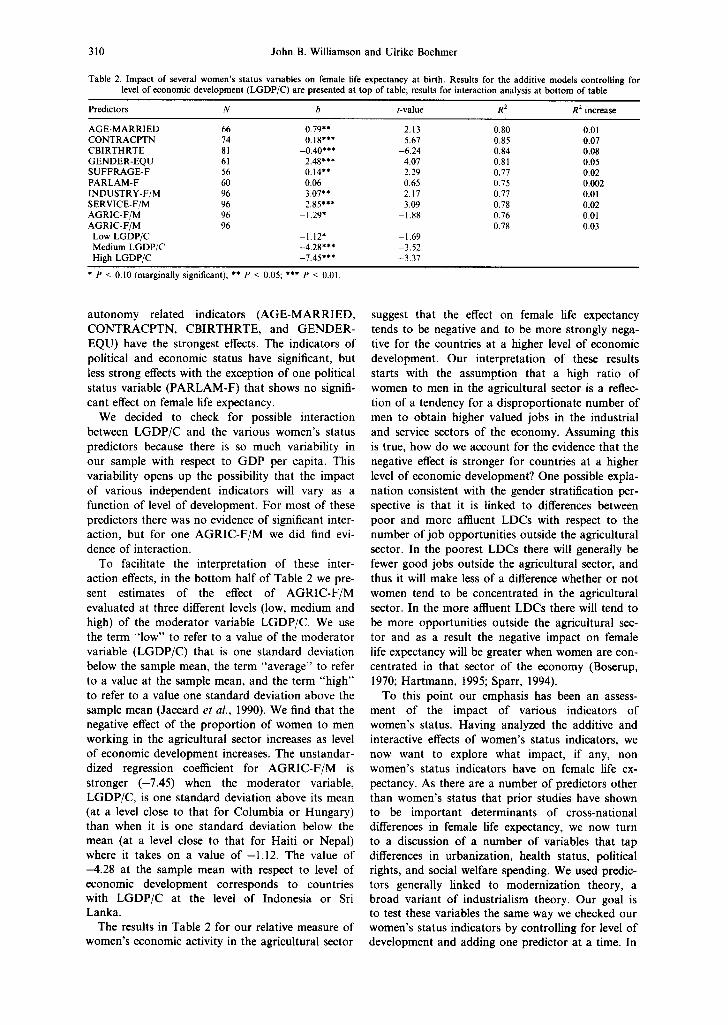
Table 2. Impact of several women's status variables on female life expectancy at birth. Results for the additive models controlling for level of economic development (LGDP/C) are presented at top of table; results for interaction analysis at bottom of table
Predictors N b t-value R 2 R 2 increase
AGE-MARRIED 66 0.79** 2.13 0.80 0.01 CONTRACPTN 74 0.18"** 5.67 0.85 0.07 CBIRTHRTE 81 -0.40*** -6.24 0.84 0.08 GENDER-EQU 61 2.48*** 4.07 0.81 0.05 SUFFRAGE-F 56 0.14"* 2.29 0.77 0.02 PARLAM-F 60 0.06 0.65 0.75 0.002 INDUSTRY-F/M 96 3.07** 2.17 0.77 0.01 SERVICE-F/M 96 2.85*** 3.09 0.78 0.02 AGRIC-F/M 96 -1.29" -1.88 0.76 0.01 AGRIC-F/M 96 0.78 0.03
Low LGDP/C - 1.12* - 1.69 Medium LGDP/C -4.28*** -3.52 High LGDP/C -7.45*** -3.37
* P < 0.10 (marginally significant); ** P < 0.05; *** P < 0.01.
autonomy related indicators (AGE-MARRIED, CONTRACPTN, CBIRTHRTE, and GENDER- EQU) have the strongest effects. The indicators of political and economic status have significant, but less strong effects with the exception of one political status variable (PARLAM-F) that shows no signifi- cant effect on female life expectancy.
We decided to check for possible interaction between LGDP/C and the various women's status predictors because there is so much variability in our sample with respect to GDP per capita. This variability opens up the possibility that the impact of various independent indicators will vary as a function of level of development. For most of these predictors there was no evidence of significant inter- action, but for one AGRIC-F/M we did find evi- dence of interaction.
To facilitate the interpretation of these inter- action effects, in the bottom half of Table 2 we pre- sent estimates of the effect of AGRIC-F/M evaluated at three different levels (low, medium and high) of the moderator variable LGDP/C. We use the term "low" to refer to a value of the moderator variable (LGDP/C) that is one standard deviation below the sample mean, the term "average" to refer to a value at the sample mean, and the term "high" to refer to a value one standard deviation above the sample mean (Jaccard et al., 1990). We find that the negative effect of the proportion of women to men working in the agricultural sector increases as level of economic development increases. The unstandar- dized regression coefficient for AGRIC-F/M is stronger (-7.45) when the moderator variable, LGDP/C, is one standard deviation above its mean (at a level close to that for Columbia or Hungary) than when it is one standard deviation below the mean (at a level close to that for Haiti or Nepal) where it takes on a value o f -1 .12 . The value of -4.28 at the sample mean with respect to level of economic development corresponds to countries with LGDP/C at the level of Indonesia or Sri Lanka.
The results in Table 2 for our relative measure of women's economic activity in the agricultural sector
suggest that the effect on female life expectancy tends to be negative and to be more strongly nega- tive for the countries at a higher level of economic development. Our interpretation of these results starts with the assumption that a high ratio of women to men in the agricultural sector is a reflec- tion of a tendency for a disproportionate number of men to obtain higher valued jobs in the industrial and service sectors of the economy. Assuming this is true, how do we account for the evidence that the negative effect is stronger for countries at a higher level of economic development? One possible expla- nation consistent with the gender stratification per- spective is that it is linked to differences between poor and more affluent LDCs with respect to the number of job opportunities outside the agricultural sector. In the poorest LDCs there will generally be fewer good jobs outside the agricultural sector, and thus it will make less of a difference whether or not women tend to be concentrated in the agricultural sector. In the more affluent LDCs there will tend to be more opportunities outside the agricultural sec- tor and as a result the negative impact on female life expectancy will be greater when women are con- centrated in that sector of the economy (Boserup, 1970; Hartmann, 1995; Sparr, 1994).
To this point our emphasis has been an assess- ment of the impact of various indicators of women's status. Having analyzed the additive and interactive effects of women's status indicators, we now want to explore what impact, if any, non women's status indicators have on female life ex- pectancy. As there are a number of predictors other than women's status that prior studies have shown to be important determinants of cross-national differences in female life expectancy, we now turn to a discussion of a number of variables that tap differences in urbanization, health status, political rights, and social welfare spending. We used predic- tors generally linked to modernization theory, a broad variant of industrialism theory. Our goal is to test these variables the same way we checked our women's status indicators by controlling for level of development and adding one predictor at a time. In

Female life expectancy 311
Table 3. Impact of several non-women's status variables on female life expectancy at birth. Results for the additive models controlling for level of economic development (LGDP/C) are presented at top of table; results for interaction analysis at bottom of table
Predictors N b-value t-value R 2 R 2 increase
URBAN 96 0.10"* 2.61 0.77 0.02 SANITATION 64 0.09** 2.51 0.75 0.03 BIRTH-ATT 75 0.08*** 2.65 0.80 0.02 SOC WEL EXP 47 0.16** 2.14 0.78 0.02 POL RIGHTS 96 0.86*** 2.66 0.77 0.02 CIV RIGHTS 81 1.62"** 3.42 0.79 0.03 POP PHYS 77 -0.00016** -2.18 0.78 0.01 POP PHYS 77 0.82 0.06
Low LGDP/C -0.00088*** -4 .89 Medium LGDP/C -0.00060** -4 .92 High LGDP/C -0.00032*** -4.16
** P < 0.05; *** P < 0.01.
addition to the models presented in Table 3 we also ran a series of models with the following variables: calories per capita, health expenditure as percent of central government expenditures, sickness and maternity leave, Social Insurance Program Experience (SIPE), revenue as percent of GNP, per- cent of household consumption on medical care, nurses per population, income inequality, avail- ability of health services, and availability of safe water. We have not presented our results for these models as none of the predictors listed had signifi- cant effects. Many of these variables have been used with success in one or more prior studies of life ex- pectancy, mortality, or physical quality of life. In Table 3 we present results for the models in which the relevant modernization predictor did have a sig- nificant effect.
In the first seven rows of Table 3 we present results for a series of additive models each of w]aich includes two predictors, LGDP/C and the variable specified in the first column of the table. The con- trol variable LGDP/C has a significant effect in each of these models, but the coefficients for this control variable are not presented as our foctts is on the other predictor. Each of these predictors has a significant effect in the predicted direction which would be expected, given the evidence from prior studies that they are useful predictors of life expect- ancy and/or other measures of mortality. We also checked for possible interaction between LGDP/C and each of these predictors. Only in the cas~ of population per physician (POP PHYS) did we find evidence of significant interaction. As we can see from the interaction results presented at the bottom of Table 3, for countries at a low level of economic development--that is, values of LGDP/C one stan- dard deviation below the sample mean (countries with a level of economic development close to that for Zambia)--the negative effect of population per physician is strongest. For countries at a high level of LGDP/C-- that is, one standard deviation above the sample mean with respect to level of economic development (countries at the level of Algeria)--the negative effect of the population per physician vari- able is substantially weaker.
Based on the analysis presented in Table 1 we selected YRS-SCHL-F/M as our education control variable in subsequent analyses. Based on the results presented in Tables 2 and 3 we have come up with a set of additional predictors that are can- didates for inclusion in our next set of models. In Table 4 the basic question we are asking is whether or not each of the predictors considered continues to have an effect on female life expectancy once we introduce a second control, YRS-SCHL-F/M. We have added this control because most prior studies agree that female education is an important predic- tor of female life expectancy.
This table summarizes our results for a series of models which include two control variables LGDP/ C and YRS-SCHL-F/M. The first 16 rows of this table present results for a series of additive models each of which includes three predictors; the variable listed down the left side of the table and the two control variables listed across the top of the table. The coefficients for the variables listed down the left side of the page are given in the column labeled Predictor results. Table 4 presents results for each predictor that had a significant effect in either Table 2 or 3.
In row 1 of Table 4 we consider an absolute women's educational status indicator (ILLITRCY- F) which was almost as strong a predictor as our relative measure YRS-SCHL-F/M in Table 1. We include this absolute measure because we want to find out if both a relative and an absolute measure of female educational status make independent con- tributions when included in the same model. Our results can be interpreted two ways. They show that when we control for YRS-SCHL-F/M the absolute measure of educational status has a marginally sig- nificant effect. Alternatively, this same model suggests that our indicator of women's educational status relative to men makes a significant indepen- dent contribution even after controlling for our best absolute indicator of women's educational status.
Table 4 includes eight other women's status indi- cators (AGE-MARRIED, CONTRACPTN, CBIRTHRTE, GENDER-EQU, SUFFRAGE-F, INDUSTRY-F/M, SERVICE-F/M, and AGRIC- F/M) which had significant effects in Table 2. We
SSM 45/2 F

312 John B. Williamson and Ulrike Boehmer
Table 4. Impact of women's status and non-women's status variables on female life expectancy at birth. Results for the additive models controlling for level of economic development (LGDP/C) and women's education relative to men's (YRS-SCHL-F/M) are presented at
top of table; results for interaction analysis at bottom of table
Predictor results YRS-SCHL-F/M LGDP/C
Predictors N b (t-value) b (t-value) b (t-value) R 2
ILL1TRCY-F 63 -0.09* (-1.96) 0.10"* (2.56) 8.18"** (8.11) 0.85 AGE-MARRIED 55 0.69* (1.79) 0.11"** (3.67) 7.99*** (7.92) 0.84 CONTRACPTN 65 0.14"** (3.67) 0.09*** (3.49) 6.93*** (7.19) 0.86 CBIRTHRTE 71 -0.28*** (-3.38) 0.11"** (4.18) 7.05*** (8.05) 0.85 GENDER-EQU 51 1.13 (1.51) 0.10"** (3.52) 9.18"** (9.98) 0.84 SUFFRAGE-F 47 0.05 (0.74) 0.13"** (4.38) 8.20*** (8.02) 0.83 INDUSTRY-F/M 71 2.93** (2.43) 0.15"** (6.35) 8.51"** (11.29) 0.84 SERVICE-F/M 71 0.58 (0.60) 0.14"** (5.15) 8.67*** (11.02) 0.83 AGRIC-F/M 7l -0.81 (-0.77) 0.14"** (5.24) 8.71"** (11.20) 0.83 BIRTH-ATT 65 -0.01 (-0.31) 0.15"** (5.54) 9.04*** (10.32) 0.85 POP PHYS 68 -0.00014** (-2.10) 0.14"** (5.61) 7.24*** (6.27) 0.83 URBAN 71 0.03 (0.85) 0.14"** (5.43) 8.25*** (8.59) 0.83 SANITATION 61 0.05 (1.44) 0.13"** (4.98) 7.71"** (7.50) 0.83 SOC WEL EXP 40 0.01 (0.08) 0.14"** (4.53) 8.67*** (8.03) 0.86 POL RIGHTS 71 0.40 (1.15) 0.13"** (5.05) 8.63*** (11.09) 0.83 CIV RIGHTS 71 0.42 (0.78) 0.14"** (4.95) 8.53*** (10.41) 0.83 AGRIC-F/M 71 0.13"** (5.02) 8.38*** (10.47) 0.83
Low LGDP/C -0.09 (-0.08) Medium LGDP/C -2.43 (-1.62) High LGDP/C -4.77* (-1.69)
POP PHYS 68 0.12"** (4.71) 5.19"** (4.11) 0.86 Low LGDP/C -0.00063*** (-3.75) Medium LGDP/C -0.00043*** (-3.87) High LGDP/C -0.00023*** (-3.42)
* P < 0.10 (marginally significant); ** P < 0.05; *** P < 0.01.
find that once a control is added for YRS-SCHL-F/ M the effects for these other predictors are generally weaker and in some cases they are no longer signifi- cant. But we continue to find strong effects for con- traceptive prevalence, crude birth rate, and the ratio of the percent of women to men working in the industrial sector. When we consider additive models ILLITRCY-F and AGE-MARRIED have effects that are marginally significant, but GENDER- EQU, SUFFRAGE-F, and SERVICE-F/M no longer have significant effects.
In rows 10-16 of Table 4 we present results for the seven non-women's status variables (BIRTH- ATT, POP PHYS, URBAN, SANITATION, SOC WEL EXP, POL RIGHTS, CIV RIGHTS) all of which had significant effects in Table 3. When we control for YRS-SCHL-F/M only one of these pre- dictors has a significant effect, population per phys- ician.
In addition to the additive models just described, we also checked for possible interaction between LGDP/C and each of the predictors listed in Table 4. We found evidence of interaction for two predictors, the proportion of women to men work- ing in the agricultural sector (AGRIC-F/M) and population per physician (POP PHYS). As shown toward the bottom of Table 4, AGRIC-F/M does not have a significant effect at low or medium levels of LGDP/C, but it does have a marginally signifi- cant effect at high levels of LGDP/C. In the case of POP PHYS the strength of the adverse effect decreases as level of development increases. The negative effect is greatest for low LGDP/C countries such as Zambia or the Central African
Republic, while it is much weaker, but still signifi- cant, for high LGDP/C countries such as Costa Rica or Thailand.
The results for our final models are presented in Table 5. The goal here is to draw on the results pre- sented in Table 4 in order to formulate a final set of models. Due to the limits imposed by sample size and the additional loss of cases due to missing data for each predictor added, we do not feel comfortable including more than five or six predictors in the same model (including any interaction terms). Since the correlation between CONTRACPTN and CBIRTHRTE is high (-0.89) and CONTRACPTN is a stronger predictor, we have elected to retain CONTRACPTN, but not CBIRTHRTE in our final models. Further, we decided to omit from our final model those predictors that are only marginally sig- nificant in Table 4 (P < 0.10); this excludes ILLITRCY-F, AGE-MARRIED and AGRIC-F/M.
In Table 5 we will first consider a final additive model and then a final model which includes inter- action terms. The final additive model includes five predictors: (1) LGDP/C, (2) YRS-SCHL-F/M, (3) CONTRACPTN, (4) INDUSTRY-F/M and (5) POP PHYS. The results for this model are found in the first column of data which is labeled Basic sample, additive model. In this model the effects for LGDP/C, YRS-SCHL-F/M, and CONTRACPTN are significant. The effect for INDUSTRY-F/M is marginally significant (P < 0.10) and the effect for POP PHYS is not significant.
In the second column of Table 5 we have made an effort to replicate our findings on a somewhat larger sample. We were able to increase our sample

Female life expectancy 313
Table 5. Final models for basic and expanded sample. Impact of selected women's status and non-women's status variables on female life expectancy at birth. Additive models are in first two columns and models with interaction terms are in the last two columns
Basic sample Expanded sample Basic sample Expanded sample Additive model Additive model Interaction model Interaction model
Predictors b (t-value) b (t-value) b (t-value) b (t-value)
LGDP/C 6.24*** (4.84) YRS-SCHL-F/M 0.09*** (3.53) CONTRACPTN 0.14"** (3.54) INDUSTRY-F/M 2.26* (1.90) POP PHYS -0.00005 (-0.74) Low LGDP/C Medium LGDP/C High LGDP/C
N 62 R 2 0.88
6.05*** (5.79) 5.12"** (3.88) 4.99*** (4.52) 0.10"** (4.28) 0.08*** (2.87) 0.09*** (3.92) 0.13"** (3.89) 0.12'** (3.04) 0.11"** (3.29) 2.19" (1.96) 2.20* (1.93) 2.25** (2.10)
-0.00006 (-1.07) -0.00043** (-2.57) -0.00041** (-2.63) -0.00028** (-2.49) -0.00028** (-2.61) -0.00013* (-1.88) -0.00014** (-2.20)
76 62 76 0.89 0.89 0.90
* P < 0.10 (marginally significant); ** P < 0.05; *** P < 0.01.
size from 62 to 76 by shifting from the standard list- wise deletion of cases (in which a case is eliminated from the sample if it is missing data on any of the variables included in the model) to an alternative, in which we replaced missing data for two of our pre- dictors with estimated values for at least some countries. We regressed C O N T R A C P T N on lotai fertility rate and crude birth rate to obtain estimated values for C O N T R A C P T N . These estimated values were used to fill in missing data on C O N T R A C P T N when we had data on both total fertility rate and crude birth rate. We used a similar procedure to fill in missing data for YRS-SCHL-F /M. Here we regressed Y R S - S C H L - F / M on mean years of school- ing and adult literacy rate to get our estimated values. The results for our expanded sample are pre- sented in the second column. The results for the expanded sample are essentially the same as for the basic sample.
We next checked for possible interaction between each of the predictors in Table 5 and LGDP/C. For both the basic sample (column 3) and the expanded sample (column 4) we found only one significant interaction, that with POP PHYS. The results are quite similar, but in the expanded sample the coeffi- cient for I N D U S T R Y - F / M is now clearly significant (P < 0.05) as opposed to marginally significant. This change is probably due more to the increase in sample size than to the slight increase in the strength of the partial regression coefficient. For both the basic sample and the expanded sample the negative effect of POP PHYS is stronger for countries that are low in LGDP/C , such as Zambia, than for countries that are high in LGDP/C , such as Jordan or Turkey.
Our final models offer support for both industri- alism theory and for gender stratification theory. They include two predictors linked to the industrial- ism perspective (LGDP/C and POP PHYS) and
*In recent years the number of measures available as indi- cators of women's status has increased, but they are generally indirect and in many cases can also be v:Lewed as consequences of status rather than direct measures of status, for example, contraceptive use and age at marriage.
three linked to the gender stratification perspective (YRS-SCHL-F/M, C O N T R A C P T N , and I N D U S T R Y - F / M ) . It is also of note that our final set of gender stratification predictors tap three of the four broad domains considered: women's edu- cational status (YRS-SCHL-F/M) , women's econ- omic status ( I N D U S T R Y - F / M ) , and women's autonomy in the family (CONTRACPTN) .
DISCUSSION AND CONCLUSIONS
We have found evidence of a positive relationship between the status of women and female life expect- ancy at birth in LDCs. Our findings support the argument that women's status is a multidimensional concept that includes more than educational sta- tus.* A number of prior studies of female life ex- pectancy neglect to take this complexity into account. In these earlier studies the impact of women's status, if considered at all, has generally been reduced to one dimension, educational status.
In our preliminary analysis of educational indi- cators summarized in Table I, all measures of women's educational status show strong effects on female life expectancy. We present evidence suggesting that in general indicators of women's relative educational status ( E D U C I - F / M , EDUC2- F/M, E D U C 3 - F / M , YRS-SCHL-F /M) have a pre- dictive utility that is quite similar to that for indi- cators of absolute educational status ( ILLITRCY- F, E D U C I - F , EDUC2-F) . This analysis also suggests that both relative and absolute measures of women's primary education tend to be weaker pre- dictors than are the other education measures.
Our results confirm the finding of prior studies that women's educational status is an important predictor of female life expectancy for the LDCs, but they also qualify and extend those studies. Evidence is presented that the ratio of female to male years of schooling is as strong, if not stronger, as a predictor of female life expectancy than any other education related predictor considered. This finding is of note for two reasons. (I) It is easier to defend the use of this indicator as a measure of women's status than it is to defend the more com-

314 John B. Williamson and Ulrike Boehmer
monly used absolute measures of female edu- cational status, such as female literacy rate and female secondary school enrollment. (2) Our measure has not been used in prior studies; it is an alternative measure of women's educational status that is of potential use to other researchers for a variety of purposes other than predicting female life expectancy. It will be of particular interest to those seeking to test hypotheses derived from the gender stratification perspective.
We find that aspects of women's status other than educational status have important effects on female life expectancy. In Table 2 we present evi- dence that several other dimensions of women's sta- tus also impact female life expectancy. As we move through the paper and add women's educational status as an additional control, we find that the case for some of these other predictors becomes weaker; but several predictors linked to women's status do remain significant even after a variety of controls have been introduced.
Of these other dimensions of women's status, reproductive autonomy as measured by C O N T R A C P T N has a particularly strong effect. Women 's reproductive autonomy continues to have a significant impact on female life expectancy after controls have been added for education (Table 4). As we show in Table 5, contraceptive prevalence main- tains its strength as a predictor even after we control for measures of industrialism and other measures of women's status.
Of the several dimensions of women's status we consider, our results suggest that the political domain
*It is certainly true that there is a certain amount of clumping together of certain characteristics in different regions. For example, the sub-Saharan countries tend to be the poorest and least educated. In these countries women do undertake more of the agricultural labor than is the case in the Asian countries. The mean value of AGRIC-F/M is 1.21 for the sub-Saharan countries and 1.04 for the Asian countries. When we adjusted for level of development (LGDP/C) and our health in- dicator variable population per physician, the mean value for the sub-Saharan countries increased to 1.24, whereas the mean value for the Asian countries decreased to 0.96.
tThe sample of sub-Saharan Africa has a N of 29. AGRIC-F/M shows no significant effect and no inter- action effect. The sample of Asian countries has a N of 14. AGRIC-F/M shows no significant effect and no interaction effect. The inclusion of the advanced indus- trialized countries into our sample increases the N to 117. AGRIC-F/M has a marginally significant negative effect in the additive model. We found significant inter- action between AGRIC-F/M and LGDP/C. At low level of development, AGRIC-F/M showed no signifi- cant effect (b = 0.89; t-value = 1.10). At medium level of development, AGRIC-F/M had a significant nega- tive effect (P < 0.01; b = -3.33; t-value = -4.08). At high level of development, AGRIC-F/M had the stron- gest significant negative effect (P < 0.01; b = - 7.55; t-
2 value = - 4.29). The R of the interactive model equals 0.83.
is the least relevant for predicting cross-national differences in female life expectancy. After we control for women's educational status and level of develop- ment, what had been our strongest women's political status predictor (Table 2) no longer has a significant effect (Table 4). Our interpretation of this finding is that the other aspects of women's status that we con- sider have more immediate and direct effects on physical quality of life for women and thus on their life expectancy. Alternatively, this may mean that we have not attempted to measure the most appropriate aspects of women's political status or that we have not included the right indicators for the dimensions we have measured. More likely it means that the other dimensions of women status we cons ider - - autonomy and independence, educational status, and economic s ta tus--are more important as determi- nants of life expectancy in the LDCs today.
We find that women's economic status has an im- portant effect on female life expectancy. However, the relationship between women's economic activity and female life expectancy is complex. Women 's par- ticipation in some sectors of the economy (industry and service) has a positive impact on female life ex- pectancy, while women's participation in others (agriculture) has a negative impact (Tables 2 and 4). Our interpretation is that all other things being equal (including level of development), it is to women's economic advantage to be employed in those sectors of the economy that pay the best. Industry tends to pay the best and agriculture tends to pay the worst. A high ratio of women to men in the agricultural sec- tor tends to be linked to a lower ratio of women to men in the industrial sector. For this reason the higher ratio for the agricultural sector is most appro- priately interpreted as an indicator of lower econ- omic status for women.
In Table 2 we also have evidence of interaction between level of development and the ratio of women to men in the agricultural sector. This economic sta- tus indicator has a negative impact on female life ex- pectancy at all level of development, but the strength of the effect increases as level of development increases. We carried out much of our analysis separ- ately for various subregions of the world, such as sub-Saharan Africa, Asia, and the like (results not presented here). We found that A G R I C - F / M does not have significant effects on female life expectancy for either sub-Saharan Africa or the Asian countries. This did not surprise us as sub-Saharan Africa is so poor and we already know that it does not have a sig- nificant effect for the poorest countries. As for the Asian countries, it is very difficult to get significant results with such a small sample.* We would suggest that those seeking to replicate and extend our analy- sis might consider addressing some of these same issues using a pooled data set based on several points in time as the relevant women's status data become available in the years ahead.~" When we increased our sample by adding 21 advanced industrialized

Female life expectancy 315
countries, we were able to replicate our results for this economic status indicator as shown in Table 2. This suggests that the penalty women pay for being over represented in the agricultural sector is less in very poor countries (where there are relatively few high paying jobs in other sectors of the economy), but the adverse consequences are greater in the more affluent LDCs, as there are more high paying jobs outside the agricultural sector in these countries.
The issue of women's economic activity needs more attention than we have been able to give it in this analysis. We have not dealt with women's employment in the informal sector, with their work in unpaid jobs, or with the issue of how much con- trol they have over the income they do earn. These are some of the most important issues we have been unable to deal with given the limitations of our data. We support the call for more and improved data on women's economic activity in both the for- mal and the informal sector, data that can be used to distinguish women's income-generating work from other work they do, and data that tells us more about women's control over their income (Mitter, 1995; Sparr, 1994).
To test the robustness of our final models (Table 5), we have checked for influential cases using the Cook's D statistic. This analysis suggests that we may have two influential cases, Ethiopia and Zimbabwe. When we exclude these countries, we find that INDUSTRY-F/M and POP PHYS no longer have significant effects for either the basic sample or the expanded sample. This change would reduce our final model to three key predictors: (1) LGDP/C, (2) YRS-SCHL-F/M, and (3) CONTRACPTN. We would also have no ir~ter- action terms in our final models. While it is import- ant to keep in mind the potential impact of removing these cases from our sample, we have decided to keep them in the sample as they ar,~ to the best of our knowledge legitimate observations.
To this point our focus has been on predicting female life expectancy. It is reasonable to ask what happens when these same models are used to pre- dict male life expectancy. Gender stratification the- ory would suggest that these models should explain more of the variance in female life expectancy than in male life expectancy. To this end we have run the same models presented in Tables 4 and 5 using male life expectancy as the dependent variable As expected we do find that the models account for less of the variance in male life expectancy than in female life expectancy. For example, for the final additive model in Table 5, using the basic sample we account for 84% of the variance in male life ex- pectancy, in contrast to the 88% for female life ex- pectancy. When interaction terms are added the figure is 85% for male life expectancy as opposed to 89% for female life expectancy. A case can be made that the surprising finding here is not so much the difference in variance explained as the
similarity between the male and female models. The results are similar for the expanded sample. The coefficients for most of the women's status predic- tors are stronger when predicting female life expect- ancy than when predicting male life expectancy. An important exception is the ratio of women to men in industry (INDUSTRY-F/M); it shows a stronger effect when predicting male life expectancy than when predicting female life expectancy. We do not have what we consider an adequate explanation for this finding. It may in some way related to the ten- dency for women in many LDCs to obtain quite different and often less desirable jobs when they do obtain jobs in the industrial sector. In this sense having an industrial sector job may not mean quite the same thing for women as it does for men.
We began this analysis with a series of hypoth- eses derived from gender stratification theory and a similar set derived from industrialism theory. While our results offered support for both theoretical per- spectives, it is the findings with respect to gender stratification theory that represent our most import- ant contributions. It is not news that we have shown once again that factors linked to industrial- ism theory are important when the goal is to predict life expectancy. However, we have gone beyond this to make a strong case that gender stratification the- ory and indicators that can be linked to this per- spective deserve a place at the table in any future effort to account for cross-national differences in female life expectancy.
While our focus has been on female life expect- ancy, we would argue that a number of these same indicators should prove relevant when the goal is to account for cross-national difference in physical quality of life and well-being more generally, par- ticularly when considering dependent variables such as maternal mortality rate that emphasize the well- being of women.
REFERENCES
Blumberg, R. L. (1984) A general theory of gender stratifi- cation. In Sociological Theory 1984, ed. R. Collins, pp. 23-101. Jossey-Bass, San Francisco.
Boserup, E. (1970) Woman's Role in Economic Development. St. Martin's Press, New York.
Brazzell, J. F. and Gillespie, M. K. (1981) Comparative demography. International Journal of Comparative Sociology 22, 141-168.
Caldwell, J. C. (1979) Education as a factor in mortality decline: an examination of Nigerian data. Population Studies 33, 395~,13.
Caldwell, J. C. (1986) Routes to low mortality in poor countries. Population and Development Review 12, 171- 220.
Caldwell, J. C. (1993) Health transition: the cultural, social and behavioural determinants of health in the Third World. Social Science & Medicine 36, 125-135.
Dalla Costa, M. and Dalla Costa, G. F. (eds) (1995) Paying the Price: Women and the Politics of International Economic Strategy. Zed Books, London.

316 John B. Williamson and Ulrike Boehmer
Florez, C. E. and Hogan, D. P. (1990) Women's status and infant mortality in rural Colombia. Social Biology 37, 188-203.
Gubhaju, B., Streatfield, K. and Majumder, A. K. (1991) Socioeconomic, demographic and environmental deter- minants of infant mortality in Nepal. Journal of Biosocial Science 23, 425-435.
Hartmann, B. (1995) Reproductive Rights and Wrongs: The Global Politics of Population Control (revised edn). South End Press, Boston.
Hertz, E., Herbert, J. R. and Landon, J. (1994) Social and environmental factors and life expectancy, infant mor- tality, and maternal mortality rates: results of a cross- national comparison. Social Science & Medicine 39, 105-114.
Hobbs, C. F. and Kiggundu, M. N. (1992) A Global Analysis of Life Expectancy and Infant Mortality. Carleton University Press, Ottawa.
Hunter, S. S. (1990) Levels of health development: a new tool for comparative research and policy formulation. Social Science & Medicine 31,433-444.
Jaccard, J., Turrisi, R. and Wan, C. K. (1990) Interaction Effects in Multiple Regression. Sage, Newbury Park.
Jayachandran, J. and Jarvis, G. K. (1986) Socioeconomic development, medical care, and nutrition as determi- nants of infant mortality in less developed countries. Social Biology 33, 301-315.
Kattler, D. and Williamson, J. B. (1988) Welfare state development and life expectancy among the aged: a cross-national analysis. Journal of Aging Studies 2, 13 24.
Kerr, C., Dunlop, J. T., Harbison, F. and Myers, C. A. (1960) Industrialism and Industrial Man. Harvard University Press, Cambridge, MA.
Lena, H. F. and London, B. (1995) Dependency, health care resources, and basic needs in noncore nations: a cross-national analysis. Research in the Sociology of Health Care 12, 331-354.
Manton, K. G. (1984) Mortality patterns in developed countries. Comparative Social Research 7, 259-286.
Mason, K. O. (1986) The status of women: conceptual and methodological issues in demographic studies. Sociological Forum 1,284-300.
McColm, R. B. (ed.) (1991) Freedom in the World. Freedom House, New York.
McColm, R. B. (ed.) (1993) Freedom in the World. Freedom House, New York.
Menard, S. (1987) Fertility, development, and family plan- ning, 1970-1980: an analysis of cases weighted by popu- lation. Studies in Comparative International Development 22, 103-127.
Menard, S. (1990) Cross-national models of fertility, family planning, and development: testing for reciprocal effects. Studies in Comparative International Development 25, 60-90.
Mitter, S. (1995) Beyond the politics of difference: an introduction. In Women Encounter Technology: Changing Patterns of Employment in the Third World, eds S. Mitter and S. Rowbotham, pp. 1-18. Routledge, New York.
Murray, C. J. L. (1987) A critical review of international mortality data. Social Science & Medicine 25, 773-781.
Pendleton, B. F. and Yang, S. W. (1985) Socioeconomic and health effects on mortality declines in developing countries. Social Science & Medicine 20, 453-460.
Population Crisis Committee (1988) Country Rankings of the Status of Women: Poor, Powerless and Pregnant. Population Crisis Committee, Washington, DC.
Preston, S. H. (1975) The changing relation between mor- tality and level of economic development. Population Studies 29, 231-248.
Rodgers, G. B. (1979) Income and inequality as determi- nants of mortality: an international cross-sectional analysis. Population Studies 33, 343-351.
Rogers, R. G. and Wofford, S. (1989) Life expectancy in less developed countries: socioeconomic development or public health? Journal of Biosocial Science 21, 245-252.
Sparr, P. (ed.) (1994) Mortgaging Women's Lives." Feminist Critiques of Structural Adjustment. Zed Books, London.
Tolnay, S. E. and Christenson, R. L. (1984) The effects of social setting and family planning programs on recent fertility declines in developing countries: a reassessment. Sociology and Social Research 69, 72-89.
UNICEF (1993) The Status of WorM's Children 1993. Oxford University Press, New York.
United Nations (1991) The World's Women 1970-1990: Trends and Statistics. United Nations, New York.
United Nations (1992) Demographic Yearbook 1991. Department of Economic and Social Development, Statistical Division, United Nations, New York.
United Nations (1995) The World's Women 1995: Trends and Statistics. United Nations, New York.
United Nations Development Programme (UNDP) (1"993) Human Development Report 1993. Oxford University Press, New York.
U.S. Bureau of the Census (1994) Data Base On Aging. U.S. Bureau of the Census, Center for International Research, Washington, DC.
Van de Walle, E. and Knodel, J. (1980) Europe's fertility transition: new evidence and lessons for today's develop- ing world. Population Bulletin 34, 1-43.
Ward, K. B. (1983) The economic status of women in the world system: a hidden crisis in development. In Crises in the Worm System, ed. A. Bergesen, pp. 117-139. Sage, Beverly Hills, CA.
Ward, K. B. (1984) Women in the World-System." Its Impact on Status and Fertility. Praeger, New York.
Wilensky, H. L. (1975) The Welfare State and Equality: Structural and Ideological Roots of Public Expenditures. University of California Press, Berkeley, CA.
Wilensky, H. L. and Lebeaux, C. N. (1965) Industrial Society and Social Welfare. Free Press, Glencoe, 1L.
Williamson, J. B. (1987) Social security and physical qual- ity of life in developing nations: a cross-national analy- sis. Social Indicators Research 19, 205-227.
World Bank (1983) Worm Development Report 1983. Oxford University Press, New York.
World Bank (1992) Worm Development Report 1992. Oxford University Press, New York.
World Bank (1993) World Development Report 1993. Oxford University Press, New York.
APPENDIX A
This appendix lists variables that we have presented in our tables, the variable abbreviations, definitions, and sources.
AGE-MARRIED: This variable measures women's aver- age age at first marriage, circa 1990. Source: United Nations (1991).
AGRIC-F/M: This variable measures the percent of women over the percent of men who work within the agri- cultural sector in 1994. Source: United Nations (1995).
BIRTH-ATT: This variable measures the percentage of births that have been attended by a trained person, circa 1990. Source: United Nations (1991).
CBIRTHRTE: This variable measures the crude birth rate per 1000 population in 1990. Source: World Bank (1992).
CIV RIGHTS: This variable measures on a 7 point scale (1-7) the level of civil liberties in 1991. A score of 1 indi- cates that the country is very low with respect to civil rights; a score of 7 indicates that a country is high with respect to civil rights. We have reversed the direction of

Female life expectancy 317
the variable as it is found in the source. Source: McColm (1991).
CONTRACPTN: This variable measures the percentage of married women aged 15-49 currently using contraception in the years 1980-1992. Source: UNICEF (1993).
EDUCI-F: This variable measures female primary school enrollment as a percentage of the female primary school age group in 1989. Source: World Bank (1992).
EDUC2-F: This variable measures female secondary school enrollment as a percentage of the female secondary school age group in 1989. Source: World Bank (1992).
EDUCI-F/M: This variable measures the ratio of female to male enrollment in the first level of education (priraary school) in 1985/1987. Source: United Nations (1991).
EDUC2-F/M: This variable measures the ratio of female to male enrollment in the second level of education (secondary school) in 1985/87. Source: United Nations (1991).
EDUC3-F/M: This variable measures the ratio of female to male enrollment in the third level of education (post- secondary school) in 1985/87. Source: United Nations (1991).
FEMALE LIFE EXPECTANCY AT BIRTH: The depen- dent variable is a projection of female life expectancy at birth, circa 1991. Source: U.S. Bureau of the Census (1994).
GENDER-EQU: This variable is a general measure of gender equality. It is based on a rating that has been done of each country on the basis of several gender related aspects of inequality for the period between 1986 and 1988. Among the dimensions included are: political and legal equality, equality in marriage and the family, dis- crimination against women, and economic equality. Source: Population Crisis Committee (1988).
ILLITRCY-F: This variable measures the percent of the female population over the age of 15 that was illiterate in 1990. Source: World Bank (1993).
INDUSTRY-F/M: This variable measures the percent of women over the percent of men in the labor force who work within the industrial sector in 1994. Source: United Nations (1995).
LGDP/C: This variable measures the logarithm of pur- chasing power of currencies estimates of GDP rather then exchange rates of GDP per capita. The estimates are based on 1990. Source: World Bank (1993).
PARLAM-F: This variable measures women's political participation as the percentage of parliamentary seats that were occupied by women in 1987. Source: United Nations (1991).
POL RIGHTS: This variable measures on a 7 point scale (1-7) political rights in 1992. One is the score for countries with the least political rights and 7 is the score for countries with the most political rights. We have reversed the direction of the variable as it is found in the source. Source: McColm (1993).
POP PHYS: This variable measures population per phys- ician in 1980. Source: World Bank (1983).
SANITATION: This variable is an estimate of the percen- tage of the population with access to sanitary means of excreta and waste disposal, including outdoor latrines and composting for the year from 1988 to 1990. Source: United Nations Development Programme (UNDP) (1993).
SERVICE-F/M: This variable measures the percent of women over the percent of men in the labor force who work within the service sector in 1994. Source: United Nations (1995).
SOC WEL EXP: This variable measures central govern- ment expenditures on housing, social security and welfare as a percentage of total central government expenditure in 1990. Source: World Bank (1992).
SUFFRAGE-F: This variable measures the years women have obtained the right to vote in each country as of 1995. Source: United Nations (1991).
URBAN: This variable measures the percent of each country's population living in urban areas in 1991. Source: World Bank (1993).
YRS-SCHL-F/M: this variable measures the ratio of mean number of years of schooling for females to that of males in 1990. Source: United Nations Development Programme (UNDP) (1993).