health care reform tax, budget, and economic implications matt dolan director federal policy group a...
TRANSCRIPT

Health Care Reform
Tax, Budget, and Economic Implications
Matt DolanDirector
Federal Policy GroupA Practice of Clark & Wamberg
Independent Insurance Agents of Iowa
September 23, 2010West Des Moines, Iowa

Page 2
Overview
The Fiscal Context of Health Care Reform
Health Care Reform: Running the Numbers
Impact of Health Care Reform
Impact on the Economy: “Bending the Cost Curve?”: Effect of Health Care Reform on Health Care Spending as a Percentage of GDP
Impact on Government Deficits: Aggregate Government Health Care Spending and Revenue Projections
Impact on Medicare: Medicare Costs, Revenues, and Solvency

Page 3
Fiscal Context of Health Care Reform

Page 4
Fiscal Context of Health Care Reform

Page 5
Fiscal Context of Health Care Reform

Page 6
Fiscal Context of Health Care Reform

Page 7
Fiscal Context of Health Care Reform

Page 8
Fiscal Context of Health Care Reform

Page 9
Fiscal Context of Health Care Reform
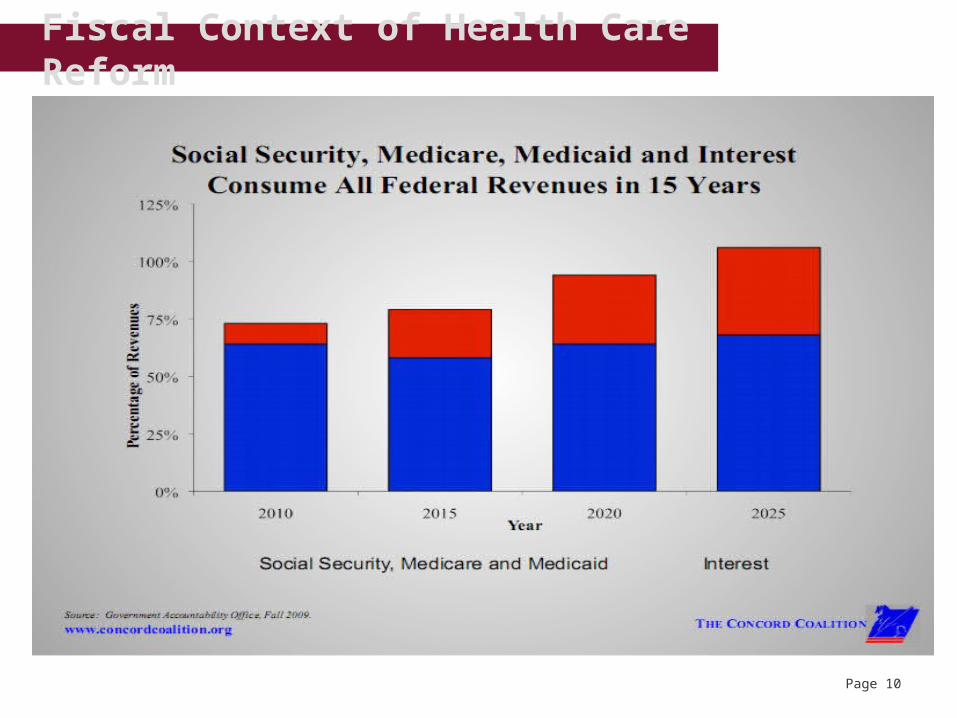
Page 10
Fiscal Context of Health Care Reform
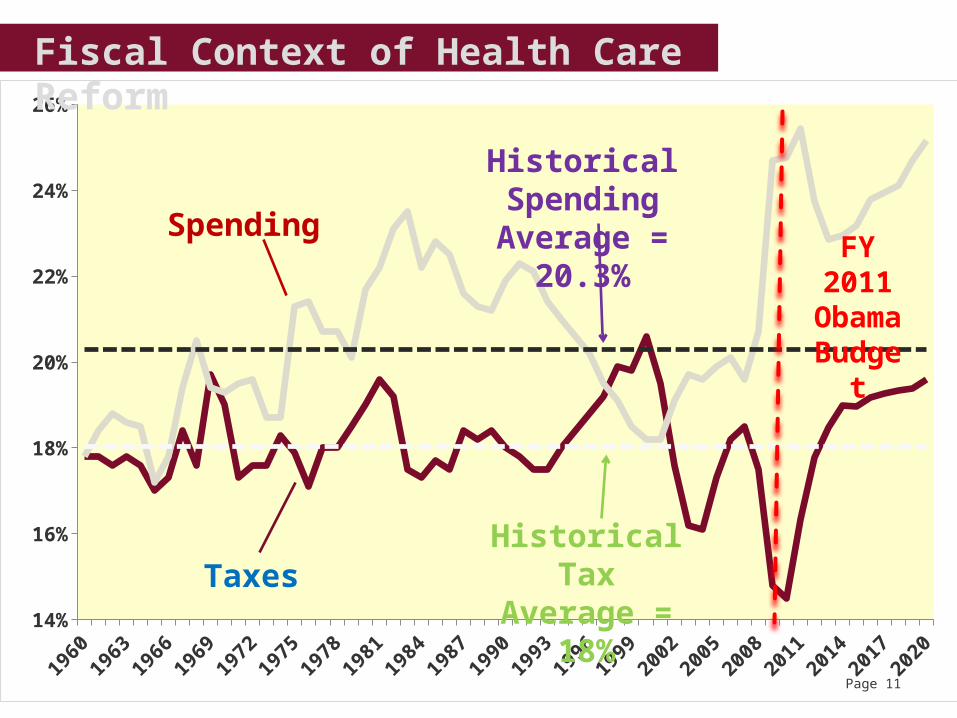
Page 1119
6019
6319
6619
6919
7219
7519
7819
8119
8419
8719
9019
9319
9619
9920
0220
0520
0820
1120
1420
1720
2014%
16%
18%
20%
22%
24%
26%
Fiscal Context of Health Care Reform
Spending
Taxes
Historical SpendingAverage = 20.3%
Historical TaxAverage = 18%
FY 2011ObamaBudget
Page 12
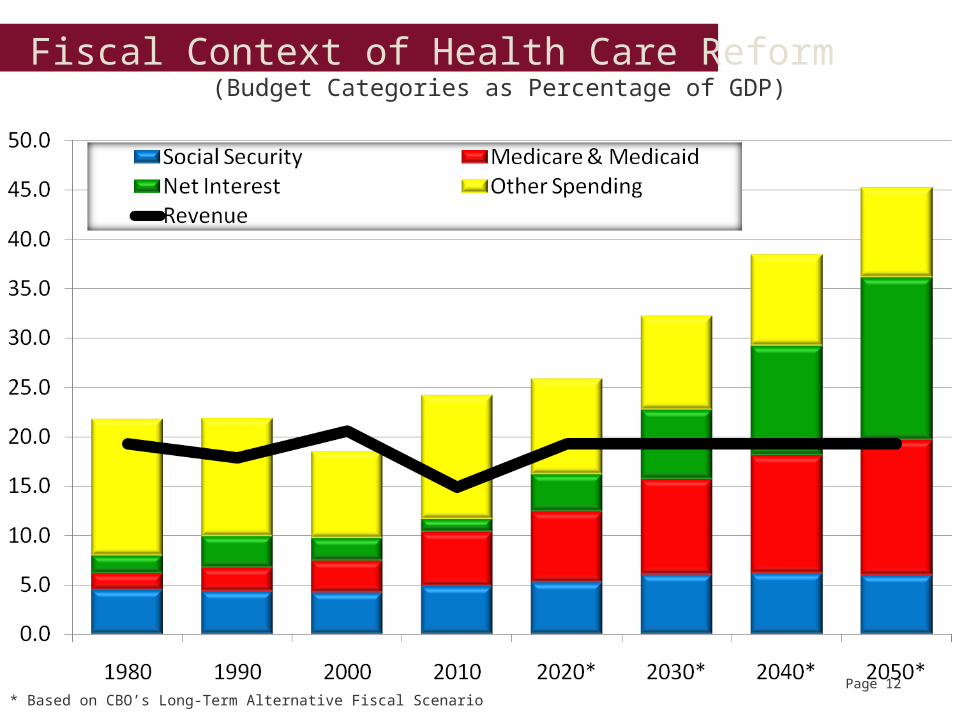
Fiscal Context of Health Care Reform(Budget Categories as Percentage of GDP)
* Based on CBO’s Long-Term Alternative Fiscal Scenario

Page 13
1941 1946 1951 1956 1961 1966 1971 1976 1981 1986 1991 1996 2001 2006 2011 2016 2021 2026 2031 2036 2041 20460.0%
50.0%
100.0%
150.0%
200.0%
250.0%
300.0%
350.0%
Tidal Wave of Debt(Debt Held by Public As Percentage of GDP)
Source: Office of Management and Budget / Congressional Budget Office
Deb
t Hel
d as
% o
f GD
P
Current Policy
World War II
2010
Historic Trend

Page 14
Fiscal Context of Health Care Reform
Publicly-Held Debt -- Obama Budget (CBO; $ Trillions)
$14.3
$16.4
$17.6
$18.9
$20.3
$15.3
$13.3
$12.5
$11.6
$5.8
$7.5
$9.2
$10.5
$0
$5
$10
$15
$20
2008 2009 2010 2011 2012 2013 2014 2015 2016 2017 2018 2019 2020
Fiscal Year
Pu
blic
ly H
eld
Deb
t ($
Tri
llio
ns)
Page 15
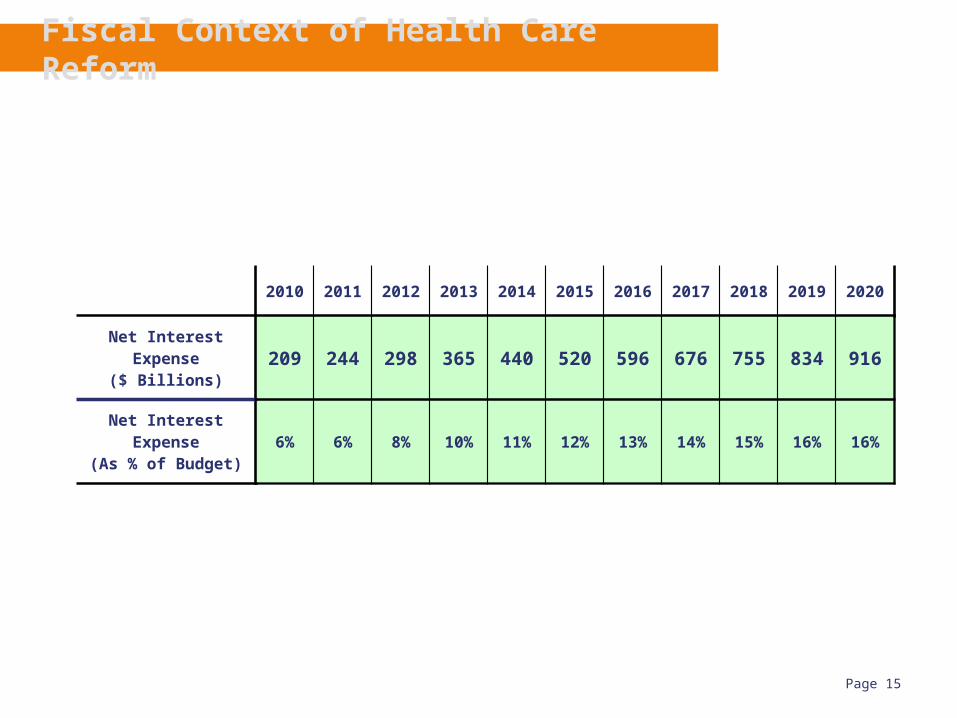
Fiscal Context of Health Care Reform
2010 2011 2012 2013 2014 2015 2016 2017 2018 2019 2020
Net Interest Expense($ Billions) 209 244 298 365 440 520 596 676 755 834 916
Net Interest Expense(As % of Budget)
6% 6% 8% 10% 11% 12% 13% 14% 15% 16% 16%

Page 16
States in Fiscal Crisis, Too

Page 17
Health Care Reform: Running the Numbers
“We have to pass the bill so that you
can find out what is in it.”
Speaker Nancy Pelosi (D-CA), March 9, 2010

Page 18
Now that health care reform has passed…
So…what is in it?
What does it do?
How much does it cost?
Where does the money come from?

Page 19
What does it do?
Expand health insurance coverage
83% of U.S. citizens have health insurance
17% do not
By 2019, Health Care Reform will raise the percentage of citizens with health insurance to 94%
An estimated 23.9 million people will still have no insurance
An estimated 20.2 million more people will be on Medicaid due to higher eligibility limits
An estimated 14.5 million more people will have private health insurance

Page 20
What does it do?
Implement insurance reforms
Establish a federal long term care insurance program, the “Community Living Assistance Services and Supports Act” (“CLASS Act”)
“Bend the cost curve” (?)

Page 21
What does it cost?
Disclaimer #1: Health care cost projections are notoriously difficult, and government estimates may prove dramatically off:
Estimated 1990 cost of Medicare (adjusted for inflation) when begun in 1966: $12 billion
Actual 1990 cost of Medicare: $107 billion
Disclaimer #2: Cost projections must assume that laws are implemented as written, no matter how unlikely that may be.
Page 22
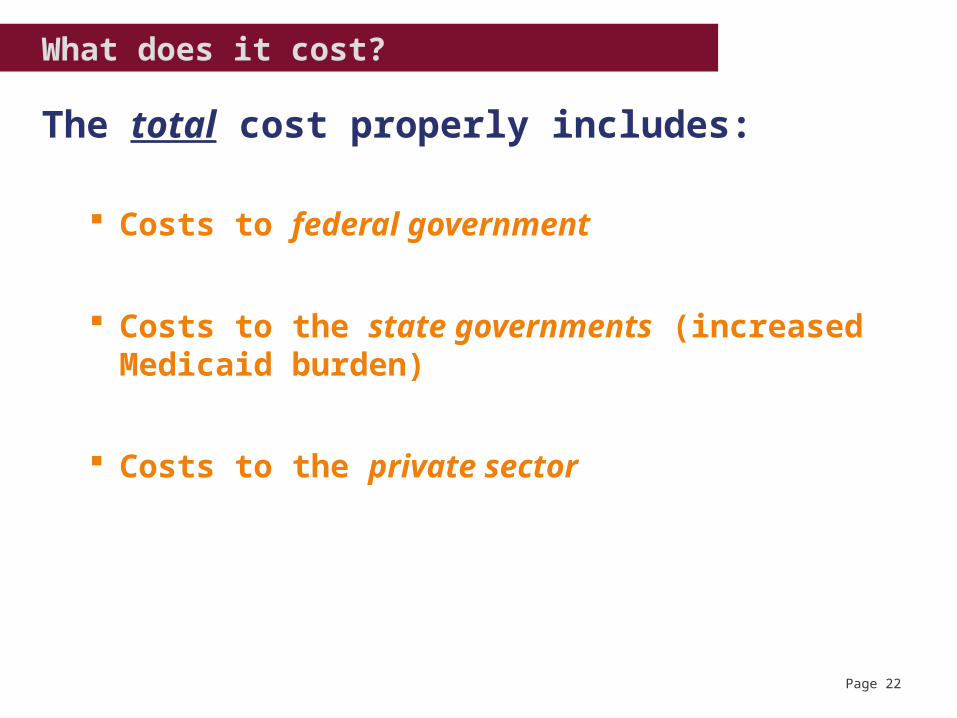
What does it cost?
The total cost properly includes:
Costs to federal government
Costs to the state governments (increased Medicaid burden)
Costs to the private sector

Page 23
What does it cost?
The Center for Medicare and Medicaid Services Actuary (“CMMS”) estimates that, by 2019, the expanded coverage provisions of Health Care Reform alone will cost the Federal Government $197 billion per year. The Congressional Budget Office (“CBO”) estimates the coverage costs at $214 billion per year by 2019.
CMMS estimates that, by 2019, Health Care Reform will add $88.8 billion to total health care spending (public and private) per year.
• Estimates assume projected savings in Medicare and provider reimbursements are achieved. CMMS estimates that Medicare savings, if implemented, would alone reduce national health expenditures by 2.4%, or $113 billion, in 2019. However, CMMS characterizes projected savings as “unrealistic” and “unsustainable”.

Page 24
Where does the money come from?
NOT from eliminating fraud and abuse
[W]e've estimated that most of this plan can be paid for by finding savings within the existing health care system, a system that is currently full of waste and abuse…. The only thing this plan would eliminate is the hundreds of billions of dollars in waste and fraud.”
President Obama, September 9, 2009
CBO projects no savings from “Health Care Fraud Enforcement” for Medicare, Medicaid, and CHIP programs of Health Care Reform
CBO, March 20, 2010
CMMS estimates that Health Care Reform provisions relating to “Fight waste, fraud, and abuse” would reduce Medicare outlays from 2010-2021 by a total of $4.9 billion, or approximately .05%.
CMMS 2010

Page 25
Where does the money come from?
1. Tax Increases
Annual additional tax revenues by 2019: $89 billion
High cost plan excise tax: $20 billion
Additional HI tax on individuals above $200,000 and couples above $250,000 (.9% on earned income and 2.8% on capital gains, dividends, and interest): $39 billion
Tax on health insurers: $12 billion
Miscellaneous (including penalties on employers and uninsured individuals): $18 billion

Page 26
Where does the money come from?
2. Medicare cost reductions
Annual Medicare savings by 2019: $113 billion Total Medicare savings 2010-2019: $575 billion
“Reduce Part A and Part B payment levels” and “adjust future ‘market basket’ payment updates”: $233 billion in projected savings
“Reduce Medicare Advantage payment benchmarks”: $145 billion in projected savings
“Implement Medicare Improvement Fund”: $27 billion in projected savings
“Implement Payment Advisory Board”: $24 billion in projected savings
Medicare costs do not include physician payment increases passed by Congress since enactment of Health Care Reform—increases almost certain to be extended at an estimated cost of $245 billion over 10 years
Page 27
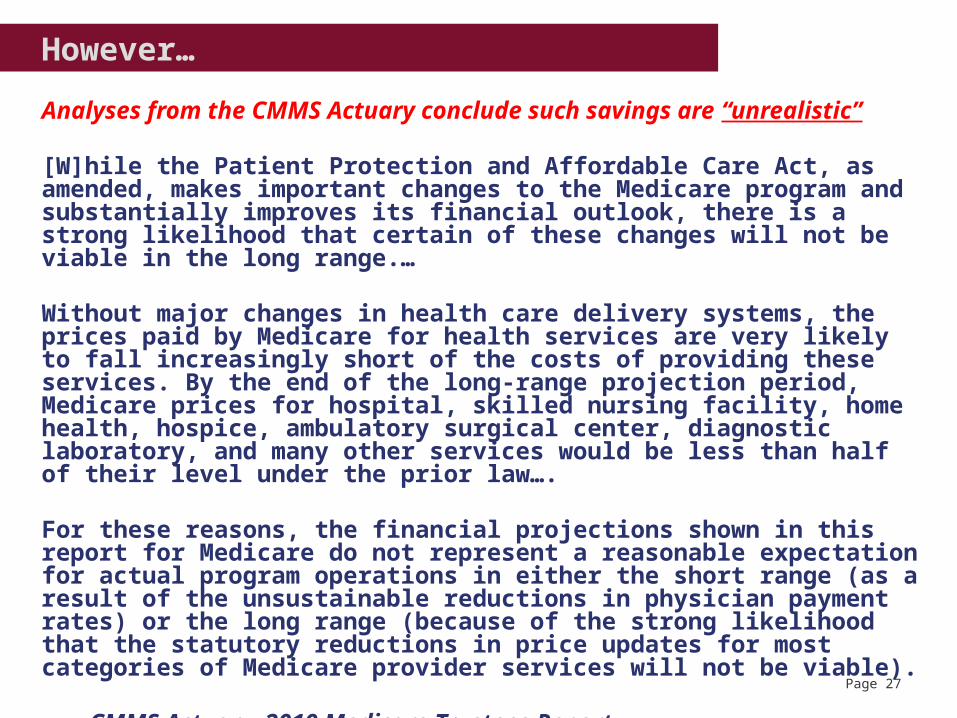
However…
Analyses from the CMMS Actuary conclude such savings are “unrealistic”
[W]hile the Patient Protection and Affordable Care Act, as amended, makes important changes to the Medicare program and substantially improves its financial outlook, there is a strong likelihood that certain of these changes will not be viable in the long range.…
Without major changes in health care delivery systems, the prices paid by Medicare for health services are very likely to fall increasingly short of the costs of providing these services. By the end of the long-range projection period, Medicare prices for hospital, skilled nursing facility, home health, hospice, ambulatory surgical center, diagnostic laboratory, and many other services would be less than half of their level under the prior law….
For these reasons, the financial projections shown in this report for Medicare do not represent a reasonable expectation for actual program operations in either the short range (as a result of the unsustainable reductions in physician payment rates) or the long range (because of the strong likelihood that the statutory reductions in price updates for most categories of Medicare provider services will not be viable).
CMMS Actuary, 2010 Medicare Trustees Report

Page 28
How unrealistic are the projected Medicare savings?
The 2010 Medicare Trustees Report projects long term Medicare expenditures to stay below 6 percent until 2050 and plateau at slightly over 6 percent of GDP thereafter.
The Medicare Actuary released an “Alternative Scenario” “based on more sustainable assumptions for physician and other Medicare price updates” that projects Medicare expenditures to reach 6 percent by 2030, 20 years earlier, and to continue to rise in later decades, reaching about 11 percent by 2080.

Page 29
CLASS Program (Long-Term Care Insurance)
CMMS Actuary “estimate[s] a net Federal savings for the CLASS Act program of $38 billion during the first nine years of operations—the first 5 of which are prior to the commencement of benefit payments.”
“[I]n 2025 and later, projected benefits exceed premium revenues, resulting in a net Federal cost in the longer term.”
“[T]here is a very serious risk that the problem of adverse selection will make the CLASS program unsustainable.”
Page 30
Impact of Health Care Reform
Impact of Health Care Reform on the Economy: “Bending the Cost Curve?”
Impact of Health Care Reform on Federal Budget Deficit
Impact of Health Care Reform on Medicare Costs, Revenues, and Solvency
Page 31
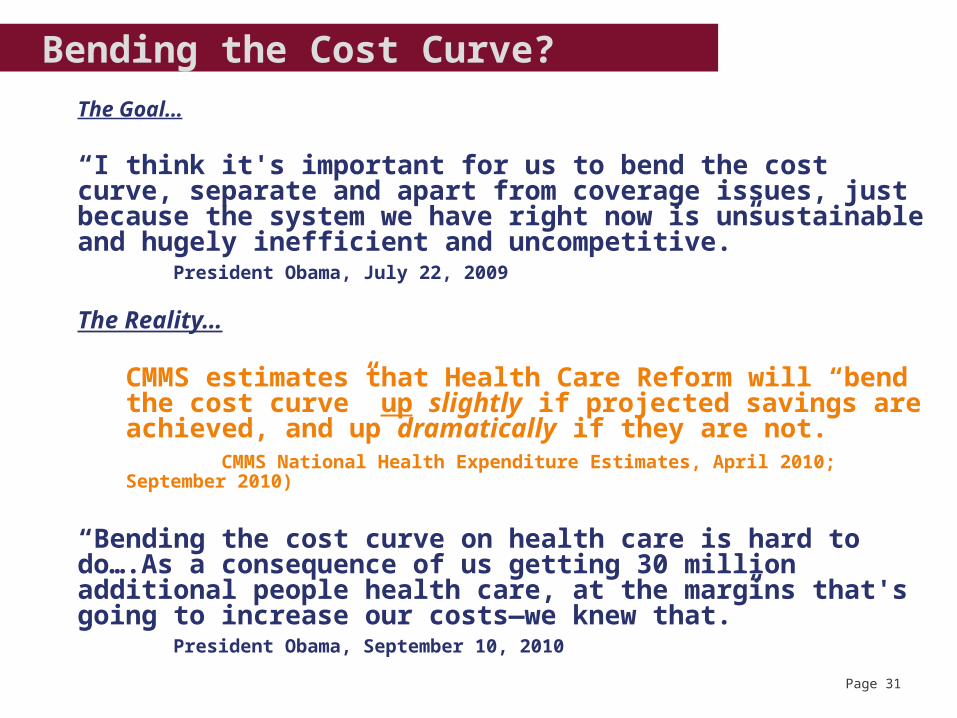
Bending the Cost Curve?
The Goal…
“I think it's important for us to bend the cost curve, separate and apart from coverage issues, just because the system we have right now is unsustainable and hugely inefficient and uncompetitive.”
President Obama, July 22, 2009
The Reality…
CMMS estimates that Health Care Reform will “bend the cost curve” up slightly if projected savings are achieved, and up dramatically if they are not.
CMMS National Health Expenditure Estimates, April 2010; September 2010)
“Bending the cost curve on health care is hard to do….As a consequence of us getting 30 million additional people health care, at the margins that's going to increase our costs—we knew that.”
President Obama, September 10, 2010

Page 32
Impact of Health Care Reform on Federal Budget Deficit
“I will not sign a plan that adds one dime to our deficits -- either now or in the future. (Applause.) I will not sign it if it adds one dime to the deficit, now or in the future, period.”
President Obama, Address to Joint Session of Congress, September 9, 2010

Page 33
Impact of Health Care Reform on Federal Budget Deficit
In March 2010, immediately prior to final passage of Health Care Reform, CBO estimated that the legislation would reduce the deficit by $124 billion from 2010-2019.
• CBO estimate assumed that the “unrealistic” projected savings will be realized.
• $245 billion physician fee “doc fix” removed from legislation to be passed separately
In May 2010, CBO identified $115 billion in costs not included in the prior estimate, and noted that figure did not include costs relating to “Explicit authorizations for a variety of grant and other program spending for which no specific funding levels are identified in the legislation.”
Page 34
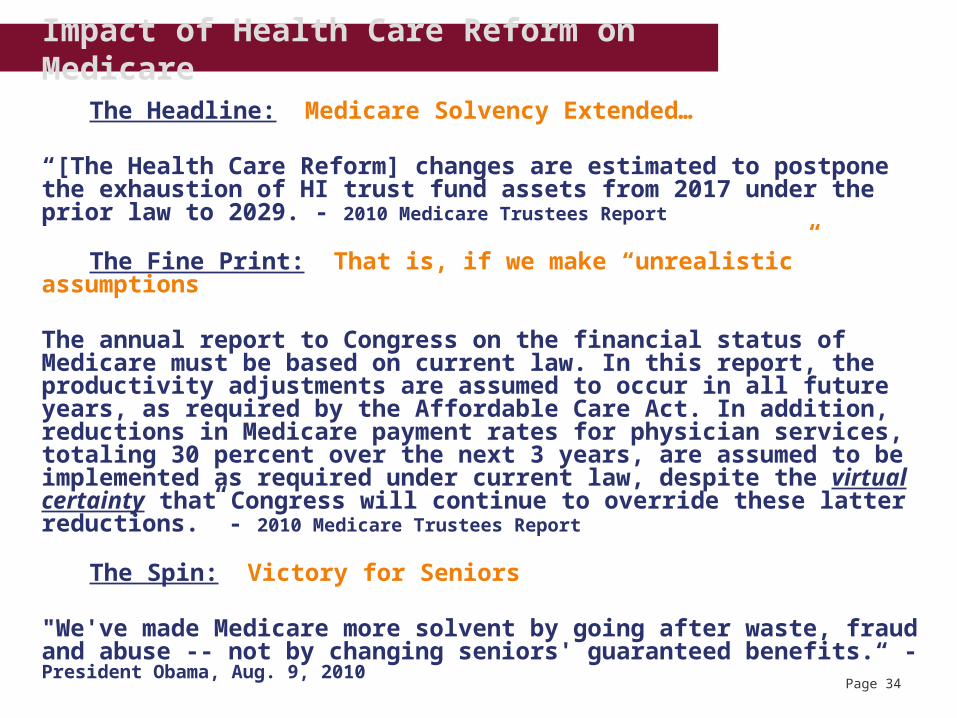
Impact of Health Care Reform on Medicare
The Headline: Medicare Solvency Extended…
“[The Health Care Reform] changes are estimated to postpone the exhaustion of HI trust fund assets from 2017 under the prior law to 2029. - 2010 Medicare Trustees Report
The Fine Print: That is, if we make “unrealistic” assumptions
The annual report to Congress on the financial status of Medicare must be based on current law. In this report, the productivity adjustments are assumed to occur in all future years, as required by the Affordable Care Act. In addition, reductions in Medicare payment rates for physician services, totaling 30 percent over the next 3 years, are assumed to be implemented as required under current law, despite the virtual certainty that Congress will continue to override these latter reductions.” - 2010 Medicare Trustees Report
The Spin: Victory for Seniors
"We've made Medicare more solvent by going after waste, fraud and abuse -- not by changing seniors' guaranteed benefits.“ - President Obama, Aug. 9, 2010

Page 35
Evolving Justifications for Health Care Reform
Conceived on the Campaign Trail as a way to expand coverage
Sold to the Public as critical health insurance reforms
Presented to Congress as a deficit reduction package
Justified in retrospect as _______________?